 Zihua Jiang
95% of researchers rate our articles as excellent or good
Learn more about the work of our research integrity team to safeguard the quality of each article we publish.
Find out more
BRIEF RESEARCH REPORT article
Front. Phys. , 21 June 2022
Sec. Interdisciplinary Physics
Volume 10 - 2022 | https://doi.org/10.3389/fphy.2022.819709
This article is part of the Research Topic Physics and Modelling of Landslides View all 10 articles
Water content has a significant effect on the creep properties of soil-rock mixtures (SRM). Multi-loading shear creep tests are carried out on SRM samples with different water contents. The test results show that deformation gradually increase with increasing water content, while long-term strength gradually decrease with increasing water content. The deformation mechanism shows that increasing of water content causes the change of rock particles at on the shear surface from fracture to rotation. Based on the creep test results, a modified Burgers model considering the water content is proposed by the empirical relationship between the parameters of the traditional Burgers model and the water content. And the results predicted by the modified Burgers model agree well quite well with the experimental creep data.
A large number of deposit landslides of soil-rock mixtures (SRM) exhibit the characteristics of long-term and creep deformation under the action of rainfall and other internal and external geological forces [1,2]. The creeping deposit landslide in the reservoir area is a threat to the long-term safe operation of power stations. Therefore, it is necessary to study on the creep characteristics and long-term stability of large-scale deposit landslides.
There have been many studies on the mechanical properties of SRM, mainly through laboratory tests[3,4], numerical simulations [5,6], and in-situ tests [7,8]. Furthermore, there are a number of studies on the creep properties of SRM strength [9,10], which were not considering the effect of water content on the creep properties of SRM. However, water content of SRM in the deposit landslide changes under the action of rainfall or reservoir water. Although there is a body of work which focused on the effect of rainfall and other environmental factors from remote sense observations and statistical modelling [11,12], the effect of creep behavior on the SRM in the deposit landslide evolutional process under different water contents is poorly understood.
In order to study the influence of water content on the characteristics of long-term deformations and stability of SRM, multi-stage shear creep tests of SRM samples with different water contents are conducted. The creep characteristics of SRM are analyzed, the long-term strengths of SRM with different water contents are obtained, and a modified Burgers model considering water content is developed based on the results of the shear creep test.
The Dahua landslide located on the right bank of Lancang River is a typical deposit landslide[13]. The main components of the landslide are a mixture of soil and rock debris. The filed displacement monitoring data show that the landslide is still in the creeping state and has the characteristics of time-dependent deformation. The density of the selected SRM is 2.2 g/cm3, the distribution of particle size is shown in Figure 1. The water contents of SRM samples are determined to be ranging from 3.9% to 16.4%.
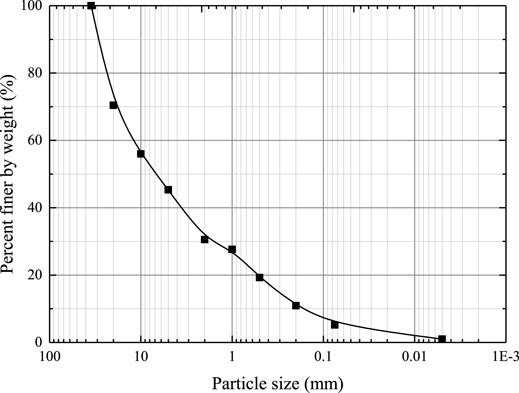
FIGURE 1. Particle size distribution of SRM.
Shear creep tests are conducted using a shear creep test system. The sample is a cube with a side length of 150 mm. Tests are conducted in the laboratory environment with constant temperature (20 ± 0.5°C) and humidity. Considering the depth of SRM at the sampling site, a normal pressure of 300 kPa is applied to represent the confining pressure at the sampling site. The shear stress loading scheme for the creep test is listed in Table 1. Procedure of shear creep test is as follows:
1. Place the sample into the test platform and adjust the initial setting of the LVDTs.
2. Apply the normal pressure to the desired value (300 kPa) under displacement-controlled conditions with a rate of 0.2 mm/min and keep it constant throughout the test.
3. Increase the shear stress to the desired value under displacement-controlled conditions with a rate of 0.2 mm/min and keep it for approximately 72 h.
4. Apply multiple shear stress loadings following the loading scheme in Table 1 until the sample fails.
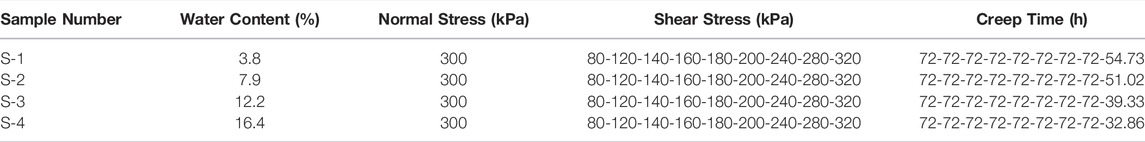
TABLE 1. Shear stress loading scheme for the creep test.
The multi-loading deformations of the samples with water contents of 3.8%, 7.9%, 12.2%, and 16.4% are presented in Figure 2. It can be seen that shear creep deformations are observed from all SRM samples. For the same shear stress, the higher the water contents, the greater the creep deformation. Taking shear stress of 80 kPa as an example, the strains after stabilization of the SRM samples with water contents of 3.8%, 7.9%, 12.2%, and 16.4% are 2.14%, 3.52%, 4.25%, and 5.08%, respectively. The presence of water has a significant softening effect on SRM, weakening the mechanical properties of SRM and increasing the SRM deformability [14].
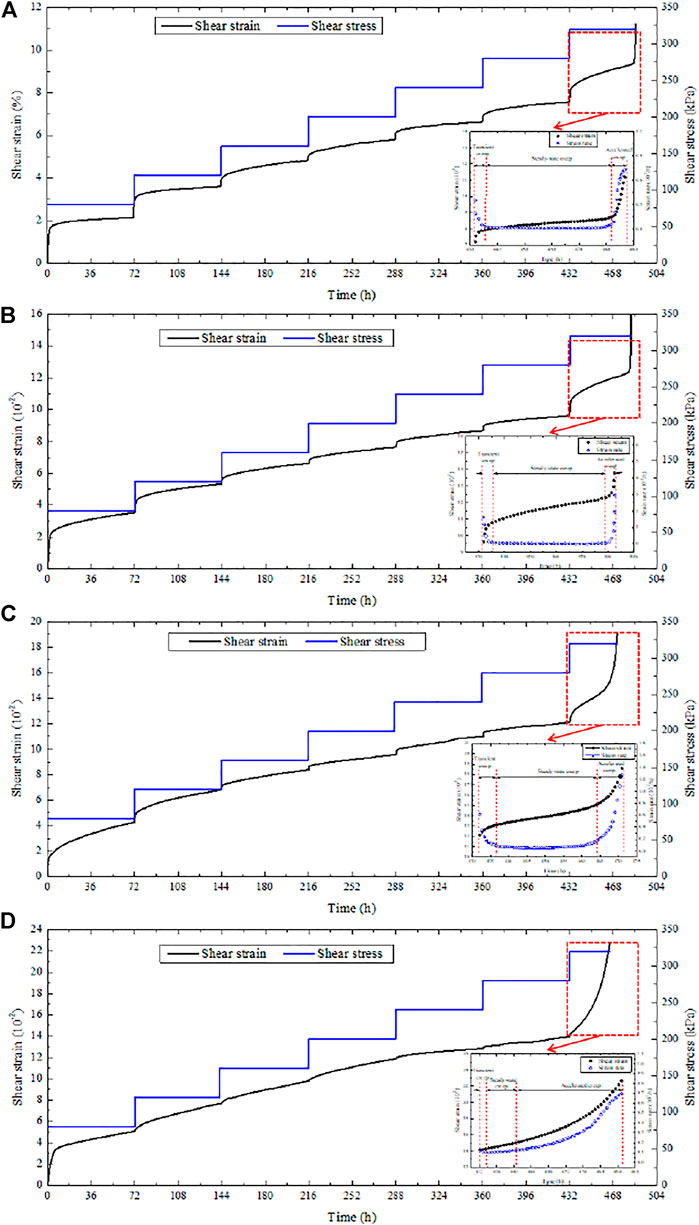
FIGURE 2. Shear creep of samples with different water contents (A) 3.8%, (B) 7.9%, (C) 12.2%, and (D) 16.4%.
It is also seen that the creep deformation of SRM experiences three creep stages: transient creep, steady-state creep, and accelerated creep. Instantaneous deformation occurs at the beginning of each loading process. The higher water content, the greater instantaneous deformation. The strain then remains constant in the steady-state creep stage. Before the final shear stress level, the SRM undergoes the transient creep and steady-state creep stages. In the transient creep, the strain rate is relatively high but decreases with time, showing that strain rate approaches a fixed value. Accelerated creep occurs at the final shear stress level.
The shear strain and strain-rate versus time at the final shear stress level are shown in Figure 2. Compared to the results of preceding stress levels, the transient creep stage at the final stress level is less apparent. During this stage, the strain-rate decreases rapidly in a very short time, then remains almost constant, and finally increases rapidly. The final stress levels of SRM samples with four levels of water content are maintained for 54.73, 51.02, 39.33, and 32.86 h, respectively. The higher the water content, the longer the duration of the accelerated creep.
The isochronic curve method is an effective method to determine the long-term strength [15,16]. The isochronic curves are drawn by the following method:
• Draw the shear creep strain versus time under various loading conditions according to the Boltzmann linear superposition principle.
• Select a series of time points in the creep curves under different shear stresses. Draw vertical lines at the selected time instances, which intersect the creep strain curves to give a series of shear stress and strain values. The shear strains are then plotted versus the shear stresses.
The isochronous curves are shown in Figure 3. The shear stress corresponding to the inflection point on the isochronous curve is considered to be the long-term strength [16]. Furthermore, inflection point may not be unique [17]. When there are two inflection points in an isochronous stress-strain curve, the shear stress value corresponding to the second inflection point is considered to be long-term strength. That is because, within a period of time after the second inflection point, the sample will be more likely to fail. From Figure 3, the long-term strengths of the four SRM samples are approximately 280, 266, 240, and 220 kPa, respectively, which show a trend of decrease with the increase of water content.
FIGURE 3. Isochronous curves with different water contents (A) 3.8%, (B) 7.9%, (C) 12.2%, and (D) 16.4%.
A modified Burgers model, which considers the effect of water content but not the accelerated creep phase, is developed.
A Burgers model consists of a Kelvin model and a Maxwell model in series [17]. It is capable of describing the characteristics in the attenuation and steady-state creep stages of SRM.
The total creep strain ε of a Burgers model consists of the instantaneous elastic strain ε1 corresponding to the spring in Maxwell model, the constant velocity strain ε2 corresponding to the viscous damper in Maxwell model, and the creep strain ε3 corresponding to the Kelvin model:
In a shear creep test, for each fixed shear stress τ, Eq. 1 can be rewritten as
where
Parameters in the Burgers model of Eq. 2 can be determined from regression analysis by fitting the creep process curves. Results for the case with water content of 3.8% are listed in Table 2.
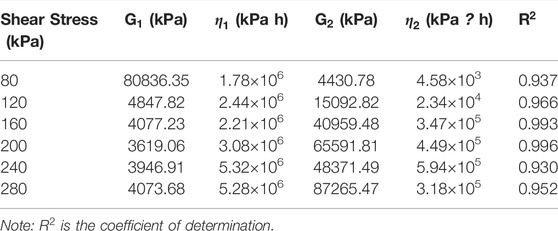
TABLE 2. Parameters of the Burgers model.
Having obtained the four parameters G1, η1, G2, and η2 of the Burgers model given by Eq. 2, the relationships between these model parameters and water content are shown in Figure 4. It can be seen that parameters G1, η1 and the water content follow an exponential relationship, whereas parameters G2, η2 and the water content follow a parabolic relationship. Regression analysis is performed to obtain the following empirical relationships between the four parameters and the water content. Substituting Eq. 3 into Eq. 2, the Burgers model considering the effect of water content can be obtained.
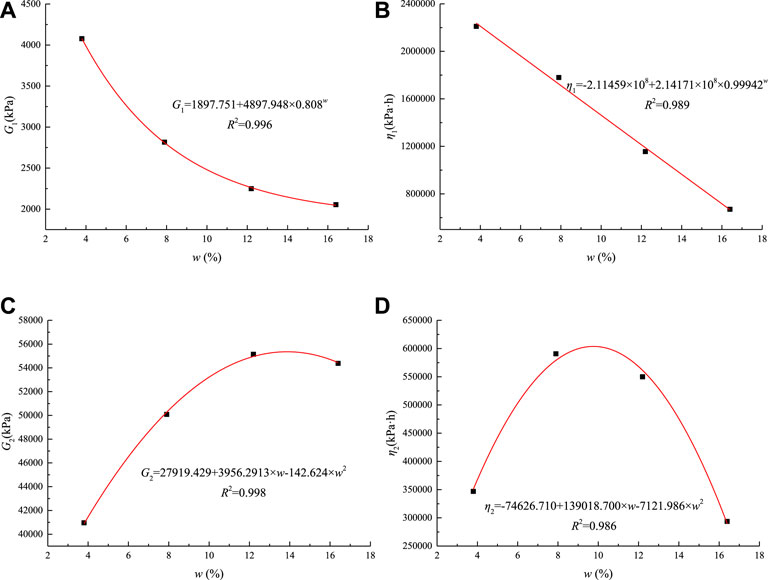
FIGURE 4. Correlation between model parameters and water content.
In order to verify the accuracy of the proposed Burgers model, the model is applied to predict the shear creep curves of SRM and the results are shown in Figure 5. As can be seen, the results obtained using the Burgers creep model agree very well with the shear creep test data.
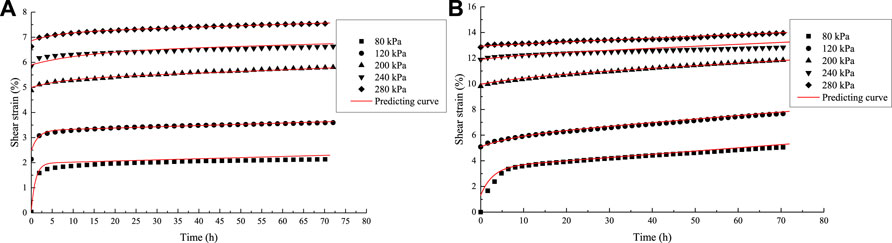
FIGURE 5. Prediction results of the Burgers model (A) w = 3.8%, (B) w = 16.4%.
There are mainly two mechanisms affecting the shear deformations of SRM:
1. Rock particles continue to rotate and shift with time under the action of the shear load (Figure 6A). In this case, rock particles on the shear surface will rotate and squeeze the surrounding soil particles under the action of the shear stress;
2. Rock particles, especially the flake rock particles on the shear surface, undergo time-related fatigue fracture under the continuous application of loading (Figure 6B).
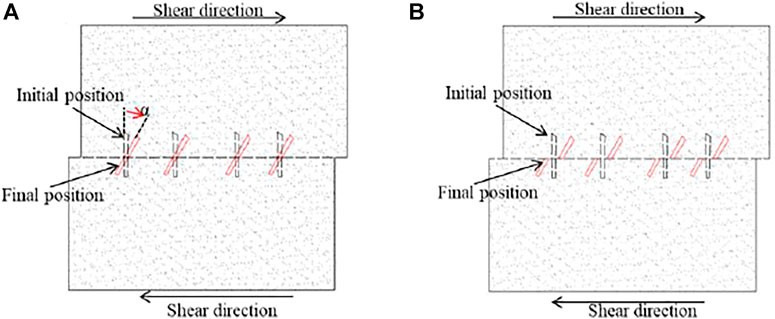
FIGURE 6. Schematic diagram of deformation mechanisms (A) low water content, (B) high water content.
In the shear creep tests, it is observed that many of the flake rock particles on the shear surface are fractured in SRM sample with low water content, as shown in Figure 7A. Rock particles rotate with time under the action of shear stress in SRM sample with high water content, as shown in Figure 7D. In shear creep test of SRM, the deformation of the SRM is contributed by both deformation mechanisms. Mechanism one can affect the creep properties of soil at high and low shear stress values, while Mechanism 2 characterizes the creep deformation of SRM with low water content. Similar phenomena are also observed by Hu et al. [9] and Wei et al. [19]. Discrete element method could resolve the motion of every single grain in the system under consideration of a model for the inter-particle forces [20–22]. Therefore, focusing on particle-based simulations of the processes that are investigated in our experiments is necessary in future work [23].
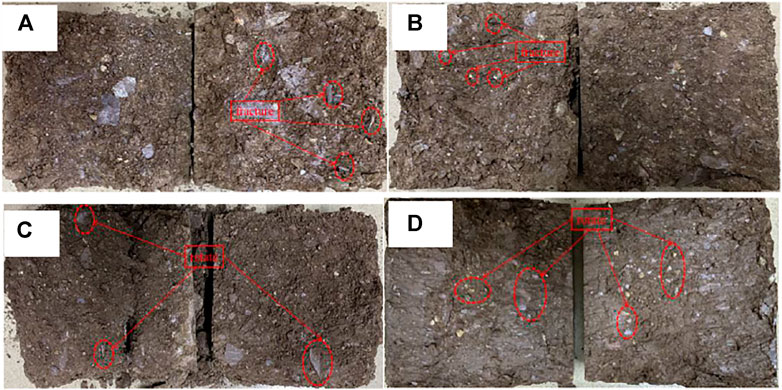
FIGURE 7. Deformation characteristics of SRM samples (A) w = 3.9%, (B) w = 7.8%, (C) w = 12.2%, (D) w = 16.4%.
Multi-loading shear creep tests are performed on SRM samples obtained from the Dahua landslide with different water contents. Based on the test results, the following conclusions can be drawn:
1) There are three stages of creep deformation in a shear creep test of SRM including transient creep, steady-state creep, and accelerated creep. The shear strain accumulated after stabilization increases with water content under the same shear stress.
2) The long-term strength of SRM can be obtained using the isochronous curve method. The long-term strength of SRM decreases with the increase of water content.
3) Based on the results of the shear creep tests, a modified Burgers model is proposed, which takes into account of the effect of water content on the creep behavior of SRM. The creep curves of SRM with different water contents predicted using the Burgers model developed agree well with the test data.
4) Shear creep deformation is dominated by fractures of large particles at low water content, but by rotations of large particles at high water content.
The raw data supporting the conclusions of this article will be made available by the authors, without undue reservation.
All authors listed have made a substantial, direct, and intellectual contribution to the work and approved it for publication.
Financial supports from the National Key R&D Program of China (2017YFC1501100), the National Natural Science Foundation of China (Grant Nos. 11772116), and the Qinglan project are gratefully acknowledged.
The authors declare that the research was conducted in the absence of any commercial or financial relationships that could be construed as a potential conflict of interest.
All claims expressed in this article are solely those of the authors and do not necessarily represent those of their affiliated organizations, or those of the publisher, the editors and the reviewers. Any product that may be evaluated in this article, or claim that may be made by its manufacturer, is not guaranteed or endorsed by the publisher.
1. Pánek T, Klimeš J. Temporal Behavior of Deep-Seated Gravitational Slope Deformations: A Review. Earth-Science Rev (2016) 156:14–38. doi:10.1016/j.earscirev.2016.02.007
2. Kang Y, Lu Z, Zhao C, Xu Y, Kim J-w., Gallegos AJ. InSAR Monitoring of Creeping Landslides in Mountainous Regions: A Case Study in Eldorado National Forest, California. Remote Sensing Environ (2021) 258:112400. doi:10.1016/j.rse.2021.112400
3. Liu SQ, Hong BN, Cheng T, Liu X. Models to Predict the Elastic Parameters of Soil-Rock Mixture. J Food Agric Environ (2013) 11(2):1272–6.
4. Huang S, Ding X, Zhang Y, Cheng W. Triaxial Test and Mechanical Analysis of Rock-Soil Aggregate Sampled from Natural Sliding Mass. Adv Mater Sci Eng (2015) 2015:1–14. doi:10.1155/2015/238095
5. Xu W-J, Wang S, Zhang H-Y, Zhang Z-L. Discrete Element Modelling of a Soil-Rock Mixture Used in an Embankment Dam. Int J Rock Mech Mining Sci (2016) 86:141–56. doi:10.1016/j.ijrmms.2016.04.004
6. Wang H, Sha C, Xu W, Meng Q. Research on Strength of Soil-Rock Mixture Based on Particle Discrete Element Method. China Civil Eng J (2020) 53:106–14. doi:10.15951/j.tmgcxb.2020.09.012
7. Xu W-J, Hu R-L, Tan R-J. Some Geomechanical Properties of Soil-Rock Mixtures in the Hutiao Gorge Area, China. Géotechnique (2007) 57:255–64. doi:10.1680/geot.2007.57.3.255
8. Zhang Z-L, Xu W-J, Xia W, Zhang H-Y. Large-scale In-Situ Test for Mechanical Characterization of Soil-Rock Mixture Used in an Embankment Dam. Int J Rock Mech Mining Sci (2016) 86:317–22. doi:10.1016/j.ijrmms.2015.04.001
9. Hu X, Sun M, Tang H, Xie N, Guo J. Creep Tests of Gravel-Soil of Majiagou Landslide in Three Gorges Reservoir Area. Rock Soil Mech (2014) 35(11):3163–9+3190. doi:10.16285/j.rsm.2014.11.028
10. Guo H, Guo R, Nan Y, Zhang P, Liu K. Burgers Model of Creep Properties of Colluvial Soil-Rock Mixture. Acta Scientiarum Naturalium Universitatis Sunyatseni (2020) 59:64–69. doi:10.13471/j.cnki.acta.snus.2020.05.13.2020d019
11. Abraham MT, Satyam N, Lokesh R, Pradhan B, Alamri A. Factors Affecting Landslide Susceptibility Mapping: Assessing the Influence of Different Machine Learning Approaches, Sampling Strategies and Data Splitting. Land (2021) 10:989. doi:10.3390/land10090989
12. Rafiei Sardooi E, Azareh A, Mesbahzadeh T, Soleimani Sardoo F, Parteli EJR, Pradhan B. A Hybrid Model Using Data Mining and Multi-Criteria Decision-Making Methods for Landslide Risk Mapping at Golestan Province, Iran. Environ Earth Sci (2021) 80:1–25. doi:10.1007/s12665-021-09788-z
13. Jiang Z, Wang H, Xie W. Deformation Mechanism of deposit Landslide Induced by Fluctuations of Reservoir Water Level Based on Physical Model Tests. Environ Earth Sci (2021) 80:1–13. doi:10.1007/s12665-021-09673-9
14. Wang H, Sun G, Sui T. Landslide Mechanism of Waste Rock Dump on a Soft Gently Dipping Foundation: a Case Study in China. Environ Earth Sci (2021) 80:1–10. doi:10.1007/s12665-021-09407-x
15. Tang H, Li H, Duan Z, Liu C, Wu G, Luo J. Direct Shear Creep Characteristics and Microstructure of Fiber-Reinforced Soil. Adv Civil Eng (2021) 2021:1–12. doi:10.1155/2021/8836293
16. Wang X, Wang J, Zhan H, Li P, Qiu H, Hu S. Moisture Content Effect on the Creep Behavior of Loess for the Catastrophic Baqiao Landslide. Catena (2020) 187:104371. doi:10.1016/j.catena.2019.104371
17. Yao W, Hu B, Zhan H, Ma C, Zhao N. A Novel Unsteady Fractal Derivative Creep Model for Soft Interlayers with Varying Water Contents. KSCE J Civ Eng (2019) 23:5064–75. doi:10.1007/s12205-019-1820-5
18. Mansouri H, Ajalloeian R. Mechanical Behavior of Salt Rock under Uniaxial Compression and Creep Tests. Int J Rock Mech Mining Sci (2018) 110:19–27. doi:10.1016/j.ijrmms.2018.07.006
19. Wei H, Xu W, Xu X, Meng Q-S, Wei C-F. Mechanical Properties of Strongly Weathered Rock – Soil Mixtures with Different Rock Block Contents. Int J Geomechanics (2018) 18:1–12. doi:10.1061/(ASCE)GM.1943-5622.0001131
20. Gladkyy A, Schwarze R. Comparison of Different Capillary Bridge Models for Application in the Discrete Element Method. Granular Matter (2014) 16:911–20. doi:10.1007/s10035-014-0527-z
21. Zhang Y, Shao J, Liu Z, Shi C, De Saxcé G. Effects of Confining Pressure and Loading Path on Deformation and Strength of Cohesive Granular Materials: a Three-Dimensional DEM Analysis. Acta Geotech. (2019) 14:443–60. doi:10.1007/s11440-018-0671-4
22. Elekes F, Parteli EJR. An Expression for the Angle of Repose of Dry Cohesive Granular Materials on Earth and in Planetary Environments. Proc Natl Acad Sci U.S.A (2021) 118, e2107965118. doi:10.1073/pnas.2107965118
Keywords: deposit landslide, soil-rock mixture, moisture content, time-dependent deformation, creep constitutive model, long-term strength
Citation: Jiang Z and Wang H (2022) Study on Shear Creep Characteristics and Creep Model of Soil-Rock Mixture Considering the Influence of Water Content. Front. Phys. 10:819709. doi: 10.3389/fphy.2022.819709
Received: 22 November 2021; Accepted: 01 June 2022;
Published: 21 June 2022.
Edited by:
Eric Josef Ribeiro Parteli, University of Duisburg-Essen, GermanyReviewed by:
Bei Han, Beijing University of Technology, ChinaCopyright © 2022 Jiang and Wang. This is an open-access article distributed under the terms of the Creative Commons Attribution License (CC BY). The use, distribution or reproduction in other forums is permitted, provided the original author(s) and the copyright owner(s) are credited and that the original publication in this journal is cited, in accordance with accepted academic practice. No use, distribution or reproduction is permitted which does not comply with these terms.
*Correspondence: Huanling Wang, wanghuanling@hhu.edu.cn
Disclaimer: All claims expressed in this article are solely those of the authors and do not necessarily represent those of their affiliated organizations, or those of the publisher, the editors and the reviewers. Any product that may be evaluated in this article or claim that may be made by its manufacturer is not guaranteed or endorsed by the publisher.
Research integrity at Frontiers
Learn more about the work of our research integrity team to safeguard the quality of each article we publish.