 Song Eu
1
Song Eu
1
 Sangjun Im
2*
Sangjun Im
2*- 1 Division of Forest Fire and Landslide, Department of Forest Environment and Conservation, National Institute of Forest Science, Seoul, South Korea
- 2 Department of Agriculture, Forestry and Bioresources, Research Institute of Agriculture and Life Sciences, Seoul National University, Seoul, South Korea
Small check dams are widely used in the Republic of Korea to mitigate and prevent sediment-driven damages by mountain torrents. This study aimed to quantify the combined effects of debris-flow impact forces and earth pressures from dam sedimentations on the structural stability of a dam by incorporating the change in the longitudinal profile of the channel bed owing to sediment deposition. A debris-flow simulation model (Hyper Kanako) was used to reproduce the debris-flow behavior from the 2011 Mt. Umyeon landslide (Seoul, The Republic of Korea). Finite element analysis was conducted to analyze the structural stability of the check dam under various debris discharge and sedimentation scenarios. The magnitudes of impact forces that were exerted on the check dam ranged from 81.76 kPa under a non-deposition scenario to 123.04 kPa under a 100% deposition scenario. The resultant tensile and compressive stresses were found to be up to 0.80 and 0.35 MPa, respectively, which were lower than the maximum allowable strengths of the dam, securing sufficient strength for the dam stability. Overall, the proposed approach can be applied to obtain a better understanding of the resultant internal stresses experienced during debris flow and sediment deposition, thereby providing valuable information for the structural analysis and safety assessment of check dams.
1 Introduction
Debris flows, which are fast-flowing and sediment-laden flows, represent a severe geological hazard that occur in mountain streams worldwide. In the Republic of Korea, sediment-related disasters can occasionally occur in high-gradient mountain streams, which cause catastrophic consequences and thereby, threatening people living in downstream regions (Chae et al., 2017). Sediment-related hazards can usually be managed by the establishment of sediment-retaining structures in the upper or intermediate reaches of the stream of interest. In terms of torrent control structures, check dams are basic transversal structures that effectively control the sediment and debris discharges of mountain torrents over long periods of time (Hübl and Fiebiger, 2005; Marchelli and De Biagi, 2019). Dams perform an additional function of stabilizing a channel by trapping coarse sediment particles and weakening the longitudinal gradient of streams (Seo et al., 2016; Bernard et al., 2019).
Check dams require special consideration from the perspective of structural stability to be implemented successfully in steep terrains. According to previous studies of geomorphic changes around check dams (Victoriano et al., 2018; Cucchiaro et al., 2019a; Cucchiaro et al., 2019b), inadequate design of check dams can accelerate stream erosion, especially around the foundations and wings of the dams, and can result in long-term instability of debris flow barrier structures. Thus, forest engineers or professionals should consider sliding and overturning failure modes in the stability assessment of check dams (Hübl et al., 2009).
Additionally, a certain level of safety in check dams is necessitated in their response to the external forces exerted by the direct impact of debris flows. However, check dams often experience structural failure or damage as a result of fast debris flows accompanied by large stones, as highlighted by Baggio and D’agostino (2022). Therefore, check dams must be designed to endure high impact forces from debris flows (Chen et al., 2019).
Engineering concerns regarding the impact of debris flows on structural design of check dams have increasingly attracted the attention of researchers over recent decades (Hungr et al., 1984; Hübl and Holzinger, 2003; Chen et al., 2019). Many studies have been conducted to elucidate the dynamic interaction between debris flows and check dams, including flow dynamics and corresponding impact-force studies using real-time observations (Hu et al., 2011) or flume experiments (Hübl and Holzinger, 2003; Scheidl et al., 2013; Rossi and Armanini, 2019; Sanvitale et al., 2021).
Some countries, such as Japan, Austria, and Hong Kong, have formulated technical guidelines on considering the impact force of debris flows in engineering design. Austria has established a simple design method (ONR 24801 and 24802) that accounts for the impact force, which is empirically derived from the debris-flow velocity and its density (Huebl et al., 2017). Japan (NILIM, 2016a) considered both overflow and non-overflow conditions in dam designing and proposed check criteria for the potential of sliding failure due to internal and external forces, which are exerted by hydrostatic pressure, earth pressure, and debris-flow impact force. Similarly, Hong Kong (Kwan, 2012) evaluated structural stability against sliding, overturning, and distress failure. Hong Kong regulations imply that the lateral earth pressure, derived from sediment deposition, is regarded as an additional external force in the stability analysis. However, the influence of debris flows on dam stability in the Republic of Korea is poorly understood.
Japan (NILIM, 2016a) and Austria (Huebl et al., 2017) have used empirical approaches to reflect the influence of debris flows, which provide efficient solutions for robust check-dam designs. Hong Kong (Kwan, 2012) used numerical models to simulate flow behavior and quantified impact forces based on the simulated flow characteristics. The maximum stress, driven by debris-flow impact, represents an essential variable for dam stability. Notably, the maximum stress varies because the location of debris collisions can change with ongoing sediment deposition. Moreover, changing spatiotemporal patterns of sedimentation hamper the accurate estimation of the location and magnitude of the maximum stress, which are often induced by debris flows over the lifespan of the dam.
Various numerical approaches have been applied previously to examine the structural behavior of debris-flow barriers under different external forces (Bernard et al., 2019; Chen et al., 2019; Song et al., 2019; Wendeler et al., 2019; Leonardi and Pirulli, 2020; Brighenti et al., 2021). Recently, finite element analysis has been applied to estimate changes in sediment discharge and deposition near check dams by examining debris-flow behavior (Law et al., 2016; Shen et al., 2020). Chen et al. (2019) conducted a study on dam stability by analyzing the collapse of a dam, given that the structural displacement was caused by a debris flow. However, their analysis did not examine the stability of individual dams and only focused on determining the most suitable location and number of dams. Bernard et al. (2019) used hydraulic analysis to quantify the influence of debris-flow discharge and its corresponding impact force on an open-type check dam. They analyzed the debris-flow impact force on the fins of a check dam, but the structural behavior of the check dam was rarely discussed in terms of variable debris-flow discharges.
Meanwhile, closed-type check dams are characterized by a higher risk of damage when subjected to unplanned external forces compared to open-type structures; such forces are inflicted by debris-flow impact and sedimentation (Mizuyama, 1979). Owing to this, an accurate design of check dams requires a precise investigation of the distribution and magnitude of potential internal stresses in the context of debris-flow behavior and sediment deposition conditions.
This study examined the structural stability of check dams, subjected to external forces that were induced by debris flows and lateral earth pressure from sediment deposition. To this end, a debris-flow simulation model (Hyper Kanako) was used to reproduce the debris-flow behavior in the 2011 Mt. Umyeon landslide (Seoul, The Republic of Korea). To pursue the main aim of the study, we 1) incorporated the impact force, derived from the hydraulic characteristics of the simulated debris flow, and 2) analyzed the dam stability using different sedimentation scenarios.
2 Materials and Methods
2.1 Study Site
Before assessing the stability of the check dam, we simulated the debris flow in the Hyoungchon watershed of Mt. Umyeon (Seoul, the Republic of Korea), as shown in Figure 1. The area of the analyzed watershed was 34.1 ha, while the main channel was approximately 663 m long with an inclination of 13.6° of the mean longitudinal slope (SMG, 2012). A fatal debris-flow event occurred on 27 July 2011, in Mt. Umyeon and its surrounding areas, resulting in 17 fatalities and causing extensive damage, including mud flooding and the collapse of houses.
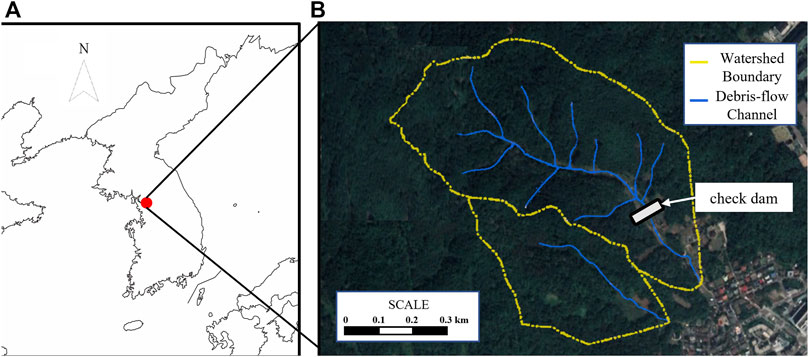
FIGURE 1. (A) Location of the Hyoungchon watershed. (B) Boundary (yellow line) and debris flow channel (blue line) network of the watershed. The gray block in the downstream region is the check dam analyzed in this study.
A field investigation shortly after this 2011 event revealed that the debris flow in the watershed was a runoff-generated debris flow, the type of which was reported by Imaizumi et al. (2006) and Coe et al. (2008). It was initiated by surface runoff, which caused the erosion of soil materials on a steep slope at the uppermost part of the channel (SMG, 2012). The eroded soil mixtures were transported down steep channels and entrained sediments in the channel bed. The initiation process is similar to that of runoff-generated debris flow reported by Simoni et al. (2020). Approximately 3,800 m3 of sediment was discharged from eroded slopes in the source area and several tributary branches. After the debris-flow disaster, various countermeasures, including a series of check dams, were implemented to protect steep streams and unstable hillslopes from subsequent rainfall.
2.2 Debris-Flow Simulation
2.2.1 Debris-Flow Simulator
An accurate debris-flow simulation is essential for quantifying debris-flow behavior and for assessing its influence on structural stability with countermeasures designed in areas prone to sediment-related disasters. The debris-flow event in the Hyoungchon watershed in 2011 was quantitatively reproduced using a debris-flow simulation model. Although various models have been developed, Hyper Kanako (Horiuchi et al., 2012) was utilized in this study to simulate the debris-flow behavior. Kanako, initially developed in Japan, is a physical-based one-dimensional computational model that evaluates the influence of engineering structures on debris-flow propagation with a graphical user interface (GUI) (Nakatani et al., 2008). The updated release of Kanako, Hyper Kanako, embeds an integrated system with one- and two-dimensional (2-D) models to simulate debris flows with a GUI in a geographic information system (Uchida et al., 2013).
Kanako simulates debris-flow propagation in a channel and deposition forming an alluvial fan by using the mass and momentum conservation and entrainment rates. Notably, Kanako is advantageous because it can simulate the flow characteristics of a debris flow, which are affected by the installation of check dams (Nakatani et al., 2008; Nakatani, 2010). The model is fundamentally based on the following governing equations: the continuity equation (see Eq. 1), the mass conservation equation of sediment concentration (Eq. 2), the momentum conservation equation in the x-(Eq. 3) and y-directions (Eq. 4), and the entrainment sub-model (Eq. 5). The expressions for each equation in the 2-D simulations are shown below:
where h is the flow depth, z is the height of the channel bed, H is the flow elevation (h + z), C is the volumetric sediment concentration, t is time, g is the gravitational acceleration, and ρ is the density of the interstitial fluids comprising the debris flow. u is the flow velocity in the flow direction, denoted as x, and v is the flow velocity in the lateral direction, represented by y.
The component i in Eq. 5 reflects the entrainment rate, proposed by Takahashi and Nakagawa (1991). They assumed that the entrainment of debris flows was mainly governed by sediment concentration and mobility, and the empirical formula for the entrainment was derived through a flume experiment; δ d and δ e are empirically derived coefficients of deposition and erosion, respectively.
C * is the sediment concentration in the movable bed layer, and C ∞ is the equilibrium sediment concentration of the debris flow on the current channel slope, determined by Eq. 6:
where ϕ is the internal friction angle, and the range of C ∞ is 0.3 ≤ C ∞ ≤ 0.9C *.
The rheological terms, τ x and τ y , reflect the shear stress that acts on the channel bed in the respective direction based on the dilatant model, introduced by Takahashi and Nakagawa (1991). The dilatant model, commonly used for stony debris flows where shear stress is dominated by the inertial grain stress (Takahashi, 2014), stipulates that the dissipation of kinetic energy, expressed as the shear stress, is dramatically increased due to particle collision in the debris flow when its velocity increases. Takahashi et al. (1992) conducted field investigations alongside flume experiments and introduced a 2-D rheological model with the coefficient K d , dependent on the grain size and sediment concentration, as indicated by Eqs 7, 8:
2.2.2 Model Parameters
Model parameters that describe debris-flow behavior should be adjusted to reconstruct the given debris-flow phenomenon. In this study, parameters were determined by referring to the geological and soil characteristics, such as density, internal friction angle, and mean coarse particle diameter, retrieved from the field investigation at the time of the debris-flow incident (SMG, 2014). As the values of the erosion and deposition coefficients were not obtained directly from the field investigation, we used estimates from previous studies. The parameters used in Hyper Kanako execution are listed in Table 1.
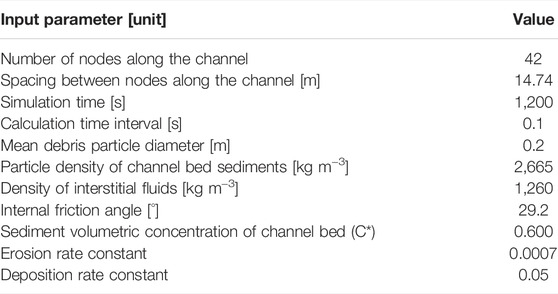
TABLE 1. Summary of parameters and values used in Hyper Kanako.
2.2.3 Channel Geometry
One of the important datasets for debris-flow simulation is the topographic features of channels. However, due to the lack of topographic data prior to the 2011 debris-flow event, the channel geometry of the Hyoungchon watershed was derived from the 10 m × 10 m digital elevation model (DEM) extracted from the 2009 National Digital Topographic Map of the National Geographic Information Institute (NGII, 2019). The National Topographic Map was generated by combining aerial photographs and ground survey data, and had a 1:5000 scale (NGII, 2019). The geometry of the channel used in this study is shown in Figure 2. Meanwhile, Hyper Kanako assumes a uniform channel with a rectangular cross-section in a given portion of stream. The debris-flow channel width was set to 10 m according to the average width of the field investigation results (SMG, 2014). As the erodible layer depth had a broad range of 0.5–2.0 m according to field measurements, an average value of 1.5 m was applied to all sections for the simulation.
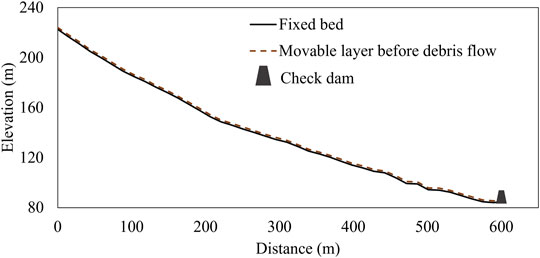
FIGURE 2. Schematic design of the debris flow channel. The black solid line is the fixed channel bed, and the brown dashed line is the erodible layer. The location of the check dam is represented as a black trapezoid.
2.2.4 Input Hydrograph
The empirical formulae, expressed in Eqs 9–11 (NILIM, 2016b), derived from the initial volume of discharged sediment were utilized to generate the input hydrograph of the debris flow, as shown below:
where Q is the total discharged amount of debris flow (m3), V dpq is the initial volume (m3), C * is the volumetric sediment concentration of the channel bed, and Q sp is the maximum discharge rate of the debris flow (m3 s−1). C d , the volumetric sediment concentration of debris flow on the mean channel slope (θ 0 ), was proposed by Takahashi and Nakagawa (1991), with the range of 0.3 ≤ C d ≤ 0.9C * . Here, θ 0 is the mean slope of the channel that is calculated on the portion of the channel from the dam location to 200 m upstream (NILIM, 2016b), and specified as 8.39°. ρ is the density of the interstitial fluid of the debris flow (kg m−3), σ is the particle density of the debris in the debris flow (kg m−3), and ϕ is the internal friction angle.
Figure 3 shows how the hydrograph was set, representing a C d of 0.32, Q of 7,127.49 m3, and Q sp of 71.27 m3 s−1, with a duration of 200 s. These estimates were based on the initial volume of the debris flow (3,800 m3), approximated at the contributing source area in the Hyoungchon watershed.
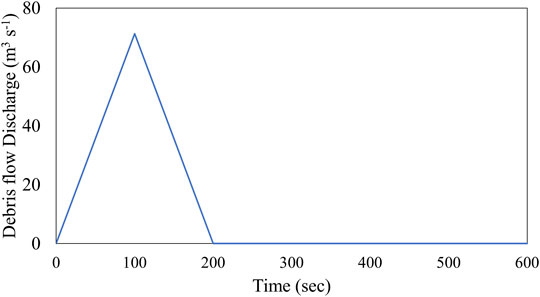
FIGURE 3. Hydrograph of simulated debris flow discharge.
2.3 Estimation of Debris-Flow Impact Force
The external force exerted by a debris flow is generally considered as a temporally variable dynamic load. Note that the time-dependent interaction between debris flow and structure is a significant concern in stability analysis. Specifically, some studies on a single debris-flow surge (Scheidl et al., 2013; Lee et al., 2019; Wang et al., 2020) have reported that the impact force was substantially triggered by the collision of the first flow surge. Subsequently, the preceding surge of debris flow was sequentially deposited along the upstream reach of a dam, which acted as a buffering barrier against the following sediment flow (Shen et al., 2018; Ng et al., 2021). These results indicated that the maximum impact force exerted by the debris-flow surge seemingly represents the most important trigger for dam stability.
Various estimation methods have been used to quantify debris-flow impact force (Hungr et al., 1984; Armanini, 1997; Hübl and Holzinger, 2003; Scheidl et al., 2013). In this study, the empirical model, developed by Hübl and Holzinger (2003), was applied to quantify the debris-flow impact force (Eq. 12). This model reflects the hydrodynamic behavior of debris flows (Proske et al., 2011; Scheidl et al., 2013; Koo et al., 2017) and, most importantly, it can be applied to a wide range of Froude number conditions (Hübl et al., 2009; Suda et al., 2009), thereby reflecting variations in the empirical coefficient in the model according to Froude numbers (Proske et al., 2011; Scheidl et al., 2013). The maximum debris-flow impact force was estimated from the maximum velocity and depth of the debris flow approaching the check dam using Eq. 12:
where P max is the maximum impact force (kN m−2), ρ m is the density of the debris-flow mixture (kg m−3), u is the debris-flow velocity in the flow direction (m s−1), g is the gravitational acceleration (9.807 m s−2), and h is the flow depth (m). To calculate the impact force on the check dam, ρ m , u, and h are taken at the position of the check dam where the impact force reaches the maximum value.
2.4 External Load Scenarios With Sedimentation
As sediment particles are continuously deposited in the upstream reaches of check dams over a long period, the stress distribution applied on a check dam varies with sediment deposition. In this study, five sedimentation scenarios were introduced, ranging from the no-deposit condition immediately after dam construction to the entire-deposit condition. In other words, this study considered heights of sediment deposits of 0%, 25%, 50%, 75%, and 100% in relation to the dam height. Sediment deposition in the upstream reach causes a change in the longitudinal profile of streams, thereby modifying the flow characteristics, such as flow velocity. Seo et al. (2016) indicated that the channel bed slope became gentle at one-half to two-thirds of the mean channel slope gradient (in percent) due to the sediment storage effect of the check dam. Given this concept, we assumed that the channel bed slope decreased to half of the mean channel bed slope in the 200 m section upstream of the dam (Figure 4). Consequently, the debris-flow impact force was quantified by considering the mitigated channel bed slope for each deposit scenario.
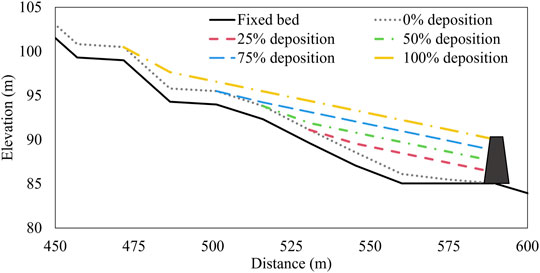
FIGURE 4. Changes in the gradient of the upstream reaches of the dam according to the deposit scenario. The location of the check dam is represented as a black trapezoid.
2.5 Structural Stability Analysis
A finite element analysis was applied to examine the structural stability of the Hyoungchon watershed check dam against simulated debris flows, where the sediment deposition and debris-flow impact force were considered. The check dam stability was estimated using a 2-D plane for the central cross-section under a prismatic debris-flow impact force. The geometry of the central cross-section of the check dam is shown in Figure 5.
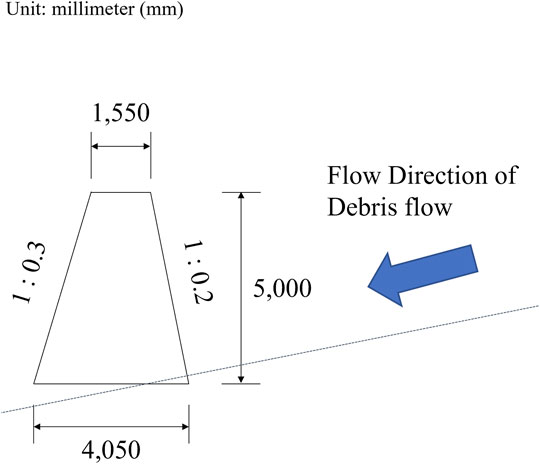
FIGURE 5. Geometry of the central cross-section of the check dam. The height to crest is 5 m. The upstream face has a slope of 1:0.2, and downstream face 1:0.3. The base width is 4.05 m, and the width at the crest is 1.55 m.
Two-dimensional finite element analysis was performed using the COMSOL Multiphysics 5.3 software (COMSOL AB, 2017). COMSOL is a finite element solver, which is widely used in single and multi-physics simulations. We further utilized the Structure Mechanics Module in COMSOL to perform a principal stress analysis. In this way, the tensile and compressive stresses were quantified using the linear elastic model.
Furthermore, the structural stability was scrutinized by comparing the estimated tensile and compressive stresses with the allowable strengths of the check dam. The allowable strength (21 MPa, Table 2) of the concrete material (KMLIT, 2012) was applied as the compressive strength. As the analyzed dam is a plain concrete structure without rebars, the tensile strength induced by debris-flow impact force should be considered in stability analysis. The tensile strength of the check dam was estimated to be 2.89 MPa (Table 2) by considering the relationship between the compressive strength and the tensile strength (
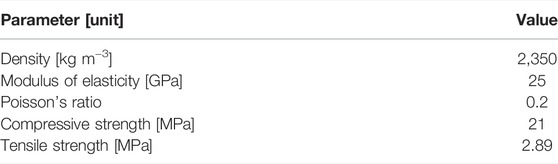
TABLE 2. Summary of parameters and values used in COMSOL Multiphysics.
We compared the allowable strengths and maximum stresses acting on check dams through structural analysis. The uncertainty in the load estimation was considered by multiplying the respective factors of predefined loads. The load factors of 1.2 and 1.6 were utilized for the dead and live loads, respectively. The hydrostatic pressure, sediment earth pressure, and debris-flow impact force were regarded as live loads (KMLIT 2012).
Generally, concrete structures, including check dams, suffer from time-dependent degradation of their mechanical properties. However, it is difficult to define the age degradation rate of strength induced by various environmental conditions. Therefore, this study simply considered structural stability with the strength reduction set at 0%, 25%, and 50% to ensure the long-term stability of the structure.
3 Results
3.1 Simulation of Debris Flow and Impact Force
Figure 6 shows the overall profiles of simulated flow velocity and depth at 200, 400, and 600 m. Simulations revealed a maximum flow velocity of 14.15 m s−1 that occurred 177 m from the source area after 42 s of flow. The maximum flow depth of 1.81 m was found to be 236 m from the source area at 46 s of runtime. On the channel reaching 200 m downstream from the source area, where the channel slope dramatically changed (from 33% to 16%), the flow velocity decreased, and sediment deposition occurred owing to the gentle slope (Figure 7A). The design input for the sediment discharge exhibited a peak discharge of 71.27 m3 s−1, resulting in the highest flow 400 m downstream from the source area, with a velocity of 9.72 m s−1 and depth of 1.32 m. It was found that, after the peak flow passed, sediment mixtures started to deposit in the 200–250 m reach and consequently accumulated in the dam reservoir and deposit fan (Figure 7B).
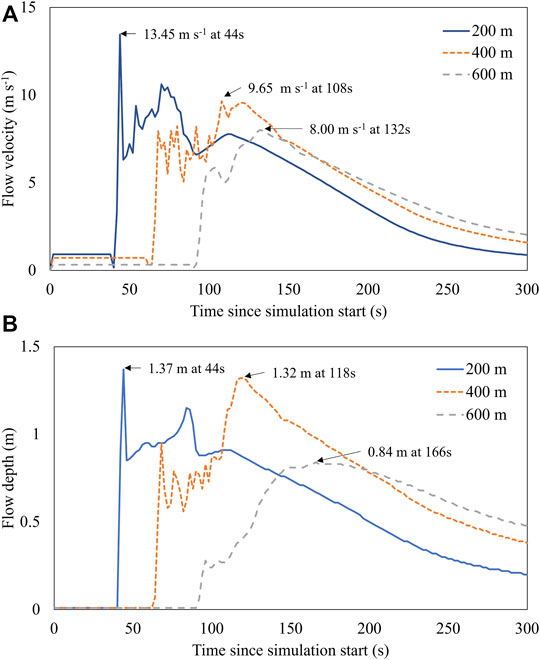
FIGURE 6. Time-series profiles of flow velocity (A) and depth (B) at 200 m (blue solid line), 400 m (orange dotted line), and 600 m (gray dashed line) from the source area.
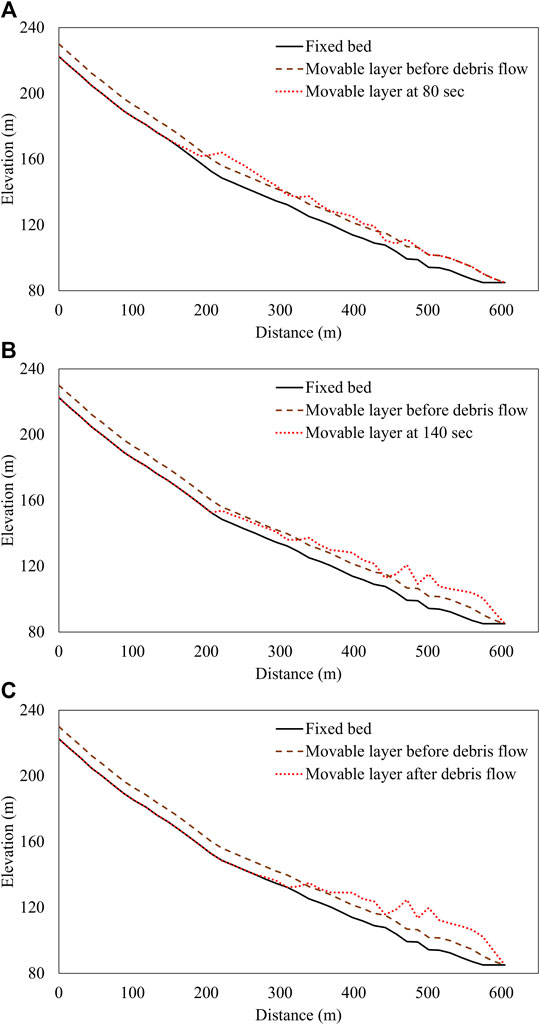
FIGURE 7. Change in the erodible layer after debris flow simulation without a dam after (A) 80 s, (B) 140 s, and (C) post-simulation. The black line is the fixed channel bed; the brown dashed and red dotted lines represent the movable layer before and after debris flow, respectively. Note that movable layers (brown dashed and red dotted lines) are not drawn at a realistic scale; they are exaggerated by five times their actual values for visibility.
The simulated debris flow entirely eroded the active layer in the upper reach, and in-stream sediment was deposited 280 m upstream from the dam site (Figure 7C). Note that the 2011 field observations had previously indicated that sediment deposition occurred approximately 300 m upstream of the dam (SMG, 2012). Therefore, Hyper Kanako can accurately reproduce the location and the type of sediment deposition along the stream. Moreover, the model is applicable for simulating the entrainment pattern of debris flow in steep mountain streams. Close agreement of the observed and simulated debris volumes was discerned for the 2011 event. The simulation results revealed that the debris flow immediately filled the dam reservoir and then overflowed to the downstream channel. This was identical to the debris-flow tracks, estimated by the airborne image taken after the disaster, as shown in Figure 8. Moreover, although the simulated deposit area was discontinuous because of the coarse spatial resolution (10 m × 10 m) of the computations, the extent of the deposit pixels was comparable to that of the actual deposit area in the 2011 event (Figure 9). During the simulation with 3,800 m3 of sediment input, 4,898.21 m3 of sediment was eroded along the channel. The total deposit amounts of sediments were estimated to be 8,434.13 m3, comprising 4,216.43 m3 deposited in the channel and 4,217.70 m3 in the deposit fan. Reflecting that some parts of the debris flow were discharged beyond the simulation boundary, the simulated debris flow satisfied the sediment balance within the dam‒channel network.
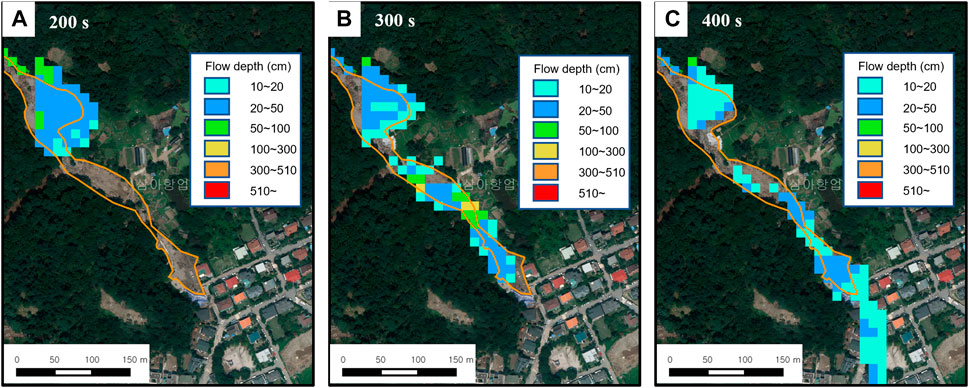
FIGURE 8. Result of debris flow simulation using Hyper Kanako. Flow depth at (A) 200 s, (B) 300 s, and (C) 400 s shows that the simulated flow path in the deposit fan is similar to the observed damaged area (orange line).
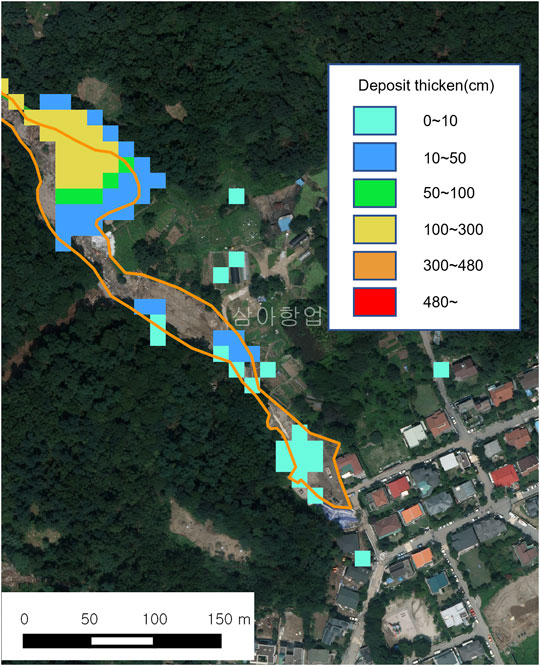
FIGURE 9. Result of simulated sediment using Hyper Kanako at 1,200 s. Although the simulated deposit fan is discontinuous, the sediment deposition in the reservoir (yellow deposition pixels) was well simulated; the total extent of deposition is also comparable to the actual deposit area in the 2011 event (orange line).
Regarding the trace of the debris flow, the Hyper Kanako result seemingly exhibited close comparison to the actual 2011 debris-flow event, despite some parameters being indirectly derived from previous studies without adjustment. However, due to the lack of data on the volume and area of erosional and depositional areas, the model results could not be validated quantitatively against the observed data.
The flow characteristics and impact force exhibited considerable differences across the different deposit condition scenarios (Table 3). The simulations with no dam condition revealed that the maximum impact force was approximately 132 kPa at a depth of 0.81 m, and the velocity was 7.17 m s−1. When the check dam was installed along the reach, the simulated depth, velocity of debris flow, and associated impact force all decreased, to 0.59 m, 5.36 m s−1, and 81.76 kPa, respectively, for the no-deposit scenario. The simulation under the entire-deposition (100%) scenario indicated that the flow depth, velocity, and resultant maximum impact force increased, to 0.77 m, 6.99 m s−1, and 123.04 kPa, respectively (Figure 10).
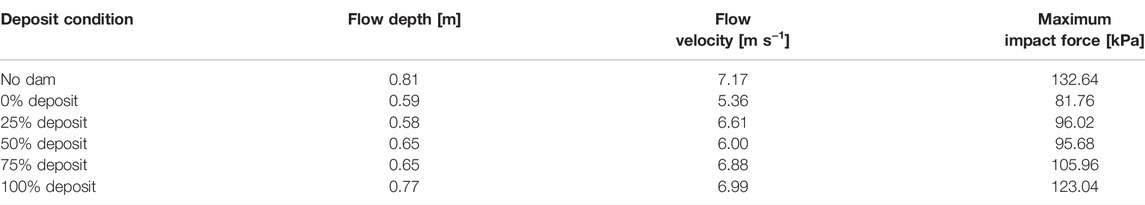
TABLE 3. Simulation result for debris flow characteristics and impact force in each deposit scenario.
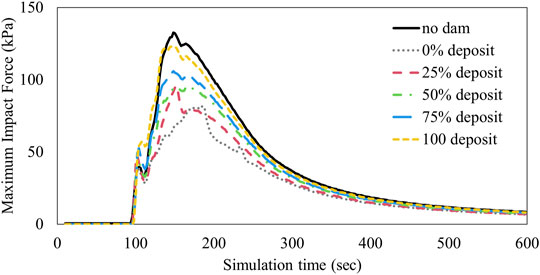
FIGURE 10. Changes in debris flow impact force according to different deposit scenarios.
Under the no-deposit condition, sedimentation occurred at two gentle sections with a gradient of less than 4%. Because of the deposition in these sections, the sediment concentration could have been decreased, which potentially affected the flow characteristics of the debris flow. However, when sedimentation scenarios were applied, the gradient of these sections was 7%, which was steeper than the initial slope due to sedimentation, as shown in Figure 4 in Section 2.4. As a result, the debris flow could run downstream with a faster flow velocity and less sediment deposition.
The flow depth was also affected by the deposition induced by a gentle slope gradient. If sediment deposition in the check dam reservoir was suppressed owing to a steeper slope, compared with the original channel slope, the debris flow would contain more sediment with increased flow rate, thereby deepening the flow. Moreover, increasing the deposit height seemingly induces changes in the flow characteristics and sediment concentration, thereby affecting the debris-flow impact force.
3.2 Check Dam Stability
The results of the dam stability analysis, which elucidates the influence of sedimentation and debris flow, are shown in Table 4. This shows that the maximum tensile and compressive stress values were lowest in the no-deposit condition, at 0.38 and 0.14 MPa, respectively. As the deposited depth increased, the resultant tensile and compressive stresses increased to 0.80 and 0.35 MPa, respectively. The point at which the maximum compressive stress was produced varied with the sediment deposition; it was exerted on the middle of the collision section in the face of the dam until 50% deposition was achieved; under deposition conditions of more than 75% it was exerted at the collision section of the debris flow and the bottom of the downstream face (Figure 11).
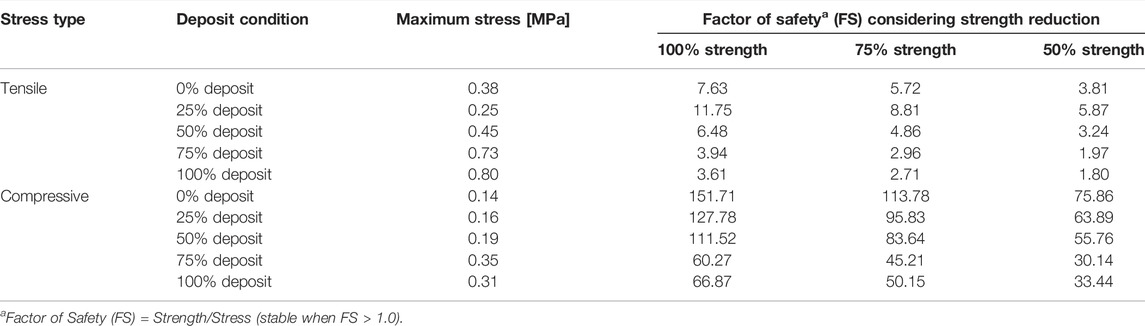
TABLE 4. Results of structural stability analysis.
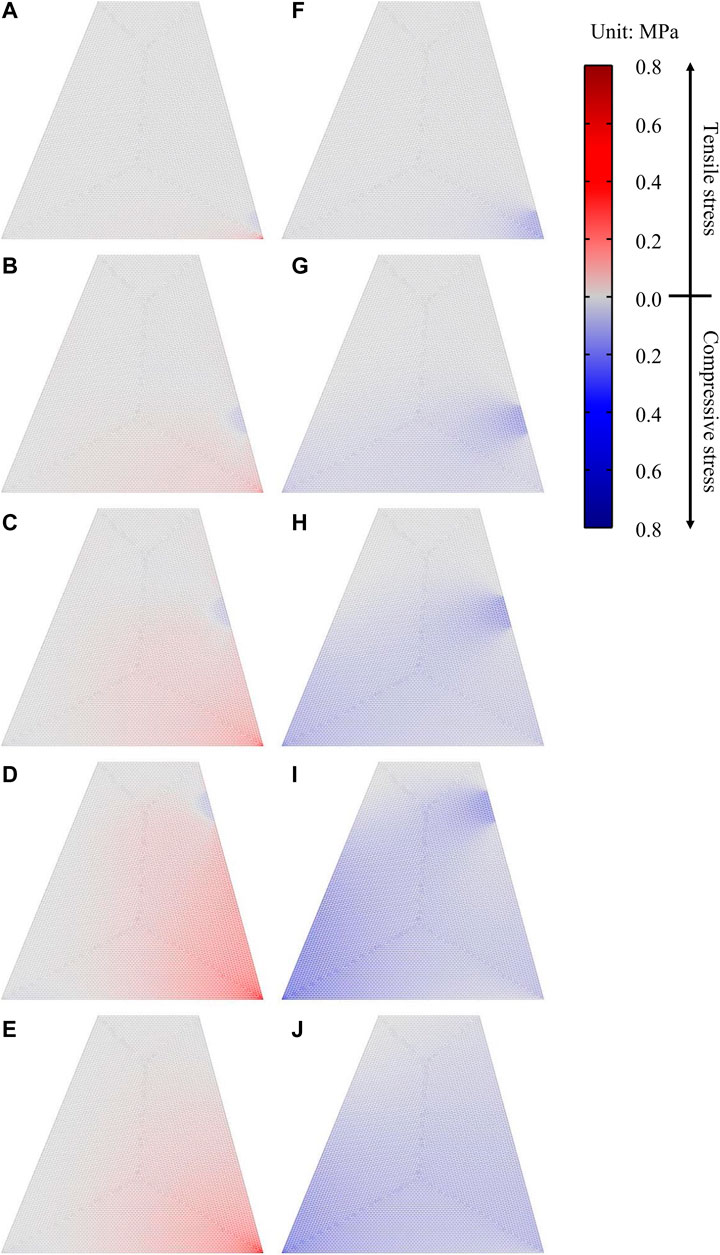
FIGURE 11. Results of tensile and compressive stress for each deposit scenario. Tensile stress distribution at (A) 0%, (B) 25%, (C) 50%, (D) 75%, and (E) 100% deposition conditions; compressive stress distribution at (F) 0%, (G) 25%, (H) 50%, (I) 75%, and (J) 100% deposition conditions.
Figure 11 shows that the maximum tensile stress occurred at the bottom of the upstream face for all the deposition scenarios. Our results demonstrated that the check dam had sufficient strength against the maximum compressive and tensile stresses, even under a 50% strength reduction by aging degradation. Notably, this finding indicates that the check dam satisfies the stability criteria for distress failure under the combined conditions of sediment deposition and debris-flow impact (Table 4).
4 Discussion
Sediment deposition and debris-flow discharge are essential for producing the external load to check dams; however, it is inherently challenging to accurately reproduce debris-flow characteristics by using numerical models. As a debris flow approaches a dam, the flow velocity is attenuated because of the rip current of the debris flow. When a debris flow reaches a rigid wall, such as a check dam, it immediately runs up in the vertical direction along the slope of the dam body (Iverson et al., 2016; Koo et al., 2017; Shen et al., 2018; Ng et al., 2021). According to Sanvitale et al. (2021), the vertical jet of debris discharge might overflow the check dam in an inertial-dominated condition (higher Froude number); it falls down and becomes a reflected wave into the upstream direction in a low Froude number condition. This reflected wave induces a reduction in the kinetic energy of the subsequent flow. Consequently, debris materials are sequentially deposited in the upstream face of check dams, which acts as a buffering barrier to reduce subsequent debris-flow impact forces. However, as the deposit depth increases, the piled-up debris extends to the top of the check dam, and subsequent debris flows can overflow the dam. Reflected wave and debris buffer effects can be somewhat prolonged until the overflow occurs. Sediment deposition in the check dam reservoir decreases the effective height of the dam on the upstream side, thereby reducing the storage capacity for sediment trapping and shortening the time to overflow. Therefore, the dissipated impact energy may be weakened as the deposit height increases, thus exacerbating the debris-flow impact force.
This study had several limitations, including: 1) the reproducibility of Hyper Kanako; 2) coarse spatial resolution; 3) simplicity of the entrainment model; and 4) difficulties in simulating strict physical processes.
In terms of the reproducibility, the results of numerical simulations should be quantitatively validated by comparisons with observed data, including the area and volume of entrainment (Gregoretti et al., 2019). This comparison was achieved with the help of 3-D topographic data obtained from airborne photogrammetry or LiDAR (Cucchiaro et al., 2019a; Cucchiaro et al., 2019b; Gregoretti et al., 2019). In this study, only airborne orthoimage was available to trace debris-flow movement; therefore, the erosional and depositional areas in the channel could not be quantified. Although a digital topographic map was taken within a month of the debris-flow event, most debris‒sediment mixtures in the deposit fan had already been removed because they covered public roads and residence areas.
The spatial resolution of the DEM obtained from the digital topographic map was also a critical limitation of this study. When a debris-flow impacts a check dam, the impact force distribution continuously varies owing to the debris-flow impact dynamics, such as the hydraulic processes of run-up or reflected waves. As these dynamic phenomena only occur locally, the spatial resolution for addressing the impact dynamics should be sufficiently high to consider the interaction between the debris flow and the check dam. However, the spatial resolution of the DEM used in this study was 10 m × 10 m, and the interval between spatial nodes in the channel area was approximately 15 m. Given a dam width of 4 m and height of 5 m, the data used in the simulation were insufficient to reproduce the local dynamics of debris-flow impact. Owing to this, we suggest that further studies should analyze the debris-flow impact force exerted on the check dam with higher precision and at a higher spatial resolution, using data taken before and after a debris-flow event, compared to those herein.
Moreover, the entrainment process in Hyper Kanako, which is represented as an empirical relationship between the flow velocity and sediment concentration, is likely insufficient to simulate the impact dynamics. When Hyper Kanako simulates a debris flow under the installation of check dams, this model assumes that the momentum of the debris flow instantaneously becomes zero with rapid sediment deposition until overflow occurs to avoid numerical errors induced by discontinuous flow phenomena, such as run-up or hydraulic jump when debris-flow impacts (Nakatani, 2010). This simplification ensures stable numerical solutions for deposit fans situated downstream of check dams. However, it could reduce the accuracy of the estimation of the debris-flow impact load.
Further analysis is needed to ensure the long-term stability of a check dam by considering several factors. First, the impact force can be set to reflect an extreme debris-flow event in the watershed. In this context, KFS (2014) and NILIM (2016a) suggest that design flood discharge should be quantified based on a return period of 100 years. The debris-flow evidence from 2011 has a 20-years recurrence interval, which is rather short to embrace an extreme disaster within the Hyoungchon watershed. Second, check dams suffer from aging and lose their strength over time (Lee, 2015). Thus, check dams with reduced strength are vulnerable to debris-flow impact forces. To address this issue, check dams need to be designed considering time-dependent strength reduction for providing long-term protection against debris flows.
5 Conclusion
In this study, we simulated a debris flow and the associated impact force in a small mountain stream to examine the structural stability of a check dam. The combined effects of the debris-flow impact force and lateral earth pressure were considered through finite element analysis. This analysis revealed that the check dam would be stable under all the simulations considering sediment deposition on the upstream face and debris-flow impact force. The debris-flow impact force resulted in concentrated tensile stress on the upstream face of the dam foundation.
These results were achieved for a specific debris-flow event, thereby constraining us from providing a broader conclusion that similar stress distributions can be observed in various other watershed environments. Nevertheless, our proposed framework for distress stability analysis of check dams will be more widely applicable. With a reasonable estimation method for debris-flow magnitude, the methods and results of this study can provide practical guidance for check-dam design and maintenance, taking into account sediment deposition and debris-flow impact force.
Data Availability Statement
The raw data supporting the conclusion of this article will be made available by the authors, without undue reservation.
Author Contributions
All authors contributed to conception and design of the study. SE organized the database. SE performed the numerical and statistical analysis. SE wrote the first draft of the manuscript. All authors contributed to manuscript revision, read, and approved the submitted version.
Conflict of Interest
The authors declare that the research was conducted in the absence of any commercial or financial relationships that could be construed as a potential conflict of interest.
Publisher’s Note
All claims expressed in this article are solely those of the authors and do not necessarily represent those of their affiliated organizations, or those of the publisher, the editors and the reviewers. Any product that may be evaluated in this article, or claim that may be made by its manufacturer, is not guaranteed or endorsed by the publisher.
References
Armanini, A. (1997). “On the Dynamic Impact of Debris Flows,” in Recent Developments on Debris Flows. Editors A. Armanini, and M. Michiue (Berlin/Heidelberg: Springer), 208–226.
Baggio, T., and D'agostino, V. (2022). Simulating the Effect of Check Dam Collapse in a Debris-Flow Channel. Sci. of Total Environ. 816, 151660. doi:10.1016/j.scitotenv.2021.151660
Bernard, M., Boreggio, M., Degetto, M., and Gregoretti, C. (2019). Model-Based Approach for Design and Performance Evaluation of Works Controlling Stony Debris Flows with an Application to a Case Study at Rovina di Cancia (Venetian Dolomites, Northeast Italy). Sci. of Total Environ. 688, 1373–1388. doi:10.1016/j.scitotenv.2019.05.468
Brighenti, R., Spaggiari, L., Segalini, A., Savi, R., and Capparelli, G. (2021). Debris Flow Impact on a Flexible Barrier: Laboratory Flume Experiments and Force-Based Mechanical Model Validation. Nat. Hazards 106, 735–756. doi:10.1007/s11069-020-04489-5
Chae, B.-G., Park, H.-J., Catani, F., Simoni, A., and Berti, M. (2017). Landslide Prediction, Monitoring and Early Warning: A Concise Review of State-of-The-Art. Geosci. J. 21, 1033–1070. doi:10.1007/s12303-017-0034-4
Chen, H.-X., Li, J., Feng, S.-J., Gao, H.-Y., and Zhang, D.-M. (2019). Simulation of Interactions Between Debris Flow and Check Dams on Three-Dimensional Terrain. Eng. Geol. 251, 48–62. doi:10.1016/j.enggeo.2019.02.001
Chun, K. W., Chun, K. W., and Song, D. G. (2016). Estimation of Sediment Discharge Controlled by Sediment-Filled Check-Dam in a Forested Catchment. J. Korean For. Soc 105, 321–329. (in Korean). doi:10.14578/jkfs.2016.105.3.321
Coe, J. A., Kinner, D. A., and Godt, J. W. (2008). Initiation Conditions for Debris Flows Generated by Runoff at Chalk Cliffs, Central Colorado. Geomorphology 96, 270–297. doi:10.1016/j.geomorph.2007.03.017
Cucchiaro, S., Cavalli, M., Vericat, D., Crema, S., Llena, M., Beinat, A., et al. (2019a). Geomorphic Effectiveness of Check Dams in a Debris-Flow Catchment Using Multi-Temporal Topographic Surveys. Catena 174, 73–83. doi:10.1016/j.catena.2018.11.004
Cucchiaro, S., Cazorzi, F., Marchi, L., Crema, S., Beinat, A., and Cavalli, M. (2019b). Multi-Temporal Analysis of the Role of Check Dams in a Debris-Flow Channel: Linking Structural and Functional Connectivity. Geomorphology 345, 106844. doi:10.1016/j.geomorph.2019.106844
Gregoretti, C., Stancanelli, L. M., Bernard, M., Boreggio, M., Degetto, M., and Lanzoni, S. (2019). Relevance of Erosion Processes When Modelling In-Channel Gravel Debris Flows for Efficient Hazard Assessment. J. of Hydrology 568, 575–591. doi:10.1016/j.jhydrol.2018.10.001
Horiuchi, S., Iwanami, E., Nakatani, K., Satofuka, Y., and Mizuyama, T. (2012). Development of “Hyper KANAKO”, a Debris Flow Simulation System Using with Laser Profiler Data. J. Jpn. Soc. Eros. Control Eng. 64, 25–31. (In Japanese). doi:10.11475/sabo.64.6_25
Hu, K., Wei, F., and Li, Y. (2011). Real-Time Measurement and Preliminary Analysis of Debris-Flow Impact Force at Jiangjia Ravine, China. Earth Surf. Process. Landforms 36, 1268–1278. doi:10.1002/esp.2155
Hübl, J., and Fiebiger, G. (2005). “Debris-Flow Mitigation Measures,” in Debris-Low Hazards and Related Phenomena. Editors M. Jakob, and O. Hungr (Berlin/Heidelberg: Springer), 445–487.
Hübl, J., and Holzinger, G. (2003).Kleinmassstaebliche Modellversuche zur Wirkung von Murbrechern. WLS Report 50:3. Vienna: University of Natural Resources and Life Sciences. (In German).
Hübl, J., Suda, J., Proske, D., Kaitna, R., and Scheidl, C. (2009). “Debris Flow Impact Estimation,” in Proceedings of the 11th International Symposium on Water Management and Hydraulic Engineering(Ss. Ohrid: Cyril and Methodius University), 137–148.
Huebl, J., Nagl, G., Suda, J., and Rudolf-miklau, F. (2017). Standardized Stress Model for Design of Torrential Barriers Under Impact by Debris Flow (According to Austrian Standard Regulation 24801). Int. J. of Eros. Control Eng. 10, 47–55. doi:10.13101/ijece.10.47
Hungr, O., Morgan, G. C., and Kellerhals, R. (1984). Quantitative Analysis of Debris Torrent Hazards for Design of Remedial Measures. Can. Geotech. J. 21, 663–677. doi:10.1139/t84-073
Imaizumi, F., Sidle, R. C., Tsuchiya, S., and Ohsaka, O. (2006). Hydrogeomorphic Processes in a Steep Debris Flow Initiation Zone. Geophys. Res. Lett. 33, L10404. doi:10.1029/2006GL026250
Iverson, R. M., George, D. L., and Logan, M. (2016). Debris Flow Runup on Vertical Barriers and Adverse Slopes. J. Geophys. Res. Earth Surf. 121, 2333–2357. doi:10.1002/2016JF003933
[KFS] Korea Forest Service (2014). Erosion Control Technical Manual. Daejeon: Korea Forest Service. (In Korean).
[KMLIT] Korea Ministry of Land, Infrastructure and Transport (2012). Concrete Structure Design Code. Seoul: Korea Ministry of Land, Infrastructure and Transport. (in Korean).
Koo, R. C. H., Kwan, J. S. H., Ng, C. W. W., Lam, C., Choi, C. E., Song, D., et al. (2017). Velocity Attenuation of Debris Flows and a New Momentum-Based Load Model for Rigid Barriers. Landslides 14, 617–629. doi:10.1007/s10346-016-0715-5
Kwan, J. (2012). Supplementary Technical Guidance on Design of Rigid Debris-Resisting Barriers, Hong Kong. GEO Report No.270. Hong Kong: Geotechnical Engineering Office.
Law, R. P. H., Choi, C. E., and Ng, C. W. W. (2016). Discrete-Element Investigation of Influence of Granular Debris Flow Baffles on Rigid Barrier Impact. Can. Geotech. J. 53, 179–185. doi:10.1139/cgj-2014-0394
Lee, J.-H. (2015). Analysis of Condition Assessment and Damage Patterns of Concrete Check Dam. Ph.D. Dissertation. Chuncheon (South Korea): Kangwon National University. (In Korean).
Lee, K., Kim, Y., Ko, J., and Jeong, S. (2019). A Study on the Debris Flow-Induced Impact Force on Check Dam With- and Without-Entrainment. Comput. and Geotechnics 113, 103104. doi:10.1016/j.compgeo.2019.103104
Leonardi, A., and Pirulli, M. (2020). Analysis of the Load Exerted by Debris Flows on Filter Barriers: Comparison Between Numerical Results and Field Measurements. Comput. and Geotechnics 118, 103311. doi:10.1016/j.compgeo.2019.103311
Marchelli, M., and De Biagi, V. (2019). Dynamic Effects Induced by the Impact of Debris Flows on Protection Barriers. Int. J. of Prot. Struct. 10, 116–131. doi:10.1177/2041419618798378
Mizuyama, T. (1979). Calculation and its Problem of Debris Flow Impact Force Acting on Sabo Dam. Shin-Sabo 32, 40–43. (in Japanese). doi:10.11475/sabo1973.31.4_26
Nakatani, K. (2010). Development and Application of General-Purpose Debris Flow Numerical Simulation System with GUI. Ph.D. Dissertation. Kyoto (Japan): Kyoto University. (In Japanese).
Nakatani, K., Satofuka, Y., and Mizuyama, T. (2008). Development of “Kanako Ver.1.10", a Wide Use One Dimensional Debris Flow Simulator Equipped with GUI. J. Jpn. Soc. Eros. Control Eng. 61, 41–46. (In Japanese). doi:10.11475/sabo.61.2_41
Ng, C. W. W., Liu, H., Choi, C. E., Kwan, J. S. H., and Pun, W. K. (2021). Impact Dynamics of Boulder-Enriched Debris Flow on a Rigid Barrier. J. Geotech. Geoenviron. Eng. 147, 04021004. doi:10.1061/(ASCE)GT.1943-5606.0002485
[NGII] National Geographic Information Institute (2019). National Geospatial Information Platform. Available at: http://map.ngii.go.kr/mn/mainPage.do (Accessed April 1, 2022).
[NILIM] National Institute for Land and Infrastructure Management (Japan) (2016a). Manual of Technical Standard for Designing Sabo Facilities Against Debris Flow and Driftwood. Technical Note of NILIM No. 905. Tsukuba: National Institute for Land and Infrastructure Management. (In Japanese).
[NILIM] National Institute for Land and Infrastructure Management (Japan) (2016b). Manual of Technical Standard for Establishing Sabo Master Plan for Debris Flow and Driftwood. Technical Note of NILIM No. 904. Tsukuba: National Institute for Land and Infrastructure Management. (In Japanese).
Proske, D., Suda, J., and Hübl, J. (2011). Debris Flow Impact Estimation for Breakers. Georisk Assess. and Manag. of Risk Eng. Syst. and Geohazards 5, 143–155. doi:10.1080/17499518.2010.516227
Rossi, G., and Armanini, A. (2019). Impact Force of a Surge of Water and Sediments Mixtures against Slit Check Dams. Sci. of Total Environ. 683, 351–359. doi:10.1016/j.scitotenv.2019.05.124
Sanvitale, N., Bowman, E., and Cabrera, M. A. (2021). Experimental Investigation on the Impact Dynamics of Saturated Granular Flows on Rigid Barriers. Environ. Eng. Geosci. 27, 127–138. doi:10.2113/EEG-D-20-00033
Scheidl, C., Chiari, M., Kaitna, R., Müllegger, M., Krawtschuk, A., Zimmermann, T., et al. (2013). Analysing Debris-Flow Impact Models, Based on a Small Scale Modelling Approach. Surv. Geophys. 34, 121–140. doi:10.1007/s10712-012-9199-6
Shen, W., Li, T., Li, P., and Lei, Y. (2020). Numerical Assessment for the Efficiencies of Check Dams in Debris Flow Gullies: A Case Study. Comput. and Geotechnics 122, 103541. doi:10.1016/j.compgeo.2020.103541
Shen, W., Zhao, T., Zhao, J., Dai, F., and Zhou, G. G. D. (2018). Quantifying the Impact of Dry Debris Flow against a Rigid Barrier by DEM Analyses. Eng. Geol. 241, 86–96. doi:10.1016/j.enggeo.2018.05.011
Simoni, A., Bernard, M., Berti, M., Boreggio, M., Lanzoni, S., Stancanelli, L. M., et al. (2020). Runoff‐Generated Debris Flows: Observation of Initiation Conditions and Erosion-Deposition Dynamics Along the Channel at Cancia (Eastern Italian Alps). Earth Surf. Process. Landforms 45, 3556–3571. doi:10.1002/esp.4981
[SMG] Seoul Metropolitan Government (2012). Mt. Umyeon Lansdlide Recovery Plan. Lot No.3: Hyoungchon Area. Seoul: Seoul Metropolitan Goverment. (In Korean).
[SMG] Seoul Metropolitan Government (2014). Supplimentary Investigation of Cause of Mt. Umyeon Landslide. Seoul: Seoul Metropolitan Goverment. (In Korean).
Song, D., Choi, C. E., Ng, C. W. W., Zhou, G. G. D., Kwan, J. S. H., Sze, H. Y., et al. (2019). Load-Attenuation Mechanisms of Flexible Barrier Subjected to Bouldery Debris Flow Impact. Landslides 16, 2321–2334. doi:10.1007/s10346-019-01243-2
Suda, J., Strauss, A., Rudolf-Miklau, F., and Hübl, J. (2009). Safety Assessment of Barrier Structures. Struct. and Infrastructure Eng. 5, 311–324. doi:10.1080/15732470701189498
Takahashi, T., Nakagawa, H., Harada, T., and Yamashiki, Y. (1992). Routing Debris Flows with Particle Segregation. J. Hydraul. Eng. 118, 1490–1507. doi:10.1061/(asce)0733-9429(1992)118:11(1490)
Takahashi, T., and Nakagawa, H. (1991). Prediction of Stony Debris Flow Induced by Severe Rainfall. J. Jpn. Soc. Eros. Control Eng. 44, 12–19. (In Japanese). doi:10.11475/sabo1973.44.3_12
Uchida, T., Nishiguchi, Y., Nakatani, K., Satofuka, Y., Yamakoshi, T., Okamoto, A., et al. (2013). New Numerical Simulation Procedure for Large-Scale Debris Flows (Kanako-LS). Int. J. of Eros. Control Eng. 6, 58–67. doi:10.13101/ijece.6.58
Victoriano, A., Brasington, J., Guinau, M., Furdada, G., Cabré, M., and Moysset, M. (2018). Geomorphic Impact and Assessment of Flexible Barriers Using Multi-Temporal LiDAR Data: The Portainé Mountain Catchment (Pyrenees). Eng. Geol. 237, 168–180. doi:10.1016/j.enggeo.2018.02.016
Wang, Y., Liu, X., Yao, C., and Li, Y. (2020). Debris-Flow Impact on Piers with Different Cross-Sectional Shapes. J. Hydraul. Eng. 146, 04019045. doi:10.1061/(ASCE)HY.1943-7900.0001656
Keywords: check dam, debris-flow impact force, structural stability, sediment deposition, finite element method
Citation: Eu S and Im S (2022) Influence of Debris-Flow Impact on the Structural Stability of Check Dams. Front. Earth Sci. 10:887102. doi: 10.3389/feart.2022.887102
Received: 01 March 2022; Accepted: 17 May 2022;
Published: 20 June 2022.
Edited by:
Eric Josef Ribeiro Parteli, University of Duisburg-Essen, GermanyCopyright © 2022 Eu and Im. This is an open-access article distributed under the terms of the Creative Commons Attribution License (CC BY). The use, distribution or reproduction in other forums is permitted, provided the original author(s) and the copyright owner(s) are credited and that the original publication in this journal is cited, in accordance with accepted academic practice. No use, distribution or reproduction is permitted which does not comply with these terms.
*Correspondence: Sangjun Im, anVuaWVAc251LmFjLmty