
94% of researchers rate our articles as excellent or good
Learn more about the work of our research integrity team to safeguard the quality of each article we publish.
Find out more
ORIGINAL RESEARCH article
Front. Phys., 05 December 2022
Sec. Optics and Photonics
Volume 10 - 2022 | https://doi.org/10.3389/fphy.2022.1048577
Implicit periodic structure in phase-only holograms will result in many diffraction orders in the diffraction field. We analyzed the diffraction pattern from a phase gratings point of view and proved that the diffraction orders were jointly influenced by the phase factor, the single-beam diffraction factor, and the multibeam interference factor. According to the analysis, we proposed the high-diffraction-order angular spectrum method (HDO-ASM) for the numerical reconstruction of high diffraction orders. Different from the conventional methods of removing high diffraction orders, we chose to reconstruct target images in high diffraction orders with HDO-ASM and a U-Net-based neural network. Finally, the 4 K phase-only holograms with high-diffraction-order reconstruction were generated in 0.09s and had a mean reconstruction quality of 34.3 dB (PSNR) in the DIV2K valid dataset. Theoretical and experimental results demonstrated that there are few speckle noises and fringes in the reconstructed images of holograms generated by the proposed method.
Compared with conventional display technologies, holography is regarded as a more promising visual display technology since it can reconstruct the whole light field of the object and can provide all visual information [1, 2]. The computer-generated hologram (CGH) is a combination of computer technology and traditional holography, which is widely used in three-dimensional display [3–7], virtual reality and augmented reality [8, 9], optical trapping [10, 11], interferometry [12, 13], microscopy imaging [14, 15], and other fields.
The spatial light modulator (SLM) is the most important equipment during the optical reconstruction of CGH, which is similar to the screen of a display device. The SLMs are mainly divided into phase-only SLM and amplitude-only SLM; the former only changes the phase of the incident light, and the latter only changes the amplitude of the incident light [16]. Compared with the amplitude-only holograms, the phase-only holograms only modulate the phase of the incident light instead of changing the amplitude of that; therefore, the intensity of the transmitted (reflected) light will hardly be changed. Thus, the phase-only hologram has higher diffraction efficiency, and the phase-only SLM is more widely used [17]. Thus, converting complex-amplitude information into phase-only information is a major difficulty to generate CGH. The traditional methods include the Gerchberg–Saxton (GS) algorithm [18], Wirtinger holography (WH) [19], the stochastic gradient descent (SGD) method [20], the error diffusion method [21], and the double-phase hologram (DPH) encoding the diffraction field directly [22]. In recent years, with the development of neural networks, researchers have tried to use it to generate phase-only holograms. Shi et al. used a large-scale CGH dataset as the training dataset of the deep neural networks (DNN), and the trained network model could generate photorealistic colored 3D hologram from a single RGB-depth image in real time, the reconstructed images of which were rich in detail and had a high reconstruction quality [23]. Wu et al. proposed a dense encoder–decoder network called Dense-Unet for realizing the reconstruction of a 3D particle field, which occupied less memory resources and required a shorter training time [24]. Lee et al. designed a structure of network which took multiple images of different depths as inputs and calculated the complex hologram as an output [25]. This method has generated holograms with multiple depths, but some additional problems have not been solved, such as occlusion or speckle reduction. An end-to-end convolutional neural network framework has been designed to rapidly generate holograms from the directly recorded images of real-world scenes, which contain depth cues, but the reconstruction quality still needed to be improved [26]. Wu et al. proposed an autoencoder-based neural network (holo-encoder) in an unsupervised manner, which could fast generate phase-only holograms, but the quality of the reconstructed image still needs to be improved [27].
SLMs modulate incident light through the structure similar to a matrix, which consists of a two-dimensional array of discrete pixels [28]. Because the pixelated SLM has a discrete nature, the diffraction pattern is formed by laterally and vertically shifted replicas, which are called diffraction orders [29]. Darwin et al. researched the effect of extra diffraction orders when phase-only holograms were illuminated by a single Gaussian beam and proposed that high-diffraction-order wasted light and had other unwanted side effects that limited the reconstruction quality [30]. He et al. regarded the CGH null system as an imaging system and developed an aberration model in Seidel formalism to analyze the high diffraction orders of CGH, and the experimental results showed that their method could reduce the adverse effect of high diffraction orders on reconstruction quality [31]. Moreover, there is a bright spot at the center of the diffraction pattern, which mainly originates from the low diffraction efficiency of SLMs and will interfere with the reconstructed images [32]. Darwin et al. derived a CGH-containing holographic information, which could project a corrective beam that destructively interferes with the zero-order beam, and improved the efficiency of the light pattern [33]. Damon et al. eliminated the zero-order beam with a checkerboard phase plate, which could shift the reconstructed images away from the center of a reconstructed pattern [34].
In the process of generating CGH through neural network, we found that generated holograms have many different diffraction patterns. Only at the center of these patterns, there is a similar reconstructed image but in the other locations there are different diffraction order reconstructions. We thought that the different diffraction order distributions were caused by different encoding methods of phase-only holograms and took one of them as an example to analyze from the phase gratings point of view. We have deduced the imaging formula of the diffraction orders and, respectively, analyzed the effect of the phase factor, the single-beam diffraction factor, and the multibeam interference factor on the high diffraction orders. Different from the aforementioned methods of limiting and removing high diffraction orders, we proposed a fresh idea that we reconstructed target images in the high diffraction orders. The
The U-Net-based neural network is a convolution neural network and consists of a contracting path to capture context and a symmetric expanding path that enables precise localization. In this paper, the trained U-Net is used to generate phase-only holograms with a high reconstruction quality. There are four steps in the training process: the reverse diffraction of target images, the generation of holograms from reverse diffraction field, the positive diffraction of holograms, and the backpropagation of errors between target images and reconstructed images.
In the first step, the distance between the imaging plane and the target image is
where
where
where
In the second step, a U-Net network model is built for generating phase-only holograms. As shown in Figure 1, the structure of the used U-Net consists of the input layer, the downsampling layers, the middle layer, the output layer, the upsampling layers, and skip-connection. The number of channels in the input layer is set to two and the number of channels in the output layer is set to one. The resolution of the input layer and output layer is set to 2,304 × 4,096. First, the amplitude of the reverse diffraction field
The downsampling process usually is called the encoding process, and the upsampling process usually is called the decoding process. In the encoding process, the size of the input data will decrease and the channels of that will increase. The shallow feature containing more details will be extracted. In the decoding process, the size of the input data will increase and the channels of that will decrease. The deep feature containing more semantic information will be extracted. The shallow feature and the deep feature are fused through the “skip-connection” to improve the output quality [35].
In the third step, the holograms generated in the previous step will be loaded onto the SLM. When the plane wave with unit amplitude illuminates SLM normally, the positive diffraction field of the reconstructed images in the imaging plane is expressed as
where
In the last step, we compared the reconstructed images’ amplitude
The loss function L1 has a stable solution and does not cause the gradient exploding. The parameters of the model will be updated through the backpropagation of error. A training epoch consists of the aforementioned four steps, and the network model will generate phase-only holograms with high-quality reconstruction after lots of epochs. The maximum range of spatial frequencies is
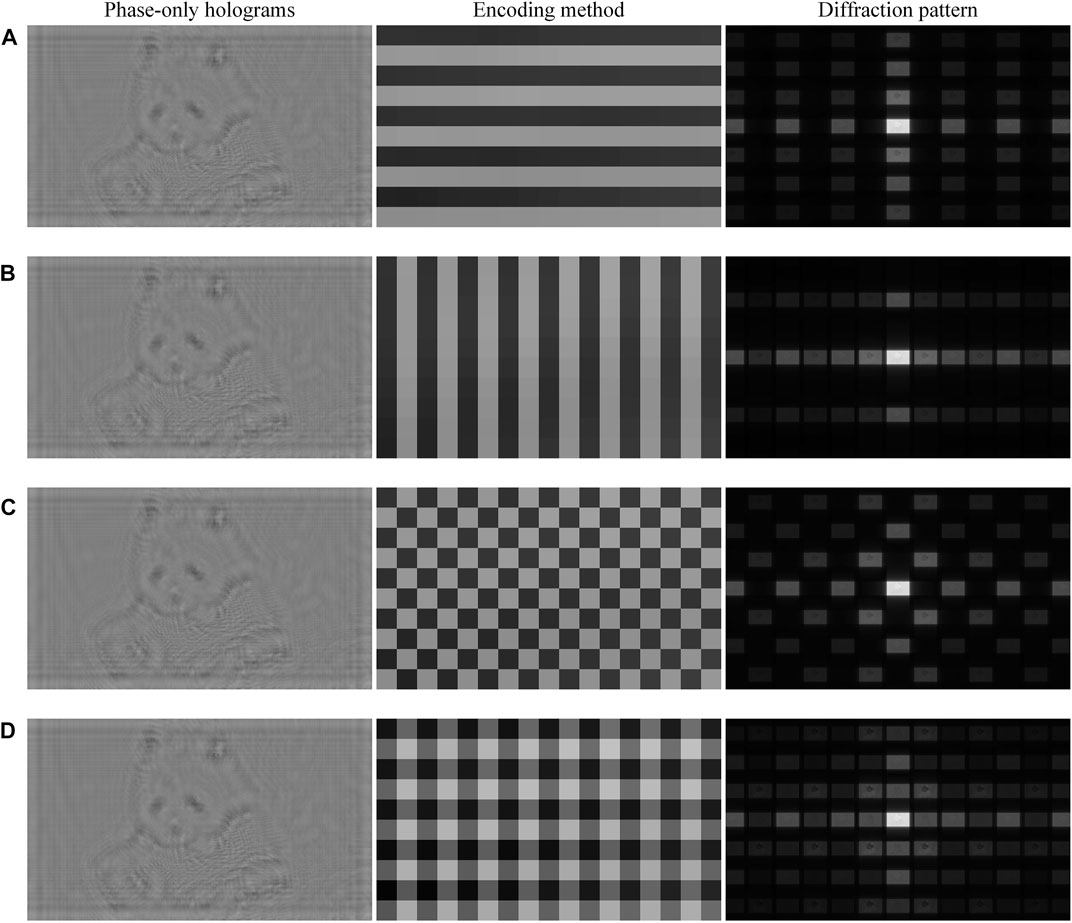
FIGURE 2. Phase-only holograms with different encoding methods and their diffraction patterns in numerical reproduction. (A) Strip-like encoding method in y-axis direction, (B) strip-like encoding method in x-axis direction, (C) checkerboard-like encoding method, and (D) grid-like encoding method.
We found that there is a reconstructed image in the center of all diffraction patterns, but different encoding methods result in different image distributions in other parts. In the next section, we take the diffraction pattern shown in Figure 2A as an example for detailed analysis.
The phase-only hologram in Figure 2A can be approximately regarded as a rectangular phase grating in the y-axis direction shown in Figure 3A. As shown in Figure 3B, the pixel pitch in the SLM is
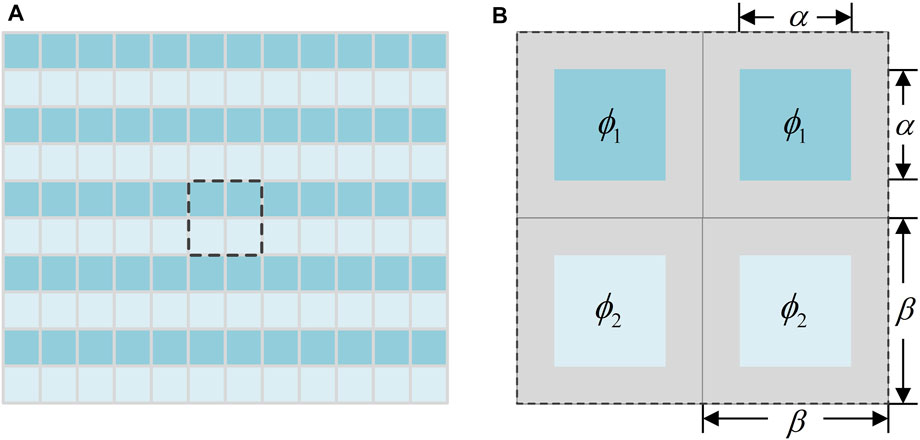
FIGURE 3. (A) SLM which has been loaded with a rectangular phase grating and (B) the detailed phase distribution.
We suppose the diffraction efficiency of the SLM is
The spectrum of the transmittance function
Usually, the pixel pitch of SLM and the imaging distance are fully satisfied with Fraunhofer diffraction conditions
When the plane wave with unit amplitude illuminates SLM normally, the Fraunhofer diffraction pattern generated by the
The diffraction pattern generated by the hologram is a superposition of Fraunhofer diffraction patterns generated by all slit combinations. It is expressed as
The intensity distribution of aforementioned diffraction pattern is
Equation 12 consists of the phase factor
and the condition to obtain a local maximum value in the y-axis direction is
Because
These local maximum values are called the principal maximum, and corresponding bright spots are called diffraction orders. The interval between two adjacent diffraction orders is set to
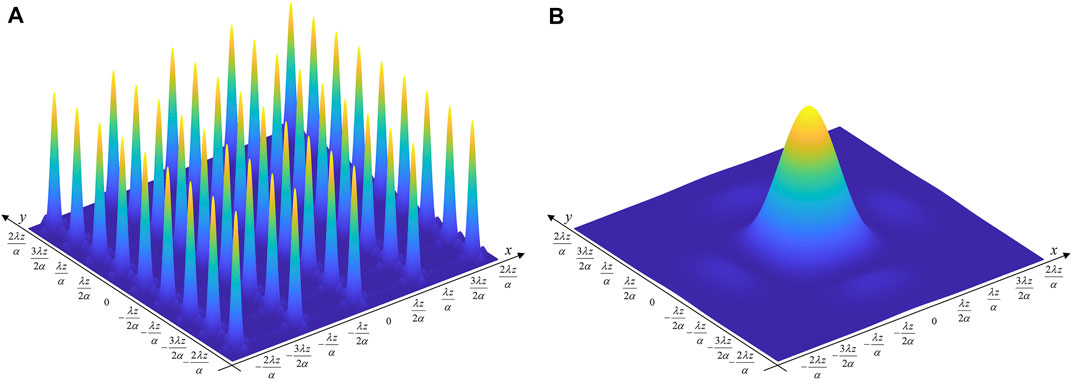
FIGURE 4. Value distribution of (A) the multibeam interference factor and (B) the single-beam diffraction factor.
The single-beam diffraction factor will achieve the minimum 0 when
where
When the fill factor
The value of the phase factor in diffraction orders is
where
According to the analysis of the multibeam interference factor, we marked each diffraction orders in the diffraction pattern and the location of their center in Figure 6. Also, the fill factor
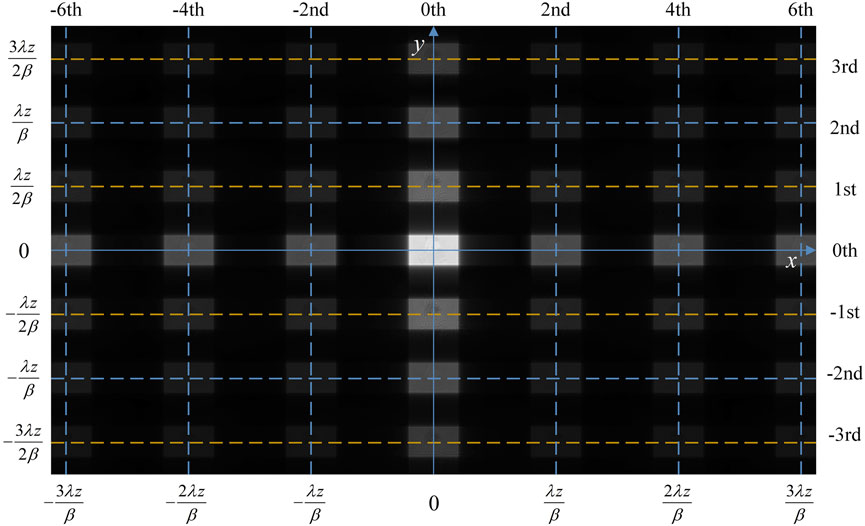
FIGURE 6. Diffraction pattern of phase-only holograms with the strip-like encoding method in y-axis direction.
In the previous three factors influencing the diffraction orders, there is the phase information only in the phase factor. Thus, the reconstructed images in diffraction orders are only related to the phase factor and not the other two factors. In Eq. 18, we know that the phase factor has a same modulation on all of the odd-order diffractions; therefore, so the reconstructed images in the odd-order diffractions are the same, except for the intensity. Similarly, the reconstructed images in the even-order diffractions are also the same, except for the intensity. The diffraction patterns in Figure 2B, Figures 2C,D can also be analyzed in this way, and they will not be covered here. Because the length of our SLM in x-axis direction is more than that in y-axis direction, the larger diffraction distance is needed to filter excess diffraction orders in x-axis direction. However, a very large diffraction distance will increase the complexity of the optical path. Moreover, it will also lose some high frequency information and decrease the reconstruction quality of phase-only holograms. Thus, the optimal choice to reconstruct images should be the
The diffraction pattern shown in Figure 6 is calculated by the S-FFT, which contains many high diffraction orders but their scales are too small to obtain errors and train the network model. Similarly, ASM is only suitable for the reconstruction of zero-th order diffraction. Here, we proposed a new method to obtain the numerical reconstruction of any high diffraction orders of phase-only holograms. In the imaging plane, the coordinate of the center of the
The light field of reconstructed image in the
where
The imaging distance
The premise of the aforementioned analysis of diffraction pattern is that phase-only holograms with the strip-like encoding method in y-axis direction is approximated to a rectangular phase grating. However, aforementioned holograms should actually be the combination of the rectangular phase grating and some perturbations, and it is these perturbations that bring about the reconstructed images in the diffraction orders. Moreover, perturbations also break the regularity of the phase distribution to a certain extent, which will cause changes in the distribution of high diffraction orders. In order to study this change more intuitively, we added some random phase with different standard deviations to the rectangular phase grating with a phase difference of
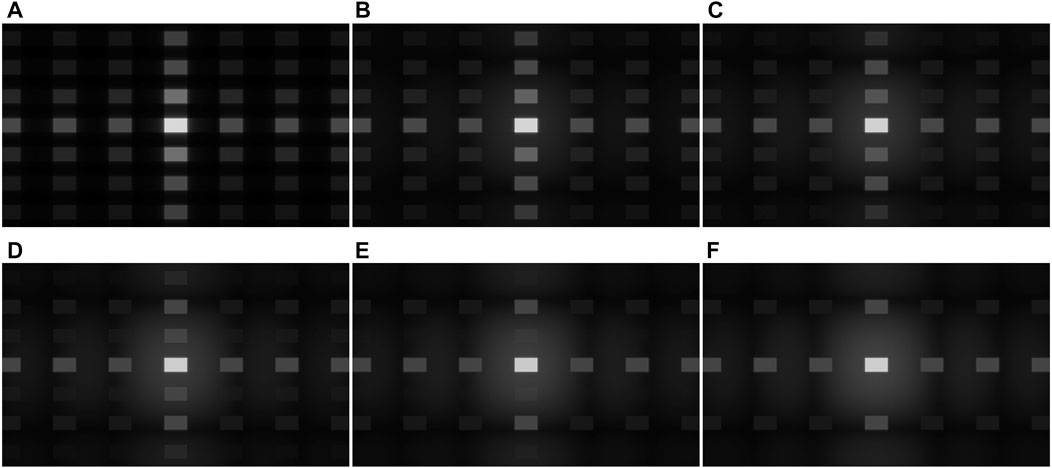
FIGURE 7. Diffraction patterns of rectangular phase gratings added with the random phase as the perturbation, the standard deviations of which are, respectively, (A) 0, (B) 0.36, (C) 0.73, (D) 1.09, (E) 1.45, and (F) 1.81.
The Flickr2K dataset was input into the trained network model, and 2,650 phase-only holograms were generated. Each hologram can be regarded as a combination of a rectangular phase grating and the perturbation. We calculated the standard deviation of perturbations and counted the probability of perturbations which was distributed in different standard deviation ranges. The result is shown in Figure 8. It can be found that the standard deviation of perturbations is less than 0.36 in the vast majority of phase-only holograms, which means that the odd-order diffractions of holograms generated by the proposed method are more obvious than that in Figure 7B. Thus, it can be considered that holograms generated by the proposed method have clear diffraction patterns.
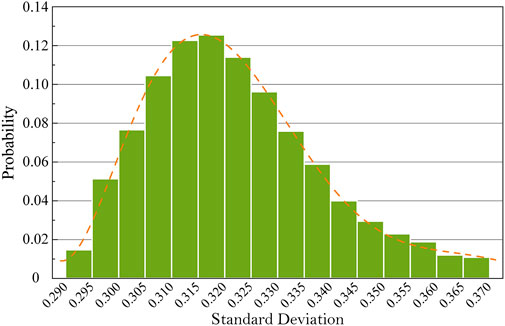
FIGURE 8. Probability of perturbations in different standard deviation ranges. The horizontal axis is the standard deviation of the random perturbation and the vertical axis is the corresponding probability.
We have used DIV2K valid dataset to test the reconstruction quality and computing time of DPH, WH, and the proposed method. The results are shown in Figure 9. The holograms with 34.3 dB (intensity PSNR) have been generated by the proposed method in 0.09s. It can be found that the proposed method has a more excellent and balanced performance in quality and speed compared with the other traditional methods.
In the paper, the imaging distance is set to 10 mm in both numerical and optical experiments. We have also tested the performance of the U-Net-based neural network using HDO-ASM in different imaging distances. The reconstruction qualities (intensity PSNR) of the proposed scheme in 30, 50, 70, and 90 mm are, respectively, 33.6, 32.7, 31.5, and 30.1 dB. It can be found that the reconstruction quality will decrease when the imaging distance increases. We think that there are two reasons for this problem. First, some high-frequency information is inevitably lost in the propagation of the diffraction field, which will be more obvious when the imaging distance increases. Second, the relationship between the diffraction field and the phase-only hologram will be more complex when the imaging distance increases; therefore, the fitting effect for that will decrease using the same network model. Thus, more downsampling layers and upsampling layers should be set when the imaging distance increases.
The difference between the conventional ASM and the proposed HDO-ASM is that the former reconstructs the target image in the zeroth diffraction order and the latter reconstructs the target image in
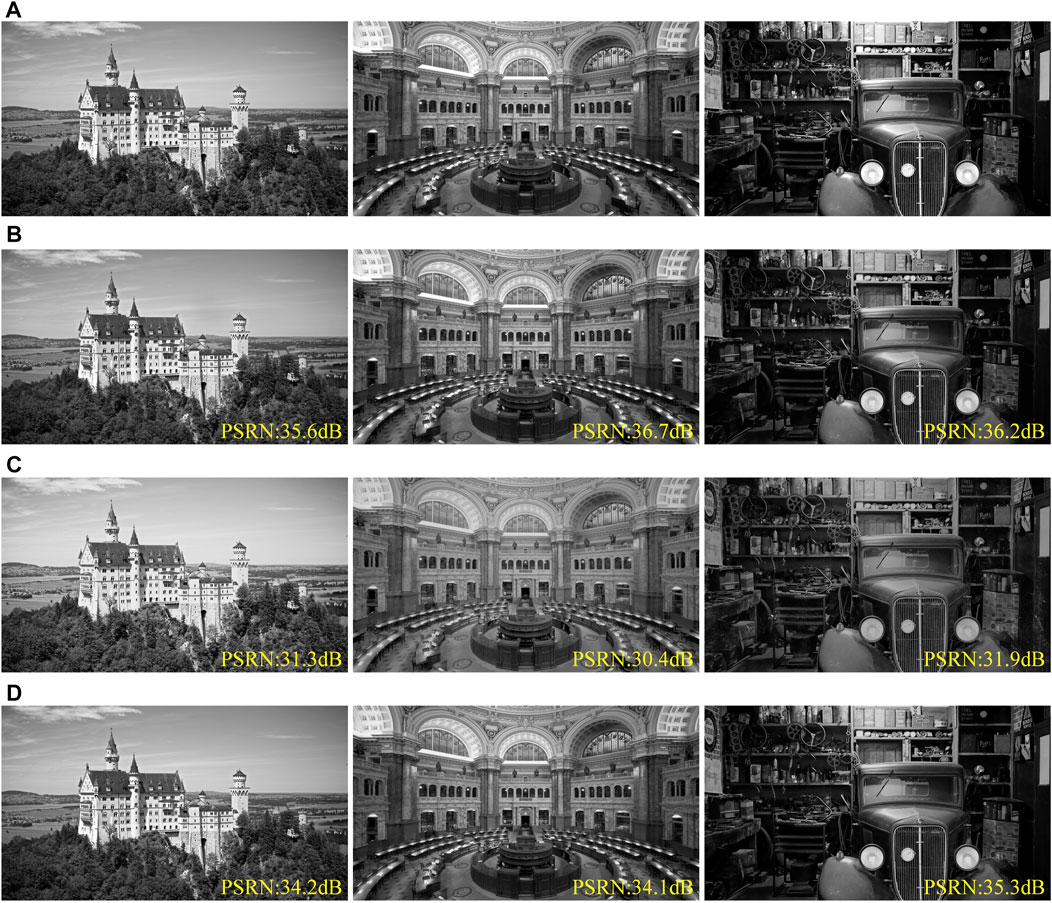
FIGURE 10. Numerical reconstructed images of phase-only holograms generated by different methods. (A) Target images, (B) WH, (C) DPH, and (D) the proposed method.
Figure 11 shows the configuration of the optical experiment platform. We used a nonpolarizing semiconductor laser with the wavelength of 638 (±8) nm as the reconstruction light source, which is connected to a single-mode fiber with core diameter of 4 μm. The laser emitted from the fiber end can be regarded as a point source due to the small core diameter of the fiber. The output end of the fiber was positioned at the focal point of collimated lens with the focal length of 100 mm to obtain the plane wave. We inserted a neutral density filter as an attenuator to adjust the light intensity and used a polarizer to obtain a linearly polarized light. Then, a half-wave-plate (HWP) was used to change the polarization of the light to match the optimal polarization direction of the LCoS. We positioned a rectangular aperture after the half-wave-plate to decrease the size of plane wave and obtain a rectangular profile. A 50%/50% nonpolarization beam splitter was used to split the laser. The phase-only hologram is loaded onto the nematic twisted liquid crystal LCoS with the resolution 4,094 × 2,400, whose pixel interval is 3.74 μm. The incident laser was modulated and reflected by the LCoS and propagated through the beam splitter again. We used a Fourier Lens with the focal length of 100 mm to enlarge reconstructed image and a spatial filter to allow the diffraction order we need pass through and block the other diffraction orders. A Canon EOS 5D Mark III camera equipped with an EF 100-mm f/2.8 macro lens was used to capture the magnified reconstructed image.
Figure 12 shows diffraction patterns of phase-only holograms in optical reconstruction, which correspond to the numerical reconstruction in Figure 2. The diffraction patterns shown in Figures 12A–D are generated by the U-Net-based neural network using conventional ASM, and the diffraction pattern shown in Figure 12E is generated by the U-Net-based neural network using proposed HDO-ASM. It can be found that the phase-only holograms generated by the proposed method have the same diffraction pattern. All pictures have same ISO and exposure time. It can be found that there are different high diffraction orders in the diffraction field due to different encoding methods, the intensities of which are also different. The distance between the SLM and the receiving screen is 130 mm. As shown in Figures 12B,C, at this distance the diffraction orders in y-axis direction can be separated, but that in x-axis direction cannot be separated. Only when the diffraction distance is more than 180 mm, we can observe the independent diffraction orders in x-axis direction. However, a very large diffraction distance will increase the complexity of the optical path and decrease the definition of the reconstructed images. Though the diffraction orders in Figure 12A can also be separated, the intensity is slightly low. Thus, the
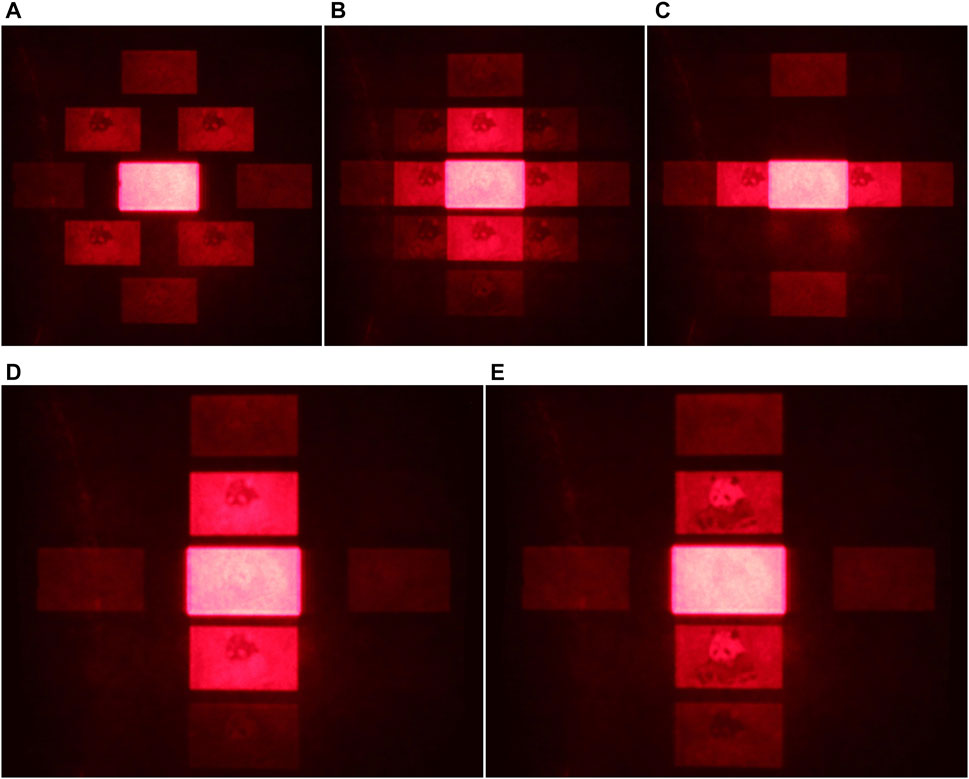
FIGURE 12. Optical diffraction patterns of phase-only holograms with different encoding methods. (A) Checkerboard-like encoding method, (B) grid-like encoding method, (C) strip-like encoding method in x-axis direction, (D) strip-like encoding method in y-axis direction, and (E) the proposed method. The diffraction distance is 120 mm, and the physical size of the reconstruction is 8.08 mm × 14.36 mm.
Figure 12D shows the diffraction pattern of the phase-only hologram with the strip-like encoding method in y-axis direction, which is generated by the U-Net-base neural network using conventional ASM and analyzed in detail in this work. Because the intensity of its zeroth diffraction order is very large, we choose to record
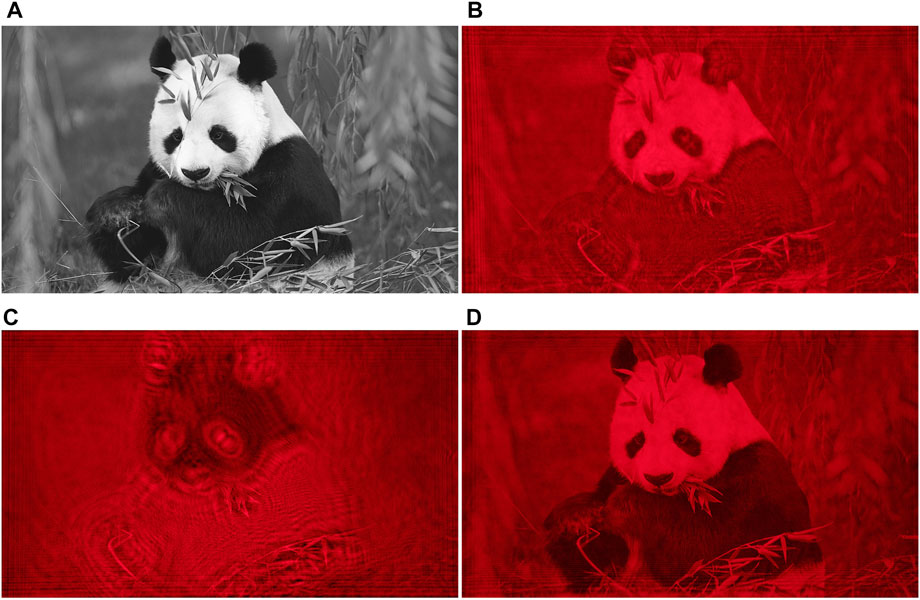
FIGURE 13. (A) Target image, (B) the
The diffraction pattern of the phase-only hologram generated by the proposed method is shown in Figure 12E, and the
The optical reconstruction corresponding to the numerical reconstruction in Figure 10 is shown in Figure 14. The reconstructed images of WH and DPH are recorded after being separated from the DC component by a blazed grating, and the proposed method can directly record the reconstructed images in the
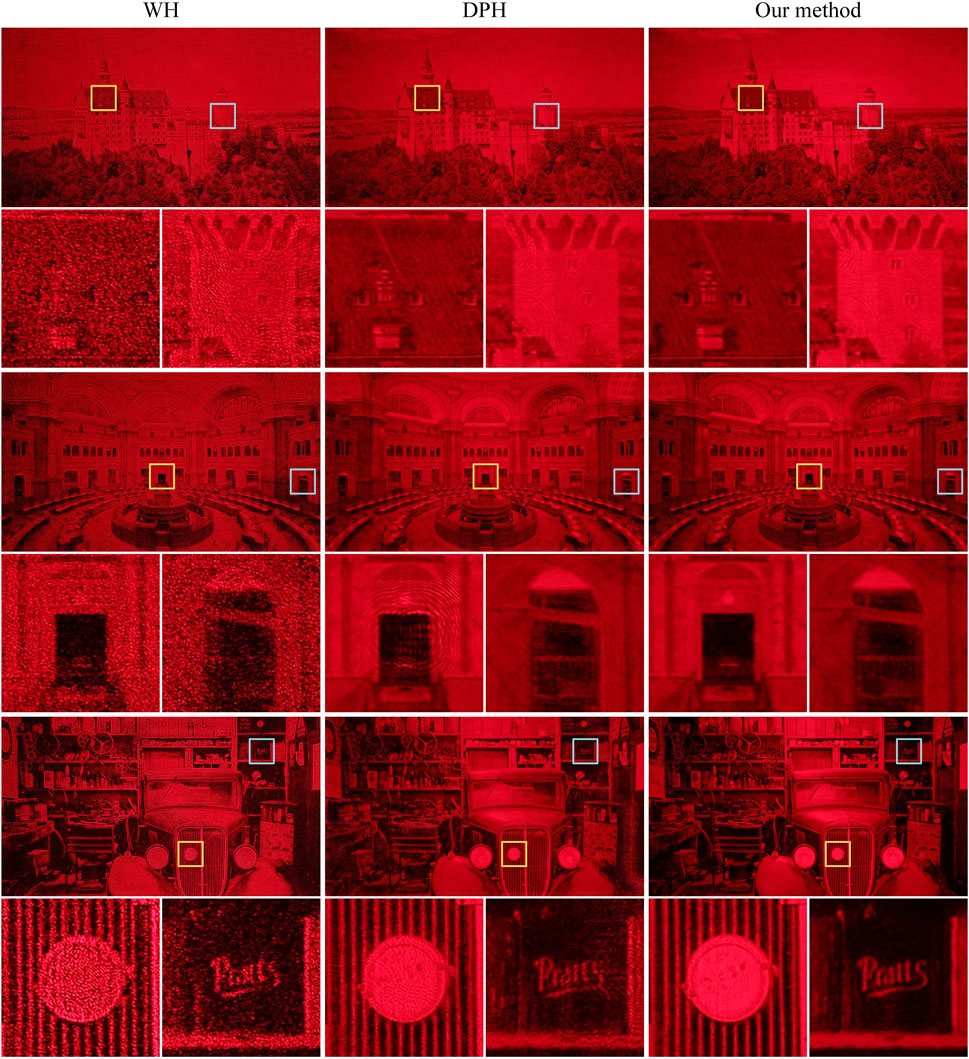
FIGURE 14. Optical reconstructed images of phase-only holograms generated by different methods. The physical size of the reconstruction is 8.08 mm × 14.36 mm.
In this paper, we analyzed the diffraction pattern of phase-only holograms and found the optimal diffraction order to reconstruct target images. We proposed HDO-ASM to calculate the numerical reconstruction of any diffraction order, which was combined with a U-Net-based neural network to generate the holograms reconstructing in the optimal diffraction order. The numerical and optical result demonstrated that phase-only holograms generated by the proposed method had a better imaging quality and a higher definition compared with traditional methods.
The original contributions presented in the study are included in the article/supplementary material, further inquiries can be directed to the corresponding author.
Conceptualization, XL and XY; methodology, XL and XY; validation, XL, XW, and TJ; formal analysis, XL, XY, and PL; data curation, XL, XW, and CS; writing—original draft preparation, XL; writing—review and editing, XL and XY; visualization, PL and QQ; supervision, XJ and XY; project administration, XY; and funding acquisition, XY. All authors have read and agreed to the published version of the manuscript.
This work was supported by the National Key Research and Development Program of China (2017YFB1104500) and the National Natural Science Foundation of China (61775240).
The authors declare that the research was conducted in the absence of any commercial or financial relationships that could be construed as a potential conflict of interest.
All claims expressed in this article are solely those of the authors and do not necessarily represent those of their affiliated organizations, or those of the publisher, the editors, and the reviewers. Any product that may be evaluated in this article, or claim that may be made by its manufacturer, is not guaranteed or endorsed by the publisher.
1. Yaras F, Kang H, Onural L. State of the art in holographic displays: A survey. J Display Technol (2010) 6(10):443–54. doi:10.1109/jdt.2010.2045734
2. Hong J, Kim Y, Choi H-j, Hahn J, Park J-H, Kim H, et al. Three-dimensional display technologies of recent interest: Principles, status, and issues [invited]. Appl Opt (2011) 50(34):H87–115. doi:10.1364/ao.50.000h87
3. Wang D, Liu C, Shen C, Xing Y, Wang Q. Holographic capture and projection system of real object based on tunable zoom lens. PhotoniX (2020) 1(1):6. doi:10.1186/s43074-020-0004-3
4. Lin S, Wang D, Wang Q, Kim E-S. Full-color holographic 3D display system using off-axis color-multiplexed-hologram on single SLM. Opt Lasers Eng (2020) 126:105895–905. doi:10.1016/j.optlaseng.2019.105895
5. Pi D, Liu J, Wang Y. Review of computer-generated hologram algorithms for color dynamic holographic three-dimensional display. Light Sci Appl (2022) 11(1):231. doi:10.1038/s41377-022-00916-3
6. Li Y, Li N, Wang D, Chu F, Lee S-D, Zheng Y, et al. Tunable liquid crystal grating based holographic 3D display system with wide viewing angle and large size. Light Sci Appl (2022) 11(1):188–97. doi:10.1038/s41377-022-00880-y
7. Feng S, Zuo C, Yin W, Gu G, Chen Q. Micro deep learning profilometry for high-speed 3D surface imaging. Opt Lasers Eng (2019) 121:416–27. doi:10.1016/j.optlaseng.2019.04.020
8. He Z, Sui X, Jin G, Cao L. Progress in virtual reality and augmented reality based on holographic display. Appl Opt (2019) 58(5):A74–A81. doi:10.1364/ao.58.000a74
9. Chang C, Bang K, Wetzstein G, Lee B, Gao L. Toward the next-generation VR/AR optics: A review of holographic near-eye displays from a human-centric perspective. Optica (2020) 7(11):1563–78. doi:10.1364/optica.406004
10. Chen H, Guo Y, Chen Z, Hao J, Xu J, Wang H, et al. Holographic optical tweezers obtained by using the three-dimensional Gerchberg–Saxton algorithm. J Opt (2013) 15(3):035401–8. doi:10.1088/2040-8978/15/3/035401
11. Abacousnac J, Grier D. Dexterous holographic trapping of dark-seeking particles with Zernike holograms. Opt Express (2022) 30(13):23568–78. doi:10.1364/oe.458544
12. Dong J, Jiang C, Jia S. Digital holographic metrology based on multi-angle interferometry. Opt Lett (2016) 41(18):4301–4. doi:10.1364/ol.41.004301
13. Paturzo M, Pagliarulo V, Bianco V, Memmolo P, Miccio L, Merola F, et al. Digital Holography, a metrological tool for quantitative analysis: Trends and future applications. Opt Lasers Eng (2018) 104:32–47. doi:10.1016/j.optlaseng.2017.11.013
14. Zhang J, Sun J, Chen Q, Zuo C. Resolution analysis in a lens-free on-chip digital holographic microscope. IEEE Trans Comput Imaging (2020) 6:697–710. doi:10.1109/tci.2020.2964247
15. Wang H, Göröcs Z, Luo W, Zhang Y, Rivenson Y, Bentolila L, et al. Computational out-of-focus imaging increases the space–bandwidth product in lens-based coherent microscopy. Optica (2016) 3(12):1422–9. doi:10.1364/optica.3.001422
16. Bitou Y. Digital phase-shifting interferometer with an electrically addressed liquid-crystal spatial light modulator. Opt Lett (2003) 28(17):1576–8. doi:10.1364/ol.28.001576
17. Collings N, Christmas JL, Masiyano D, Crossland WA. Real-time phase-only spatial light modulators for 2D holographic display. J Display Technol (2015) 11(3):278–84. doi:10.1109/jdt.2014.2384913
18. Gerchberg RW, Saxton WO. A practical algorithm for the determination of phase from image and diffraction plane pictures. Optik (1972) 35(2):237–50.
19. Bian L, Suo J, Zheng G, Guo K, Chen F, Dai Q. Fourier ptychographic reconstruction using Wirtinger flow optimization. Opt Express (2015) 23(4):4856–66. doi:10.1364/oe.23.004856
20. Chen C, Lee B, Li N, Chae M, Wang D, Wang Q, et al. Multi-depth hologram generation using stochastic gradient descent algorithm with complex loss function. Opt Express (2021) 29(10):15089–103. doi:10.1364/oe.425077
21. Jiao S, Zhang D, Zhang C, Gao Y, Lei T, Yuan X. Complex-amplitude holographic projection with a digital micromirror device (DMD) and error diffusion algorithm. IEEE J Sel Top Quan Electron (2020) 26(5):1–8. doi:10.1109/jstqe.2020.2996657
22. Arrizón V, Sánchez-De-la-Llave D. Double-phase holograms implemented with phase-only spatial light modulators: Performance evaluation and improvement. Appl Opt (2002) 41(17):3436–47. doi:10.1364/ao.41.003436
23. Shi L, Li B, Kim C, Kellnhofer P, Matusik W. Towards real-time photorealistic 3D holography with deep neural networks. Nature (2021) 591(7849):234–9. doi:10.1038/s41586-020-03152-0
24. Wu Y, Wu J, Jin S, Cao L, Jin G. Dense-U-net: Dense encoder–decoder network for holographic imaging of 3D particle fields. Opt Commun (2021) 493:126970–9. doi:10.1016/j.optcom.2021.126970
25. Lee J, Jeong J, Cho J, Yoo D, Lee B, Lee B. Deep neural network for multi-depth hologram generation and its training strategy. Opt Express (2020) 28(18):27137–54. doi:10.1364/oe.402317
26. Chang C, Wang D, Zhu D, Li J, Xia J, Zhang X. Deep-learning-based computer-generated hologram from a stereo image pair. Opt Lett (2022) 47(6):1482–5. doi:10.1364/ol.453580
27. Wu J, Liu K, Sui X, Cao L. High-speed computer-generated holography using an autoencoder-based deep neural network. Opt Lett (2021) 46(12):2908–11. doi:10.1364/ol.425485
28. Wang M, Zong L, Mao L, Márquez A, Ye Y, Zhao H, et al. LCoS SLM study and its application in wavelength selective switch. Photonics (2017) 4(4):22. doi:10.3390/photonics4020022
29. Agour M, Kolenovic E, Falldorf C, Cv K. Suppression of higher diffraction orders and intensity improvement of optically reconstructed holograms from a spatial light modulator. J Opt A: Pure Appl Opt (2009) 11(10):105405. doi:10.1088/1464-4258/11/10/105405
30. Palima D, Daria VR. Effect of spurious diffraction orders in arbitrary multifoci patterns produced via phase-only holograms. Appl Opt (2006) 45(26):6689–93. doi:10.1364/ao.45.006689
31. He Y, Hou X, Wu F, Ma X, Liang R. Analysis of spurious diffraction orders of computer-generated hologram in symmetric aspheric metrology. Opt Express (2017) 25(17):20556–72. doi:10.1364/oe.25.020556
32. Cibula MA, McIntyre DH. General algorithm to optimize the diffraction efficiency of a phase-type spatial light modulator. Opt Lett (2013) 38(15):2767–9. doi:10.1364/ol.38.002767
33. Palima D, Daria VR. Holographic projection of arbitrary light patterns with a suppressed zero-order beam. Appl Opt (2007) 46(20):4197–201. doi:10.1364/ao.46.004197
34. Wong DWK, Chen G. Redistribution of the zero order by the use of a phase checkerboard pattern in computer generated holograms. Appl Opt (2008) 47(4):602–10. doi:10.1364/ao.47.000602
Keywords: computer-generated hologram, U-Net-based neural network, rectangular phase grating, diffraction order, imaging technology
Citation: Liu X, Yan X, Wang X, Jing T, Li P, Song C, Qu Q and Jiang X (2022) Generation of phase-only holograms with high-diffraction-order reconstruction by a U-Net-based neural network: A phase grating perspective. Front. Phys. 10:1048577. doi: 10.3389/fphy.2022.1048577
Received: 19 September 2022; Accepted: 07 November 2022;
Published: 05 December 2022.
Edited by:
Wenjun Liu, Beijing University of Posts and Telecommunications (BUPT), ChinaReviewed by:
Sergey Sukhov, Institute of Radio-Engineering and Electronics (RAS), RussiaCopyright © 2022 Liu, Yan, Wang, Jing, Li, Song, Qu and Jiang. This is an open-access article distributed under the terms of the Creative Commons Attribution License (CC BY). The use, distribution or reproduction in other forums is permitted, provided the original author(s) and the copyright owner(s) are credited and that the original publication in this journal is cited, in accordance with accepted academic practice. No use, distribution or reproduction is permitted which does not comply with these terms.
*Correspondence: Xingpeng Yan, eWFueHAwMkBnbWFpbC5jb20=
†These authors have contributed equally to this work and share first authorship
Disclaimer: All claims expressed in this article are solely those of the authors and do not necessarily represent those of their affiliated organizations, or those of the publisher, the editors and the reviewers. Any product that may be evaluated in this article or claim that may be made by its manufacturer is not guaranteed or endorsed by the publisher.
Research integrity at Frontiers

Learn more about the work of our research integrity team to safeguard the quality of each article we publish.