 Shixiao Li
 Yijian Xu
 Zhiyu Zhan
 Linwei Liu
 Pengfei Bai
95% of researchers rate our articles as excellent or good
Learn more about the work of our research integrity team to safeguard the quality of each article we publish.
Find out more
ORIGINAL RESEARCH article
Front. Phys. , 12 October 2022
Sec. Optics and Photonics
Volume 10 - 2022 | https://doi.org/10.3389/fphy.2022.1033076
This article is part of the Research Topic Physical Model and Applications of High-Efficiency Electro-Optical Conversion Devices, volume II View all 11 articles
As a representative of new reflective display technology, the electrowetting display (EWD) has been widely accepted for its good advantages in power consumption control and display contrast. Because of charge trapping and contact angle hysteresis, static images cannot be maintained and afterimage phenomenon occurs, respectively. These problems seriously affect the EWDs display effect. In order to improve the video display effect of EWDs, an alternating current (AC) driving model was proposed in this paper. Firstly, a high integration EWDs system was built with Xilinx field programmable gate array (FPGA). Secondly, an asymmetric intermediate frequency (IF) AC driving model was proposed to eliminate the afterimage of the video. Finally, the optimized driving method was applied to the EWDs system to achieve a high-smooth display output. The experimental results showed that the problem of afterimage and the problem of static image preserving display were effectively solved. Compared with the traditional AC driving waveform, the maximum reflected luminance of the proposed method was increased by 14%, and the refresh rate of EWDs could reach 60 Hz.
Video information acquisition has become one of the important sources for people’s daily life. The emergence of technologies such as liquid crystal displays (LCD), Organic Light-Emitting Diode (OLED), and electrophoretic paper displays (EPD) provides more convenience for information interaction [1–3]. In addition to the size and resolution of display devices, people have higher requirements, and reading comfort is gradually concerned. Because of the reflective display, the electronic paper display has the advantages of paper reading experience and low power consumption and is soon widely used. As a representative of the reflective display, EPD enters people’s field of vision in the form of electronic tags, electronic books, electronic notebooks, etc. Currently, the response speed of EPD is still too slow to play video smoothly [4]. The EWD is expected to become a new member of the display family due to its fast response speed, and paper-like reflective display [5]. As a result, many scholars have paid attention to EWDs for obtaining better paper-like display and video display performance in recent years.
The EWD technology was first proposed in 1981 and successfully applied in 2003 [6, 7]. In recent years, a pulse width modulated (PWM) square wave has been used as the EWDs drive waveform [4]. However, this driving waveform could cause some defects such as contact angle hysteresis [8], oil splitting [9], and charge trapping problems [10]. The contact angle hysteresis problem, which caused the afterimage phenomenon when video playing, had a bad effect on the display performance in EWDs. In order to solve the problem, the alternating current (AC) driving signal was replaced by a direct current (DC) signal [11, 12]. But a symmetrical AC signal could bring about a reduction in the aperture ratio. Therefore, it was very necessary to design a reliable AC driving method. The oil backflow phenomenon occurs when a DC drive signal is continuously supplied due to the charge trapping. The oil backflow could be related to three-phase contact lines formed by oil, water, and hydrophobic insulators [13, 14]. The reset signal was introduced into the AC driving waveform to reduce the oil backflow problem [15, 16]. However, the addition of a reset signal caused a flicker problem in the video display. In order to verify the effectiveness of the EWDs driver in video playback, the design of the video display system was particularly critical. Yang designed a portable EWDs driving system that could display complex images [17]. Qian designed a real-time dynamic display system of electrowetting, which could be connected to computer signals to realize dynamic real-time display in EWDs [18]. However, the system structure was complex, and excessive the system on a chip (SOC) led to an increase in system power consumption. Therefore, it is very important to design an EWDs system with high integration.
This paper made three contributions. Firstly, a highly integrated EWDs system was designed with a high refresh rate, which could be used for the validation study of driving signals. Secondly, an asymmetric intermediate frequency (IF) AC driving mothed was proposed to solve the problem of afterimage and maintain images during video playback. Finally, the optimized driving scheme was applied to the EWDs system. Compared with the traditional DC driving model, the asymmetric IF AC driving model had a better driving display capability in terms of the video display.
Each pixel of EWDs is primarily composed of a top-plate, an indium tin oxide glass (ITO), polar liquid (NaCl solution), colored oil, pixel wall, a hydrophobic insulation layer, a lower substrate, as shown in Figure 1A [19]. An EWD is essentially an optical switch [20, 21]. It changes the wettability of the conducting liquid on the hydrophobic insulating layer by applying a voltage between the top and bottom ITO. When there is no driving voltage, the polar liquid cannot wet the surface, the oil tile on the hydrophobic insulating layer, the pixel is equivalent to an “off” state, as shown in Figure 1A. When the voltage is applied, oil is moved to a pixel corner under the action of electric field force, and the polar liquid will be moved above the hydrophobic layer. The contact angle between the polar liquid and the hydrophobic insulating layer decreases, and the aperture ratio increases. The pixel will show the color of the substrate, and the pixel is equivalent to the “on” state, as shown in Figure 1B. The Young-Lippmann equation is the basic theory of electrowetting technology [22], the relationship between oil contact angle and voltage can be obtained by the Young-Lippmann, as shown in Eq. 1.
Where V denotes the driving voltage,
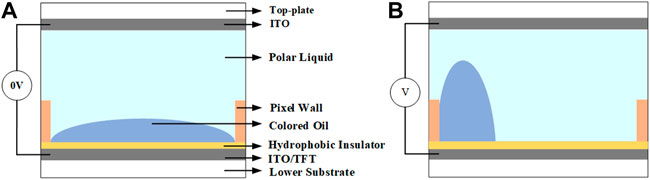
FIGURE 1. Side view of an EWD pixel structure, the pixel is equivalent to an “off” state. (A) Pixel is equivalent to an “off” state. (B) Pixel is equivalent to an “on” state.
When the porosity increases with the increase of the voltage, the contact angle is called advancing angle. On the contrary, when the aperture ratio decreases as the voltage decreases, the contact angle is called receding angle at the same driving voltage and the difference between the forward and backward angles is the contact angle hysteresis in EWDs [11]. The square waveform is applied during the driving process to keep the aperture ratio, this method can not only shorten the response time but also improved the oil splitting [25]. When the driving voltage increases to a maximum, the oil will be shrank completely in corners, the aperture ratio cannot be larger. When a constant voltage is applied, the contracted oil cannot be kept in a stable state due to charge trapping, and oil backflow could be caused due to an imbalance between Laplace pressure and Maxwell pressure at the three-phase contact line [26]. The aperture ratio is less affected by oil backflow, the value of aperture ratio can be calculated by Eq. 3.
Where
As shown in Figure 2, a highly integrated EWDs system needed FPGA to complete signal acquisition and processing, and complete EWDs driving. Firstly, the personal computer (PC) signal was received by the FPGA through the high-definition multimedia interface (HDMI) interface, then the time minimized differential signal (TMDS) was converted into a red-green-blue (RGB) signal, and finally the RGB signal was converted into corresponding driving signals and output to an EWD.
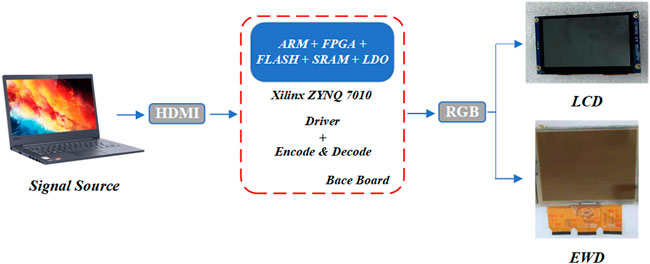
FIGURE 2. Schematic diagram of the driving system for the EWD. HDMI signal is directly converted into RGB signal by the system and output to an LCD and an EWD.
This system realized the conversion of TMDS in FPGA, and could adapt to input signals of any resolution, which provided convenience for EWD. In addition, an adaptive resolution signal output function was added to the system, which could be adapted according to different sizes of EWDs.
A ZYNQ 7010 chip was used by the EWDs system as the control processing chip of the system. This chip integrated a feature-rich dual core ARM based processing system (PS) and a Xilinx programmable logic (PL). As shown in Figure 3, the EWDs system consisted of a power module, a core control module, an EWD, and a base board. The base board had rich interfaces which connected various modules. In addition, there were two HDMI interfaces on the base board, which realized the input and output of HDMI signals. The power module could output +20 V, -20 V, +15 V, -15 V, +5 V, and +3.3 V to provide power for each module. An LCD with a resolution of 800 × 480 was used as an output device to display the RGB signal converted by the FPGA, which was used as a signal monitor. A single-color EWD with a resolution of 640 × 480 was used as the testing screen of this system. Because the driving signal had the same effect on EWDs of each color channel, this system chose a single-color EWD as the testing device. The core control module consisted of ZYNQ 7010, flash memory, static random-access memory (SRAM), and low dropout regulator (LDO). As shown in Figure 3, the highly integrated display system consisted of HDMI interfaces, a power module, an LCD, an FPGA module, and an EWD. The data conversion functions and display driver functions were completed on the FPGA.
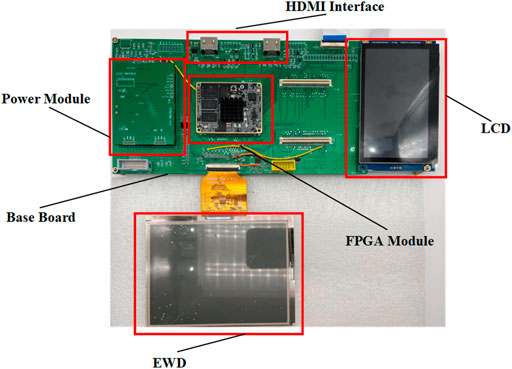
FIGURE 3. A physical figure of the driving system for EWDs.
The TMDS was converted and decoded using the PL part, and the display function was implemented in the PS part. The TMDS conversion part was mainly composed of a ZYNQ7 processing system module, a video direct memory access (VDMA), a video timing controller (VTC), a stream to video out, and a digital visual interface (DVI) to an RGB video decoder.
The TMDS was converted to a RGB signal for providing data to EWDs. Display functions included a cropping mode and an adaptive resolution mode. As shown in Figure 4, it is an EWD in different display modes. As shown in Figure 4A, this is an EWD in a cropping mode, and Figure 4C is the enlarged detail of Figure 4A. Part of the computer signal is displayed on the EWD. Figure 4B shows an EWD in an adaptive resolution mode, and Figure 4D is the enlarged detail of Figure 4B, showing the whole content of the computer signal. In the cropping mode, the signal input by PC was directly cropped and displayed. And then, the EWD cropped into an 800 × 480 image and output to the display module.
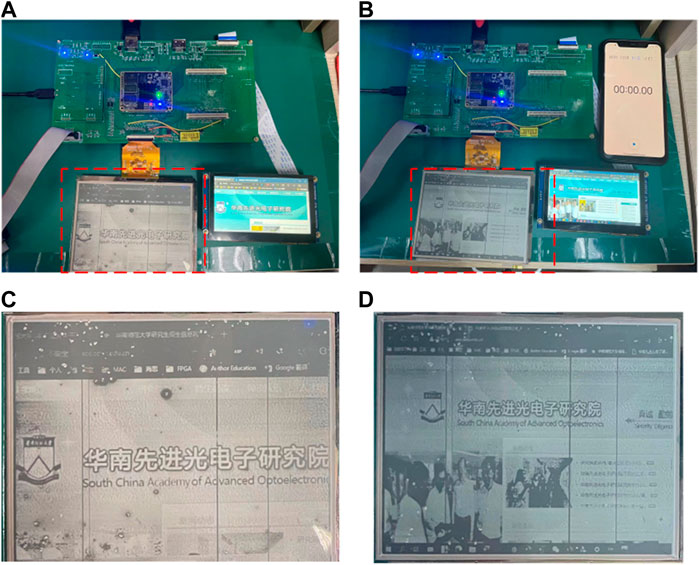
FIGURE 4. An EWD in different modes. (A) The EWD in the cropping mode. (B) The EWD in the adaptive resolution mode. (C) Is the enlarged detail of (A). (D) Is the enlarged detail of (B).
Since the EWD and LCD resolutions were inconsistent, the display signal needed to be further converted to synchronize the display. In the case of 800 × 480 resolution, the image signal was further cropped to 640 × 480 resolution and output to the EWD. The LCD directly received signals with a resolution of 800 × 480. The EWD refresh rate was 60 Hz in cropping mode, and the EWD refresh rate was 30 Hz in adaptive resolution mode, which was determined by the input source refresh rate and the driver chip.
The adaptive resolution method was calculated by PS, the maximum input resolution was 1920 × 1,080, and the output minimum resolution was 480 × 272. In this experiment, the input resolution was 1,280 × 720, and the output resolution was 800 × 480. The bilinear interpolation was adopted by adaptive resolution mode to achieve picture scaling. As shown in Figure 5, four pixels
Where
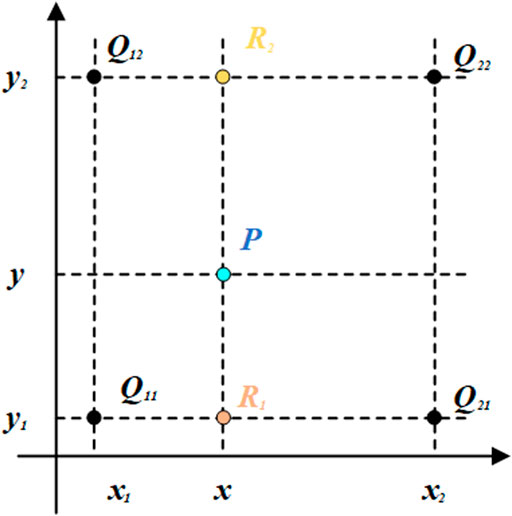
FIGURE 5. Bilinear interpolation algorithm.
This system adopted the driver chip of ULTRACHIP Company, which integrated modules such as a source controller, a gate controller and a memory. The thin film transistor electrowetting displays (TFT-EWD) underlying voltage driving is controlled by a TFT controller with a gate and a source. The pixel voltage was controlled by source and gate controllers [29].
In order to reduce the occupancy of FPGA resources and reduce the low latency of the display, the instant transfer method was adopted. A line of 24-bit data was split into three lines of 8-bit data corresponding to the color data of red (R), green (G), and blue (B) channels. In our experiments, only one channel of color data was extracted as the test-driving display signal. A row of 8-bit data was written into the first input first output (FIFO), and then, the loading was ready, the data was read out from the FIFO and transmitted to the source controller as source data. Source data cooperated with gate control signals to control EWDs. Instant transport and ping-pong operations use two blocks of memory to alternately input and output data, reducing the consumption of SRAM resources [30].
The oil backflow phenomenon occurs when a DC driving signal was continuously supplied due to the trapped charge. Yi summarized the advantages of unbalanced AC driving waveform, and the reset signal played an important role in suppressing oil backflow [31]. However, the appearance of the reset signal caused flickers. An asymmetric intermediate frequency AC driving scheme was proposed in this paper to solve this problem. In this paper, the frequency of the AC driving waveform was increased to realize the charge switching to maintain the state of oil, to achieve the effect of maintaining grayscales. It was known in several literatures that oil was millisecond-level responsive [32–34]. Therefore, the transformation of the driving signal was carried out at the frequency of microsecond level by us. Through experimental tests, it was found that the aperture ratio of the forward voltage was greater than the aperture ratio of the negative voltage under the same voltage [15]. Therefore, the aperture ratio obtained by adjusting the negative voltage was consistent with the aperture ratio of the positive voltage.
As shown in Figure 6,
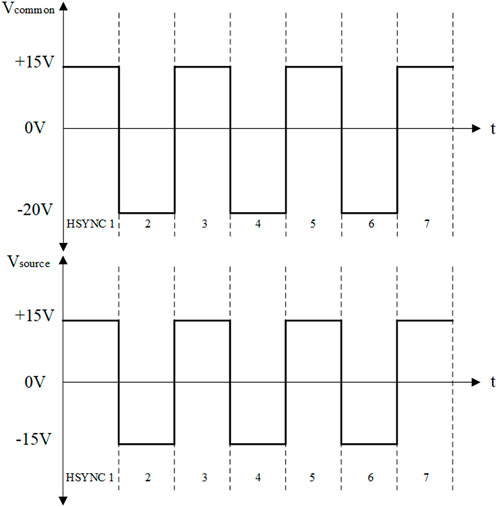
FIGURE 6. The proposed driving model.
In order to test the validity of the driving waveform, two test platforms were built. Figure 7A was a luminance test platform for testing the reflectivity of EWDs. Figure 7B was the aperture rate test platform. (a) was a computer for receiving and processing data. (b) was a colorimeter for detecting EWDs reflected luminance. (c) was an EWD screen. (d) was an EWD driving system. (e) was a microscope for observing the EWDs pixel structure.
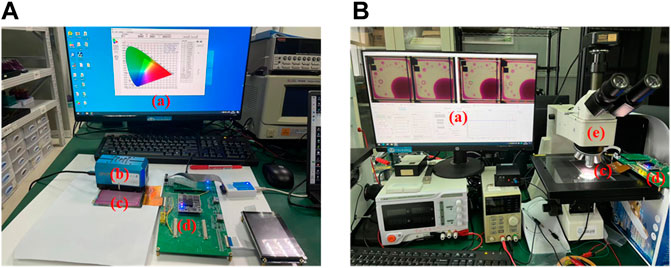
FIGURE 7. Experimental platforms for driving EWDs. (A) A luminance test platform. (B) An aperture test platform. (a) A computer (b) A colorimeter (c) An EWD (d) An EWD driving system (e) A microscope.
In order to evaluate which DC driving signal has the best display consistency, we tested the aperture ratios under four DC driving waveforms. The EWD switched between “on” and “off” every second interval. As shown in Table 1 and Figure 8, in the case of the maximum value, the aperture ratio at +15 V was 12.33% larger than that of -15 V, and in the case of the average value, the aperture ratio at +15 V was 9.71% larger than -15 V. In the case of the maximum value, the aperture ratio at +20 V was 13.62% larger than -20 V. In the case of the average value, the aperture ratio at +20 V was 8.13% larger than that -20 V. It could be seen from Table 1 that the average value of -20 V in the “on” state and “off” state was close to +15 V, so the asymmetric AC driving was feasible.
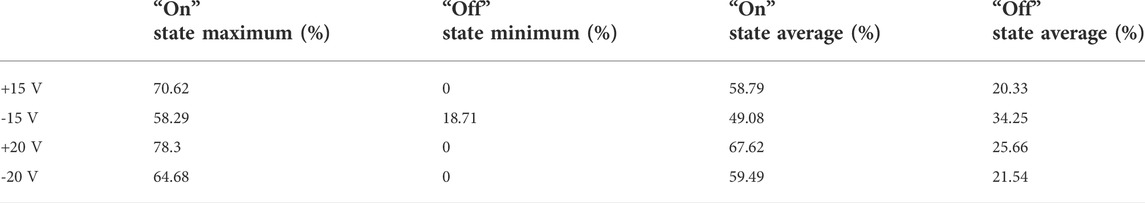
TABLE 1. The aperture ratio of different voltages in different states.
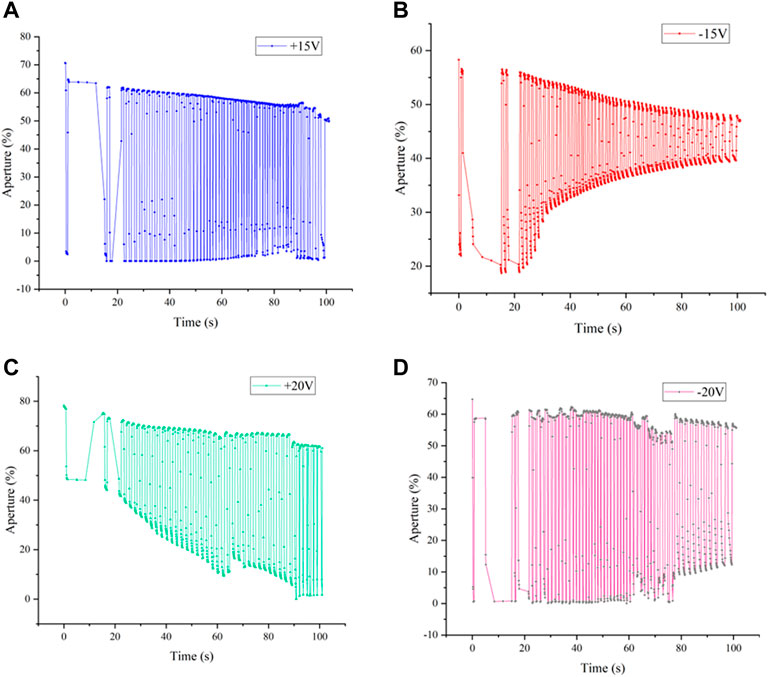
FIGURE 8. Aperture ratio with DC driving. (A) Aperture ratio with +15 V DC driving. (B) Aperture ratio with -15 V DC driving. (C) Aperture ratio with +20 V DC driving. (D) Aperture ratio with -20 V DC driving.
In order to demonstrate the feasibility of asymmetric AC driving, the EWD aperture ratio experiment by AC driving was carried out. As could be seen from Figure 9C, the +20 V and -15 V asymmetric AC driving combination was not feasible. It could be seen from Figure 9 that the asymmetrical AC driving composed of +15 V and -20 V had the largest difference in aperture ratio when the same signal was provided. It was proved that the +15 V and -20 V asymmetric AC driving combination had a higher contrast in the image display process than other combinations.
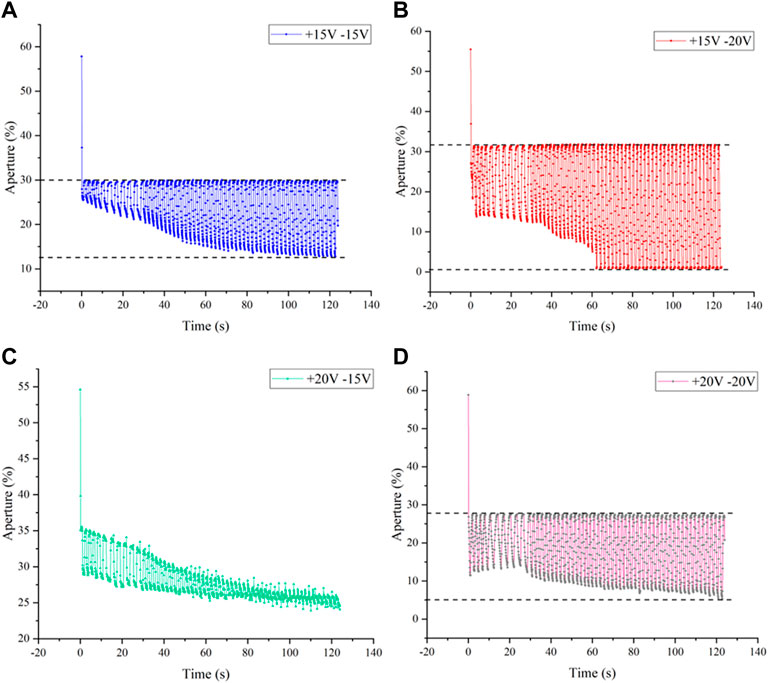
FIGURE 9. Aperture ratio with AC driving. (A) Aperture ratio with AC driving composed of +15 V and -15 V. (B) Aperture ratio of AC driving composed with +15 V and -20 V. (C) Aperture ratio with AC driving composed of +20 V and -15 V. (D) Aperture ratio with AC driving composed of +20 V and -20 V.
In the reflected luminance test experiment, the display characteristics of the four combinations of driving waveforms were also different. It could be seen from Figure 10 that the maximum luminance of the asymmetric voltage driving waveform could reach 60.67 absorbance unit (a.u.) in the “on” state under the condition of +15 V and -20 V, and the minimum luminance was 43.69 a. u. In “off” state. Compared with driving waveforms under other voltages, the difference in luminance between the “on” state and the “off” state of the +15 V and -20 V driving waveform was the largest. The average luminance of the +15 V and -15 V driving waveform was lower than that of the +15 V and -20 V driving waveform. The driving waveform of +20 V and -15 V had the worst performance, and the maximum luminance could only reach 50.27 a. u. Compared with the traditional symmetrical driving waveform composed of +20 V and -20 V, the maximum luminance of the waveform of +15 V and -20 V was increased by 14%. The large jitter in the reflected luminance in Figure 10 could be caused by the reaction time of oil.
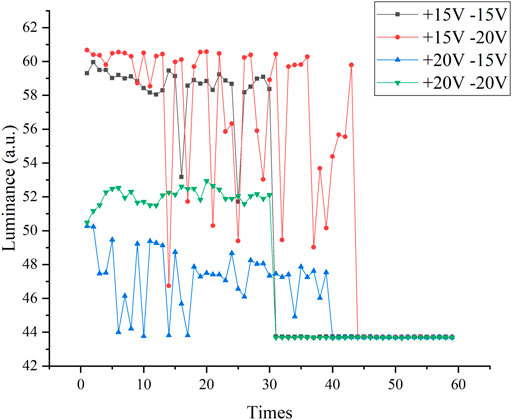
FIGURE 10. Reflected luminance of different driving voltage waveforms.
It could be seen from Figure 11 that the display image of the combination of +15 V and -20 V asymmetric AC driving had a higher display effect than other combinations, and image details were richer and the image was clearer. As shown in Figure 11B, compared with Figure 11A, Figure 11C, and Figure 11D, the details of the image marked by the red box in Figure 11B were clearer, and more details could be displayed. Compared with the DC driving waveform, as shown in the image of the area marked by the blue circle in Figure 11, the texture of Figure 11E displayed by the DC driving waveform was best, the overall contrast of the picture was higher, and the displayed content and quality would be better.
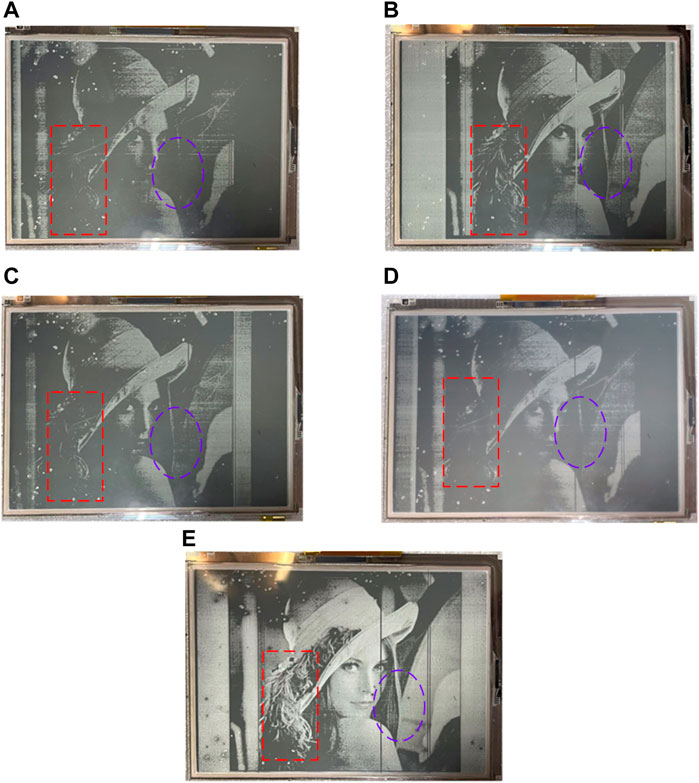
FIGURE 11. The picture of ‘Lena’ displayed on the EWD. (A) Displayed with the AC driving composed of +15 V and -15 V. (B) Displayed with the AC driving composed of +20 V and -20 V. (C) Displayed with the AC driving composed of +20 V and -15 V. (D) Displayed with the AC driving composed of +20 V and -20 V. (E) Displayed with the +15 V DC driving signal.
In order to prove the influence of AC frequency on the display effect, we tested the influence of the AC driving waveform at different frequencies on EWDs. An asymmetrical AC driving waveform of +15 V and -20 V was used by this frequency test experiment. The test video is a 1-min video of a block moving back and forth. In order to get a better display effect, the output resolution and refresh rate were set to 800 × 480 and 60 Hz respectively. According to the LCD data sheet, it was known that the LCD line scan period was about 31us. The driving frequency test was carried out in three cases where the signal was inverted every 10 lines, the signal was inverted every 30 lines, and the signal was inverted every 120 lines. The corresponding driving frequencies were 1639Hz, 543Hz, and 133 Hz. As shown in Figure 12, with the DC driving waveform, an obvious afterimage phenomenon could be observed in EWDs. In the case of 133 Hz and 543 Hz AC driving waveform, there were obvious horizontal stripes on EWDs. In the case of the 1,639 Hz AC driving waveform, the horizontal stripe phenomenon disappeared completely, and the contrast ratio was higher.
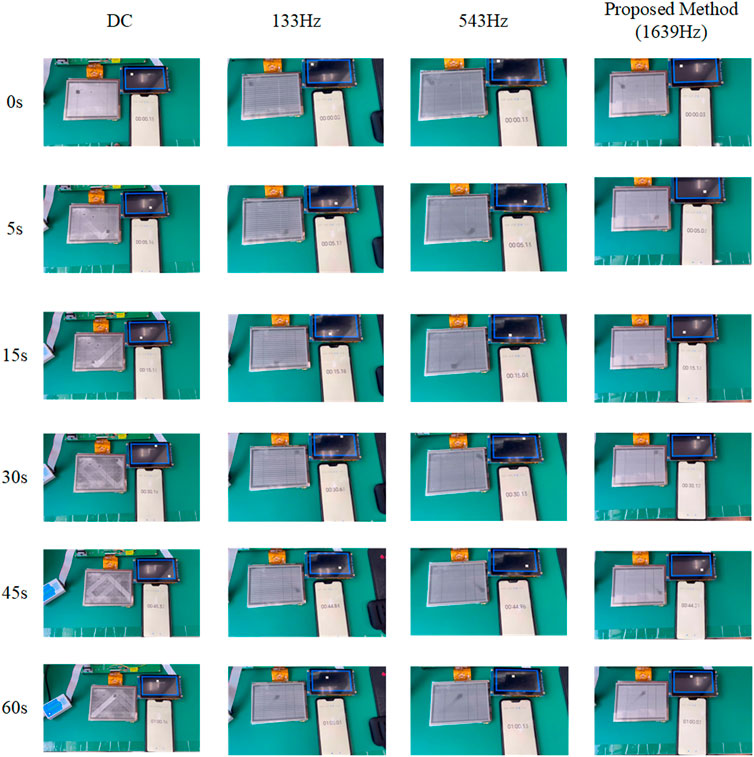
FIGURE 12. Asymmetric AC driving results at different frequencies.
The afterimage problem in EWDs was solved by the proposed method. As shown in Figure 13, when the video was played to 1 minute, the traditional method had an obvious video afterimage problem. The video sticking problem and flickering problem were effectively solved by the asymmetric IF AC driving model in this paper.
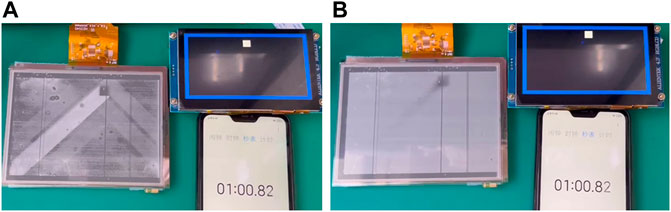
FIGURE 13. The EWD video display with different methods. (A) Traditional method (DC driving waveform). (B) Asymmetric IF AC driving model (Proposed mothed).
As shown in Figure 14, there were a lot of dead pixels and dead source lines on the screen. The EWD preparation process and production quality were the main factors affecting the current display, resulting in the appearance of dead pixels and abnormal vertical stripes, which affect the overall appearance.
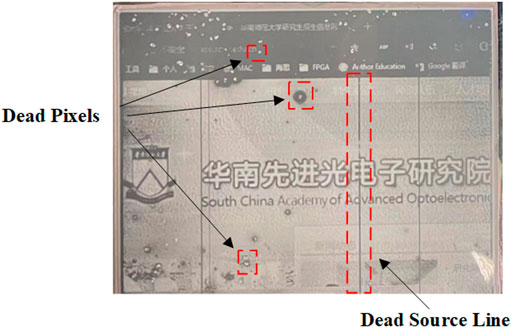
FIGURE 14. The EWD display anomaly analysis.
In this paper, an IF asymmetric signal model was designed based on AC driving model. The model was different from the conventional model in that it used the asymmetric signal of IF. It could effectively avoid the afterimage phenomenon that occurs when playing video, and the phenomenon of picture disappearance when playing static images. In addition, a highly integrated EWDs display system was designed for this model, which could display the picture transmitted by the PC in real-time through the HDMI interface. Finally, the asymmetric IF AC driving model was tested in the EWDs display system to prove its validity of the asymmetric IF AC driving model. This paper provided a reliable test solution for EWDs display drivers.
The raw data supporting the conclusions of this article will be made available by the authors, without undue reservation.
SL wrote the manuscript and performed the experiments YX assisted in manuscript revision and experimental discussion ZZ Assist in experimental discussions LL Review the revised manuscript PB Review the revised manuscript.
This research was supported by National Key R&D Program of China (No. 2021YFB3600603), Program for Guangdong Innovative and Enterpreneurial Teams (No. 2019BT02C241), Science and Technology Program of Guangzhou (No. 2019050001), Program for Chang Jiang Scholars and Innovative Research Teams in Universities (No. IRT_17R40), Guangdong Provincial Key Laboratory of Optical Information Materials and Technology (No. 2017B030301007), Guangzhou Key Laboratory of Electronic Paper Displays Materials and Devices (No. 201705030007) and the 111 Project.
The authors declare that the research was conducted in the absence of any commercial or financial relationships that could be construed as a potential conflict of interest.
All claims expressed in this article are solely those of the authors and do not necessarily represent those of their affiliated organizations, or those of the publisher, the editors and the reviewers. Any product that may be evaluated in this article, or claim that may be made by its manufacturer, is not guaranteed or endorsed by the publisher.
The Supplementary Material for this article can be found online at: https://www.frontiersin.org/articles/10.3389/fphy.2022.1033076/full#supplementary-material
1. Guo Y, Tang B, Yuan D, Bai P, Li H, Yi Z, et al. 3.1: Invited paper: Electrowetting display: Towards full-color video reflective display. SID Symp Dig Tech Pap (2021) 52(S2):59–63. doi:10.1002/sdtp.15020
2. Chen E, Lin J, Yang T, Chen Y, Zhang X, Ye Y, et al. Asymmetric quantum-dot pixelation for color-converted white balance. ACS Photon (2021) 8(7):2158–65. doi:10.1021/acsphotonics.1c00596
3. Hu X, Cai J, Liu Y, Zhao M, Chen E, Sun J, et al. Design of inclined omni-directional reflector for sidewall-emission-free micro-scale light-emitting diodes. Opt Laser Tech (2022) 108335. doi:10.1016/j.optlastec.2022.108335
4. Yi Z, Shui L, Wang L, Jin M, Hayes RA, Zhou G. A novel driver for active matrix electrowetting displays. Displays (2015) 37:86–93. doi:10.1016/j.displa.2014.09.004
5. Li W, Wang L, Henzen A. A multi waveform adaptive driving scheme for reducing hysteresis effect of electrowetting displays. Front Phys (2020) 8. doi:10.3389/fphy.2020.618811
6. Beni G, Hackwood S. Electro‐wetting displays. Appl Phys Lett (1981) 38(4):207–9. doi:10.1063/1.92322
7. Hayes RA, Feenstra BJ. Video-speed electronic paper based on electrowetting. Nature (2003) 425(6956):383–5. doi:10.1038/nature01988
8. Gao J, Mendel N, Dey R, Baratian D, Mugele F. Contact angle hysteresis and oil film lubrication in electrowetting with two immiscible liquids. Appl Phys Lett (2018)(20) 203703. doi:10.1063/1.5034510
9. Bansal S, Sen P. Effect of electrowetting induced capillary oscillations on coalescence of compound droplets. J Colloid Interf Sci (2018) 530:223–32. doi:10.1016/j.jcis.2018.05.090
10. Ounnunkad K, Patten HV, Velický M, Farquhar AK, Brooksby PA, Downard AJ, et al. Electrowetting on conductors: Anatomy of the phenomenon. Faraday Discuss (2017) 199(0):49–61. doi:10.1039/C6FD00252H
11. Wang L, Zhang H, Li W, Li J, Yi Z, Wan Q, et al. Driving scheme optimization for electrowetting displays based on contact angle hysteresis to achieve precise gray-scales. Front Phys (2021) 9. doi:10.3389/fphy.2021.655547
12. Li F, Mugele F. How to make sticky surfaces slippery: Contact angle hysteresis in electrowetting with alternating voltage. Appl Phys Lett (2008)(24) 244108. doi:10.1063/1.2945803
13. Yi Z, Zhang H, Zeng W, Feng H, Long Z, Liu L, et al. Review of driving waveform for electrowetting displays. Front Phys (2021) 9. doi:10.3389/fphy.2021.728804
14. Mukherjee S, Smith N, Goulding M, Topping C, Norman S, Liu Q, et al. A first demonstration and analysis of the biprimary color system for reflective displays. J Soc Inf Disp (2014) 22(2):106–14. doi:10.1002/jsid.225
15. Zhang T, Deng Y. Driving waveform design of electrowetting displays based on a reset signal for suppressing charge trapping effect. Front Phys (2021) 9. doi:10.3389/fphy.2021.672541
16. Lin S, Zeng S, Qian M, Lin Z, Guo T, Tang B. Improvement of display performance of electrowetting displays by optimized waveforms and error diffusion. J Soc Inf Disp (2019) 27(10):619–29. doi:10.1002/jsid.790
17. Yang G, Liu L, Zheng Z, Henzen A, Xi K, Bai P, et al. A portable driving system for high‐resolution active matrix electrowetting display based on fpga. J Soc Inf Disp (2019) 28(3):287–96. doi:10.1002/jsid.854
18. Qian M, Lin S, Zeng S, Lin Z, Guo T, Tang B. Real-time dynamic driving system implementation of electrowetting display. Opto-Electronic Eng (2019) 46(6):180623–19. doi:10.12086/oee.2019.180623
19. Wu H, Hayes RA, Li F, Henzen A, Shui L, Zhou G. Influence of fluoropolymer surface wettability on electrowetting display performance. Displays (2018) 53:47–53. doi:10.1016/j.displa.2018.02.002
20. Duan MZ, Hayes RA, Zhang X, Zhou GF. A reflective display technology based on electrofluidics. Appl Mech Mater (2014) 670:976–81. doi:10.4028/www.scientific.net/amm.670-671.976
21. Roques-Carmes T, Hayes RA, Schlangen LJM. A physical model describing the electro-optic behavior of switchable optical elements based on electrowetting. J Appl Phys (2004) 96(11):6267–71. doi:10.1063/1.1810192
22. Seveno D, Blake TD, De Coninck J. Young's equation at the nanoscale. Phys Rev Lett (2013) 111(9):096101. doi:10.1103/PhysRevLett.111.096101
23. Zeng W, Yi Z, Zhao Y, Zeng W, Ma S, Zhou X, et al. Design of driving waveform based on overdriving voltage for shortening response time in electrowetting displays. Front Phys (2021) 9. doi:10.3389/fphy.2021.642682
24. Dou Y, Chen L, Li H, Tang B, Henzen A, Zhou G. Photolithography fabricated spacer arrays offering mechanical strengthening and oil motion control in electrowetting displays. Sensors (Basel) (2020) 20(2):494. doi:10.3390/s20020494
25. Long Z, Yi Z, Zhang H, Lv J, Liu L, Chi F, et al. Toward suppressing oil backflow based on a combined driving waveform for electrowetting displays. Micromachines (Basel) (2022) 13(6):948. doi:10.3390/mi13060948
26. Liu L, Wu Z, Wang L, Zhang T, Li W, Lai S, et al. Clinical features of hepatocellular carcinoma with Hepatitis B virus among patients on Nucleos(t) ide analog therapy. Infect Agent Cancer (2020) 15:8. doi:10.1186/s13027-020-0277-y
27. Verheijen HJJ, Prins MWJ. Reversible electrowetting and trapping of charge: Model and experiments. Langmuir (1999) 15(20):6616–20. doi:10.1021/la990548n
28. Zhu J, Cheng M, Wang Q, Yuan H, Cai Z. Grape leaf black rot detection based on super-resolution image enhancement and deep learning. Front Plant Sci (2021) 12:695749. doi:10.3389/fpls.2021.695749
29. Yi Z, Liu L, Wang L, Li W, Shui L, Zhou G. A driving system for fast and precise gray-scale response based on amplitude-frequency mixed modulation in tft electrowetting displays. Micromachines (Basel) (2019) 10(11):732. doi:10.3390/mi10110732
30. Li Y, Gang J. Development of art and culture creative industry using fpga and dynamic image sampling. Wireless Commun Mobile Comput (2021) 2021:1–7. doi:10.1155/2021/6639045
31. Liu L, Bai P, Yi Z, Zhou G. A separated reset waveform design for suppressing oil backflow in active matrix electrowetting displays. Micromachines (Basel) (2021) 12(5):491. doi:10.3390/mi12050491
32. Yi Z, Liu L, Wang L, Li W, Shui L, Zhou G. A driving system for fast and precise gray-scale response based on amplitude–frequency mixed modulation in tft electrowetting displays. Micromachines (2019) 10(11):732. doi:10.3390/mi10110732
33. Yi Z, Feng W, Wang L, Liu L, Lin Y, He W, et al. Aperture ratio improvement by optimizing the voltage slope and reverse pulse in the driving waveform for electrowetting displays. Micromachines (2019) 10(12):862. doi:10.3390/mi10120862
Keywords: high integration, electrowetting display (EWD), intermediate frequency (IF), asymmetric, alternating current (AC)
Citation: Li S, Xu Y, Zhan Z, Liu L and Bai P (2022) A high integration electrowetting displays system based on AC driving model. Front. Phys. 10:1033076. doi: 10.3389/fphy.2022.1033076
Received: 31 August 2022; Accepted: 26 September 2022;
Published: 12 October 2022.
Edited by:
Qiang Xu, Nanyang Technological University, SingaporeCopyright © 2022 Li, Xu, Zhan, Liu and Bai. This is an open-access article distributed under the terms of the Creative Commons Attribution License (CC BY). The use, distribution or reproduction in other forums is permitted, provided the original author(s) and the copyright owner(s) are credited and that the original publication in this journal is cited, in accordance with accepted academic practice. No use, distribution or reproduction is permitted which does not comply with these terms.
*Correspondence: Pengfei Bai, YmFpcGZAc2NudS5lZHUuY24=
Disclaimer: All claims expressed in this article are solely those of the authors and do not necessarily represent those of their affiliated organizations, or those of the publisher, the editors and the reviewers. Any product that may be evaluated in this article or claim that may be made by its manufacturer is not guaranteed or endorsed by the publisher.
Research integrity at Frontiers
Learn more about the work of our research integrity team to safeguard the quality of each article we publish.