 Guo-Rong Xing
94% of researchers rate our articles as excellent or good
Learn more about the work of our research integrity team to safeguard the quality of each article we publish.
Find out more
ORIGINAL RESEARCH article
Front. Phys. , 23 December 2020
Sec. Social Physics
Volume 8 - 2020 | https://doi.org/10.3389/fphy.2020.587483
This article is part of the Research Topic Mathematical modelling of the pandemic of 2019 novel coronavirus (COVID-19): Patterns, Dynamics, Prediction, and Control View all 34 articles
On the eve of the Spring Festival in 2020, the coronavirus disease 2019 (COVID-19) was reported. Subsequently, the Chinese government at all levels took emergency measures to control the spread of COVID-19 among people. Guangdong and Hunan are large population floating provinces. The spread of COVID-19 is affected by population migration. Before the Spring Festival, Guangdong and Hunan Provinces dominated population export and import, respectively; after the Spring Festival, the trend of population flow was reversed by the resumption of work. Taking Guangdong and Hunan as examples, we establish a three-stage dynamical model to study the impact of population migration on the spread of COVID-19. The result reveals that Guangdong Province mainly emigrated the population and the scale of infection was reduced before the Spring Festival. However, the situation in Hunan Province was just the opposite. After the Spring Festival, work resumption was taking place across China and the migration of Guangdong may cause a second outbreak of the epidemic. While people in Hunan leave the province to work, the migration of population will have little effect on the spread of COVID-19.
At the end of 2019, unknown pneumonia was reported. The World Health Organization (WHO) officially named the new coronavirus as COVID-19 on February 11, 2020 [1, 2]. The main transmission routes of COVID-19 are direct transmission, aerosol transmission, and contact transmission [3]. Early, Li et al. analyzed the data of 425 confirmed cases in Wuhan to determine the epidemiological characteristics of NCIP [4]. As the time of the outbreak is approaching the Spring Festival, passenger traffic from Wuhan to all parts of the country was large, which caused the rapid spread of COVID-19. In order to control the epidemic effectively, the Chinese government took the lockdown strategy in Wuhan on January 23 [5]. Everyone who came from Hubei Province has to be registered and then quarantined at home for 14 days. The flights, railways, and highways taken by people from Wuhan were closely followed up and announced in detail after registration. In order to control the spread of COVID-19, the government took a series of measures, such as prohibiting all transport in and out [6, 7] and disinfecting and taking body temperature in public places. For individuals, people must wear their own masks when going out.
At present, the epidemic is still spreading globally. Many research teams have been studying the impact of COVID-19 transmission in real time. The study of dynamical modeling to predict the epidemic rule plays an important role in disease control [8–11]. Typically, Li et al. analyzed the impact of different lockdown time in Wuhan on the transmission of COVID-19 in Shanxi Province [12]. Tang et al. focused on the time to resume work and assessed the risk of the epidemic [13–15]. Furthermore, Huang et al. predicted the trend of COVID-19 and calculated the parameters of this epidemic [16]. Moreover, lots of scholars established dynamical modeling to analyze the influence of different quarantine measures on the spread of COVID-19 [17–19]. For example, Gao et al. established dynamical modeling showing that the epidemic was controlled by reducing the contact rate [20]. Some works were dedicated to assessing the effectiveness of epidemic prevention and control measures [21–23]. Meanwhile, great academics have discussed the issue of media raising awareness of epidemic prevention and control [24, 25].
For the provinces with a large flow of people, Guangdong and Hunan naturally attract great attention from society. Compared with other provinces in China, Guangdong Province has the largest number of migrant people. We collected data on reported confirmed cases of COVID-19 in Guangdong from January 19 to March 11 released by the Health Commission of Guangdong Province [26]. Figure 1 illustrates the time series of confirmed COVID-19 cases in Guangdong Province. On January 19, the National Health Commission verified the first confirmed case of pneumonia with imported COVID-19 infection in Guangdong Province. Guangdong Province initiated the first-level emergency response on January 23. Figure 1 shows that the peak of daily new confirmed cases is 127 cases on January 31, and the epidemic will disappear at the end of February. Based on Baidu migration data [27], Figure 2 indicates the number of migrant people in Guangdong and Hunan around the Spring Festival proportion. Before the Spring Festival, most of the people of Hunan Province immigrated from Guangdong, Hubei, and Jiangxi Provinces on a large scale, among which Guangdong Province had the largest immigration population accounting for more than half of the total. However, the main emigration population of Guangdong Province flowed to Hunan Province, Guangxi Zhuang Autonomous Region, and Jiangxi Province. After the Spring Festival, work resumption was taking place across China. Most of the emigrants from Hunan Province went to work in Guangdong Province. At this time, the trend of population flow in the two provinces was opposite to that before the Spring Festival.
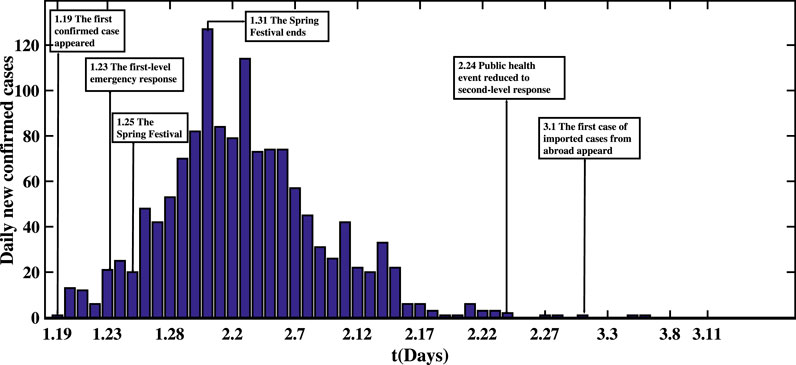
FIGURE 1. Transmission scheme of COVID-19 in Guangdong Province. Guangdong Province launched the first-level response to major health incidents on January 23 and the Spring Festival ends on January 31.
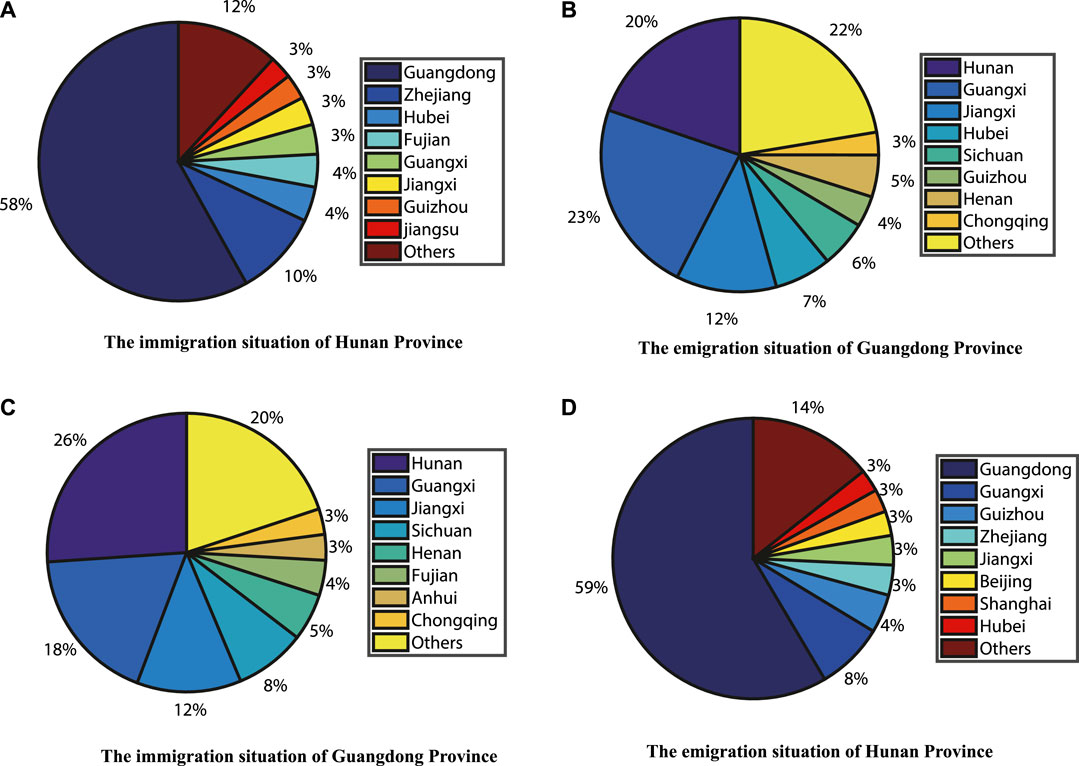
FIGURE 2. Migration of population in Hunan Province and Guangdong Province [27]. (A) The immigration situation of Hunan Province before the Spring Festival. (B) The emigration situation of Guangdong Province before the Spring Festival. (C) The immigration situation of Guangdong Province after the Spring Festival. (D) The emigration situation of Hunan Province after the Spring Festival.
In order to reflect the COVID-19 variations and describe the impact of population migration on the spread of COVID-19, we establish the corresponding dynamical modeling in three different time periods around the Spring Festival and calculate the basic reproduction number for each stage. Using the actual data published by the Health Commission, the parameters were estimated and 95
We conduct a detailed study of immigration and emigration of population, which is helpful to the prevention and control of areas with large population flows all over the world. At present, there are few teams to study the spread of COVID-19 in provinces. We not only consider the control characteristics in different provinces but also combine the features of the Spring Festival to establish multiple-stage dynamical modeling on the time scale, which can more accurately predict the development trend of the epidemic.
In our study, we use Baidu migration data to estimate the immigration and emigration rates of Guangdong and Hunan Provinces around the Spring Festival [27]. In addition, we used the information released by Guangdong and Hunan Provincial Health Commissions to collect the number of cumulative and daily new confirmed COVID-19 cases [26, 28]. According to the information released by the National Bureau of Statistics, we obtained the number of permanent residents in Guangdong and Hunan Provinces at the end of this year [29].
Based on the knowledge of COVID-19, it is necessary to establish dynamical modeling to further understand the transmission mechanism [30–33]. Most infectious diseases are studied in three parts: susceptible population, transmission route, and infected population [34–37]. According to the characteristics of COVID-19, the total population
(1) The exposed individuals
(2) The removed individuals
(3) Individuals’ birth and death rates are ignored.
In order to describe the spread of COVID-19, we establish a corresponding dynamical model based on the policies of epidemic control in Guangdong and Hunan Provinces. The following takes Guangdong Province as an example of mathematical analysis. We study the dynamic modeling in three stages. The first stage: the first confirmed case appeared until the Spring Festival (1.19–1.24). Each province has hospitals that treat and isolate cases. In order to prevent large-scale infection, the confirmed cases
Here, δ denotes the transfer rate of exposed individuals to infected individuals, so the incubation period is
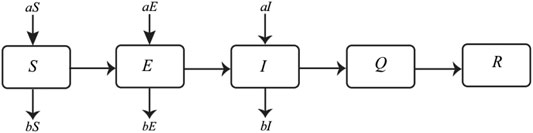
FIGURE 3. Before the Spring Festival, the flowcharts of COVID-19 infectious disease model.
The second stage: during the Spring Festival (1.24–1.30), the Guangdong Provincial Government has increased control efforts to investigate suspected cases. In addition, people’s awareness of the epidemic has gradually increased. We assume that the population has not moved across provinces during this period. The dynamical modeling (2) is as follows:
The third stage: due to the nationwide resumption of work, the population began to move across the provinces. At this stage, the prevention and control measures were quite perfect, and the relevant departments immediately quarantine infected individuals and monitor the people who are in close contact with them. The dynamical modeling Eq. (3) is as follows:
Before and after the Spring Festival, Guangdong Province was opposite to the overall population mobility of Hunan Province. In the modeling, parameters a and b are used to describe the migration situation of the two provinces (shown in Table 1).

TABLE 1. The migration relationship between Guangdong Province and Hunan Province.
Since the modeling in the three stages is roughly the same, we only conduct mathematical analysis on the first stage. Below, we calculate the basic reproduction number
By calculating the Jacobian Matrix at the disease-free state
Then,
So
If
In our study, the first stage is the early phase of the epidemic when infected individuals and exposed individuals are freely contacted with susceptible people in public places, so
Since the epidemic occurred before the Spring Festival, the initial value of the susceptible population
Similarly, we assume that the initial value of the susceptible population
In this work, we estimate the parameters m and
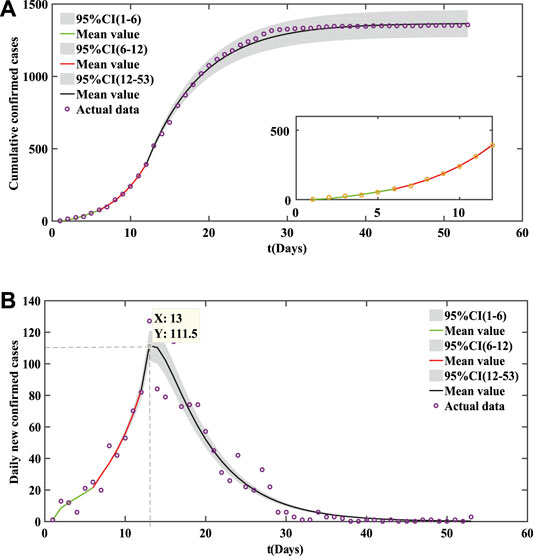
FIGURE 4. Fitting results of cumulative COVID-19 cases in Guangdong Province. (A) Cumulative confirmed cases. (B) Daily new confirmed cases. Initial value of parameter: S(0) = 1.1521 × 10⁸ [29],
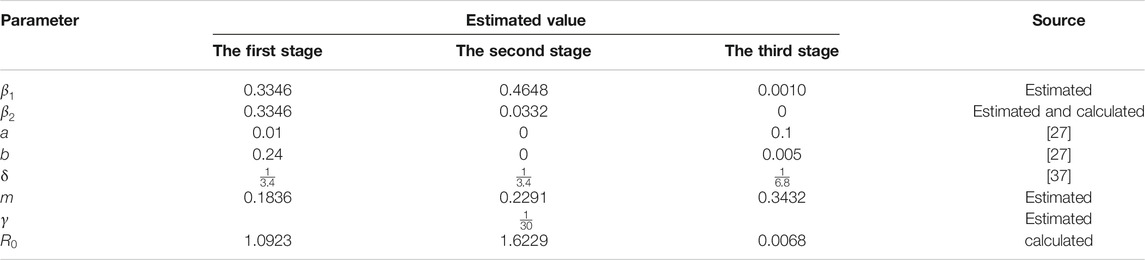
TABLE 2. Parameter estimation of COVID-19 in Guangdong Province.
Figure 5 shows the simulation results of the cumulative and the daily new confirmed cases in Hunan Province. The parameter values of the fitting result are shown in Table 3. From January 21 to February 29, the cumulative number of confirmed cases in Hunan Province reached 1018. It can be seen that the daily new confirmed cases in Hunan Province were slower than that in Guangdong Province from the simulation results. Our dynamical model indicates that the epidemic peak in Hunan Province occurred on February 2 and will disappear at the end of February.
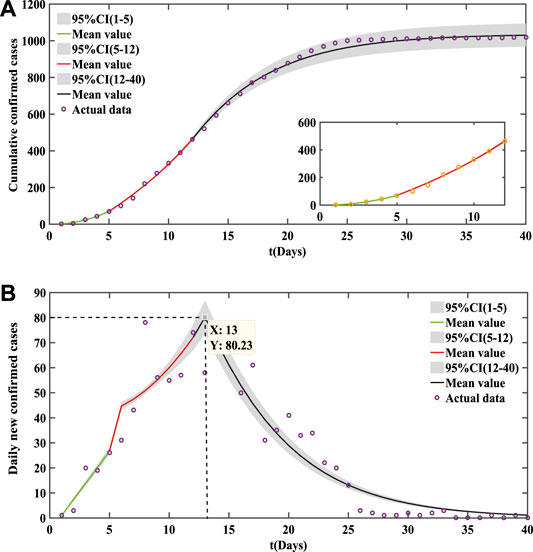
FIGURE 5. Fitting results of cumulative COVID-19 cases in Hunan Province. (A) Cumulative confirmed cases. (B) Daily new confirmed cases. Initial value of parameter: S(0) = 6.91838 × 10⁷ [29],
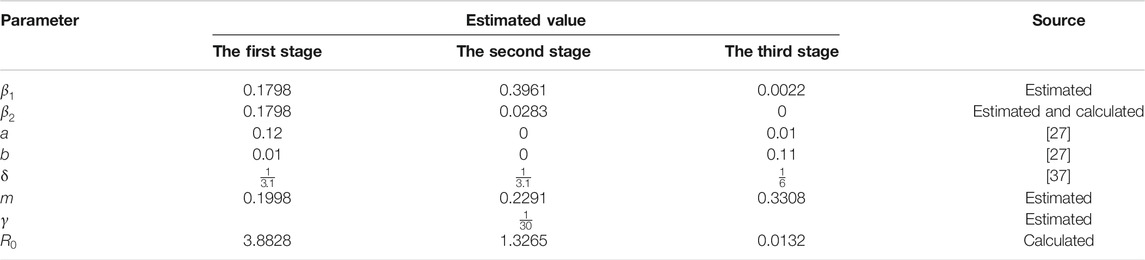
TABLE 3. Parameter estimation of COVID-19 in Hunan Province.
In order to discuss the impact of population migration around the Spring Festival on the spread of COVID-19, we analyze the parameters a (immigration rate) and b (emigration rate) of Guangdong and Hunan Provinces which have been shown in Figures 6, 7, respectively.
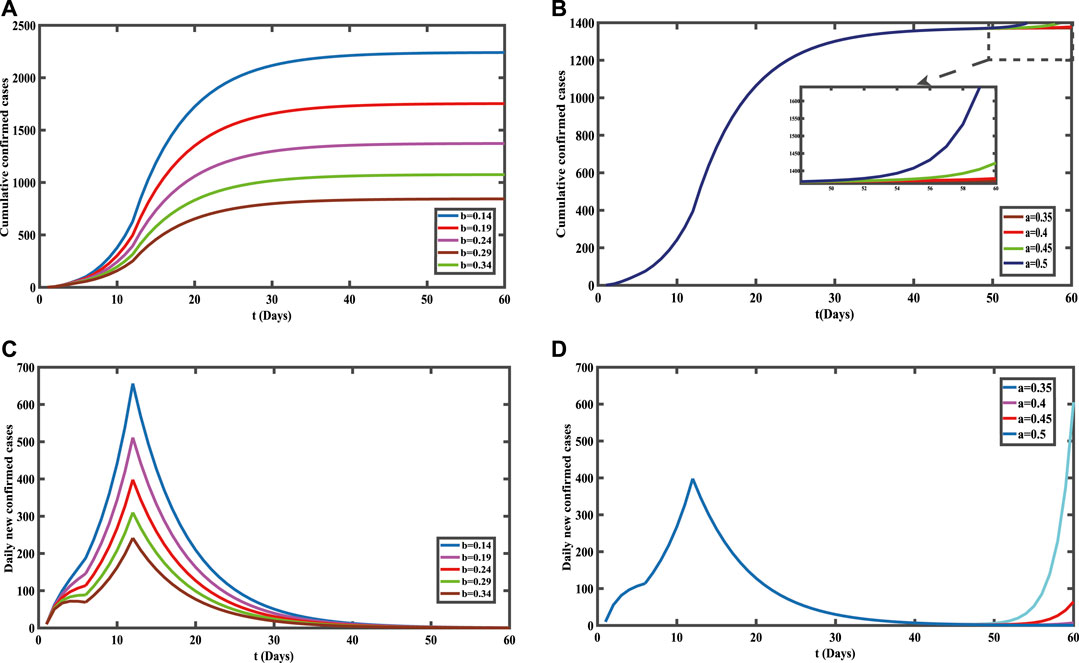
FIGURE 6. Influence of population migration on COVID-19 cases in Guangdong Province before and after the Spring Festival. (A) Cumulative confirmed cases before the Spring Festival. (B) Cumulative confirmed cases after the Spring Festival. (C) Daily new confirmed cases before the Spring Festival. (D) Daily new confirmed cases after the Spring Festival.
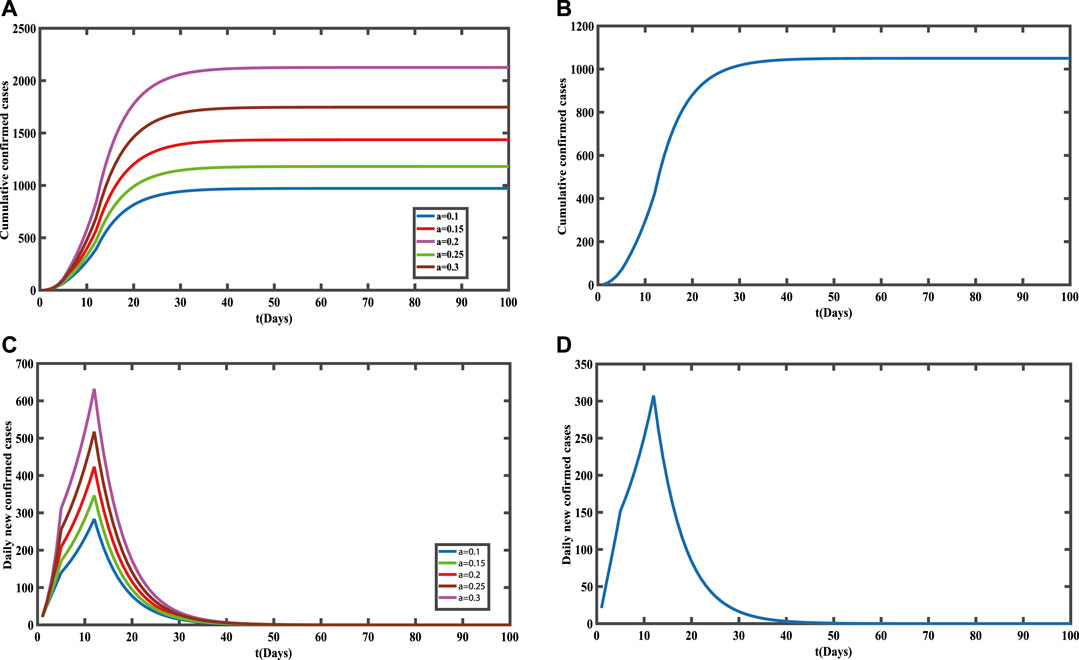
FIGURE 7. Influence of population migration on COVVID-19 cases in Hunan Province before and after the Spring Festival. (A) Cumulative confirmed cases before the Spring Festival. (B) Cumulative confirmed cases after the Spring Festival. (C) Daily new confirmed cases before the Spring Festival. (D) Daily new confirmed cases after the Spring Festival.
Due to the large number of external population in Guangdong Province, the emigration rate of the population needs to be discussed before the Spring Festival; we find that the greater the emigration rate of the population, the smaller the final scale of the cumulative confirmed cases (shown in Figure 6A) and the lower the peak value of daily new confirmed cases (shown in Figure 6C).
Through Figures 6B,D, we can see the impact of the immigration rate on the confirmed cases of COVID-19 after the Spring Festival when many industries began to resume work. As we can see, if the immigration rate is small, the final scale of confirmed cases will not change, whereas if the immigration rate is too large, the number of confirmed cases will increase with the increase of immigration rate, and the epidemic has a second outbreak. Relevant departments of Guangdong Province should strengthen the restrictions on the number of external population when resuming work.
For the population flow in Guangdong Province, Hu et al. studied the evaluation and prediction of the COVID-19 variations at different input population [40]. Both our research and that by Hu et al. draw the conclusion that there will be a risk of secondary outbreak when the input population flow is so severe that the population movement changes. Taking January 27 to February 20, 2020, as the research period, they established the
On the contrary, Hunan Province has a large number of people who work in other provinces, so we discuss the immigration rate of the population before the Spring Festival. The greater the immigration rate of the population before the Spring Festival, the larger the final scale of cumulative confirmed cases (shown in Figure 7A) and the higher the peak value of the daily new confirmed cases (shown in Figure 7C).
After the Spring Festival, people began to resume work, so Figures 7B,D show the impact of the immigration rate on the confirmed cases of COVID-19. The relationship between the emigration rate and the confirmed cases is not obvious, and the final scale tends to be stable. This indicates that the scale of the emigrated population in Hunan Province after the Spring Festival has a small impact on the spread of COVID-19, which can be understood as the epidemic has been controlled.
For the transmission of COVID-19 in Hunan Province, Jia et al. established an
Taking Hunan Province and Guangdong Province as examples, this paper uses dynamical systems to study the impact of population migration on the spread of COVID-19. We establish the
Before the Spring Festival, a large-scale population moved out of Guangdong Province, and the number of people infected with COVID-19 is decreasing. After the Spring Festival, the industries began to enter the period of resuming work, and the migrant population began to move in. If the immigrant population is too large, the disease may have a second outbreak. The Guangdong Provincial Government should restrict the entry of the population reasonably. For Hunan Province, most of the migrant workers returned home for the Spring Festival. As the Spring Festival approached, the population began to immigrate in large numbers, and the number of people infected with COVID-19 continued to rise. After the Spring Festival, population emigration has little effect on the spread of COVID-19 in Hunan Province. The larger population in Guangdong Province may be the reason why the final scale of the cumulative confirmed cases in Guangdong Province is larger than that in Hunan Province. Before the Spring Festival, a large number of people immigrated to Hunan Province, which led to a large increase in the daily new confirmed cases, indicating that the population migration before the Spring Festival accelerated the spread of COVID-19. During the Spring Festival, the growth rate of daily new confirmed cases in Guangdong Province slowed down. At the beginning of February, the daily new confirmed cases in both provinces reached a peak. Subsequently, the number of daily new confirmed cases began to decline and cleared after 40 days. That is to say, the prevention and control measures made by the country in the early stage have well controlled the development of the epidemic, and the risk of people resuming work was reduced.
This work still has many shortcomings and needs to be further improved: 1) in the early stage of the spread of COVID-19, we do not consider asymptomatic infections when establishing the
All datasets presented in this study are included in the article/Supplementary Material.
All authors have made great contributions to the writing of study and approved the submitted version. XG, LM, and SG established dynamical modeling. LM participated in the program design and provided valuable comments on the manuscript writing. LL collected and processed the relevant published data. SG and LL guided and revised the manuscript.
This study supported by the National Natural Science Foundation of China (Grant Nos. 11671241, 11801398), Program for the Outstanding Innovative Teams (OIT) of Higher Learning Institutions of Shanxi, the Natural Science Foundation for Young Scientists of Shanxi Province (Grant Nos. 201801D221003, 201801D221024), Outstanding Young Talents Support Plan of Shanxi province, and Selective Support for Scientific and Technological Activities of Overseas Scholars of Shanxi province.
The authors declare that the research was conducted in the absence of any commercial or financial relationships that could be construed as a potential conflict of interest.
1.World Health Organization. WHO statement regarding cluster of Pneumonia cases in Wuhan, China. Available from: https://www.who.int/zh/ (Accessed February 11, 2020).
2. Wang L, Gao Y-H, Lou L-L, Zhang G-J. The clinical dynamics of 18 cases of COVID-19 outside of Wuhan, China. Eur Respir J (2020). 55:2000398. doi:10.1183/13993003.00398-2020
3. Yang C, Ma Q, Zheng Y, Yang Y. Novel coronavirus transmission pathway. Chin J Prev Med (2020). 54:374–7. doi:10.1056/NEJMoa2001316
4. Li Q, Guan X, Wu P, Wang X, Zhou L, Tong Y, et al. Early transmission dynamics in Wuhan, China, of novel coronavirus-infected pneumonia. N Engl J Med (2020). 382:1199–207. doi:10.1056/NEJMoa2001316
5. Sun G-Q, Wang S-F, Li M-T, Li L, Zhang J, Zhang W, et al. Transmission dynamics of COVID-19 in Wuhan, China: effects of lockdown and medical resources. Nonlinear Dyn 101, 1–13. (2020). doi:10.1007/s11071-020-05770-9
6. Chinazzi M, Davis JT, Ajelli M, Gioannini C, Litvinova M, Merler S, et al. The effect of travel restrictions on the spread of the 2019 novel coronavirus (COVID-19) outbreak. Science (2020). 6, eaba9757. doi:10.1126/science.aba9757
7. Zhou F, Yu T, Du R, Fan G, Liu Y, Liu Z, et al. Clinical course and risk factors for mortality of adult inpatients with COVID-19 in Wuhan, China: a retrospective cohort study. Lancet (2020). 395:1054–62. doi:10.1016/S0140-6736(20)30566-310.1016/s0140-6736(20)30566-3
8. Tian J, Wu J, Wu J, Bao Y, Weng X, Shi L, et al. Modeling analysis of COVID-19 based on morbidity data in Anhui, China. Math Biosci Eng (2020). 17:2842–52. doi:10.3934/mbe.2020158
9. Feng L-X, Jing S, Jing S-L, Hu S-K, Wang D-F, Huo H-F. Modelling the effects of media coverage and quarantine on the COVID-19 infections in the UK. Math Biosci Eng (2020). 17:3618–36. doi:10.3934/mbe.2020204
10. Sun Q. Transmission dynamics of COVID-19: mathematical modelling and data fitting (2020). Available from: https://encyclopedia.pub/1358/ (Accessed July 16, 2020)
11. Peng L, Yang W, Zhang D, Zhuge C, Hong L. Epidemic analysis of COVID-19 in China by dynamical modeling. arXiv e-prints. Available from: https://arxiv.org/abs/2002.06563v1 (Accessed July 16, 2010). doi:10.1101/2020.02.16.20023465
12. Li M-T, Sun Q, Sun G-Q, Zhang J, Zhao Y, Pei X, et al. Analysis of COVID-19 transmission in Shanxi Province with discrete time imported cases. Math Biosci Eng (2020). 17:3710–20. doi:10.3934/mbe.2020208
13. He S, Tang S, Tang S, Rong L. A discrete stochastic model of the COVID-19 outbreak: forecast and control. Math Biosci Eng (2020). 17:2792–804. doi:10.3934/mbe.2020153
14. Tang S, Tang B, Bragazzi NL, Xia F, Li T, He S, et al. Analysis of COVID-19 epidemic traced data and stochastic discrete transmission dynamic model. Sci Sin Math (2020). 50:1–16. doi:10.1360/SSM-2020-0053
15. Wang X, Tang S, Chen Y, Feng X, Xiao Y, Xu Z. When will be the resumption of work in Wuhan and its surrounding areas during COVID-19 epidemic? a data-driven network modeling analysis. Sci Sin Math (2020). 50:1–10. doi:10.1360/SSM-2020-0037
16. Huang S, Peng Z, Jin Z. Studies of the strategies for controlling the COVID-19 epidemic in China: estimation of control efficacy and suggestions for policy makers. Sci Sin Math (2020). 50:885–98. doi:10.1360/SSM-2020-0043
17. Li Q, Xiao Y, Wu J, Tang S. Modelling COVID-19 epidemic with time delay and analyzing the strategy of confirmed cases-driven contact tracing followed by quarantine. Acta Math Appl Sin (2020). 43:238–50.
18. Liu Z, Magal P, Magal P, Seydi O, Webb G. Predicting the cumulative number of cases for the COVID-19 epidemic in China from early data. Math Biosci Eng (2020). 17:3040–51. doi:10.3934/mbe.2020172
19. Zhang J, Li Y, Yao M, Zhang J, Zhu H, Jin Z. Analysis of the relationship between transmission of COVID-19 in Wuhan and soft quarantine intensity in susceptible population. Acta Math Appl Sin (2020). 43:162–73.
20. Musa SS, Gao D, Zhao S, Yang L, Lou Y, He D. Mechanistic modeling of the coronavirus disease 2019 outbreak in the early phase in Wuhan. Acta Math Appl Sin (2020). 43:351–63.
21. Saldaña F, Flores-Arguedas H, Flores-Arguedas H, Ariel Camacho-Gutiérrez J, Barradas I Modeling the transmission dynamics and the impact of the control interventions for the COVID-19 epidemic outbreak. Math Biosci Eng (2020). 17:4165–83. doi:10.3934/mbe.2020231
22. Wang L, Wang J, Wang J, Zhao H, Shi Y, Wang K, et al. Modelling and assessing the effects of medical resources on transmission of novel coronavirus (COVID-19) in Wuhan, China. Math Biosci Eng (2020). 17:2936–49. doi:10.3934/mbe.2020165
23. Yan Y, Chen Y, Liu K, Luo X, Xu B, Jiang Y, et al. Modeling and prediction for the trend of outbreak of NCP based on a time-delay dynamic system. Sci Sin Math (2020). 50:385–92. doi:10.1360/SSM-2020-002610.1360/ssm-2020-0074
24. Chang X, Liu M, Liu M, Jin Z, Wang J. Studying on the impact of media coverage on the spread of COVID-19 in Hubei Province, China. Math Biosci Eng (2020). 17:3147–59. doi:10.3934/mbe.2020178
25. Zhou WK, Wang AL, Xia F, Xiao YN, Tang SY. Effects of media reporting on mitigating spread of COVID-19 in the early phase of the outbreak. Math Biosci Eng (2020). 17:2693–707. doi:10.3934/mbe.2020147
26.Health Commission of Guangdong Province. Available from: http://wsjkw.gd.gov.cn/ (Accessed July 16, 2010).
27.Baidu.com. Available from: https://qianxi.baidu.com/ (Accessed July 16, 2010).
28.Health Commission of Hunan Province. Health Commission of Hunan Province. Information on novel coronavirus pneumonia in Hunan. Available from: http://wjw.hunan.gov.cn/ (Accessed July 16, 2010).
29.National Bureau of Statistics. National data. Available from: http://www.stats.gov.cn/ (Accessed July 16, 2010).
30. Xing Y, Song L, Sun G-Q, Jin Z, Zhang J. Assessing reappearance factors of H7N9 avian influenza in China. Appl Math Comput (2017). 309:192–204. doi:10.1016/j.amc.2017.04.007
31. Sun G-Q, Xie J-H, Huang S-H, Jin Z, Li M-T, Liu L. Transmission dynamics of cholera: mathematical modeling and control strategies. Commun Nonlinear Sci Numer Simulat (2017). 45:235–44. doi:10.1016/j.cnsns.2016.10.007
32. Keeling MJ, Rohani P. Modeling infectious diseases in humans and animals Princeton, NJ: Princeton University Press (2007). p. 15–52.
34. Ma Z, Zhou Y, Wang W, Jin Z. Mathematical modeling and research of infectious disease dynamics Beijing, China: Science Press (2004). p. 1–21.
35. Li Y, Zhao S, Lou Y, Gao D, Yang L, He D. Epidemiological parameters and models of coronavirus disease 2019. Acta Phys Sin (2020). 69:090202. doi:10.7498/aps.69.20200389
36. Wang Z, Xia C, Chen Z, Chen G. Epidemic propagation with positive and negative preventive information in multiplex networks. IEEE Trans Cybern (2020). 99:1–9. doi:10.1109/TCYB.2019.2960605
37. Xia C, Wang Z, Zheng C, Guo Q, Shi Y, Dehmer M, et al. A new coupled disease-awareness spreading model with mass media on multiplex networks. Inf Sci (2019). 471:185–200. doi:10.1016/j.ins.2018.08.050
38. Driessche P, Watmough J. Reproduction numbers and sub-threshold endemic equilibria for compartmental models of disease transmission. Math Biosci (2002). 180:29–48. doi:10.1016/S0025-5564(02)00108-6
39. Guan W-j, Ni Z-y, Hu Y, Liang W-h, Ou C-q, He J-x, et al. Clinical characteristics of coronavirus disease 2019 in China. N Engl J Med (2020). 382:1708–20. doi:10.1056/NEJMoa2002032
40. Hu Z, Cui Q, Han J, Wang X, Sha W E I, Teng Z. Evaluation and prediction of the COVID-19 variations at different input population and quarantine strategies, a case study in Guangdong province, China. Int J Infect Dis (2020). 95:231–40. doi:10.1016/j.ijid.2020.04.010
41. Jia W, Han K, Song Y, Cao W, Wang S, Yang S, et al. Extended SIR prediction of the epidemics trend of COVID-19 in Italy and compared with Hunan, China. Front Med (2020). 7:169. doi:10.3389/fmed.2020.00169
42. Guo Z-G, Sun G-Q, Wang Z, Jin Z, Li L, Li C. Spatial dynamics of an epidemic model with nonlocal infection. Appl Math Comput (2020). 377:125158. doi:10.1016/j.amc.2020.125158
Keywords: COVID-19, dynamical modeling, migration, basic reproduction number, work resumption
Citation: Xing G-R, Li M-T, Li L and Sun G-Q (2020) The Impact of Population Migration on the Spread of COVID-19: A Case Study of Guangdong Province and Hunan Province in China. Front. Phys. 8:587483. doi: 10.3389/fphy.2020.587483
Received: 26 July 2020; Accepted: 28 September 2020;
Published: 23 December 2020.
Edited by:
Chengyi Xia, Tianjin University of Technology, ChinaReviewed by:
Chen Chu, Yunnan University of Finance and Economics, ChinaCopyright © 2020 Xing, Li, Li and Sun. This is an open-access article distributed under the terms of the Creative Commons Attribution License (CC BY). The use, distribution or reproduction in other forums is permitted, provided the original author(s) and the copyright owner(s) are credited and that the original publication in this journal is cited, in accordance with accepted academic practice. No use, distribution or reproduction is permitted which does not comply with these terms.
*Correspondence: Gui-Quan Sun, Sungquansun@126.com
Disclaimer: All claims expressed in this article are solely those of the authors and do not necessarily represent those of their affiliated organizations, or those of the publisher, the editors and the reviewers. Any product that may be evaluated in this article or claim that may be made by its manufacturer is not guaranteed or endorsed by the publisher.
Research integrity at Frontiers
Learn more about the work of our research integrity team to safeguard the quality of each article we publish.