 Rachid Chebbi
- Department of Chemical Engineering, American University of Sharjah, Sharjah, United Arab Emirates
The Fåhraeus and Fåhraeus-Lindqvist effects are both associated with the concentration of red blood cells (RBCs) in the core region of microvessels. The annular region is a cell-free layer. Blood flow dynamics and both effects are related to the hematocrit level profile. The aim is to propose a model for blood flow in microvessels that is not compute intensive like many other models such as those using finite element methods. Modeling blood flow requires solving for both the hematocrit level and velocity profiles as blood viscosity depends on the hematocrit level. The two-zone shear-induced model for blood flow is adopted while including an annular cell-free layer, as in the marginal zone theory and in consistency with experimental observations. In the core region, the hematocrit level is not considered to be uniform, and the concentration and viscous fluxes are equal in magnitude and opposite in directions in the fully developed velocity and concentration profiles case. The momentum and hematocrit balance equations are solved. Both analytical and numerical solutions for the velocity and hematocrit level profiles are determined. The numerical results are found to exactly match the analytical solutions, and to be in very good agreement with published experimental data for the cell-free layer thickness, the velocity profile, and the hematocrit ratio.
Introduction
Resistance to blood flow mainly occurs in the microvascular system [1]. For tubes of small diameter, RBCs concentrate in the core region, leaving a cell-free layer near the capillary wall. The apparent viscosity decreases for D as low as about 10 μm (the size of red blood cells being about 8 μm) [1]. The decrease in the tube hematocrit as compared to the discharge hematocrit is known as the Fåhraeus effect, and the drop in the apparent viscosity as the tube diameter decreases below 300 μm is termed the Fåhraeus-Lindqvist effect. The Fåhraeus [2] and Fåhraeus-Lindqvist effects [3, 4] are both associated with the concentration of red blood cells (RBCs) in the core region of microvessels, leading to lower tube hematocrit compared to the discharge hematocrit level, and to lower viscosity for vessel radius in the approximate range of 15–500 μm [5]. Further details about the two effects can be found in Fåhraeus [2], Martini et al. [3], Fåhraeus and Lindqvist [4], Fournier [5], Pries [6], Secomb and Pries [1], and Toksvang and Berg [7]. Models of blood viscosity including Newtonian and non-Newtonian models are reviewed in Hund et al. [8]. At small shear rates, aggregates of red blood cells of comparable size to the tube diameter form, and treating blood as homogeneous is improper [5]. However, shear rates are typically high, and the case of small shear rates is not a concern [5]. Using dissipation particle dynamics, Lei et al. [9] concluded that using the continuum approach is not appropriate for stress analysis for capillary diameter less than 100 μm, and suggested the change from a no-slip to a slip model along with a continuum approach. The marginal zone model introduced by Haynes [10], in which the annular zone is a cell-free layer (with all the RBCs concentrated in the core region), is extended in Fournier [5], Sharan and Popel [11], Sriram et al. [12], and Chebbi [13] with blood flow in vessel bifurcations also addressed in Chebbi [13]. The core region is assumed of uniform hematocrit level, and the two layers are treated as continuum, assuming a Newtonian fluid behavior for the core region in Fournier [5], Sharan and Popel [11], Sriram et al. [12], and Chebbi [13], and a Non-Newtonian (Quemada) rheological model in Sriram et al. [12] along with a finite-element method to solve the problem [12]. The cell-free layer (CFL) is considered of higher viscosity than plasma in Sharan and Popel [11] to account for viscous dissipation at the interface between the two layers resulting from the roughness of the interface between the two layers.
Hematocrit level gradients were accounted for by using one of the two following models:
(i) The shear-induced migration model in Weert [14] Mansour et al. [15], and Chebbi [16] using the model of Phillips et al. [17], which is an extension of a previous model by Leighton and Acrivos [18] to analyze blood flow
(ii) The elastic-stress induced migration model in Moyers-Gonzalez et al. [19], Moyers-Gonzalez and Owens [20] and Dimakopoulos et al. [21], which is an extension of a previous model by Mavrantzas and Beris [22, 23] to examine blood flow.
The models in Weert [14] and Mansour et al. [15] use the Quemada model of blood viscosity [24] and were solved using finite element methods. In contrast, the treatment in Chebbi [16] extends the Krieger-Dougherty viscosity model of viscosity, used by Phillips et al. [17] to analyze blood flow while considering analytic and numerical solutions of the ordinary differential equations governing velocity and hematocrit level gradients for the fully developed profiles case. The results are in good agreement with published velocity profiles and hematocrit ratio, and match closely with the results obtained in Weert [14] and Mansour et al. [15] using finite element methods and considering the same model of viscosity (Krieger-Dougherty viscosity model).
In contrast to the previous model [16], not including the cell-free layer, the present one includes two zones as in the marginal zone theory: an annular cell-free layer in consistency with experimental observations, and a core region. However, in contrast to models based on Haynes model [5, 11–13] including a core region of uniform hematocrit level and a CFL, the core region has a non-uniform hematocrit level in the present model, with both the shear-induced migration model and the Krieger-Dougherty model of viscosity used to find the velocity profile and the hematocrit-level variations. Both analytical and numerical solutions are provided, and the results are validated against published experimental data for the cell-free layer thickness, the velocity profile and the hematocrit ratio.
Governing Equations
Hematocrit Level Profile
The tube and discharge hematocrit levels are obtained by applying the formulas in Roselli and Diller [25] while accounting for the absence of RBCs in the cell-free layer
The limits of integration account for the cell-free layer thickness δ.
Core Region
The developments in Chebbi [16] and Phillips et al. [17] are only valid in the core region. The core zone extends from the centerline (r = 0) to r = R-δ, where δ is the cell-free layer thickness.
The RBC conservation equation for the fully developed hematocrit level and velocity profiles case yields [16]
where the concentration and viscosity hematocrit fluxes are [17]
in which a is the RBC size and σ is the shear rate [26]
Integrating Equation 3 while using the requirement that Jc and Jμ are finite at the centerline yields
The velocity profile is governed by the momentum balance [26]
where the shear stress τ is equal to the product of μ and σ. The requirement that the shear stress must be finite at r = 0 yields after integration of Equation 7 and in consistency with Fournier [5]
Combining the hematocrit balance and the momentum balance equations yields as in Chebbi [16]
Cell-Free Layer
The viscosity in the annular layer is assumed equal to the plasma viscosity. The zone is annular and extends from r = R-δ to R. The hematocrit level is zero, while the velocity profile satisfies a similar momentum balance to the one above for the core region
where μp is the plasma viscosity.
Dimensionless Equations
Viscosity Model
The viscosity of the core region is assumed to satisfy the Krieger-Dougherty model [27]
where Hm is the maximum hematocrit level.
The dimensionless velocity, radial coordinate and viscosity are defined as
Using Poiseuille equation yields the following expression for Ω as a function of the reduced apparent viscosity
Combining Equations 11 and 12 while using the definition of the average velocity yields as in Chebbi [16]
Cell-Free Layer
The dimensionless velocity profile satisfies
subject to the no-slip boundary condition
The hematocrit level is zero in the cell-free layer.
Core Region
The viscosity is hematocrit-level dependent, and the dimensionless velocity profile satisfies
subject to the velocity continuity condition at the interface between the two zones
where is the velocity at the edge of the cell-free layer.
Substituting for the viscosity expression from Equation 10 into Equation 8, gives as in Chebbi [16]
However, this is subject to the following boundary condition.
Dimensionless Expressions for Tube and Discharge Hematocrit Levels
In the cell-free layer, the hematocrit level is zero. Therefore, the integration domain extends from 0 to in the following dimensionless expressions for HT and HD obtained from Equations 1 and 2
Analytical Solution for the Hematocrit Level and Velocity Profiles
Hematocrit Level Profile
In the core region, the hematocrit level varies from Hδ to Hm. Integration of Equation 18 using the boundary condition (Equation 19) yields.
Velocity Profile
Cell-Free Layer
Integrating Equation 14 while using the no-slip boundary condition (Equation 15) gives.
Core Region
Substituting for from Equation 22 into Equation 16 and using the velocity continuity condition, Equation 17, along with Equation 23 gives
Using a Taylor series expansion for H near Hm, and integrating Equation 24 yields
where
and
Substituting for the velocity profile in the cell-free layer, Equation 23, into Equation 21 gives.
Solution Procedure
The correlation of Pries et al. [6] for the apparent blood viscosity is given by the following expression
The above equation defines F as a function of HD and vessel diameter D in μm.
The correlation of Pries et al. [6] is based on extensive data for the apparent viscosity of blood, expressed in terms of the discharge hematocrit HD and the tube diameter D. The correlation was used for calibration either directly or indirectly in a number of studies. Calibration of the CFL relative thickness in Sharan and Popel [11] was performed using the correlation of Pries et al. [6] for the apparent viscosity of blood. The same correlation was also used by Chebbi [16]. A depleted cell region with lower (but nonzero) hematocrit level was modeled in Mansour et al. [15] (Figure 3) using published results for the relative size of the CFL in Sharan and Popel [11] (also using Pries et al. correlation as mentioned above) and in Bagchi [28] (based on mesoscale simulation).
The flow rate Q affects the pressure drop ΔP according to Hagen-Poiseuille equation [5] defining the apparent viscosity
For given values of the discharge hematocrit, and capillary radius and length, higher flow rate increases the pressure drop.
The parameter n is taken equal to 1.82 as in Phillips et al. [17]. However, the values of ζ and Hm are taken as 8 and 0.85, respectively.
Combining Equations 13 and 28 yields as in [16]
To integrate Equations 16 and 18, the two unknowns and Hδ, required for integration, are calculated iteratively to satisfy both Equations 27 and 29.
Results and Conclusions
The model results are compared with published experimental and numerical results. In addition, the analytical solutions for the velocity and hematocrit level profiles are validated.
As seen from Figure 1, the present results are in very good agreement with the experimental data for the cell-free layer thickness reported in Reinke et al. [30], Pries et al. [31], and Suzuki et al. [32] as reported in Sriram et al. [12] for the case HD = 0.45. For a given discharge hematocrit level, the relative CFL thickness decreases at higher capillary radius.
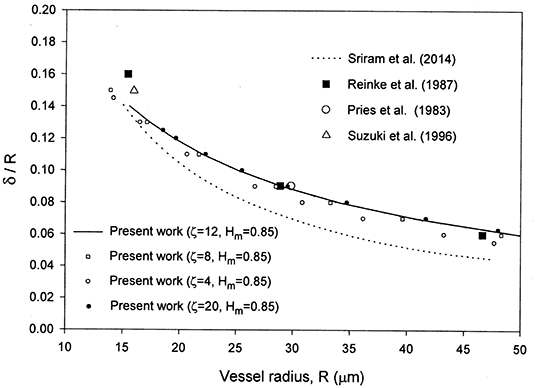
Figure 1. Comparison of the present model with the numerical results in Sriram et al. [12] and the cell-free layer thickness experimental data in Long et al. [29] reported in Sriram et al. [12] for HD = 0.45.
The velocity profile obtained is in very good agreement with the numerical results in Sriram et al. [12] and the reported experimental data of Long et al. [29] for the case HD = 0.335 and R = 27.1 μm as noticed from Figure 2. The values of and Hδ were found to be 0.096 and 0.3335, respectively. An excellent matching was found between the analytical solutions (Equations 22 and 25) and the numerical solutions both obtained using the proposed model for the velocity and hematocrit level profiles. The results are shown in Figures 2, 3. Although the matching is excellent between the present velocity profile results and those in Sriram et al. [12], there are deviations in the CFL thickness results (Figure 1). This can be understood based on the fact that the two models are different as discussed in the introduction. The differences include different rheological models, and diffusion effects included in the present model versus a uniform hematocrit level assumed in the core region in the model of Sriram et al. [12]. A peak can be seen at the origin (Figure 3), even when increasing the capillary radius from 27.1 μm to 76.0 μm. The hematocrit profiles obtained with constant parameters for the hematocrit diffusion fluxes in Mansour et al. [15] also show peaks at the origin, attributed by the authors to deformation of RBCs (not accounted for in the model [15] when using constant parameters). The concentration flux parameter Kc was selected as a function of both HD and the dimensionless radial coordinate to eliminate the peak at the origin, while using calibration as indicated in the introduction [15].
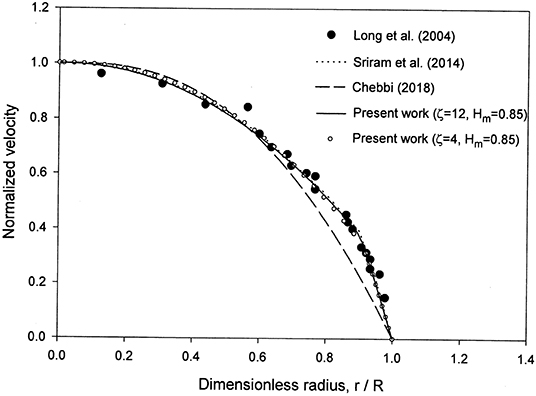
Figure 2. Comparison of the present model with the numerical results in Sriram et al. [12] and the experimental data in Reinke et al. [30], Pries et al. [31], and Suzuki et al. [32] reported in Sriram et al. [12] for the normalized velocity profile for HD = 0.335 and R = 27.1 μm.
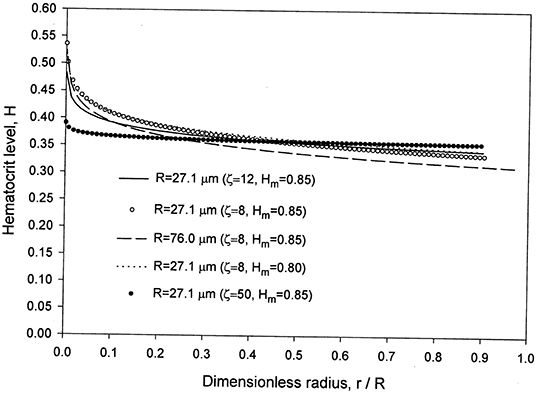
Figure 3. Present model results for the hematocrit level in the core region for HD = 0.335 and two values of R = 27.1 and 76.0 μm.
At higher radius, 76.0 μm, compared to 27.1 μm (Figure 3), the hematocrit level is lower with a lower value of the CFL relative thickness. Reducing Hm from 0.85 to 0.80 provides very close and lower values for H near the centerline with slightly higher values elsewhere for the same capillary radius R = 27.1 μm.
The present hematocrit ratio numerical results are in good agreement with the experimental data [31, 33–35] reported in [12] for the case HD = 0.405 as seen from Figure 4.
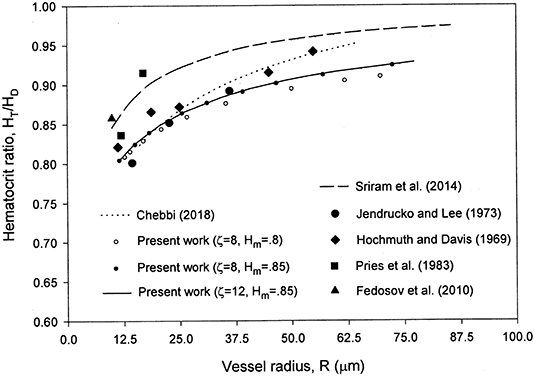
Figure 4. Comparison of the present model with the hematocrit ratio numerical results in Sriram et al. [12] and the experimental data in Pries et al. [31], Hochmuth et al. [33], Jendrucko and Lee [34], and Fedosov et al. [35] reported in Sriram et al. [12] for HD = 0.405.
The selection of ζ = 8–12 and Hm = 0.85 is based on a comparison of the results with the experimental data in Figures 1, 2, 4. Some of the results obtained are presented in those figures. Changing ζ from 8 to 4, while keeping Hm = 0.85 yields very close results for the velocity profile (Figure 2), whereas the results for the relative CFL thickness are close but less consistent with experimental data (Figure 1). Changing Hm from 0.85 to 0.8 while keeping ζ = 8 shows close values but less agreement with the experimental data for the hematocrit ratio (Figure 4). Changing ζ from 8 to 12 and 50, makes the peak region in the hematocrit profile less pronounced (Figure 3). The change of ζ from 8 to 12 has very little effect on the results for the relative cell-free layer (Figure 1) and those for the hematocrit ratio (Figure 4). The results for the velocity profile for ζ = 8 and 12 nearly coincide and only the ones for ζ = 12 are shown in Figure 2 to limit the number of curves for the sake of clarity. At high values of ζ like 20, no solution could be obtained at the lower end of the radii values (Figure 1).
The previous model of the same author [16] provides a better agreement for the hematocrit ratio with experimental data than the present one, while the present model provides excellent and better matching with experimental velocity profile data along with an overall excellent matching with experimental data for the dimensionless CFL thickness (not included in the previous model [16]).
The present model is not compute-intensive like many other models such as those using finite element methods. The two-zone model proposed in the present investigation incorporates a cell-free layer in accordance with experimental observations. In addition, concentration gradients of the RBCs in the core region are accounted for using a shear-induced model [17] along with the Krieger-Dougherty viscosity model [27]. The model results are in very good agreement with published experimental data for the cell-free layer thickness, the velocity profile, and the hematocrit ratio. Furthermore, the present analytical and numerical results for the hematocrit level and velocity were found to exactly match. The model is computationally inexpensive and could be considered for solving blood flow dynamics in microvascular networks.
Data Availability Statement
Publicly available datasets were analyzed in this study. This data can be found here: Sriram et al. [12].
Author Contributions
The present investigation was fully conducted by RC.
Conflict of Interest
The author declares that the research was conducted in the absence of any commercial or financial relationships that could be construed as a potential conflict of interest.
References
1. Secomb TW, Pries AR. Blood viscosity in microvessels: experiment and theory. Comptes Rendus Physique. (2013) 14:470–8. doi: 10.1016/j.crhy.2013.04.002
2. Fåhraeus R. The suspension stability of blood. Physiol Rev. (1929) 9:241–74. doi: 10.1152/physrev.1929.9.2.241
3. Martini P, Pierach A, Scheryer E. Die strömung des blutes in engen gefäβen. eine abweichung vom poiseuille'schen gesetz. Deutsches Archiv für klinische Medizin. (1930) 169:212–22.
4. Fåhraeus R, Lindqvist T. The viscosity of the blood in narrow capillary tubes. Am J Physiol. (1931) 96:562–8. doi: 10.1152/ajplegacy.1931.96.3.562
5. Fournier RL. Basic Transport Phenomena in Biomedical Engineering. Boca Raton, FL: CRC Press. (2012). p. 134–41.
6. Pries AR, Neuhaus D, Gaehtgens P. Blood viscosity in tube flow: dependence on diameter and hematocrit. Am J Physiol Heart Circul Phys. (1992) 263:H1770–8. doi: 10.1152/ajpheart.1992.263.6.H1770
7. Toksvang LN, Berg RMG. Using a classic paper by Robin Fåhraeus and Torsten Lindqvist to teach basic hemorheology. Adv Physiol Educ. (2013) 37:129–33. doi: 10.1152/advan.00009.2013
8. Hund SJ, Kameneva MV, Antaki JF. A quasi-mechanistic mathematical representation for blood viscosity. Fluids. (2017) 2:10–36. doi: 10.3390/fluids2010010
9. Lei H, Fedosov DA, Caswell B, Karniadakis GE. Blood flow in small tubes: quantifying the transition to the non-continuum regime. J Fluid Mech. (2013) 722:214–39. doi: 10.1017/jfm.2013.91
10. Haynes RF. Physical basis of the dependence of blood viscosity on tube radius. Am J Physiol. (1960) 198:1193–200. doi: 10.1152/ajplegacy.1960.198.6.1193
11. Sharan M, Popel AS. A two-phase model for flow of blood in narrow tubes with increased effective viscosity near the wall. Biorheology. (2001) 38:415–28.
12. Sriram K, Intaglietta M, Tartakovsky DM. Non-Newtonian flow of blood in arterioles: consequences for wall shear stress measurements. Microcirculation. (2014) 21:628–39. doi: 10.1111/micc.12141
13. Chebbi R. Dynamics of blood flow: modeling of the Fåhræus–Lindqvist effect. J Biol Phys. (2015) 41:313–26. doi: 10.1007/s10867-015-9376-1
14. Weert KV. Numerical and Experimental Analysis of Shear-Induced Migration in Suspension Flow (a thesis for the degree of Master). Eindhoven University (2005).
15. Mansour MH, Bressloff NW, Shearman CP. Red blood cell migration in microvessels. Biorheology. (2010) 47:73–93. doi: 10.3233/BIR-2010-0560
16. Chebbi R. Dynamics of blood flow: modeling of Fåhraeus and Fåhraeus-Lindqvist effects using a shear-induced red blood cell migration model. J Biol Phys. (2018) 44:591–603. doi: 10.1007/s10867-018-9508-5
17. Phillips RJ, Armstrong RC, Brown RA. A constitutive equation for concentrated suspensions that accounts for shear-induced particle migration. Phys Fluids. (1992) 4:30–40. doi: 10.1063/1.858498
18. Leighton DT, Acrivos A. The shear-induced migration of particles in concentrated suspension. J Fluid Mech. (1987) 181:415–39. doi: 10.1017/S0022112087002155
19. Moyers-Gonzalez M, Owens RG, Fang J. A non-homogeneous constitutive model for human blood. Part 1. Model derivation and steady flow. J Fluid Mech. (2008) 617:327–54. doi: 10.1017/S002211200800428X
20. Moyers-Gonzalez MA, Owens RG. Mathematical modelling of the cell-depleted peripheral layer in the steady flow of blood in a tube. Biorheology. (2010) 47:39–71. doi: 10.3233/BIR-2010-0558
21. Dimakopoulos Y, Kelesidis G, Tsouka S, Georgiou GC, Tsamopoulos J. Hemodynamics in stenotic vessels of small diameter under steady state conditions: effect of viscoelasticity and migration of red blood cells. Biorheology. (2015) 52:183–210. doi: 10.3233/BIR-14033
22. Mavrantzas VG, Beris AN. Modelling the rheology and the flow-induced concentration changes in polymer solutions. Phys Rev Lett. (1992) 69:273–6. Errata. (1993) 70:2659 doi: 10.1103/PhysRevLett.69.273
23. Tsouka S, Dimakopoulos Y, Mavrantzas V, Tsamopoulos J. Stress-gradient induced migration of polymers in corrugated channels. J Rheol. (2014) 58:911–47. doi: 10.1122/1.4880245
24. Quemada D. Rheology of concentrated disperse systems: a model for non-Newtonian shear viscosity in steady flows. Rheol Acta. (1978) 17:632–42.
25. Roselli RJ, Diller R. Biotransport: Principles and Applications. New York, NY: Springer (2011). p. 152. doi: 10.1007/978-1-4419-8119-6
27. Krieger IM, Dougherty TJ. A mechanism to non-Newtonian flow in suspensions of rigid spheres. Trans Soc Rheol. (1959) 3:137–52. doi: 10.1122/1.548848
28. Bagchi P. Mesoscale simulation of blood flow in small vessels. Biophysical J. (2007) 92:1858–77. doi: 10.1529/biophysj.106.095042
29. Long DS, Smith ML, Pries AR, Ley K, Damiano ER. Microviscometry reveals reduced blood viscosity and altered shear rate and shear stress profiles in microvessels after hemodilution. Proc Natl Acad Sci USA. (2004) 101:10060–5. doi: 10.1073/pnas.0402937101
30. Reinke W, Gaehtgens P, Johnson PC. Blood viscosity in small tubes: effect of shear rate, aggregation, and sedimentation. Am J Physiol Heart Circ Physiol. (1987) 253:H540–7. doi: 10.1152/ajpheart.1987.253.3.H540
31. Pries AR, Kanzow G, Gaehtgens P. Microphotometric determination of hematocrit in small vessels. Am J Physiol Heart Circ Physiol. (1983) 245:H167–77. doi: 10.1152/ajpheart.1983.245.1.H167
32. Suzuki Y, Tateishi N, Soutani M, Maeda N. Flow behavior of erythrocytes in microvessels and glass capillaries: effects of erythrocyte deformation and erythrocyte aggregation. Int J Microcirc Clin Exp. (1996) 16:187–94. doi: 10.1159/000179172
33. Hochmuth RM, Davis DO. Changes in hematocrit for blood flow in narrow tubes. Bibl Anat. (1969) 10:59–65.
34. Jendrucko RJ, Lee JS. The measurement of hematocrit of blood flowing in glass capillaries by microphotometry. Microvasc Res. (1973) 6:316–31. doi: 10.1016/0026-2862(73)90080-0
Keywords: blood flow, blood viscosity, velocity profile, Fåhraeus effect, Fåhraeus-Lindqvist effect, cell-free layer, hematocrit level, hematocrit ratio
Citation: Chebbi R (2019) A Two-Zone Shear-Induced Red Blood Cell Migration Model for Blood Flow in Microvessels. Front. Phys. 7:206. doi: 10.3389/fphy.2019.00206
Received: 10 August 2019; Accepted: 15 November 2019;
Published: 06 December 2019.
Edited by:
Philippe Sucosky, Wright State University, United StatesReviewed by:
Pedro Cabrales, University of California, San Diego, United StatesDmitry A. Fedosov, Julich Research Centre, Germany
Copyright © 2019 Chebbi. This is an open-access article distributed under the terms of the Creative Commons Attribution License (CC BY). The use, distribution or reproduction in other forums is permitted, provided the original author(s) and the copyright owner(s) are credited and that the original publication in this journal is cited, in accordance with accepted academic practice. No use, distribution or reproduction is permitted which does not comply with these terms.
*Correspondence: Rachid Chebbi, cmNoZWJiaUBhdXMuZWR1