- Department of Physics, Sogang University, Seoul, South Korea
Finite systems may undergo first or second order phase transitions under not isovolumetric but isobaric condition. The “analyticity” of a finite-system partition function has been argued to imply universal values for isobaric critical exponents, αP, βP, and γP. Here we test this prediction by analyzing NIST REFPROP data for twenty major molecules, including H2O, CO2, O2, etc. We report they are consistent with the prediction for temperature range, . For each molecule, there appears to exist a characteristic natural number, n = 2, 3, 4, 5, 6, which determines all the critical exponents for T < Tc as and . For the opposite T > Tc, all the fluids seem to indicate the universal value of n = 2.
1. Introduction
The celebrated paradigm for critical phenomena in modern statistical physics assumes the thermo-dynamic limit [1] with the intention of achieving non-analyticity [2, 3]. In this way, correlation length diverges at the critical point, which gives rise to the scaling theory of criticality. In order to describe the scaling, renormalization group methods were developed as for a mathematical framework (e.g., [4–12]).
However, the assertion that the thermodynamic limit for non-analyticity is a necessary condition to realize phase transitions is valid only in the isovolumetric case and does not necessarily apply to the isobaric situation [13–19]. In particular, a counterexample based on the ‘analyticity’ of a finite-system partition function has been suggested [20], which predicts its own universal values for isobaric critical exponents defined in an analogous manner to the usual ones except that the critical point is approached via isobaric transformations.
In order to boil water while heating, one may better keep the pressure constant, rather than fix the density and take the thermodynamic limit. In the low energy regime, the particle number, N, is conserved, and thus fixing the density is equivalent to keeping the volume constant. In statistical physics, the partition function, ZN(T, V), is the sum of Boltzmann factors, where the energy eigenvalues are generically quantized with respect to the volume of the system. One crucial difference between volume, V, and pressure, P, is then that the former is a fundamental variable of the partition function along with temperature, T, while the latter is a conjugate variable derivable from the partition function, which is a priori a single-valued function of the two continuous fundamental variables: P(T, V).
For finite N < < ∞, the partition function is analytic, and hence, changing the temperature alone leaving the volume fixed cannot generate any singularity nor a discrete phase transition. To do so, the conventional statistical physics paradigm suggests to take the thermodynamic limit, V → ∞ with the density, N/V, fixed. Yet, an alternative scheme has been also around in the literature, prescribing to keep not the density but the pressure constant, notably by London already in 1954 [13]: For related discussions see Imry et al. [14], Chaba and Pathria [15] (theoretical), Span & Wagner [16] (experimental), and Gross et al. [17–19] (micro-canonical ensemble). The pressure, not as the fundamental but as the conjugate variable, is to be fixed while the system undergoes any discrete phase transition.
In fact, under constant pressure condition, the analytic partition function of a finite system can feature a discrete phase transition provided the volume becomes a multi-valued “function” of T and P. This happens when the partition function features a spinodal curve, which is defined to be the collection of all the points on the (T, V) plane where the isothermal compressibility becomes infinite, or
Equivalently, the second volume derivative of the free energy vanishes on the spinodal curve [e.g., [21–26]], which thus marks out the frontier of local stability. Crucially, on the spinodal curve, the temperature derivative at fixed pressure acting on an arbitrary physical quantity which is a function of T and V, diverges since the isobaric derivative contains the inverse, Φ−1,
The existence of the spinodal curve for a given analytic partition function of a finite system has been verified: the standard textbook systems of ideal Bose gas feature a spinodal curve, only if the number of the identical particles is sufficiently yet finitely large [20, 27–30]. Small perturbations due to extra interactions may well deform the shape of the spinodal curve but hardly eliminate its existence. In the present paper, we test the theoretical assertion that the spinodal curve exists, or emerges [30], even for a generic interacting system with finitely many particles, or real molecules, while the corresponding partition function is analytic. Under this assumption, it follows that, the isothermal compressibility (or, equivalently, the inverse of Φ) is the only source of divergence when the isobaric derivative (2) acts on a physical quantity which is an analytic function of T and V. This essentially implies that the corresponding exponent of the singularity in such an isobaric situation is determined by the power series expansion of Φ in a simple manner: the isobaric scaling behavior near a critical point, (Tc, Vc), can be classified by a natural number which fixes the isobaric critical exponents in a universal and analytic manner, as we review below.
Specifically below, we analyze the (commercially available) experimental data from “NIST Reference Fluid Thermodynamic and Transport Properties Database (REFPROP)" [31], which has been regarded as the world-best dataset for various fluids (especially H2O and CO21). Among numerous molecules, we focus on twenty simple molecules including H2O, CO2, O2, etc. and report that their critical exponents seem to agree with the theoretical prediction based on analyticity: for each molecule, there is a characteristic natural number, n = 2, 3, 4, 5, 6, which determines all the critical exponents for T < Tc as and . For the opposite T > Tc, all the fluids feature the universal value of n = 2.
2. Review: Prediction from Analyticity
We start with the canonical partition function, ZN(T, V), of a generic N-particle system. For finite N < < ∞, the partition function is an analytic function of the two continuous variables, T and V. The temperature dependence originates from the Boltzmann factor, e−βE with β = (kBT)−1, and the volume dependence arises due to the fact that the energy eigenvalues are quantized with respect to the size of the system. Naturally, all the physical quantities computable from the partition function are a priori functions of T and V too. For example, the pressure is given by
It follows infinitesimally,
and hence with the pressure kept fixed, i.e., on an isobar, we get
The spinodal curve (1) is defined to be the collection of all the points on the (T, V) plane where the partial volume derivative of the pressure vanishes. Physically, it corresponds to the boundary between the thermodynamically stable points, Φ > 0, and the unstable points, Φ < 0. The existence of a spinodal curve may not be always guaranteed for a given (analytic) partition function. Yet, it has been shown, first numerically [20, 27] and then through analytic method [28, 29] that, standard textbook systems of ideal Bose gas feature a spinodal curve, and hence the isobar on the (T, V) plane zigzags, if the number of particles is sufficiently large: specifically N ≥ 7, 616 for the 3D cubic box or N ≥ 35, 131 for the 2D square box. Surely, these dimensionless critical numbers of particles are mathematically rather unnatural: the natural one would have been ∞, i.e., the thermodynamic limit. But, the numbers are quantum mechanically generated characteristics of the geometric shape of the box, i.e., “cube” or “square.” Further, their existence is anyhow physically natural, as no experiment deals a genuinely infinite system. Extra perturbative interaction may well change the dimensionless critical numbers and the shapes of the spinodal curves. Yet, what matters is the appearance of a spinodal curve for large enough N2. Hereafter, even for a generic interacting real system with finitely many particles, we shall assume, merely that the spinodal curve exists or emerges, and further tactically that the temperature derivative of the pressure does not vanish (at least) on the spinodal curve,
It follows from (5) that vanishes on the spinodal curve, such that the isothermal line (dT = 0, dV≠0) is tangent to the isobar (dP = 0). This is also consistent with the definition of the spinodal curve (1).
Crucially, on the spinodal curve, the temperature derivative at fixed pressure acting on an arbitrary physical quantity which is a function of temperature and volume diverges, since the derivative contains the inverse, Φ−1, as shown in Equation (2). This realizes a discrete phase transition for a finite system under constant pressure condition. Further, if the physical quantity on which the derivative (2) acts is an analytic function of T and V, the inverse, Φ−1, is the only source of a divergence: none of the partial derivatives, neither nor , can produce any singularity. This implies that the corresponding exponent of the singularity is determined by the power series expansion of Φ on the isobar and therefore, the exponents can be classified to take universal and exact values, under the assumptions of analytic partition function and isobaric transformations.
The critical point, (Tc, Vc), is defined to be a particular point on the spinodal curve on which the higher order volume derivative of the pressure vanishes:
The first condition is the definition of the spinodal curve such that, as explained above, the isothermal line is tangent to the isobar, while the second condition implies in a similar fashion that the isothermal line is also tangent to the spinodal curve. Thus, the three curves, isothermal, spinodal and isobar, are all tangent to each other at a critical point. In general, for a certain natural number, n ≥ 2, we let
and
Now, at least locally, around any spinodal point, we invert P(T, V) to express the temperature as a function of P and V. This is justified by the assumption of (6) via the implicit function theorem which also ensures that the function T(P, V) is analytic as well. We further fix the pressure to be critical, i.e., Pc = P(Tc, Vc). This gives a local expression of the temperature around the critical point as a function of the volume under the fixed critical pressure,
satisfying
The analyticity of the partition function, combined with the implicit function theorem, guarantees that fc(V) is an analytic function of V. By taking the volume-derivative of the relation (11), which should vanish, it is straightforward to show that the power series expansion of the function, fc(V), around the critical volume starts at the (n + 1)th order,
where, from our assumptions of (6), (8), and (9), the leading order coefficient is non-trivial,
Clearly, Equation (12) leads to the following isobaric critical exponent:
which implies
Similarly, with (9) and (12), the expansion of Φ on the critical isobar starts from the nth order in V−Vc such that, in agreement with (15),
Thus, from (2), any physical quantity given by the temperature derivative along the critical isobar diverges with the universal exponent, . This includes the critical exponent of the specific heat under constant pressure:
On the other hand, since the specific heat at constant volume or constant density is finite for any finite system, the corresponding critical exponent should be trivial (if sufficiently zoomed in) [16]3:
Further, the inverse of Φ gives the critical exponent of the isothermal compressibility on the critical isobar:
This isothermal compressibility exponent, , is strictly less than one (19), and hence differs from the typical estimations of its constant volume analog γV [4–11]. Nevertheless, the equality of αP = γP was reported experimentally for some liquid-crystalline materials, such as nCB and [32].
Finally, from (9), we obtain the isothermal critical exponent at the critical temperature, T = Tc:
Note that, unlike αP, βP and γP, our last exponent, δ, is not defined under the isobaric condition, and yet there should be no ambiguity in the definition (20).
In summary, under the combined hypotheses of analyticity and existence of a spinodal curve, we obtain the following universal values for the (isobaric) critical exponents [20]:
They are all determined by a single natural number, n, which should be greater than one, n = 2, 3, 4, 5, ⋯, and corresponds to the characteristic of a critical point. Henceforth, we name the natural number, critical index. As can be easily checked, the isobaric critical exponents satisfy the “scaling laws” [4–11]:
It is worthwhile to note that, at a generic spinodal point with lower pressure, P<Pc, the case of n = 1 for (8) and (9) corresponds to the first-order phase transition between the liquid and the gas, which features the superheating and supercooling phenomena. Even at these points, our analysis implies the universal exponent:
We stress that our analysis and the resulting critical exponents (21) as well as (23) should hold universally not only for liquid-vapor transitions but also for any isobaric phase transition where its own spinodal curve can be defined. Such examples include the Nematic to Smetic-A phase transition of the liquid-crystalline experiment (without δ) [32] and a relativistic ideal Bose gas theory (see Figure 5 of [20]). Both examples feature the same critical index, “n = 2” and agree with (23) when P < Pc.
3. Van Der Waals Fluid: Toy Model of n = 2
The first historical example of mean field theory was the van der Waals fluid, which we show here to provide a simple example of the above general consideration. The van der Waals equation reads
where Pr = P/Pc, vr = v/vc, and Tr = T/Tc are reduced pressure, volume per particle and temperature, such that the critical point is given by Pr = vr = Tr = 1. Around the critical point, the critical isobar, Pr ≡ 1, is given by
Therefore, near the critical point, , we get n = 2, and hence . On the other hand, taking the vr-derivative of (24), with fixed temperature, gives
and hence, combined with (25), we get , as follows
From (24), the critical isothermal relation between pressure and temperature reads, with Tr ≡ 1,
Thus, we note δ = 3. Lastly, in order to obtain αP, one should first remember that the specific heat at constant volume of any fluid whose equation of state is linear in temperature is equal to that of the classical ideal gas. Thus, it is finite and constant, so the corresponding critical exponent should be trivial, i.e., αV = 0 (18). On the other hand, the specific heat at constant pressure, CP, is given by the thermodynamic identity (see e.g., [10]),
which is proportional to κT. Therefore, αP, the critical exponent of the specific heat under constant pressure takes the same value as . Put all together, the critical point of van der Waals fluid belongs to the class of n = 2. Note that the textbook approach to obtain the critical exponents of van der Waals fluid is based on the concept of Maxwell's equal area construction [9, 10, 33], which, we assert, cannot be applied nor defined at the critical point itself. More precisely, the conventional derivation of the exponent, “" is based on the behavior of the binodal curve of liquid-vapor coexistence near the critical point, while our isobaric critical exponent, , is obtained here by simply fixing the pressure to be critical, Pr ≡ 1, in the very van der Waals equation (25).
4. Result and Discussion
We recall the theoretical prediction of the critical exponents (21), , , which can be easily derived not by assuming the thermodynamic limit nor any singularity of the free energy, but by postulating the analyticity of the partition function and the existence of a spinodal curve. Our main result in this work is to verify that such a simple approach appears relevant to the description of the critical phenomena of the liquid-gas phase transition of ‘real fluids’: the analyticity-based theoretical prediction is consistent with the high-precision experimental data, REFPROP of NIST [31].
The NIST data are sufficiently precise even close to the critical points: the uncertainties for most fluids do not exceed 2%. For examples, the uncertainty in pressure of nitrogen in the critical region is estimated to be 0.02%. The uncertainty in pressure of water in the critical region is 0.1%. The uncertainty in heat capacities of argon is within 0.3% for the vapor and 2% for the liquid. The uncertainties in vapor pressure of helium are less than 0.02% and for the heat capacities are about 2%. The detailed information on the data can be obtained by downloading the (commercially available) REFPROP database program through its website [31]. We tend to believe that such high-precision data were not available while the conventional paradigm of taking the thermodynamic limit and achieving non-analyticity was proposed and established during the mid twentieth century. In particular, the isothermal relation between pressure and volume appears to have been rather poorly measured [e.g., [5]].
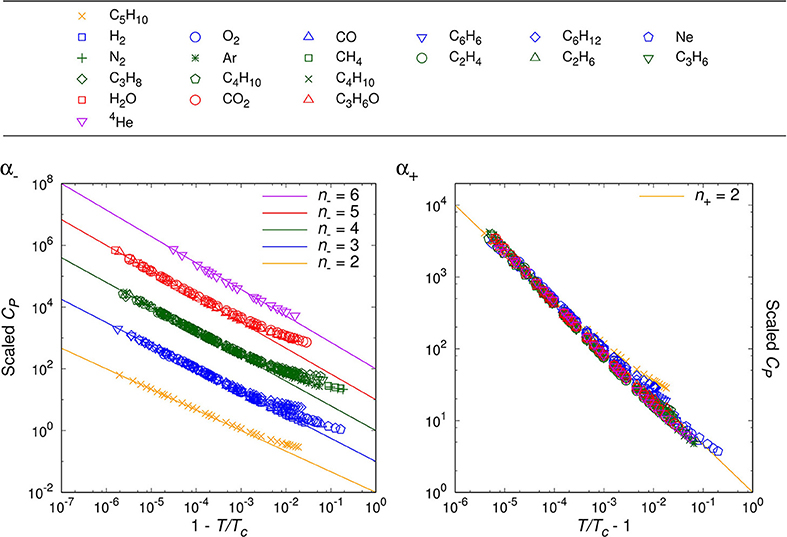
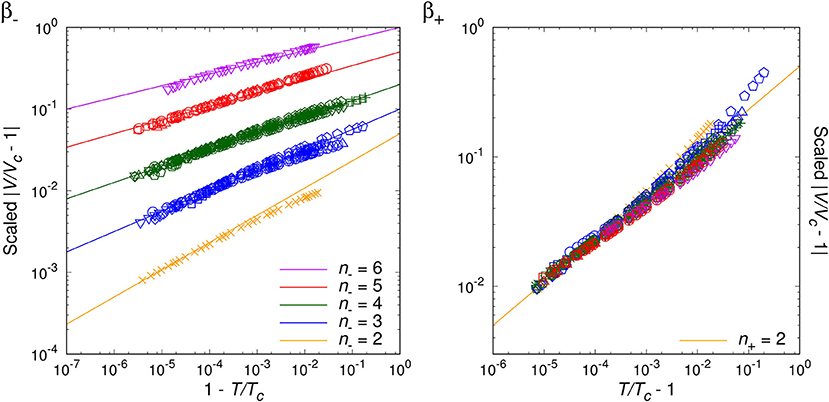
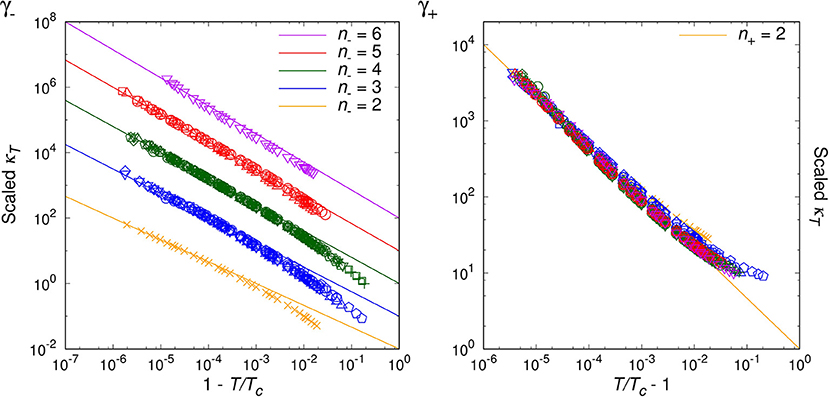
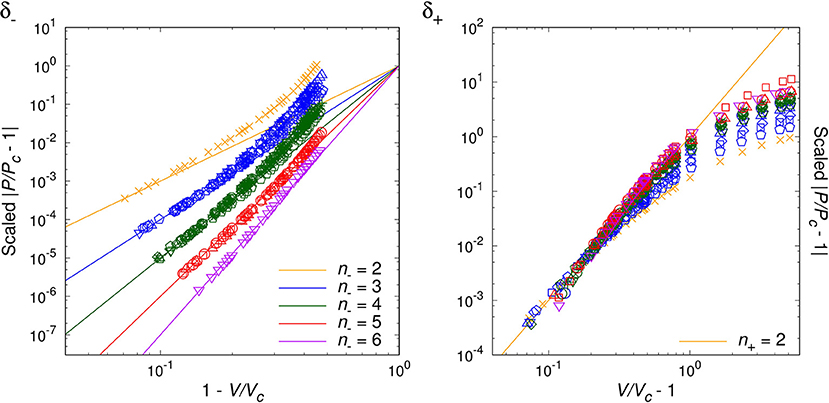
By analyzing the data for randomly chosen twenty simple molecules, we are able to classify the critical phenomena of those real fluids in terms of the critical index, n− = 2, 3, 4, 5, 6, for T < Tc. For the opposite range of temperature, T > Tc, the natural number seems to be universal as n+ = 2, which agrees with van der Waals fluid (24), a relativistic ideal Bose gas (n− = n+ = 2 [20]), and an experimental result on SF6 [34]. Table 1 and Figures 1–4 show the main results.
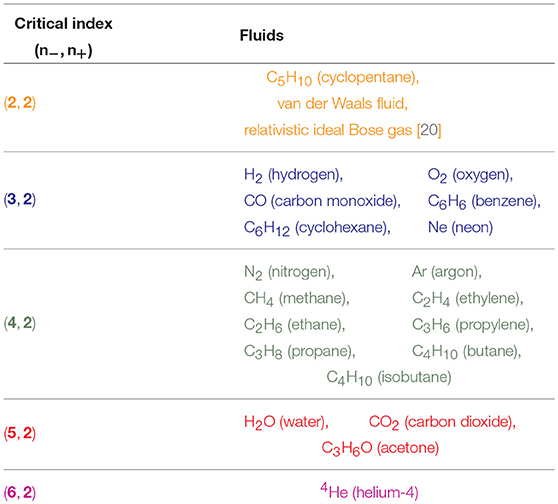
Table 1. Classification of the 20 major fluids plus the relativistic ideal Bose gas and the van der Waals fluid, according to the critical indices: n− for T < Tc and n+ for T > Tc.
Table 1 contains our classification of the twenty molecular fluids, plus the relativistic ideal Bose gas and the van der Waals fluid, according to the critical indices: n− for T < Tc and n+ for T > Tc. Note the universal value, n+ = 2. We have determined the critical indices from the experimental data of NIST (REFPROP) [31] especially over the reduced temperature range, .
Figures 1–3 show the log-log plot of the scaled physical quantities (CP, |V/Vc−1|, and κT) vs. the reduced temperature (|T/Tc−1|) for the twenty molecules, where data are logarithmically-binned from REFPROP dataset for our analysis. On the other hand, Figure 4 shows the log-log plot of the scaled reduced pressure (|P/Pc−1|) vs. the reduced volume (|V/Vc−1|) for the same molecules, where data are also logarithmically-binned. All the figures represent the best fit plots of experimental data obtained from the twenty molecules, which confirm the scaling behavior characterized by the critical indices, n− = 2, 3, 4, 5, 6 for T < Tc and n+ = 2 for T > Tc.
Generically, except C5H10, we have obtained two distinct critical indices, n− and n+, depending on T < Tc and T > Tc. This rather surprising result leads us to speculate —still assuming the analyticiy— that there may exist more than one critical points quite close to each other, such as (Tc−, Vc−:n−) and (Tc+, Vc+:n+) (Lee et al., in preparation).
We may regard our result as a tantalizing hint for the finiteness of the Avogadro number in real experimental laboratories, such that analyticity appears to persist at least for the close up range like . On the other hand, slightly further away from the critical point, e.g., , the singularity or the critical index appears to get enhanced still in a universal manner for β−, γ−, δ−. This might correspond to a thermodynamic limiting behavior.
As a matter of fact, NIST REFPROP assumes certain form of extrapolation formulas for data fitting, such that it appears able to generate data for extremely short range, e.g., . Yet, such data turn out to deviate from the analytic prediction of our interest, which should be due to the artificially designed fitting formulas. While for the range of , we trust NIST REFPROP represents true experimental data. For this range it is a highly non-trivial verification of us that all the four critical exponents of a given real molecule are fixed by a ‘common’ natural number, i.e., the critical index.
5. Conclusion
Finite systems can undergo first or second order phase transitions under isobaric condition without resorting to the thermodynamic limit. The “analyticity” of a finite-system partition function predicts then the universal values of the isobaric critical exponents. In this work, analyzing NIST REFPROP data for 20 simple molecules, including H2O, CO2, O2, etc. over the the reduced temperature range of , we have tested and verified the prediction: for each molecule, there appears to exist a characteristic natural number, n = 2, 3, 4, 5, 6, which determines all the critical exponents for T < Tc as and . For the opposite T > Tc, all the fluids seem to indicate the universal value of n = 2.
In the sense of Kuhn [35], our result might be viewed as “anomaly" within the standard paradigm of taking the thermodynamic limit for critical phenomena, e.g., the (non-analytic) 3D Ising model or XY model [36]. Nevertheless, our analysis represents truthfully the NIST experimental data for the specific temperature window, . We call for further theoretical as well as experimental investigations.
Author Contributions
J-HP proposed the research. WC contributed the NIST data handling and analysis. D-HK led the interpretation of the data. J-HP and D-HK wrote the manuscript.
Conflict of Interest Statement
The authors declare that the research was conducted in the absence of any commercial or financial relationships that could be construed as a potential conflict of interest.
Acknowledgments
We wish to thank Xavier Bekaert for numerous enlightening discussions and Eric W. Lemmon at NIST for helpful correspondences. This work was supported by Sogang University (Grant Nos. 201610033.01 and 201710066.01) and the National Research Foundation of Korea (Grant Nos. 2015K1A3A1A21000302 and 2016R1D1A1B01015196).
Footnotes
1. ^Private communications with E. W. Lemmon at NIST.
2. ^In order to identify any spinodal curve, or more generically to observe nontrivial quantum effects, one should rather keep the analyticity of the partition function and aim to perform not a somewhat hasty approximate integral but an exact discrete sum over countable quantum states, c.f. Nekrasov NA. Seiberg-Witten prepotential from instanton counting. Adv. Theor. Math. Phys. 7 831 (2003).
3. ^On the other hand, if appropriately zoomed out, it might be possible to observe pseudo-thermodynamic-limiting behavior, with finite peak.
References
2. Yang CN, Lee TD. Statistical theory of equations of state and phase transitions. I. Theory of condensation. Phys Rev. (1952) 87:404.
3. Yang CN, Lee TD. Statistical theory of equations of state and phase transitions. II. Lattice gas and Ising model. Phys Rev. (1952) 87:410.
6. Kadanoff LP, Götze W, Hamblen D, Hecht R, Lewis EAS, Palciauskas VV, et al. Static phenomena near critical points: theory and experiment. Rev Mod Phys. (1967) 39:395.
7. Stanley HE. Introduction to Phase Transitions and Critical Phenomena. New York, NY: Oxford University Press (1971).
10. Goldenfeld N. Lectures on Phase Transitions and the Renormalization Group. Vol. 85. Reading, MA: Addison-Wesley (1992).
11. Kadanoff LP. Statistical Physics: Statics, Dynamics and Renormalization. Singapore: World Scientific (2000).
12. Kadanoff LP. More is the same; phase transitions and mean field theories. J Stat Phys. (2009) 137:777. doi: 10.1007/s10955-009-9814-1
13. London F. Superfluids, Vol. 2, Macroscopic Theory of Superfluid Helium. New York, NY: Dover Publications (1954).
14. Imry Y, Bergman DJ, Gunther L. Bose-Einstein condensation in two-dimensional systems. In: Chen TC, Nordheim LW, editors. Low Temperature Physics-LT 13. Vol. 1. New York, NY: Springer; Dover Publications, Inc. (1974). p. 80.
15. Chaba AN, Pathria RK. Bose-Einstein condensation in a two-dimensional system at constant pressure. Phys Rev B (1975) 12:3697.
16. Span R, Wagner W. A new equation of state for carbon dioxide covering the fluid region from the triple-point temperature to 1100 K at pressures up to 800 MPa. J Phys Chem Ref Data (1996) 25:1509–96.
17. Gross DHE, Votyakov E. Phase transitions in ‘small’ systems. Eur Phys J B (2000)15:115. doi: 10.1063/1.555991
18. Gross DHE. Geometric foundation of thermo-statistics, phase transitions, Second Law of Thermodynamics, but without thermodynamic limit. Phys Chem Chem Phys. (2002) 4:863–75. doi: 10.1039/B108775D
19. Gross DHE, Kenney JF. The microcanonical thermodynamics of finite systems: the Microscopic origin of condensation and phase separations: and the conditions for heat flow from lower to higher temperatures. J Chem Phys. (2005) 122:224111. doi: 10.1063/1.1901658
20. Park JH, Kim SW. Existence of a critical point in the phase diagram of ideal relativistic neutral Bose gas. New J Phys.(2011) 13:033003. doi: 10.1088/1367-2630/13/3/033003
21. Gibbs JW. The Scientific Papers of J. Willard Gibbs New York, NY: Dover Publications, Inc. (1961).
23. Chandler D. Introduction to Modern Statistical Mechanics. New York, NY: Oxford University Press (1987).
24. Chimowitz EH. Introduction to Critical Phenomena in Fluids. New York, NY: Oxford University Press (2005).
25. O'Connell JP, Haile JM. Thermodynamics: Fundamentals for Applications. Cambridge: Cambridge University Press (2005).
26. Scott Shell M. Thermodynamics and Statistical Mechanics: An Integrated Approach. Cambridge: Cambridge University Press (2015).
27. Park JH, Kim SW. Thermodynamic instability and first-order phase transition in an ideal Bose gas. Phys Rev A (2010) 81:063636. doi: 10.1103/PhysRevA.81.063636
28. Jeon I, Kim SW, Park JH. Isobar of an ideal Bose gas within the grand canonical ensemble. Phys Rev A (2011) 84:023636. doi: 10.1103/PhysRevA.84.023636
29. Cho W, Kim SW, Park JH. Two-dimensional Bose-Einstein condensate under pressure. New J Phys. (2015) 17:013038. doi: 10.1088/1367-2630/17/1/013038
30. Park JH. How many is different? Answer from ideal Bose gas. J Phys Conf Ser. (2014) 490:012018. doi: 10.1088/1742-6596/490/1/012018
31. Lemmon EW, Huber ML, McLinden MO. NIST Reference Fluid Thermodynamic and Transport Properties Database (REFPROP): Version 9.1, National Institute of Standards and Technology (NIST). Gaithersburg, MD: Standard Reference Data Program (2013). Available online at: https://www.nist.gov/srd/refprop
32. Zywocinski A, Wieczorek SA. Critical exponents for thermal expansion and isothermal compressibility near the Nematic to Smectic-A phase transition. J Phys Chem B (1997) 101:6970–6. doi: 10.1021/jp971234g
33. Levelt Sengers JMH. From Van der Waals' equation to the scaling laws. Physica (1974) 73:73–106. doi: 10.1016/0031-8914(74)90227-4
34. Wagner W, Kurzeja N, Pieperbeck B. The thermal behaviour of pure fluid substances in the critical region - experiences from recent pρT measurements on SF6 with a multi-cell apparatus. Fluid Phase Equilibria (1992) 79:151–74.
35. Kuhn TS. The Structure of Scientific Revolutions. (Chicago, IL: University of Chicago Press) (1962) (2nd ed.: 1970; 3rd ed.: 1996; 4th ed.: 2012).
36. Garland CW, Nounesis G. Critical behavior at nematic–smectic–A phase transitions. Phys Rev E (1994) 49:2964.
Appendix: Comment on Guggenheim's Fitting
Around the critical point, with Φc ≡ Φ(Tc, Vc) = 0 and from (9), we may expand
where ΔT = T−Tc, ΔV = V−Vc. Then, near to the critical point, in comparison with the critical isobar (14), the spinodal curve can be approximated by
Our result implies then that, the supercooling (T < Tc) and the superheating (T > Tc) spinodal curves read separately in terms of the density, ρ± = N/V±,
From the empirical result reported in this work, n+<n− (except C5H10), we expect close to the critical point,
Thus, the difference between the densities of the supercooled gas and the superheated liquid can be approximated by
This is comparable with the renowned Guggenheim's fitting [37] with n = 3.
Keywords: isobaric thermal expansion coefficient, critical point, critical exponents, analyticity, NIST tests
Citation: Cho W, Kim D-H and Park J-H (2018) Isobaric Critical Exponents: Test of Analyticity Against NIST Reference Data. Front. Phys. 6:112. doi: 10.3389/fphy.2018.00112
Received: 23 April 2018; Accepted: 11 September 2018;
Published: 04 October 2018.
Edited by:
Ramesh L. Gardas, Indian Institute of Technology Madras, IndiaReviewed by:
Alejandro Gil-Villegas, Universidad de Guanajuato, MexicoNaved I. Malek, Sardar Vallabhbhai National Institute of Technology Surat, India
Copyright © 2018 Cho, Kim and Park. This is an open-access article distributed under the terms of the Creative Commons Attribution License (CC BY). The use, distribution or reproduction in other forums is permitted, provided the original author(s) and the copyright owner(s) are credited and that the original publication in this journal is cited, in accordance with accepted academic practice. No use, distribution or reproduction is permitted which does not comply with these terms.
*Correspondence: Do-Hyun Kim, ZG9oeXVua2ltQHNvZ2FuZy5hYy5rcg==
Jeong-Hyuck Park, cGFya0Bzb2dhbmcuYWMua3I=
 Wonyoung Cho
 Do-Hyun Kim
 Jeong-Hyuck Park