 Yang Liu
 Weiyan Qiu2
 Longyu Li
 Yan Kang
95% of researchers rate our articles as excellent or good
Learn more about the work of our research integrity team to safeguard the quality of each article we publish.
Find out more
ORIGINAL RESEARCH article
Front. Pharmacol. , 23 November 2023
Sec. Respiratory Pharmacology
Volume 14 - 2023 | https://doi.org/10.3389/fphar.2023.1254804
This article is part of the Research Topic Model Organisms in Respiratory Pharmacology 2023 View all 6 articles
The demand for respiratory disease and dynamic breathing studies has continuously driven researchers to update the pulmonary bronchial tree’s morphology model. This study aims to construct a bronchial tree morphology model efficiently and effectively with practical algorithms. We built a performance index system using failure branch rate, volume ratio, and coefficient of variation of terminal volumes to evaluate the model performance. We optimized the parameter settings and found the best options to build the morphology model, and we constructed a 14th-generation bronchial tree model with a decent performance index. The dimensions of our model closely matched published data from anatomic in vitro measurements. The proposed model is adjustable and computable and will be used in future dynamic breathing simulations and respiratory disease studies.
Chronic obstructive pulmonary disease (COPD) is a common disease with pulmonary airflow restriction. It is currently the third leading cause of death globally, mainly reflected in the destruction of lung structures or morphological changes. The advent of computed tomography (CT) has revolutionized radiology and gradually altered the gold standard in diagnosing and treating COPD. Radiology is now preferred when COPD is suspected. Although the GOLD report diagnostic criterion is still a lung function test, it also mentions that approximately 30% of COPD patients have visible bronchiectasis on CT, which is associated with an increased frequency of exacerbations and mortality (Martinez-Garcia et al., 2021). The heterogeneity of COPD also shows that personalized lung tissue morphology has played a significant role in the occurrence and development of the disease.
High-resolution CT examination of the lung is used to diagnose and monitor disease of the lung tissue and the airways. Because the bronchus of the lungs has approximately 23 generations, the diameter decreases progressively generation by generation. Some bronchi are invisible in CT because of its limited resolution. Understanding the tracheal tree’s morphology facilitates the study of different levels of bronchiectasis.
It has been over 50 years since Weibel built the earliest lung model, the Weibel A model, through his research on pulmonary morphology (Weibel et al., 1963). It assumes that an airway consists of cylindrical geometries, and each bronchus symmetrically branches into two bronchial tubings. Researchers have recently developed models that are more similar to the real bronchial tree morphologically and functionally. Huang et al. (2020) segregated the bronchial tree models in TB and alveolar models into three categories. The first category is models developed from the Weibel A model. They are symmetrical bifurcated bronchial structures with cylinders of various lengths and diameters, and most of the models have in vitro results available for comparison. In 2017, Ciciliani et al. (2017) constructed the bronchial tree geometry using SolidWorks. Based on Finlay’s findings, the alveolar space is not present. They later used ANSYS to perform the CFD simulation and obtain the particle deposition results. In 2018, Koullapis et al. (2018) added the alveolar sacs model to Weibel’s bifurcation modeling and performed the computational fluid-particle dynamics simulation. These morphology geometries always require excessive simplifications while losing information about the original bronchial tree structure. The second category is the realistic models generated from high-resolution CT or MRI imaging. Islam et al. (2017) built a 17-generation human respiratory tract model from the high-resolution CT image from Schmidt et al. (2004). Other researchers have also created realistic models. They are not widely used as respiratory tract geometry is always different from individual to individual (Rajaraman et al., 2020; Mohite et al., 2020; Farghadan et al.,2020; Srivastav et al.,2019; Poorbahrami and Oakes, 2019). The third category is computer-generated models. These models are generated using computer algorithms based on the data from realistic models. They are more accurate than the Weibel model and less computing demanding than the CT-based models. Researchers can generate models of different conditions for parametric study. These algorithms came from a two-dimensional tree generation Monte Carlo method. Tawhai et al. (2000) extended the two-dimensional bifurcation algorithm to a three-dimensional tree-growing algorithm to generate a lung model. Kitaoka, 2011 and Kolanjiyil and Kleinstreuer, 2016 developed a four-dimensional model (a three-dimensional model varies with time) capable of generating airway pathways and alveolar structures with realistic characteristics of bronchial airways. He established nine basic laws and four supplement laws, which are difficult for other researchers to replicate. This paper studied several bifurcation algorithms and found that the space-dividing algorithm performs the best. Then, we originated our bronchial tree model, based on the idea that the bronchial tree is supposed to transport air to the entire lung space in the best and easiest way. We then used three performance indices to evaluate the modeling and find the best-fit parameters.
Our dataset comes from open longitudinal research from Guangzhou’s first medical school in Guangzhou, China, from 2010 onwards. Among the 400 individuals who attended this research, we selected one male patient of average height and weight among all the attendants. Chest multi-slice spiral computed tomography (MSCT) was performed with a multiple-layer scanner with a 1 mm calibrated volume under 100 kV and a 40 mA current. The spinning time was 0.75 s with a spacing of 1.2 mm. The FOV was 40 cm. Scanning was performed from toe to head to eliminate the artifacts. CT images were reconstructed with the software, which provided a thickness of 1 mm. The total radiational dose was 1–3 mSv. Patients were lying on the back, holding their breath after deep breathing, and the scanning did not need to inject the contrast agent.
The schematic flowchart is shown in Figure 1. First, 561 Dicom images were imported in Mimics 19®. Then, the bronchial tree three-dimensional models were extracted from the CT images, with medium weakness and region grow. Then, we exported the.txt file and extracted the centerline. The left lung three-dimensional object was exported as 16,165 outline points, and 16,453 outline points represented the right lung. Then, we filled the space between the boundary points with a 1 mm interval in x, y, and z directions. The resulting 3,708,588 points filled the left lung and 3,968,949 points filled the right lung. The number difference was because, for most humans, the right lung has a larger size than the left one. Then, we set up a sampling constant to downsample this points cloud, which reduced the size of the matrix. The selection of the sampling constant needs to be analyzed for each situation. The root point and the three starting points (near, side, and father) are then located to initialize the bronchial branch. Three different automatic growing methods will be explained in detail in the following sections. These methods were used to grow the airway tree automatically. Then, we used three performance indices to evaluate the bronchial tree and the parameter setting to find the model with the best performance.
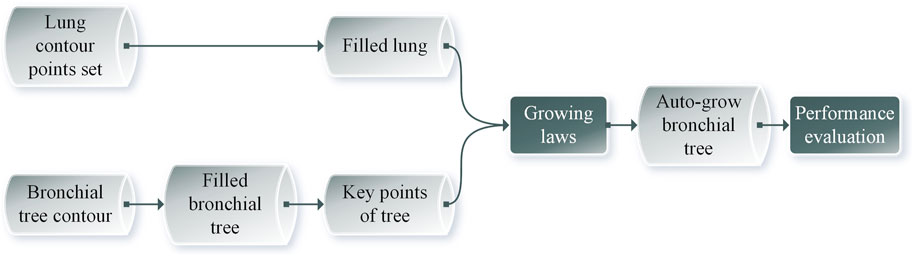
FIGURE 1. Schematic flowchart of this study.
Based on the bronchial tree basic algorithm, our first three-dimensional model of the human airway tree was generated from four starting points: a pre-set branching diameter, branching angles, turning angles, and a lung outline. The main idea of this algorithm is as follows: The bronchial tree is supposed to follow a similar pattern before and after, men and women. The diameters and branching angles should match the recorded data measured ex vivo published by other researchers. The pre-set data algorithms were composed of three fundamental laws and two space separation laws.
Branching law - pre-set data algorithms
Law 1: Branching is dichotomous.
Law 2: The parent branch and its two daughter branches lie in the same plane, called the branching plane.
Law 3: The angle between a parent branch and its daughter branch is this daughter’s branching angle.
Law 4: The region supplied by a parent branch is divided into two daughter regions by the “space-dividing plane.” The angle between the space-dividing and branching planes is the turning angle.
Law 5: Overflow (branch outside the lung outline) terminate the branch.
First, we needed to define four starting points, the beginning point and the father, near, and side points, to initialize the three starting branches. The pre-set branching and turning angles determine where the new branch grows to, from the near point and the branching plane. With this method, the bronchial tree’s shape largely depends on the pre-setting data. The diameter we used in this study came from the average branch length measured by Yeh and Schum (1980), and we performed a curve fitting. The branching angles were supposed to be
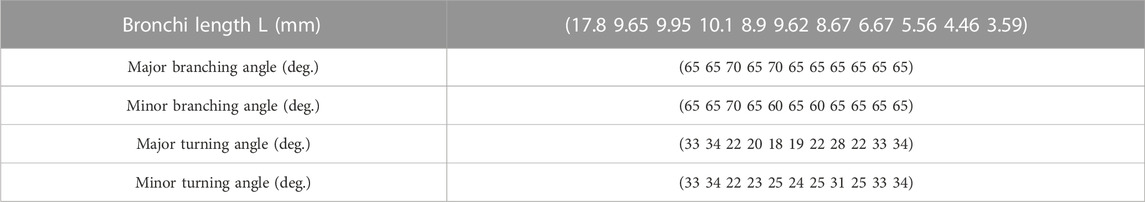
TABLE 1. Initial parameters set up for pre-set data algorithms.
Researchers have suggested an optimum relationship between the flow rate and diameter in a circular rigid tube with a constant diameter. Murray, (1926) first proposed the relationship between the diameter and the flow rate, and other researchers later modified them.
where d is the diameter, Q is the flow rate, n is the diameter exponent, and C is a constant depending on the organ and the fluid.
Considering the conservation of the mass before and after the branching, we can relate the diameter of the parent
After defining the flow-dividing ratio r as the ratio of the smaller daughter branch,
Based on a minimum energy loss principle, the value n is suggested to be 3. The theoretical value of this morphometric value for the airway is still unclear in the academic community. Here, we use the value 3 to solve the angles.
The second three-dimensional model of the human bronchial tree was generated from three initial points and a lung outline based on the bronchial tree flow rate algorithm. The chief idea of this algorithm is as follows: the volume flow rate in the bronchial tree transport system is supposed to be conservative. Each bifurcation separates the flow rate to go to the farthest end in the best and most accessible way. For each furthermost branch, the flow rate is supposed to support its covered space. The flow rate algorithms are composed of seven laws.
Branching law–flow rate algorithms
Law 1: Branching is dichotomous.
Law 2: The parent branch and its two daughter branches lie in the same plane, called the branching plane.
Law 3: A space-dividing plane divides the region supplied by a parent branch into two daughter regions. The space-dividing plane is perpendicular to the branching plane, and it reaches out to the parent branch.
Law 4: The volumetric flow rate is conserved after branching, as shown in Eq. 2.
Law 5: The flow-dividing ratio r is set to be the volume-dividing ratio.
Law 6: Diameters and branching angles of the two daughter branches are determined by Eqs 3–6, respectively.
Law 7: Empty data set and overflow (branch outside the lung outline) terminate the branch.
Our space-dividing algorithm generated the third three-dimensional model of the human airway tree from three starting points and the lung outline. The core idea of this algorithm is as follows: The bronchial tree is supposed to transport air to the entire space of the lung using the best and easiest way. If there is a branch, it is considered to transport air toward the center of the demarcated space. The basic laws are composed of three basic laws and space separation laws.
Branching law–space-dividing algorithms
Law 1: Branching is dichotomous.
Law 2: The parent branch and its two daughter branches lie in the same plane, called the branching plane.
Law 3: the branching plane cuts the supporting area into upper and lower sections.
Law 4: The center of the divided space is where the newer branch grows toward, with a constant ratio
Law 5: The empty data set and overflow (branch outside the lung outline) terminate the branch.
Failure branch rate, volume ratio, and coefficient of variation of terminal volumes were used to quantify the bronchial tree model’s ability to transport air evenly to all the space in the lung region.
The branches extending beyond their quantified region are terminated, violating the concept that fluid should be delivered homogeneously in the space available for the tree. The available space is correspondingly eliminated from the consideration of the space to grow branches. We call these branches “failure terminal branches,” and
The space of the bronchial tree structure (the part within the lung lobes) is divided by the volume of both the lung lobes. A tree with a smaller
We can grow multiple generations of the bronchial tree and set the parted spaces in the last loop as the terminal regions supplied by each corresponding terminal branch.
Using the branching laws based on the pre-set data algorithm, a bronchial tree was generated to the 10th generation, as shown in Figure 2A. Using the branching laws with the flow rate algorithm, the bronchial tree was generated to the 10th generation, as shown in Figure 2B. Figure 2C shows the bronchial tree structure using the branching laws based on the space-dividing algorithm. The bronchial trees were grown to the 10th generation for all three methods. The space-filling was relatively poor for the first two algorithms, especially in the upper part of the lung. In Table 2, the volume rate and
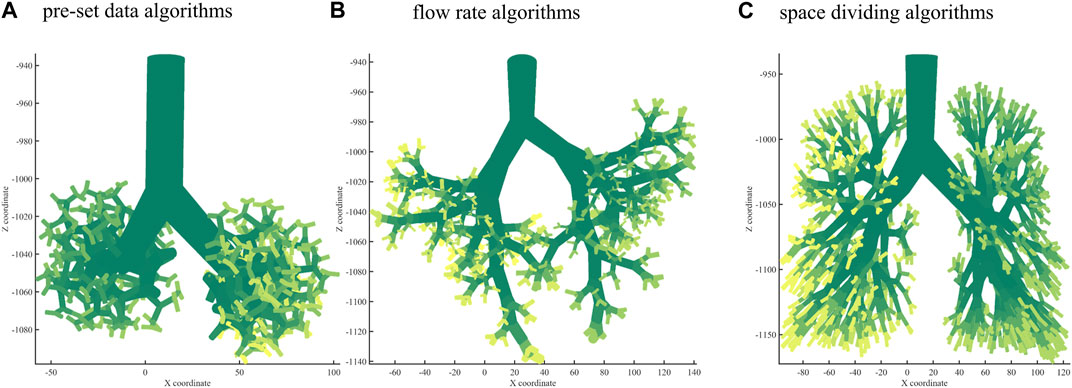
FIGURE 2. Bronchial tree with three algorithms. (A) A 10th-generation bronchial tree model created with pre-set data algorithms. (B) A 10th-generation bronchial tree model created with flow rate algorithms. (C) A 10th-generation bronchial tree model created with space-dividing algorithms.

TABLE 2. Three branching algorithms and the performance indices.
First, we filled the left and right lung contours as point clouds and used a sparse constant to fasten the calculation speed. If the sparse constant is too small, the calculation will take much longer and will not bring extra information; if the sparse constant is too large, it will affect the precision of the analysis. We performed the test tree growing of 10 generations with the sampling constants 10, 300, 600, and 9,000. The failure branch rate was 2.83%, 2.54%, 2.83%, and 25.4%, respectively. Then, we chose a sampling constant of 300 to perform the bronchial tree growth of 10 generations.
The constant growth ratio
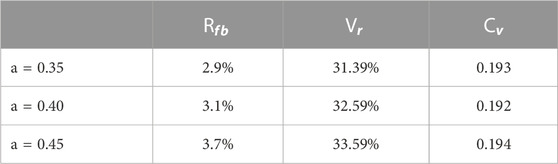
TABLE 3. Study of growth ratio a with performance indices.
When using this method to grow the bronchial tree, sometimes we inevitably cut a long and thin region to grow, and the branch may be too long; therefore, we have to use a length limit to correct the length. As shown in the previously measured data by Yeh and Schum (1980), the bronchus length should not exceed 1.5 times the measured length. All the lengths should not exceed 20 mm; the second generation should not exceed 8.72 mm, and 3.56, 1.93, 1.99, 2.02, 1.78, and 1.92 mm in turn. The length ratio b is another ratio multiplied by growth ratio a while the length of the new branch exceeds the limit, and we tested four values: b = 0.3, 0.4, 0.5, and 0.6. The performance index is shown in Table 4 below.
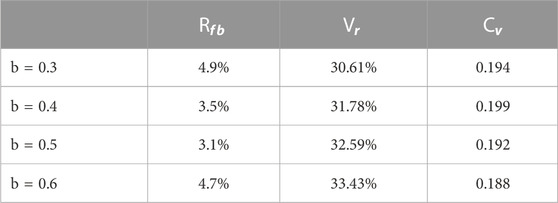
TABLE 4. Study of length ratio b with performance indices.
It can be seen that b = 0.5 gave the best failure branch rate and with a decent volume ratio. For b = 0.3, 0.4, and 0.5,
We observed the human lung and obtained opinions from medical doctors. Some angles inside the human lung may be obtuse but the proportion is limited. Once the calculated angle was obtuse, we added a correction to the modeling and made this angle slightly smaller, and if it was still obtuse, we kept it as it is. The constant c is a fraction. If the angle between the father bronchus vector and the daughter bronchus vector is obtuse, we multiply c to that angle.
Compared with the other three ratios,
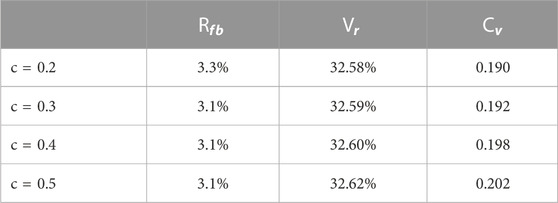
TABLE 5. Study of proportional ratio c with performance indexes.
Next, we used the algorithm with selected coefficients to build a bronchial tree model with generations 10, 12, and 14 (Figure 3). Figure 4 shows the transverse, coronal, and sagittal view of the 14th-generation model. The 14th-generation model took approximately 8 h to calculate and 10 h to visualize with MATLAB R2023a using PowerEdge T430 with an Intel® Xeon® Gold 6128 CPU at 3.40 GHz and 3.39 GHz (two processors) and 64 GB RAM. The lung was filled evenly from generation to generation, from the 10th-generation model to the 14th-generation bronchial tree. Table 6 shows the performance index with the bronchial tree model of the 10th, 12th, and 14th generations. The failure branch rate had an obvious increase as each failure branch caused daughter branch failure too. A t-test showed that there was a significant increase when the generation went high (p < 0.05). The volume rate rises since more branches take more space. The coefficient of variation of terminal volumes
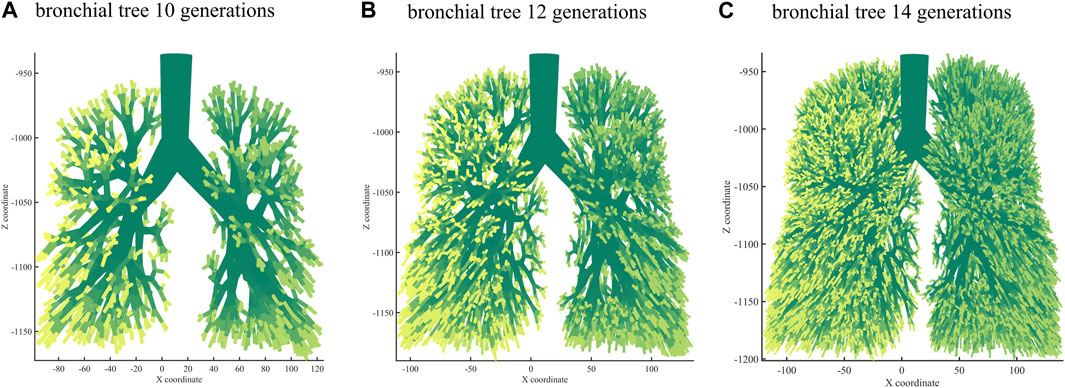
FIGURE 3. Bronchial tree model of the 10th (A), 12th (B) and 14th (C) generations.
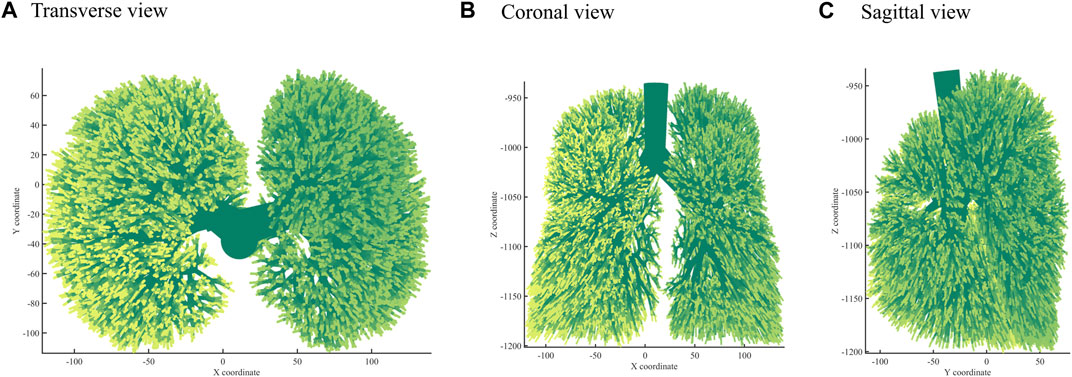
FIGURE 4. Three views: (A) Transverse view, (B) Coronal view, (C) Sagittal view of the 14th-generation bronchial tree model.
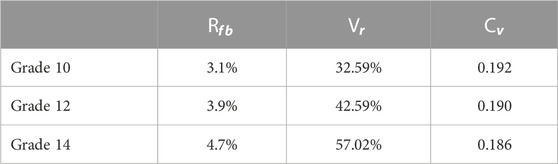
TABLE 6. Bronchial tree model of the 10th, 12th, and 14th generations with a performance index.
Table 7 shows the statistical size information of our constructed bronchial tree compared with the published data by Yeh and Schum (1980). The diameters of our bronchi are very close to their recorded data. The average length at different grades was close to the published data, too. Some generations were slightly longer, which makes more sense than the published data. The branches were supposed to drop in length from generation to generation. The turning angles were not that different to the published data, and they had the same kind of rise-drop pattern. We acquired some data from Kitaoka’s (2011) bronchial tree model. Their best performance model had a failure flow rate of 0.001, a volume ratio of 0.030, and a

TABLE 7. The size of our bronchial tree compared with the published data by Yeh and Schum (1980).
Researchers have devised several methods for bronchial modeling over the past decades. Some have considered space occupation and some have considered flow rate distribution. Some methods are used within research groups and some are partially open for others to use. Our suggested algorithm is novel and comparatively more straightforward, with some controllable coefficients. It is easy to reiterate, and we will share the code upon request after the publication of this paper. Our bronchial tree model uses the starting points of a real human bronchial tree and grows in the real lung contour space, making it look more like a natural lung. In future studies, when we dig out more branching data from the extracted bronchial tree from specific CT images, we can make a patient-specific model, which can be more useful in clinical research. It is planned that patient-specific modeling will be used to solve the lung performance index, possibly lobularly, in the future.
We proposed three sets of algorithms to build the morphology model of the human bronchial tree and found that the third one performs better than the other two. From three performance indices, we have optimized the coefficients that control the modeling, and this could be used in future studies to make a patient-specific lung model, which can be more useful in the clinical research area. This model can be modified to build.stl files that can be used in the airflow simulation with finite element CFD study. Additionally, .stl files can be used in three-dimensional printing to make a realistic model with soft material. The lower airway model can later be modified to match different lung disease situations to help clinical research areas. Our group will also look for a friendlier way to let other researchers use our methods.
The original contributions presented in the study are included in the article/Supplementary Material, further inquiries can be directed to the corresponding authors.
The studies involving human participants were reviewed and approved by the Ethical Committee of the First Affiliated Hospital of Guangzhou Medical College. The patients/participants provided their written informed consent to participate in this study.
YL: Conceptualization, Data curation, Investigation, Methodology, Writing–original draft, Writing–review and editing. WQ: Data curation, Methodology, Software, Writing–review and editing. LL: Data curation, Methodology, Software, Writing–review and editing. RC: Resources, Supervision, Validation, Writing–review and editing. YK: Funding acquisition, Methodology, Resources, Supervision, Writing–review and editing. SR: Methodology, Resources, Supervision, Writing–review and editing.
This research was funded by the National Key Research and Development Program of China (2022YFF0710800 and 2022YFF0710802); the National Natural Science Foundation of China (62071311); the Stable Support Plan for Colleges and Universities in Shenzhen of China (SZWD2021010); and the special program for key fields of colleges and universities in Guangdong Province (biomedicine and health) of China (2021ZDZX2008).
The authors declare that the research was conducted in the absence of any commercial or financial relationships that could be construed as a potential conflict of interest.
All claims expressed in this article are solely those of the authors and do not necessarily represent those of their affiliated organizations, or those of the publisher, the editors and the reviewers. Any product that may be evaluated in this article, or claim that may be made by its manufacturer, is not guaranteed or endorsed by the publisher.
Ciciliani, A. M., Langguth, P., and Wachtel, H. (2017). In vitro dose comparison of Respimat inhaler with dry powder inhalers for COPD maintenance therapy. Int. J. Chron. Obstruct. Pulmon. Dis. 12, 1565–1577. doi:10.2147/COPD.S115886
Farghadan, A., Poorbahrami, K., Jalal, S., Oakes, J. M., Coletti, F., and Arzani, A. (2020). Particle transport and deposition correlation with near-wall flow characteristic under inspiratory airflow in lung airways. Comput. Biol. Med. 120, 103703. doi:10.1016/j.compbiomed.2020.103703
Huang, F., Zhu, Q., Zhou, X., Gou, D., Yu, J., Li, R., et al. (2020). Role of CFD based in silico modelling in establishing an in vitro-in vivo correlation of aerosol deposition in the respiratory tract. Adv. Drug Deliv. Rev. 170, 369–385. doi:10.1016/j.addr.2020.09.007
Islam, M. S., Saha, S. C., Sauret, E., Gemci, T., and Gu, Y. T. (2017). Pulmonary aerosol transport and deposition analysis in upper 17 generations of the human respiratory tract. J. Aerosol Sci. 108, 29–43. doi:10.1016/j.jaerosci.2017.03.004
Kitaoka, H. (2011). A 4D model generator of the human lung. Forma 26, 19–24. doi:10.1164/ajrccm-conference.2011.183.1_MeetingAbstracts.A3581
Kolanjiyil, A. V., and Kleinstreuer, C. (2016). Computationally efficient analysis of particle transport and deposition in a human whole-lung-airway model. Part I: theory and model validation. Comput. Biol. Med. 79, 193–204. doi:10.1016/j.compbiomed.2016.10.020
Koullapis, P. G., Hofemeier, P., Sznitman, J., and Kassinos, S. C. (2018). An efficient computational fluid-particle dynamics method to predict deposition in a simplified approximation of the deep lung. Eur. J. Pharm. Sci. 113, 132–144. doi:10.1016/j.ejps.2017.09.016
Martinez-Garcia, M. A., De la Rosa-Carrillo, D., Soler-Cataluna, J. J., Catalan-Serra, P., Ballester, M., Vanaclocha, Y. R., et al. (2021). Bronchial infection and temporal evolution of bronchiectasis in patients with chronic obstructive pulmonary disease. Clin. Infect. Dis. 72 (3), 403–410. doi:10.1093/cid/ciaa069
Mohite, V., Deoghare, A. B., and Pandey, K. M. (2020). Modeling of human airways CAD model using CT scan data. Mater. Today. 22, 1710–1714. doi:10.1016/j.matpr.2020.02.189
Murray, C. D. (1926). The physiological principle of minimum work: I. The vascular system and the cost of blood volume. Proc. Natl. Acad. Sci. U. S. A. 12, 207–214. doi:10.1073/pnas.12.3.207
Poorbahrami, K., and Oakes, J. M. (2019). Regional flow and deposition variability in adult female lungs: a numerical simulation pilot study. Clin. Biomech. 66, 40–49. doi:10.1016/j.clinbiomech.2017.12.014
Rajaraman, P. K., Choi, J., Hoffman, E. A., O'Shaughnessy, P. T., Choi, S., Delvadia, R., et al. (2020). Transport and deposition of hygroscopic particles in asthmatic subjects with and without airway narrowing. J. Aerosol Sci. 146, 105581. doi:10.1016/j.jaerosci.2020.105581
Schmidt, A., Zidowitz, S., Kriete, A., Denhard, T., Krass, S., and Peitgen, H.-O. (2004). A digital reference model of the human bronchial tree. Comput. Med. Imaging Graph. 28, 203–211. doi:10.1016/j.compmedimag.2004.01.001
Srivastav, V. K., Paul, A. R., and Jain, A. (2019). Capturing the wall turbulence in CFD simulation of human respiratory tract. Math. Comput. Simul. 160, 23–38. doi:10.1016/j.matcom.2018.11.019
Tawhai, M. H., Pullan, A. J., and Hunter, P. J. (2000). Generation of an anatomically based three dimensional model of the conducting airways. Ann. Biomed. Eng. 28, 793–802. doi:10.1114/1.1289457
Weibel, E. R., Cournand, A. F., and Richards, D. W. (1963). Morphometry of the human lung. New York, NY, USA, Springer.
Keywords: model organisms, respiratory disease, pulmonary disease, bronchial tree, morphology model
Citation: Liu Y, Qiu W, Li L, Chen R, Kang Y and Ruan S (2023) A novel approach to pulmonary bronchial tree model construction and performance index study. Front. Pharmacol. 14:1254804. doi: 10.3389/fphar.2023.1254804
Received: 07 July 2023; Accepted: 13 November 2023;
Published: 23 November 2023.
Edited by:
Ranu Surolia, University of Alabama at Birmingham, United StatesReviewed by:
Mahesh Panchagnula, Indian Institute of Technology Madras, IndiaCopyright © 2023 Liu, Qiu, Li, Chen, Kang and Ruan. This is an open-access article distributed under the terms of the Creative Commons Attribution License (CC BY). The use, distribution or reproduction in other forums is permitted, provided the original author(s) and the copyright owner(s) are credited and that the original publication in this journal is cited, in accordance with accepted academic practice. No use, distribution or reproduction is permitted which does not comply with these terms.
*Correspondence: Yan Kang, a2FuZ3lhbkBibWllLm5ldS5lZHUuY24=; Shuangchen Ruan, cnVhbnNodWFuZ2NoZW5Ac3p0dS5lZHUuY24=
Disclaimer: All claims expressed in this article are solely those of the authors and do not necessarily represent those of their affiliated organizations, or those of the publisher, the editors and the reviewers. Any product that may be evaluated in this article or claim that may be made by its manufacturer is not guaranteed or endorsed by the publisher.
Research integrity at Frontiers
Learn more about the work of our research integrity team to safeguard the quality of each article we publish.