 Song Lei
 Xiujuan Lei
 Lian Liu
- School of Computer Science, Shaanxi Normal University, Xi’an, China
Predicting new therapeutic effects (drug repositioning) of existing drugs plays an important role in drug development. However, traditional wet experimental prediction methods are usually time-consuming and costly. The emergence of more and more artificial intelligence-based drug repositioning methods in the past 2 years has facilitated drug development. In this study we propose a drug repositioning method, VGAEDR, based on a heterogeneous network of multiple drug attributes and a variational graph autoencoder. First, a drug-disease heterogeneous network is established based on three drug attributes, disease semantic information, and known drug-disease associations. Second, low-dimensional feature representations for heterogeneous networks are learned through a variational graph autoencoder module and a multi-layer convolutional module. Finally, the feature representation is fed to a fully connected layer and a Softmax layer to predict new drug-disease associations. Comparative experiments with other baseline methods on three datasets demonstrate the excellent performance of VGAEDR. In the case study, we predicted the top 10 possible anti-COVID-19 drugs on the existing drug and disease data, and six of them were verified by other literatures.
1 Introduction
Since the outbreak of the new coronavirus pneumonia, the development of a new drug to treat the new coronavirus has become particularly important. However, traditional drug development is a high-cost, high-failure and slow process. It takes an average of 15 years from development to clinical use for an effective drug, and the economic cost is 8–1.5 billion dollars (Ashburn and Thor, 2004; Dickson and Gagnon, 2004; Adams and Brantner, 2006). Drug repurposing has the advantages of low R&D cost and short development time, so repurposing old drugs to treat common and rare diseases is becoming more and more attractive (Pushpakom et al., 2019). Drug repositioning is a strategy used to expand the applicability of older drugs (Padhy and Gupta, 2011). Those drugs that have been put into use have passed various clinical trials, and their safety and side effects have also been evaluated by relevant departments. Drug repositioning technology can shorten the development cycle to 6.5 years and the average cost to 3 million dollars (Nosengo, 2016). There is an urgent need to propose some new computational methods for drug relocation to facilitate drug development.
Traditional drug retargeting is based on biological activity, which is a wet experimental strategy that requires manual extensive analysis and testing of drugs in existing clinical compound databases. In recent years, with the continuous accumulation of high-throughput genomic and proteomic data related to drugs, many computational drug relocation methods have been generated, using some online public databases and bioinformatics tools to predict drugs, targets and interactions between diseases (Shim and Liu, 2014). At present, the existing computational drug relocation methods are divided into four categories, namely, methods based on machine learning, methods based on deep learning, methods based on network propagation, methods based on matrix decomposition and matrix completion (Luo et al., 2021).
Machine learning methods have been widely used to compute drug repositioning, usually treating drug-disease association prediction as a binary classification problem, treating drug and disease information as features. These approaches follow the principle of similarity that similar drugs are more likely to be associated with similar diseases. Gottlieb et al. (2011) proposed a computational approach, PREDICT, which constructs multiple drug-drug and disease-disease similarity measures, follows the method in Perlman et al. (2011) to construct categorical features, and then learns a logistic regression classifier to predict new links between drugs and disease. Pliakos and Vens (2020) predicted drug target interactions through tree ensemble learning and output space reconstruction. Napolitano et al. (2013) integrated information from multiple drug-related features to train a kernel-based SVM classifier. Moghadam et al. (2016) also established a support vector machine model to identify new drug-disease associations by employing nuclear fusion techniques and various features of drugs and diseases. However, the above feature-based classification methods rely heavily on the extraction of drug and disease features and the selection of negative samples. Therefore, more efficient and accurate algorithms have been developed, and matrix factorization and matrix completion techniques have been successfully applied to drug-disease association prediction. Matrix factorization methods assume that there are limited factors that determine drug, target, and disease relationships, which can be efficiently obtained by matrix factorization. Sajadi et al. (2022) predict drug-target interactions by a denoising autoencoder matrix factorization method. Dai et al. (2015) proposed a matrix factorization model to predict novel drug-disease correlations by integrating drug, gene, and disease information. Xuan et al. (2019a) developed a drug similarity-based non-negative matrix factorization model (DivePred) for predicting potential drug-disease associations. Matrix completion approaches reveal new indications by populating unknown elements in drug, target, and disease association matrices. Bagherian et al. (2021) proposed a coupled matrix-matrix completion approach to predict drug-target interactions. Luo et al. (2018) proposed a drug retargeting recommendation system (DRRS) for predicting drug-disease associations by integrating drug and disease similarity information. Compared with other methods, the above methods do not require negative samples and can flexibly integrate more prior information, but it is challenging to apply them to large-scale data due to the high complexity of matrix operations.
Deep learning is a subfield of machine learning that has been successfully applied in computer vision, speech recognition, bioinformatics, and many other fields, including prediction of drug-disease associations. Zeng et al. (2019) developed a deep learning method named deepDR. It takes full advantage of the topological information of drug similarity networks. However, deepDR does not consider disease-related information. Wang et al. (2021) proposed a deep learning model called Deep Forest multi-label classification for lncRNA disease association prediction. Yu et al. (2021) proposed LAGCN, which used graph convolutional networks to capture the feature information of drugs and diseases, and introduced an attention mechanism to combine the embeddings of different convolutional layers. Sajadi et al. (2021) proposed a deep unsupervised learning based drug-target interaction prediction method (AutoDTI++). Existing deep learning techniques mainly use the side information of drugs and diseases to build heterogeneous networks, apply deep learning techniques to heterogeneous networks to better learn the representation of drugs and diseases, and ultimately improve the prediction accuracy.
Network-based methods have become a widely used strategy in the field of computational drug relocation. The accuracy of drug repositioning is improved by capturing information similar to drug and disease characteristics in different kinds of biological networks. Luo et al. (2016) applied random walks on drug-disease dichotomous networks and drug-target-disease heterogeneous networks to predict novel drug-disease associations, respectively. Chen et al. (2012) predict drug-target interactions by random walk on heterogeneous networks. Wang et al. (2014) designed a three-layer heterogeneous network-based prediction method (TLHGBI) to infer potential links between drugs and diseases. Zeng et al. (2020) proposed a network-based arbitrary order proximity embedded deep forest method to predict drug-target interactions. Martinez et al. (2015) proposed DrugNet, a network-based prioritization method that integrates disease, drug, and target information to perform drug-disease and disease-drug prioritization simultaneously. The above methods introduce heterogeneous networks to represent the integration of different types of biological networks, and the similarities between different biological networks provides a new idea for predicting unobserved correlations between drugs and diseases. However, network-based methods focus on building heterogeneous networks while ignoring the biological knowledge of drugs and diseases. Future models that consider aspects should further improve drug-disease-association prediction.
In this article, we propose a heterogeneous network and variational graph autoencoder-based approach, VGAEDR, for predicting novel drug-disease associations. Considering the biological knowledge of drugs and diseases, we constructed three drug similarity networks and one disease similarity network based on three drug attribute information and disease semantic information, respectively, and then integrated the known drug-disease associations to construct drug- Disease Heterogeneous Networks. The VGAEDR model is divided into two parts. The first part is the Variational Graph Autoencoder (VGAE) module, which takes a heterogeneous network as input and learns and extracts its low-dimensional embedding representation. The second part is a multi-layer convolution module for further learning the embedding representation extracted by the VGAE module. Finally, the association prediction of the drug-disease pair is obtained through the fully connected layer and the softmax layer. We demonstrate through ablation experiments that three drug attribute similarities are helpful for model performance prediction. Comparative experiments with other methods on three datasets also show that our model has excellent performance. Case studies were also conducted to predict possible drugs against COVID-19.
The main contributions of this work are summarized as the following three points: 1) We propose VGAEDR, a deep learning method based on heterogeneous networks, which can effectively predict drug and disease associations. 2) VGAEDR integrates two models. Firstly, it uses a variational graph autoencoder to extract the feature representations of drugs and diseases from the drug-disease heterogeneous network, and then further learns the embedding representations of potential drugs and diseases through a convolutional neural network. 3) VGAEDR can quickly and accurately find candidate drugs against COVID-19.
2 Materials
2.1 Dataset
In order to take into account the biological association network and drug-disease-related biological knowledge at the same time, the data set in our study contains drug-disease association information and four attribute information. The four attribute information is the chemical substructure of the drug, drug target proteins and the gene annotation information for drugs, and disease semantic information of structural domains for diseases. The Comparative Toxicogenomics Database (CTD) contains many known drug-disease associations, and we screened 37,424 drug-disease associations (version 2022.7.31) from the CTD with marked therapeutic relationships, which corresponded to 6856 drugs and 2484 diseases. In order to predict the relationship between drugs and diseases in a more targeted manner, we extracted drugs that have therapeutic effects on more than 10 diseases and diseases affected by more than 10 drugs, and finally obtained 855 drugs, 727 diseases and 29,274 associations. Our study also collected two widely used benchmark datasets, the first one obtained by Zhang et al. (2018) from the CTD database, which contained 18416 known drug-disease associations between 269 drugs and 598 diseases. The second dataset is the gold standard dataset used in Liang et al. (2017), which contains 3051 known drug-disease associations between 763 drugs and 681 diseases. Our method utilizes both drug and disease similarity information, and the chemical substructures of the drug are established by obtaining the chemical fingerprints of the drug from the PubChem database (Kim et al., 2016). The domains of drug target proteins were obtained from the InterPro database (Mitchell et al., 2015). Gene annotation information for drug target proteins was obtained from the UniPort database (Renaux and UniProt, 2018). According to Wang et al. (2010), we compute the semantic similarity of diseases by constructing a directed acyclic graph (DAG) of diseases. Disease terms for constructing DAGs were obtained from the United States National Library of Medicine (ULM). The known drug-disease association is used as a positive sample set, and the unrelated drugs and diseases in the positive sample set are randomly paired to construct a negative sample set, and the number of negative samples is equal to the number of positive samples to avoid imbalance problems. Simple statistics about these two datasets are shown in Table 1.
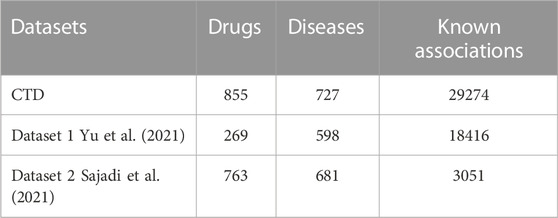
TABLE 1. The statistics of three datasets.
2.2 Construction of the heterogeneous network
In this section, we construct a drug similarity network, a disease similarity network and a drug-disease association network from the drug feature information, disease semantic information, and drug-disease association information in the above datasets, respectively. There are three kinds of drug feature information, so three drug similarity networks are constructed, which reflect the similarity of two drugs from different perspectives. Then drug-disease heterogeneous network is constructed based on the drug similarities of different classes.
2.2.1 Drug-disease association network
We build a drug-disease relationship matrix

FIGURE 1. (A) matrix representation of drug-disease associations, (B) matrix representation of three drug similarities, (C) matrix representation of disease similarities, (D) construction of drug–disease heterogeneous network.
2.2.2 Drug Similarity Network
Considering the influence of biological knowledge of drugs on the prediction of drug-disease relationship, we introduce three different drug feature information, and multiple features can describe drug similarity from multiple different perspectives. Usually, the more chemical substructures two drugs have, the more similar their effects are. Similarly, when two drugs are present with more target proteins gene ontology annotation of domains or target proteins, which are often more similar (Ding et al., 2014). In previous studies (Xuan et al., 2019b), the Jaccard index and cosine similarity were commonly used to measure drug similarity. LAGCN (Yu et al., 2021) used these two methods separately to calculate drug similarity and found that the results of Jaccard index were slightly better than cosine similarity. Therefore, we use the Jaccard index to calculate the chemical substructure similarity of drugs, represented by a matrix
where
2.2.3 Disease similarity network
There are also similarities between diseases, and calculating disease similarity is crucial to building disease networks. According to previous studies (Wang et al., 2010), diseases can usually be represented by a directed acyclic graph (DAG), where nodes represent diseases and edges represent relationships between nodes. Each disease has associated disease terms in the DAG, and when two diseases have more of the same disease terms, they are often more similar. Here the graph of disease d is represented as
where
where
To enable our model to learn more and deeper drug-disease-related information, we construct heterogeneous networks through drug-disease similarity networks and drug-disease association networks. The three drug similarity networks reflect the similarity between two drugs from different perspectives, so we construct a drug-disease heterogeneous network based on the similarity of three drugs (Figure 1D). Each network contains two types of nodes (drug nodes, disease nodes) and three types of edges (drug-drug, disease-disease, and drug-disease). The nodes in the drug similarity network and the disease similarity network are connected, but there is no edge between the two networks. We add corresponding edges between these two networks based on known drug-disease associations. Specifically, if
where
2.3 Method
In this section we build a drug-disease relationship prediction model VGAEDR based on Variational Graph Autoencoders (VGAE) and CNN. The input of the model is a drug-disease heterogeneous network, which learns the network information of drug-disease through a graph variational autoencoder ensemble and generates latent low-dimensional feature matrix. The feature matrix is then fed into a multi-layer convolutional module to obtain the final drug-disease feature representation. Finally, the association probability of the drug-disease pair is obtained through the fully connected layer and the softmax layer. The structure of the VGAEDR model is shown in Figure 2.
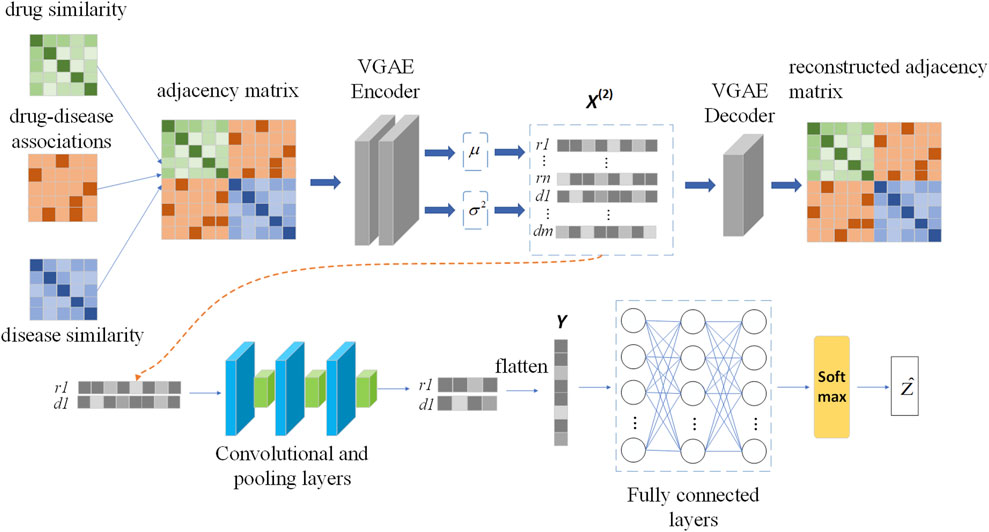
FIGURE 2. The workflow of VGAEDR model.
2.3.1 Graph representation learning based on VGAE
Variational Graph Autoencoder (VGAE) is an unsupervised learning framework for graph data structures based on Variational Autoencoder (VAE). The model contains two networks, an inference network and a generative network, which can also be interpreted as an encoder and a decoder. The encoding layer uses graph convolution to encode the known graph to learn a distribution of node vector representations, sample the node vector representations from the distribution, and then reconstruct the graph using an inner-product decoder.
In order to learn the network information formed by multiple connections between drug and disease nodes, we take the adjacency matrix
Then, the low-dimensional feature representation of drug disease nodes can be obtained through the first GCN layer:
where
where
where
The decoder reconstructs the adjacency matrix by computing the inner product between the latent variables generated by the encoder:
The decoder is defined as follows:
where
Optimization: In order to minimize the difference between the generated graph and the original graph, the loss function of the VGAE module includes the distance metric between the generated graph and the original graph, and the nodes represent the divergence of the vector distribution and the normal distribution. Furthermore, we optimize the loss function of VGAE with the Adam function. The loss function is defined as follows:
where
2.3.2 CNN-based feature dimension reduction
We apply VGAE to a drug-disease heterogeneous network to learn feature representations for drug and disease nodes. Next, a convolutional neural network (CNN) is used to mine deeper feature representations of drug-disease nodes. The feature representation learning of drug node r1 and disease node d1 is shown in Figure 2.
The convolution module contains three convolution layers and pooling layers, and the number of filters increases layer by layer. The number of filters in the second layer of convolution is twice that of the first layer, and the number of filters in the third layer of convolution is three times that of the first layer. The length and width of the filters are l and w, respectively, and the number of filters in the first layer of convolution is nconv. We pad zeros around the drug-disease node feature matrix
where
Similarly, Mpool, k gets the latent representation U of drug and disease nodes after going through the second and third convolutional layers and max pooling layers, and then flattens it into a vector Y. Y takes as input to a fully connected layer, which is similar to a traditional neural network, where all neurons are connected to each other and the output is the result of the weighted sum of all outputs given by previously connected neurons. We used 1024 nodes in the first two fully connected layers, each followed by a dropout layer with rate 0.1. The third layer consists of 512 nodes. Finally, a softmax layer is applied to Y to obtain the association probability Ẑ of the drug-disease pair.
where W and b are the weight matrix and bias vector, respectively. As a binary classification task, we use a cross-entropy loss function to evaluate the error between the true association and the predicted outcome. The loss function is as follows:
where Z is the true label value.
3 Experiments
3.1 Experiment settings and evaluation metrics
We use 5-fold cross-validation to evaluate the predictive performance of our model and other models. All known drug-disease associations were considered positive samples and randomly divided into five equal parts. Since the number of negative samples in our dataset was significantly more than the number of positive samples and they all randomly sampled negative samples when compared with other methods, in order to unify the standard, we randomly selected some unobserved drug-disease associations equal to the number of positive samples as negative samples and randomly divided them into five equal parts. Positive samples and negative samples are taken together as a sample set. Next, we take four samples from the positive samples and negative samples respectively as the cross-validation set, and the remaining one sample in each of the two sample sets is used as the independent test set, thus ensuring that there is no overlap between the cross-validation set and the independent test set. We use a cross-validation set for model pre-training and parameter analysis in our experiments, and an independent test set for performance comparison with other baseline methods. 5 times of training and testing are performed, and the test results of these 5 times are averaged.
We mainly use seven evaluation metrics: area under the receiver operating characteristic (ROC) curve (AUC), area under the precision-recall curve (AUPR), F1_SCORE, accuracy, specificity, precision, and recall. The AUC value can reflect the probability that the positive samples predicted by the model are ahead of the negative samples, and when the distribution of positive and negative samples changes, its value can remain basically unchanged. Therefore, this evaluation index can reduce the interference caused by different test sets. A more objective measure of the performance of the model itself (Ling et al., 2003). The two indicators of precision and recall are usually used to evaluate the analysis effect of the binary classification model. F1_SCORE is defined as the harmonic mean of precision and recall. Our model predicts the association probability for each drug-disease pair in an independent test set, and if the association probability is above a given threshold, the sample is predicted to be a positive sample, otherwise it is a negative sample. The ROC curves are drawn based on TPR and FPR at different thresholds, and the true positive rate (TPR) and false positive rate (FPR) at the corresponding thresholds are as follows:
where TP(TN) is the number of samples correctly identified as positive samples (negative samples) and FP(FN) is the number of false positive samples (negative samples).
The number of positive samples in our dataset is much smaller than the number of negative samples, and there is a problem of imbalanced data categories. However, AUC is often less informative than AUPR when evaluating some data imbalance problems (Saito and Rehmsmeier, 2015). Therefore, we also use AUPR as an important evaluation metric, and the PR curve is drawn based on precision and recall. Precision and recall are defined as follows:
3.2 Parameter sensitivity analysis
In this section we analyze the hyperparameter sensitivity of VGAEDR. Since VGAEDR is trained and tested in batches on the data, the choice of batch size may have different effects on the performance of the model. Under normal circumstances, if the batch size is too small, it will take a long time, and the gradient will oscillate seriously, which is not conducive to convergence; if the batch size is too large, the gradient direction of different batches will not change, and it is easy to fall into a local minimum. We tested the effect of different batch sizes on the model performance on the CTD dataset, and the experimental results are shown in Figure 3. The model achieves the best performance when the batch size is 128. It is worth noting that the embedding dimension D of the first GCN layer in the encoder of VGAE can contribute to the improvement of the model performance, we test on the CTD dataset, where D is (32, 64, 128, and 256), as shown in Figure 4, and finally we choose 128 as the best embedding dimension.
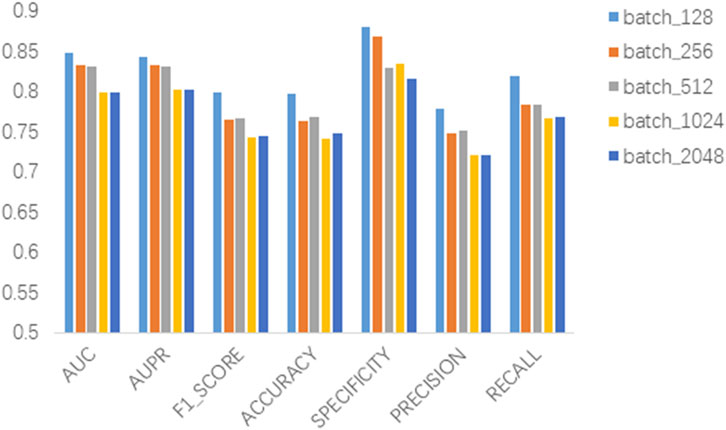
FIGURE 3. Effect of batch size.
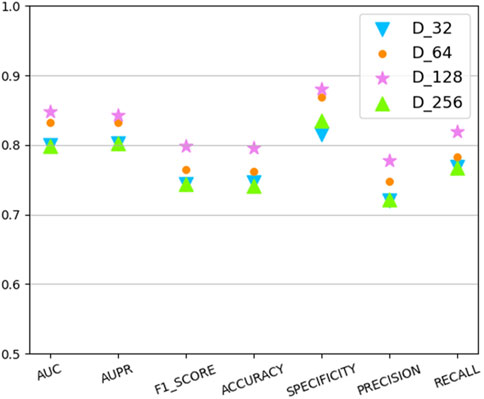
FIGURE 4. The effect of embedding dimension.
3.3 Ablation experiments
Three different drug attribute data were used in our study, namely the chemical substructure of the drug, the domain of the drug target protein, and the gene annotation of the drug target protein. To validate the contribution of these three drug attribute data to our predictive model, we performed ablation experiments. The chemical substructure of the drug, the domain of the drug target protein, and the gene annotation data of the drug target protein are represented by Che, Dom, and Anno, respectively. As shown in Figure 5, firstly, the optimal results are achieved when training the model with Che, Dom, and Anno data simultaneously. Second, the AUC and AUPR of the model trained with Che and Dom were 0.0325 and 0.0341 lower than the model trained with all data. The models trained on Che and Anno have a drop of 0.0118 and 0.031 in AUC and AUPR, respectively, compared to the final model. Finally, the model achieved the lowest AUC and AUPR without Che. Obviously, the use of medicinal chemical substructure data has the greatest impact on model training, and the use of drug target protein domains and gene annotations has similar effects on model performance. A possible reason for this is that drugs generally have more defined chemical substructures, and they have fewer experimentally confirmed targets (Xuan et al., 2021). Ablation experiments show that training the model with data related to drug attributes is helpful for the predictive performance of the model.
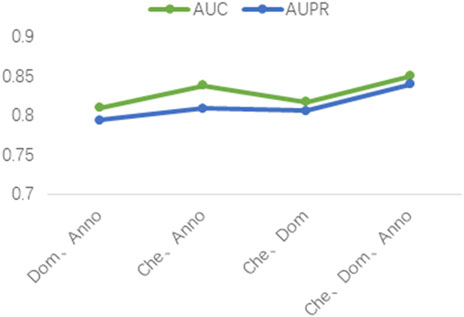
FIGURE 5. Results of the ablation studies.
3.4 Comparison of graph representation methods
Besides VGAE, there are other graph representation learning methods that can also learn network representations of biomolecules in bioinformatics networks, such as GCN (Kipf and Welling, 2016) and GAT (Velikovi, 2018). To investigate their performance differences with VGAE, we integrate them with the convolutional neural network part of the VGAEDR model to obtain two variant models GCN_DR and GAT_DR. The three models are trained and tested on Dataset1, and the experimental results are shown in Figure 6. VGAEDR achieves the state-of-the-art performance, which indicates that VGAE is more suitable for learning network representations of drug-diseases. GCN_DR may be due to the fact that GCN is too smooth and the performance is mediocre. The poor performance of GAT_DR may be caused by the fact that GAT does not fully utilize the edge information in the drug-disease network.
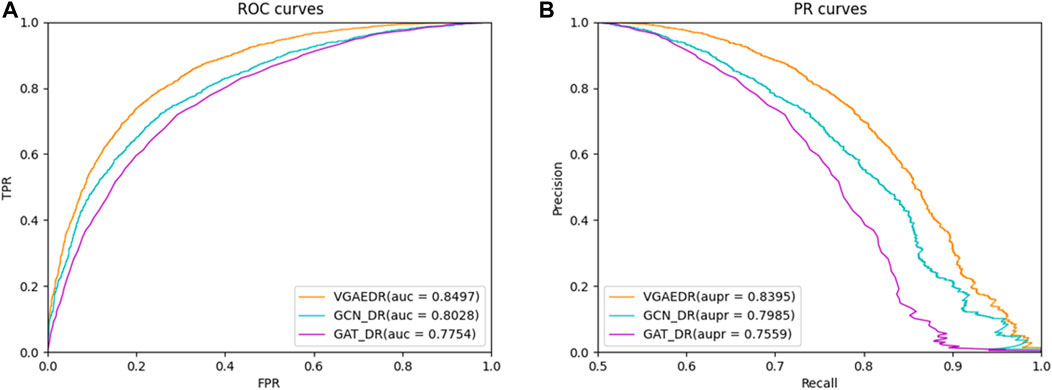
FIGURE 6. (A) The ROC curves of different graph representation learning, (B) The PR curves of different graph representation learning.
3.5 Comparison with other methods
To validate the performance of the VGAEDR model, we compare with five state-of-the-art drug-disease association prediction methods on three datasets, such as DeepDR (Zeng et al., 2019), SCMFDD (Zhang et al., 2018), LRSSL (Liang et al., 2017), BNNR (Yang et al., 2019) and GRGMF (Zhang et al., 2020). These methods are mainly divided into two categories: methods based on heterogeneous networks and methods based on matrix factorization. To make the comparison results more convincing, we train and test all methods on the same dataset, while each comparison method uses the best parameter settings from the corresponding literature. Below we briefly describe the five comparison methods:
1) DeepDR Zeng et al. (2019) integrates drug-disease associations and multiple drug similarity networks into a heterogeneous network to predict novel drug-disease associations through multimodal deep autoencoders and collective variational autoencoders.
2) SCMFDD Zhang et al. (2018) projects drug-disease associations into two low-rank spaces, revealing latent features of drugs and diseases, and then introduces drug-feature-based similarity and disease semantic similarity as constraints on drugs and diseases in the low-rank space.
3) LRSSL Liang et al. (2017) fuses medicinal chemical information, drug target domain information and target annotation information to predict novel drug-disease associations based on Laplacian regularized sparse subspace learning.
4) BNNR Yang et al. (2019) integrates drug-drug, drug-disease, and disease-disease networks into a drug-disease heterogeneous network, and then uses the bounded kernel norm regularization (BNNR) method to complete the drug-disease under low-rank hypothesis matrix.
5) GRGMF Zhang et al. (2020) formulated a generalized matrix factorization model that considers the neighborhood information of each node when learning the latent representation of each node, and can learn the neighborhood information of each node adaptively.
As shown in Table 2, VGAEDR achieves the best performance on all metrics in the CTD dataset compared with the other five methods. To verify the robustness of VGAEDR, we also conduct experiments on Dataset1 and Dataset2. Table 3 shows the performance comparison results of VGAEDR and the other five methods on Dataset1. The AUC value of VGAEDR is the highest of 0.8497, which is 1.93% higher than the second-ranked DeepDR and 3.36% higher than the third-ranked SCMFDD. DeepDR can only integrate drug-related feature information due to the structure of collective variational autoencoder model. However, without disease feature information, the prediction performance of the model is often affected. SCMFDD only uses a single drug feature information to build the prediction model, when we have multiple drug features, we can calculate the similarity of different drug features. Combining different information generally improves performance, which may be the reason why VGAEDR performs better than SCMFDD. BNNR also only considers a single drug (disease) similarity, and performs matrix completion on heterogeneous networks, which leads to poor performance of the model on datasets with large amounts of data to a certain extent. LRSSL has an obvious drawback that the regularization of disease similarity may fail when the number of diseases is too small, thus affecting the prediction performance. GRGMF ranks relatively low in performance, which may be due to the fact that it does not mine deeper representations of the drug-disease network and the fact that matrix factorization models usually perform moderately well when dealing with sparse matrices. In other evaluation indicators, VGAEDR also achieved the best results. The improved performance of VGAEDR is mainly attributed to its deep learning capabilities, as well as its ability to comprehensively learn and mine drug-disease heterogeneous networks. Table 4 shows the performance comparison results of VGAEDR and the other five methods on Dataset2. Except recall, VGAEDR outperforms these five comparison methods in all other evaluation metrics. However, compared with the results on Dataset1, the AUC of VGAEDR is reduced by 0.91%, the AUPR is reduced by 0.93%, the F1_SCORE is reduced by 1.2%, and other indicators are also reduced. We reasoned that this might be because the known drug-disease associations on Dataset2 were far less than those on Dataset1.
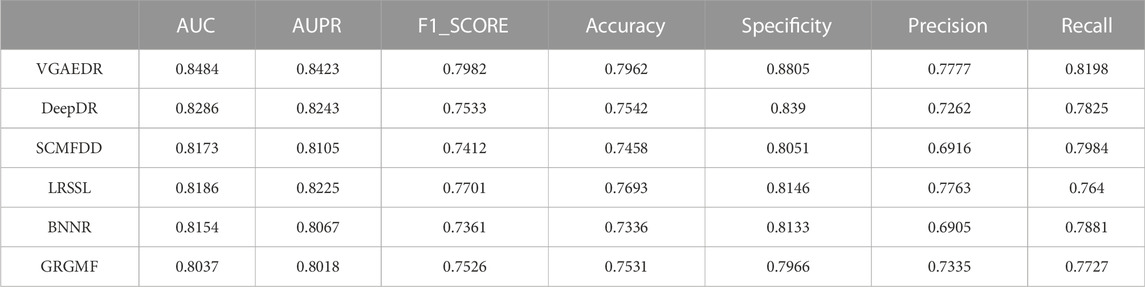
TABLE 2. Performance of comparison methods on CTD.
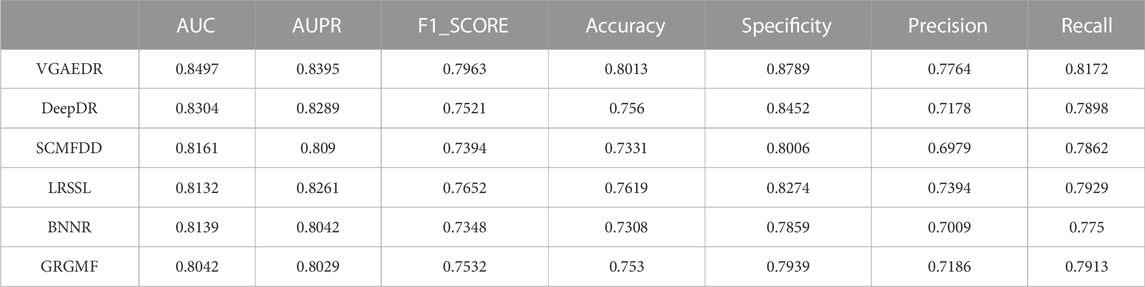
TABLE 3. Performance of comparison methods on Dataset1.
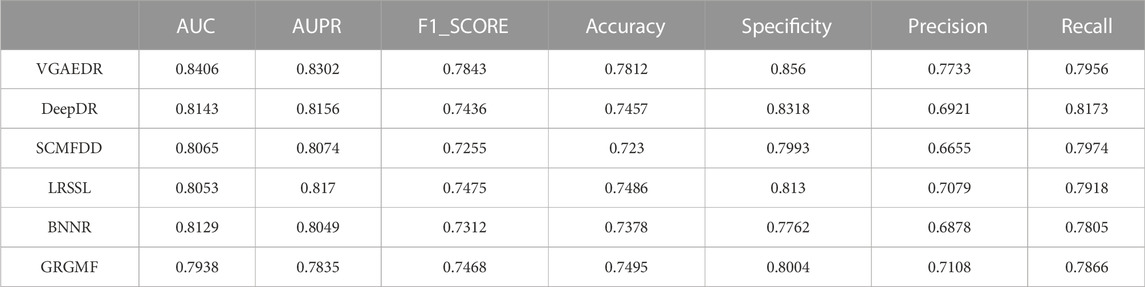
TABLE 4. Performance of comparison method on Dataset2.
To validate our inferences, specifically, that the number of known drug-disease associations is an important factor in predicting potential drug-disease associations, which may significantly affect the performance of the method. We took Dataset1 as a sample, and randomly selected 70%, 80%, and 90% of them, which is equivalent to obtaining four datasets with different numbers. We compare the performance of VGAEDR and five other methods on these four datasets, as shown in Figures 7, 8, as the number of known drug-disease associations increases, the AUC and AUPR of all methods basically becomes higher, where VGAEDR achieves the best performance. This suggests that more drug-disease associations lead to better predictive performance of the model.
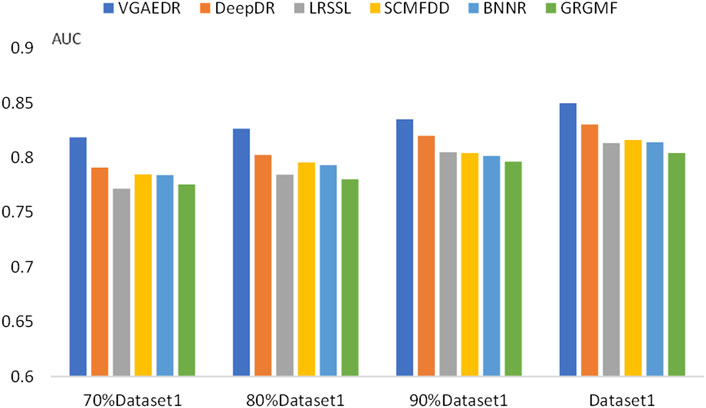
FIGURE 7. AUC of methods based on different fractions of known associations.
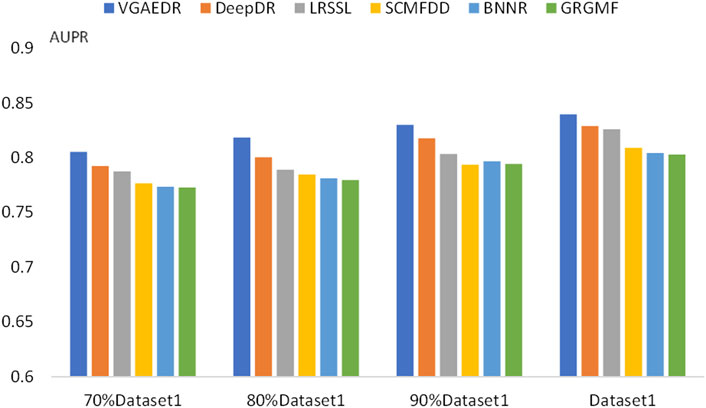
FIGURE 8. AUPR of methods based on different fractions of known associations.
3.6 Case studies
Coronavirus disease 2019 (COVID-19), which has spread globally and has a significant impact on the global economy and health, is caused by severe acute respiratory syndrome coronavirus 2 (SARS-CoV-2). Although the medical diagnosis of COVID-19 is rapid and effective, no effective treatment currently exists. Therefore, potential therapeutic drugs should be screened. Drug repositioning is considered a strategy that can speed up the treatment process. We predicted the top 10 possible anti-covid-19 drugs, as shown in Table 5, and 6 of them can be found in the relevant literature. Since the three datasets we used do not contain data on COVID-19 and antiviral drugs, we used the HDVD database mentioned in Zhang et al. (2022). According to Li et al. (2021), glycyrrhizic acid (GA) is clinically an anti-inflammatory drug against inflammatory stress caused by pneumonia, and the combination of glycyrrhizic acid and vitamin C can serve as a potential treatment for COVID-19 Treatment options. Zhao et al. (2021) mentioned in their study that GA has antiviral effects on different viruses, including SARS-related coronaviruses. According to its characteristics, GA is considered as a promising novel drug candidate against SARS-CoV-2 by testing alone or in combination with other drugs. Favipiravir is an established treatment for influenza and is being more explored for its role in treating COVID-19. It is the first oral antiviral drug approved for mild to moderate COVID-19. Studies that have been done in China, Japan, and Russia suggest that favipiravir is a promising treatment for this disease (Joshi et al., 2021). In a study Manabe et al. (2021), favipiravir induced viral clearance within 7 days and contributed to clinical improvement within 14 days. The results suggest that favipiravir has a high potential to treat COVID-19, especially in patients with mild to moderate disease. Vaccination is also a way to protect against viruses, and Burnett (Burnett et al., 2017) studied the global impact of rotavirus vaccination on childhood hospitalization and diarrheal mortality. Arouche et al. (2020) studied the molecular docking of Bcx4430 and five other potential pharmacologically active inhibitor compounds that can be used clinically against the COVID-19 virus, Bcx4430 interacts with the main COVID-19 protease and the COVID-19 N3 protease inhibitor complex. In molecular docking studies, tenofovir was recently shown to bind to SARS-CoV-2 RNA polymerase (RdRp) with a binding energy comparable to that of natural nucleotides and to a similar extent to that of remdesivir. Therefore, tenofovir has recently been suggested as a potential treatment for COVID-19 (Harter et al., 2020). Umifenovir can prevent viral contact and penetration of host cells by avoiding fusion of viral lipid capsids to cell membranes, and can inhibit COVID-19 infection by interfering with SARS-COV-2 release from intracellular vesicles (Nojomi et al., 2020). Therefore, umifenovir is considered as one of the antiviral drugs that can effectively treat COVID-19 patients. Tacrolimus may be effective in the treatment of post-COVID-19 acute interstitial lung disease, but does not prevent the progression of pulmonary fibrosis (Ohgushi et al., 2022).
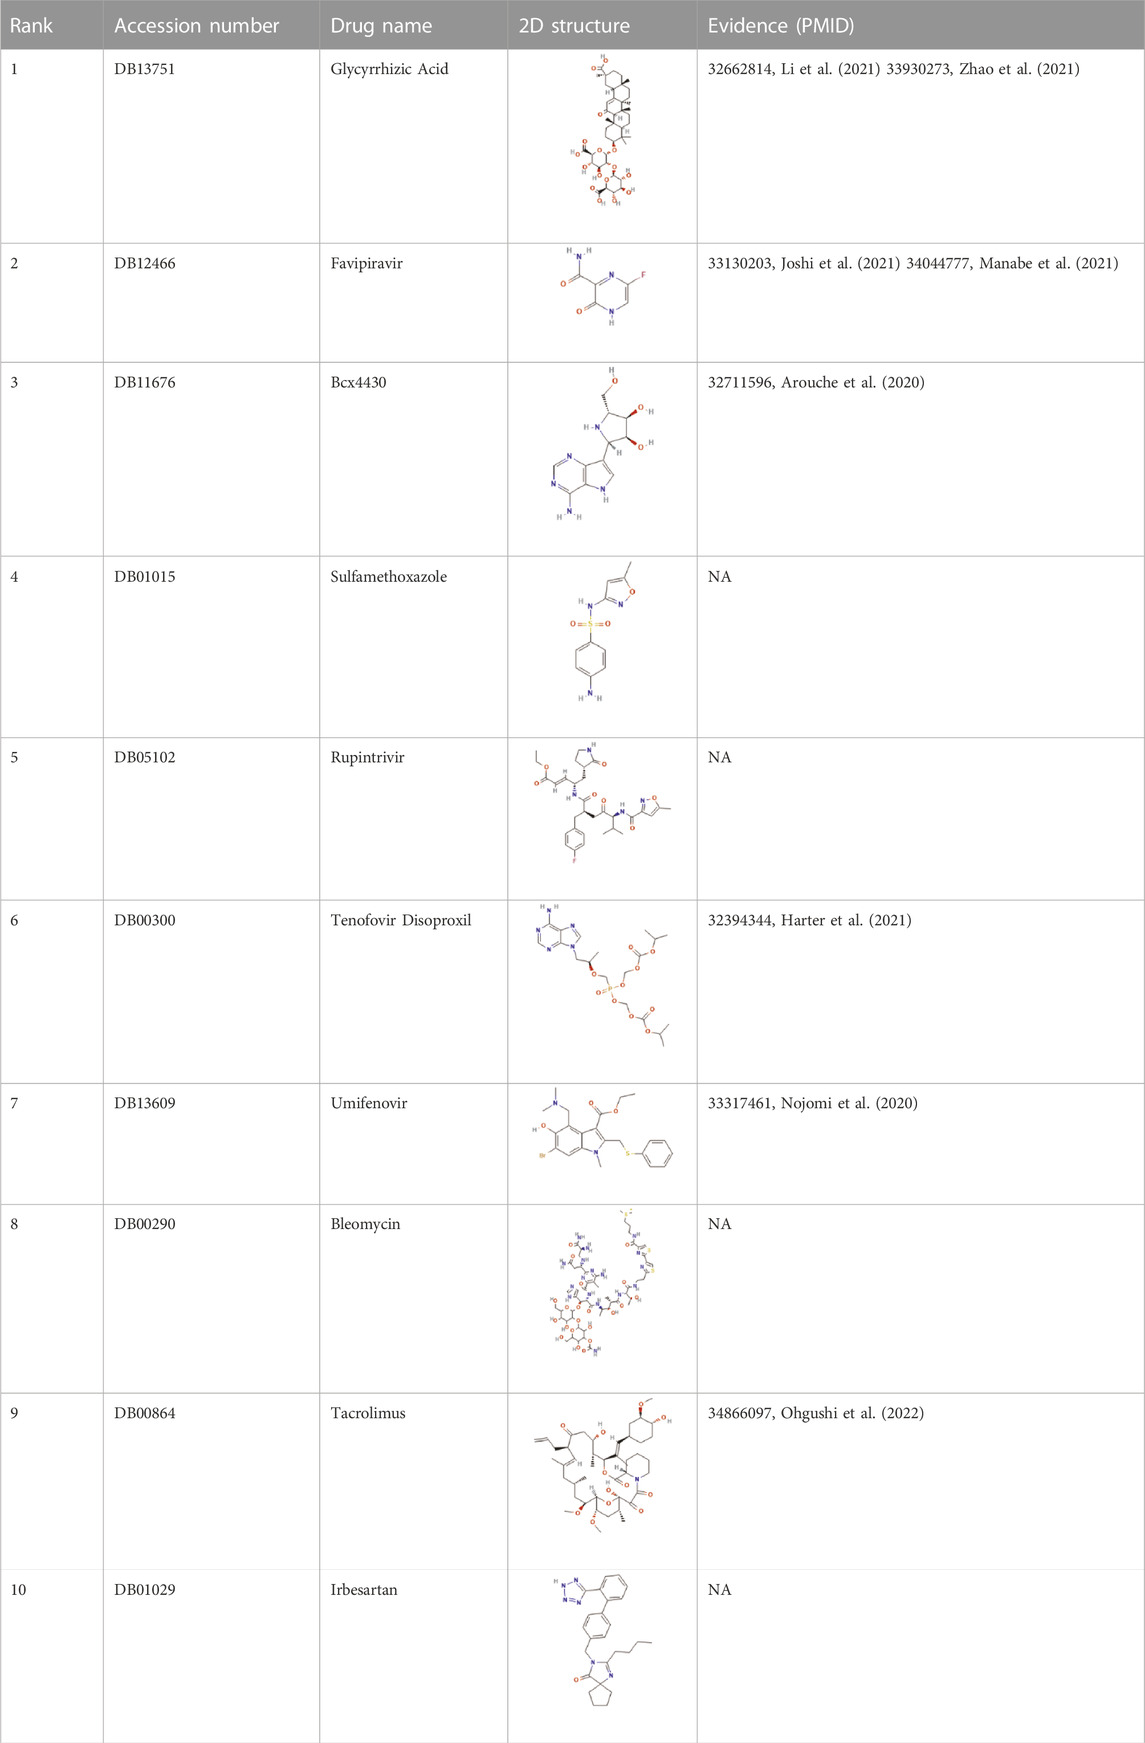
TABLE 5. Top 10 possible anti-COVID-19 drugs predicted by the VGAEDR.
Therefore, the case study demonstrates that VGAEDR can identify novel drug-disease associations and effectively predict drugs that may fight COVID-19.
4 Conclusion
In this article, we propose a drug repositioning method, VGAEDR, based on variational graph autoencoders and heterogeneous networks. First, a drug-disease heterogeneous network is constructed based on three different drug feature similarities, disease semantic similarities, and known drug-disease associations. Then, a Variational Graph Autoencoder (VGAE) module for learning heterogeneous networks is established. The heterogeneous network is used as the input of the VGAE module, and then it learns its latent low-dimensional feature representation and generates the reconstructed network. Finally, a multi-layer convolutional neural network module is built to further learn its low-dimensional feature representation. We input the feature representations finally learned by the two modules into fully connected layers and softmax layers to predict drug-disease associations. Ablation experiments show that using multiple drug feature data can improve the predictive performance of the model. The comparison results with other five methods on the three datasets demonstrate the excellent performance of our model. VGAEDR also achieves the best results in datasets containing different numbers of drug-disease associations, while demonstrating that the greater the number of known drug-disease associations, the better the predictive performance of the model. We conducted case studies on existing drug and disease data, and predicted the top 10 possible anti-COVID-19 drugs, six of which were verified by other literatures. It was demonstrated that VGAEDR is a reliable drug repositioning method.
In the future work, since we only use the disease semantic similarity as the disease feature in this paper, we will consider more disease similarity information in the subsequent work, such as disease phenotype similarity and disease Gaussian kernel similarity, to integrate this disease feature information for better drug repositioning. We are also ready to collect and collate more drug-disease association data from more databases and literature to train the model and thus improve its predictive ability. In addition, we only have reliable positive samples (known drug-disease associations), negative samples are selected by random sampling, and more algorithms for selecting negative samples will be considered in future work. At present, we can only obtain information from relevant literature and reports to verify new drug-disease associations. In the future, if there is an opportunity, we hope to cooperate with researchers in the field of biochemistry to verify the candidate drugs for a disease we predict through a series of wet experimental methods.
Data availability statement
The original contributions presented in the study are included in the article/Supplementary Material, further inquiries can be directed to the corresponding author.
Ethics statement
Ethical review and approval was not required for the study on human participants in accordance with the local legislation and institutional requirements. Written informed consent for participation was not required for this study in accordance with the national legislation and the institutional requirements. Written informed consent was not obtained from the individual(s) for the publication of any potentially identifiable images or data included in this article.
Author contributions
SL proposed the concept and idea, implemented the algorithm and wrote the draft manuscript. XL and LL evaluated the results and revised the manuscript.
Funding
This work was supported by the National Natural Science Foundation of China (62272288, 61972451, and 61902230) and by Fundamental Research Funds for the Central Universities (GK202103091).
Acknowledgments
Thanks to Lei Xiujuan for her careful guidance and the help of our lab colleagues.
Conflict of interest
The authors declare that the research was conducted in the absence of any commercial or financial relationships that could be construed as a potential conflict of interest.
Publisher’s note
All claims expressed in this article are solely those of the authors and do not necessarily represent those of their affiliated organizations, or those of the publisher, the editors and the reviewers. Any product that may be evaluated in this article, or claim that may be made by its manufacturer, is not guaranteed or endorsed by the publisher.
References
Adams, C. P., and Brantner, V. V. (2006). Estimating the cost of new drug development: Is it really $802 million? Health Aff. 25 (2), 420–428. doi:10.1377/hlthaff.25.2.420
Arouche, T. D., Reis, A. F., Martins, A. Y., S Costa, J. F., Carvalho Junior, R. N., and J C Neto, A. M. (2020). Interactions between remdesivir, ribavirin, favipiravir, galidesivir, hydroxychloroquine and chloroquine with fragment molecular of the COVID-19 main protease with inhibitor N3 complex (PDB ID:6LU7) using molecular docking. J. Nanosci. Nanotechnol. 20 (12), 7311–7323. doi:10.1166/jnn.2020.18955
Ashburn, T. T., and Thor, K. B. (2004). Drug repositioning: Identifying and developing new uses for existing drugs. Nat. Rev. Drug Discov. 3 (8), 673–683. doi:10.1038/nrd1468
Bagherian, M., Kim, R. B., Jiang, C., Sartor, M. A., Derksen, H., and Najarian, K. (2021). Coupled matrix-matrix and coupled tensor-matrix completion methods for predicting drug-target interactions. Briefings Bioinforma. 22 (2), 2161–2171. doi:10.1093/bib/bbaa025
Burnett, E., Jonesteller, C. L., Tate, J. E., Yen, C., and Parashar, U. D. (2017). Global impact of rotavirus vaccination on childhood hospitalizations and mortality from diarrhea. J. Infect. Dis. 215 (11), 1666–1672. doi:10.1093/infdis/jix186
Chen, X., Liu, M. X., and Yan, G. Y. (2012). Drug-target interaction prediction by random walk on the heterogeneous network. Mol. Biosyst. 8 (7), 1970–1978. doi:10.1039/c2mb00002d
Dai, W., Liu, X., Gao, Y., Chen, L., Song, J., Chen, D., et al. (2015). Matrix factorization-based prediction of novel drug indications by integrating genomic space. Comput. Math. Methods Med. 2015, 275045. doi:10.1155/2015/275045
Dickson, M., and Gagnon, J. P. (2004). Key factors in the rising cost of new drug discovery and development. Nat. Rev. Drug Discov. 3 (5), 417–429. doi:10.1038/nrd1382
Ding, H., Takigawa, I., Mamitsuka, H., and Zhu, S. (2014). Similarity-based machine learning methods for predicting drug-target interactions: A brief review. Briefings Bioinforma. 15 (5), 734–747. doi:10.1093/bib/bbt056
Gottlieb, A., Stein, G. Y., Ruppin, E., and Sharan, R. (2011). Predict: A method for inferring novel drug indications with application to personalized medicine. Mol. Syst. Biol. 7, 496. doi:10.1038/msb.2011.26
Harter, G., Spinner, C. D., Roider, J., Bickel, M., Krznaric, I., Grunwald, S., et al. (2020). COVID-19 in people living with human immunodeficiency virus: A case series of 33 patients. Infection 48 (5), 681–686. doi:10.1007/s15010-020-01438-z
Joshi, S., Parkar, J., Ansari, A., Vora, A., Talwar, D., Tiwaskar, M., et al. (2021). Role of favipiravir in the treatment of COVID-19. Int. J. Infect. Dis. 102, 501–508. doi:10.1016/j.ijid.2020.10.069
Kim, S., Thiessen, P. A., Bolton, E. E., Chen, J., Fu, G., Gindulyte, A., et al. (2016). PubChem substance and compound databases. Nucleic Acids Res. 44 (D1), D1202–D1213. doi:10.1093/nar/gkv951
Kipf, T. N., and Welling, M. (2016). Semi-supervised classification with graph convolutional networks. arXiv preprint arXiv:1609.02907.
Li, R., Wu, K., Li, Y., Liang, X., Lai, K. P., and Chen, J. (2021). Integrative pharmacological mechanism of vitamin C combined with glycyrrhizic acid against COVID-19: Findings of bioinformatics analyses. Briefings Bioinforma. 22 (2), 1161–1174. doi:10.1093/bib/bbaa141
Liang, X. J., Zhang, P., Yan, L., Fu, Y., Peng, F., Qu, L., et al. (2017). Lrssl: Predict and interpret drug-disease associations based on data integration using sparse subspace learning. Bioinformatics 33 (8), 1187–1196. doi:10.1093/bioinformatics/btw770
Ling, C. X., Jin, H., and Zhang, H. J. S.-V. (2003). Auc: A better measure than accuracy in comparing learning algorithms, Adv. Artif. Intelligence,Lecture Notes Comput. Sci., 329–341. doi:10.1007/3-540-44886-1_25
Luo, H. M., Li, M., Wang, S., Liu, Q., Li, Y., and Wang, J. (2018). Computational drug repositioning using low-rank matrix approximation and randomized algorithms. Bioinformatics 34 (11), 1904–1912. doi:10.1093/bioinformatics/bty013
Luo, H. M., Li, M., Yang, M., Wu, F. X., Li, Y., and Wang, J. (2021). Biomedical data and computational models for drug repositioning: A comprehensive review. Briefings Bioinforma. 22 (2), 1604–1619. doi:10.1093/bib/bbz176
Luo, H. M., Wang, J., Li, M., Luo, J., Peng, X., Wu, F. X., et al. (2016). Drug repositioning based on comprehensive similarity measures and Bi-Random walk algorithm. Bioinformatics 32 (17), 2664–2671. doi:10.1093/bioinformatics/btw228
Manabe, T., Kambayashi, D., Akatsu, H., and Kudo, K. (2021). Favipiravir for the treatment of patients with COVID-19: A systematic review and meta-analysis. Bmc Infect. Dis. 21 (1), 489. doi:10.1186/s12879-021-06164-x
Martinez, V., Navarro, C., Cano, C., Fajardo, W., and Blanco, A. (2015). DrugNet: Network-based drug-disease prioritization by integrating heterogeneous data. Artif. Intell. Med. 63 (1), 41–49. doi:10.1016/j.artmed.2014.11.003
Mitchell, A., Chang, H. Y., Daugherty, L., Fraser, M., Hunter, S., Lopez, R., et al. (2015). The InterPro protein families database: The classification resource after 15 years. Nucleic Acids Res. 43 (D1), D213–D221. doi:10.1093/nar/gku1243
Moghadam, H., Rahgozar, M., and Gharaghani, S. (2016). Scoring multiple features to predict drug disease associations using information fusion and aggregation. Sar Qsar Environ. Res. 27 (8), 609–628. doi:10.1080/1062936X.2016.1209241
Napolitano, F., Zhao, Y., Moreira, V. M., Tagliaferri, R., Kere, J., D'Amato, M., et al. (2013). Drug repositioning: A machine-learning approach through data integration. J. Cheminformatics 5, 30. doi:10.1186/1758-2946-5-30
Nojomi, M., Yassin, Z., Keyvani, H., Makiani, M. J., Roham, M., Laali, A., et al. (2020). Effect of arbidol (umifenovir) on COVID-19: A randomized controlled trial. Bmc Infect. Dis. 20 (1), 954. doi:10.1186/s12879-020-05698-w
Ohgushi, M., Ogo, N., Yanagihara, T., Harada, Y., Sumida, K., Egashira, A., et al. (2022). Tacrolimus treatment for post-COVID-19 interstitial lung disease. Intern. Med. 61 (4), 585–589. doi:10.2169/internalmedicine.7971-21
Padhy, B. M., and Gupta, Y. K. (2011). Drug repositioning: Re-Investigating existing drugs for new therapeutic indications. J. Postgrad. Med. 57 (2), 153–160. doi:10.4103/0022-3859.81870
Perlman, L., Gottlieb, A., Atias, N., Ruppin, E., and Sharan, R. (2011). Combining drug and gene similarity measures for drug-target elucidation. J. Comput. Biol. 18 (2), 133–145. doi:10.1089/cmb.2010.0213
Pliakos, K., and Vens, C. (2020). Drug-target interaction prediction with tree-ensemble learning and output space reconstruction. Bmc Bioinforma. 21 (1), 49. doi:10.1186/s12859-020-3379-z
Pushpakom, S., Iorio, F., Eyers, P. A., Escott, K. J., Hopper, S., Wells, A., et al. (2019). Drug repurposing: Progress, challenges and recommendations. Nat. Rev. Drug Discov. 18 (1), 41–58. doi:10.1038/nrd.2018.168
Renaux, A., and UniProt, C. (2018). UniProt: The universal protein knowledgebase. Nucleic Acids Res. 46 (5), 2699. doi:10.1093/nar/gky092
Saito, T., and Rehmsmeier, M. (2015). The precision-recall plot is more informative than the ROC plot when evaluating binary classifiers on imbalanced datasets. Plos One 10 (3), e0118432. doi:10.1371/journal.pone.0118432
Sajadi, S. Z., Zare Chahooki, M. A., Gharaghani, S., and Abbasi, K. (2021). AutoDTI++: Deep unsupervised learning for DTI prediction by autoencoders. Bmc Bioinforma. 22 (1), 204. doi:10.1186/s12859-021-04127-2
Sajadi, S. Z., Zare Chahooki, M. A., Tavakol, M., and Gharaghani, S. (2022). Matrix factorization with denoising autoencoders for prediction of drug-target interactions. Mol. Divers. doi:10.1007/s11030-022-10492-8
Shim, J. S., and Liu, J. O. (2014). Recent advances in drug repositioning for the discovery of new anticancer drugs. Int. J. Biol. Sci. 10 (7), 654–663. doi:10.7150/ijbs.9224
Velikovi, P. (2018). Graph attention networks, International Conference on Learning Representations.
Wang, D., Wang, J., Lu, M., Song, F., and Cui, Q. (2010). Inferring the human microRNA functional similarity and functional network based on microRNA-associated diseases. Bioinformatics 26 (13), 1644–1650. doi:10.1093/bioinformatics/btq241
Wang, W., Dai, Q., Li, F., Xiong, Y., and Wei, D. Q. (2021). MLCDForest: Multi-label classification with deep forest in disease prediction for long non-coding RNAs. Briefings Bioinforma. 22 (3), bbaa104. doi:10.1093/bib/bbaa104
Wang, W. H., Yang, S., Zhang, X., and Li, J. (2014). Drug repositioning by integrating target information through a heterogeneous network model. Bioinformatics 30 (20), 2923–2930. doi:10.1093/bioinformatics/btu403
Xuan, P., Cao, Y., Zhang, T., Wang, X., Pan, S., and Shen, T. (2019). Drug repositioning through integration of prior knowledge and projections of drugs and diseases. Bioinformatics 35 (20), 4108–4119. doi:10.1093/bioinformatics/btz182
Xuan, P., Gao, L., Sheng, N., Zhang, T., and Nakaguchi, T. (2021). Graph convolutional autoencoder and fully-connected autoencoder with attention mechanism based method for predicting drug-disease associations. Ieee J. Biomed. Health Inf. 25 (5), 1793–1804. doi:10.1109/JBHI.2020.3039502
Xuan, P., Song, Y., Zhang, T., and Jia, L. (2019). Prediction of potential drug-disease associations through deep integration of diversity and projections of various drug features. Int. J. Mol. Sci. 20 (17), 4102. doi:10.3390/ijms20174102
Yang, M. Y., Luo, H., Li, Y., and Wang, J. (2019). Drug repositioning based on bounded nuclear norm regularization. Bioinformatics 35 (14), I455–I463. doi:10.1093/bioinformatics/btz331
Yu, Z. X., Huang, F., Zhao, X., Xiao, W., and Zhang, W. (2021). Predicting drug-disease associations through layer attention graph convolutional network. Briefings Bioinforma. 22 (4), bbaa243. doi:10.1093/bib/bbaa243
Zeng, X. X., Zhu, S., Hou, Y., Zhang, P., Li, L., Li, J., et al. (2020). Network-based prediction of drug-target interactions using an arbitrary-order proximity embedded deep forest. Bioinformatics 36 (9), 2805–2812. doi:10.1093/bioinformatics/btaa010
Zeng, X. X., Zhu, S., Liu, X., Zhou, Y., Nussinov, R., and Cheng, F. (2019). deepDR: a network-based deep learning approach to in silico drug repositioning. Bioinformatics 35 (24), 5191–5198. doi:10.1093/bioinformatics/btz418
Zhang, W., Yue, X., Lin, W., Wu, W., Liu, R., Huang, F., et al. (2018). Predicting drug-disease associations by using similarity constrained matrix factorization. Bmc Bioinforma. 19, 233. doi:10.1186/s12859-018-2220-4
Zhang, Y. C., Lei, X., Pan, Y., and Wu, F. X. (2022). Drug repositioning with GraphSAGE and clustering constraints based on drug and disease networks. Front. Pharmacol. 13, 872785. doi:10.3389/fphar.2022.872785
Zhang, Z. C., Zhang, X. F., Wu, M., Ou-Yang, L., Zhao, X. M., and Li, X. L. (2020). A graph regularized generalized matrix factorization model for predicting links in biomedical bipartite networks. Bioinformatics 36 (11), 3474–3481. doi:10.1093/bioinformatics/btaa157
Keywords: drug repositioning, heterogeneous network, variational graph autoencoders, graph representation learning, COVID-19
Citation: Lei S, Lei X and Liu L (2022) Drug repositioning based on heterogeneous networks and variational graph autoencoders. Front. Pharmacol. 13:1056605. doi: 10.3389/fphar.2022.1056605
Received: 29 September 2022; Accepted: 13 December 2022;
Published: 21 December 2022.
Edited by:
Sajjad Gharaghani, University of Tehran, IranReviewed by:
Luciana Scotti, Federal University of Paraíba, BrazilSeyedehzahra Sajadi, Yazd University, Iran
Copyright © 2022 Lei, Lei and Liu. This is an open-access article distributed under the terms of the Creative Commons Attribution License (CC BY). The use, distribution or reproduction in other forums is permitted, provided the original author(s) and the copyright owner(s) are credited and that the original publication in this journal is cited, in accordance with accepted academic practice. No use, distribution or reproduction is permitted which does not comply with these terms.
*Correspondence: Xiujuan Lei, eGpsZWlAc25udS5lZHUuY24=