 Mónica del Rey González1,2†Sohini Chakraborty2†Jesús María Hernández-Sánchez1María Diez Campelo3Christopher Y. Park2*†Jesús María Hernández Rivas1,3*†
- 1Institute for Biomedical Research of Salamanca (IBSAL), Institute of Cancer Molecular and Cellular Biology (IBMCC)-Centro de Investigación del Cáncer, Universidad de Salamanca, Salamanca, Spain
- 2Department of Pathology, New York University Grossman School of Medicine, New York, NY, United States
- 3Hematology Department, Hospital Universitario Salamanca, Salamanca, Spain
Treatment with the hypomethylating agent 5-azacytidine (AZA) increases survival in high-risk (HR) myelodysplastic syndrome (MDS) patients, but predicting patient response and overall survival remains challenging. To address these issues, we analyzed mutational and transcriptional profiles in CD34+ hematopoietic stem/progenitor cells (HSPCs) before and following AZA therapy in MDS patients. AZA treatment led to a greater reduction in the mutational burden in both blast and hematological responders than non-responders. Blast and hematological responders showed transcriptional evidence of pre-treatment enrichment for pathways such as oxidative phosphorylation, MYC targets, and mTORC1 signaling. While blast non-response was associated with TNFa signaling and leukemia stem cell signature, hematological non-response was associated with cell-cycle related pathways. AZA induced similar transcriptional responses in MDS patients regardless of response type. Comparison of blast responders and non-responders to normal controls, allowed us to generate a transcriptional classifier that could predict AZA response and survival. This classifier outperformed a previously developed gene signature in a second MDS patient cohort, but signatures of hematological responses were unable to predict survival. Overall, these studies characterize the molecular consequences of AZA treatment in MDS HSPCs and identify a potential tool for predicting AZA therapy responses and overall survival prior to initiation of therapy.
1 Background
Myelodysplastic syndromes (MDS) are clonal diseases arising in hematopoietic stem cells (HSCs) characterized by altered myeloid differentiation, peripheral blood cytopenia, and frequent accumulation of blasts (1, 2). While most patients experience progressive cytopenia, approximately 30% progress to acute myeloid leukemia (AML) (3). Hypomethylating agent (HMA) therapies including 5’-azacytidine (AZA) and decitabine (DAC) are among the few therapies available for patients ineligible for allogeneic stem cell transplantation, especially patients with high-risk myeloid neoplasms (4, 5).
AZA is an azanucleoside analog of cytidine approved for use in MDS patients in 2004 based on two randomized clinical trials (AZA-001, and CALGB 9221) conducted in HR-MDS patients (6). AZA-001 improved survival in HR-MDS patients compared to standard care irrespective of age, karyotype, or bone marrow (BM) blast percentage, and was associated with increased time to AML progression and reduced requirement for red blood cell transfusion (7). In the CALGB 9221 study, AZA treated patients exhibited slower rates of leukemic transformation, with no differences in survival (8). In addition, the Spanish Group of Myelodysplastic Syndromes showed a lack of improvement in survival in unselected HR patients (9). AZA treatment induces hematological improvement in only 30-40% of treated patients, with most experiencing disease progression on therapy (10). These clinical experiences highlight the need to better understand the mechanisms mediating patient responses to AZA and to identify predictors of response.
The objective of our study was to investigate whether mutational or transcriptional profiles from MDS HPSCs can predict treatment responses. We hypothesized that mutational or transcriptional profiles predictive of treatment response to AZA would be revealed by comparing paired pre-/post AZA MDS samples. We found that somatic mutational burden was reduced following therapy in patients who responded to therapy. In pre-treatment samples, patients who showed reduced blast count were enriched in genes related to cell cycle, while blasts non-responders were enriched for pathways related to stemness. Interestingly, these same pathways did not predict response based on transcriptional profiles generated from post-AZA samples. A transcriptional classifier developed based on comparing gene expression between blast responders and non-responders to age-matched controls could predict patient response to therapy and overall survival in two independent MDS patient cohorts. Overall, these studies provide insights into the molecular mechanisms mediating AZA response and describe a novel transcriptional classifier that can predict survival of MDS patients at diagnosis.
2 Methods
2.1 Patient and control samples
Bone marrow (BM) samples from fourteen patients with MDS (n=11), and MDS transformed to AML (n=3) were collected before and during their treatment with AZA. Patients were diagnosed following the WHO 2017 criteria. Patient median age was 70 years (range: 49-85 years). MDS/AML patient samples were grouped into responder (R) and non-responder (NR) groups based on: i) reduction in the percentage of blasts (Blast Response), or ii) improvement of cytopenias (Hematological Response). Hematological evaluation of AZA response was performed according to the International Working Group (IWG) criteria for MDS and AML (11). Five out of fourteen patients were blast responders (BL-R), seven were blast non-responders (BL-NR), and for the remaining two patients, blast response could not be determined. When classifying patients by hematological response, eight of the fourteen patients were responders (HEM-R), four patients were non-responders (HEM-NR), and for two patients, hematological response could not be determined (different patients than the ones with undetermined blast response). Among the fourteen patients, three patients showed both BL-R and HEM-R, while three other patients were both BL-NR and HEM-NR. Baseline patient characteristics are shown in Table 1, and further detailed in Supplementary Table 1.
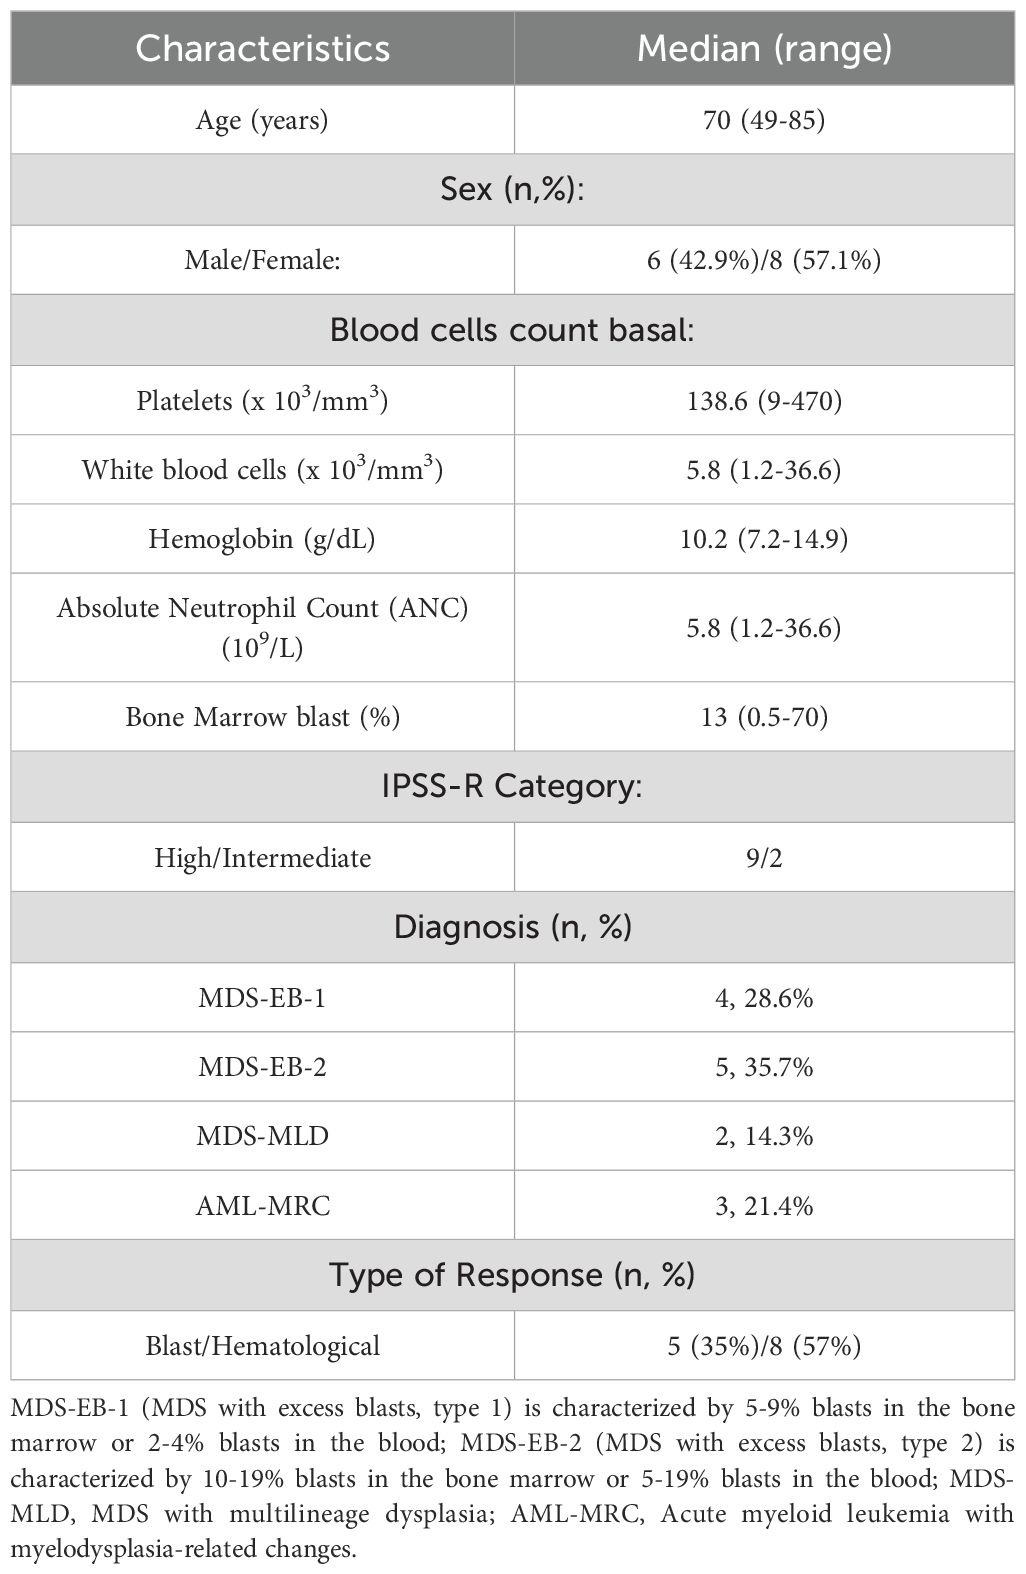
Table 1. Clinical characteristics of MDS patients included in the study.
2.2 Cell separation
Bone marrow mononuclear cells (BMMCs) were isolated from BM samples using Ficoll-Paque Plus (GE Healthcare, Massachusetts, US) density gradients per manufacturer’s instructions. CD34+ cells were isolated by immunomagnetic separation using an autoMACs Pro Separator (Miltenyi Biotec GmbH, Bergisch Gladbach, Germany) following the manufacturer´s instructions.
2.3 Nucleic acid extraction
Sorted cells were snap-frozen and stored at -80°C. Total DNA and RNA were extracted using the RNeasy Micro Kit (Qiagen, Valencia, CA, USA) following the manufacturer’s protocol. RNA integrity was assessed on an Agilent 2100 Bioanalyzer (Agilent Technologies, Santa Clara, CA, USA) using the RNA 6000 Nano Assay kit. DNA and RNA quantity were assessed by qubit 2.0 (ThermoFisher Scientific, Massachusetts, U.S.A.) using a DNA double-strand kit or an RNA kit (high/broad sensitivity).
2.4 Next generation sequencing
2.4.1 DNA-seq
A custom high throughput sequencing (HTS) panel was made using Design Studio (Illumina, California, U.S.) that included 3,259 probes targeting 1,740 regions including exons, splicing regions and untranslated regions for 117 genes associated with myeloid neoplasms (Supplementary Table 2); the final design covered ~500kb. Libraries were made following Nextera Rapid Capture Custom Enrichment (Illumina, San Diego, CA, USA) protocol. Sequencing was performed on a NextSeq 550 sequencer with a read length of 2 × 150 nucleotides. Variant allele frequency (VAF) cut-off was set at 5% except for 2 specific variants in NRAS and KRAS genes in pre-treatment samples (VAFs 1.27 and 1.83, respectively), for which we detected significantly higher VAFs in post-treatment samples (15.29 and7.19,repectively), suggesting possible clonal expansion, and one variant in TP53 detected with a VAF of 87.48 before treatment and 3.98 after treatment.
2.4.2 RNA-seq
Libraries were prepared using the SMART-Seq v4 Ultra Low Input RNA kit (Clontech, California, U.S.), and sequenced on a HiSeq400 sequencer (Illumina) according to manufacturer´s protocol with a read length of 2 × 150 nucleotides. Following demultiplexing, data quality control, alignment, and generation of a read count matrix, DESeq2 was used for differential gene expression analysis.
2.5 Patient sample scoring in independent data cohorts
We assigned a score to each patient sample in the Pellagatti et al. cohort (12), based on the expression of the responder (R) and non-responder (NR) specific genes (compared to healthy controls), and further ranked the patients based on the Δ(NR-R) score. Patient samples with Δ(NR-R) ≥ median(Δ(NR-R)) were classified as NR-like, and samples with Δ(NR-R) <median(Δ(NR-R)) were classified as R-like. We used similar scoring strategy to re-classify MDS samples in a 2nd MDS cohort, GSE77750 (13).
2.6 Pathway analysis and data visualization
GSEA software package from the Broad Institute (http://www.broad.mit.edu/gsea/) was utilized to analyze enriched biological pathways in patient samples compared to control. R package ggplot2 (https://ggplot2.tidyverse.org.) was utilized to visualize the data.
2.7 Statistical analysis
To analyze the correlation between VAF from BMMC and CD34+ cells, a Pearson correlation coefficient was calculated to determine the strength and direction of their relationship. For investigating the association of different clinical parameters (e.g.MDS morphologic subtype, IPSS-R score) with transcriptional response signatures from publicly available MDS datasets, Pearson’s Chi-squared test with Yates’ continuity correction was implemented in R. For statistical analyses, P values were determined by applying the two-tailed t test for independent samples. All values were expressed as means ± SEM, with significance levels indicated as follows: *, P < 0.05; **, P < 0.005; and ***, P < 0.001. Analyses were performed using GraphPad Prism software.
3 Results
3.1 AZA alters mutational profiles in MDS
Mutations were identified in eleven out of twelve patients (91.6%). A total of 48 mutations and a median of 4 mutations [range 0-9] per patient were observed. A detailed description of all the mutations is provided in Supplementary Table 3. AZA treatment reduced the mutational allele burden in at least one gene, in eight out of eleven (72.7%) patients. This decrease was more prominent in R than in NR patients (Figure 1A). All patients with TP53 mutations exhibited blast or hematological response (BL-R, HEM-R) and showed reductions in TP53 VAF post-AZA. In contrast, patients with BCOR mutations did not exhibit either type of response, and 3 out of 4 BCOR mutations identified in three patients showed no change in VAFs. Two patients with DNMT3A p.R693H mutations showed VAF reduction and BL-R or HEM-R, while two patients with mutations in other regions of DNMT3A neither showed changes in VAF nor achieved either type of response. Patients with KRAS and NRAS mutations pre-AZA displayed variable responses. For example, patient 2 with mutations in MTOR, RUNX1, KRAS, and NRAS pre-AZA, showed increased KRAS and NRAS VAFs post-AZA, and did not achieve blast or hematological response. Patient 9 acquired an additional mutation in KRAS while the NRAS burden decreased post-AZA. This patient did not experience a reduction in blast count and remained stable. In contrast, patient 5 harbored mutations in TP53, KRAS and NRAS at diagnosis, and VAFs for all 3 mutations decreased or became undetectable following AZA, despite the fact that the patient did not show BL-R or HEM-R.
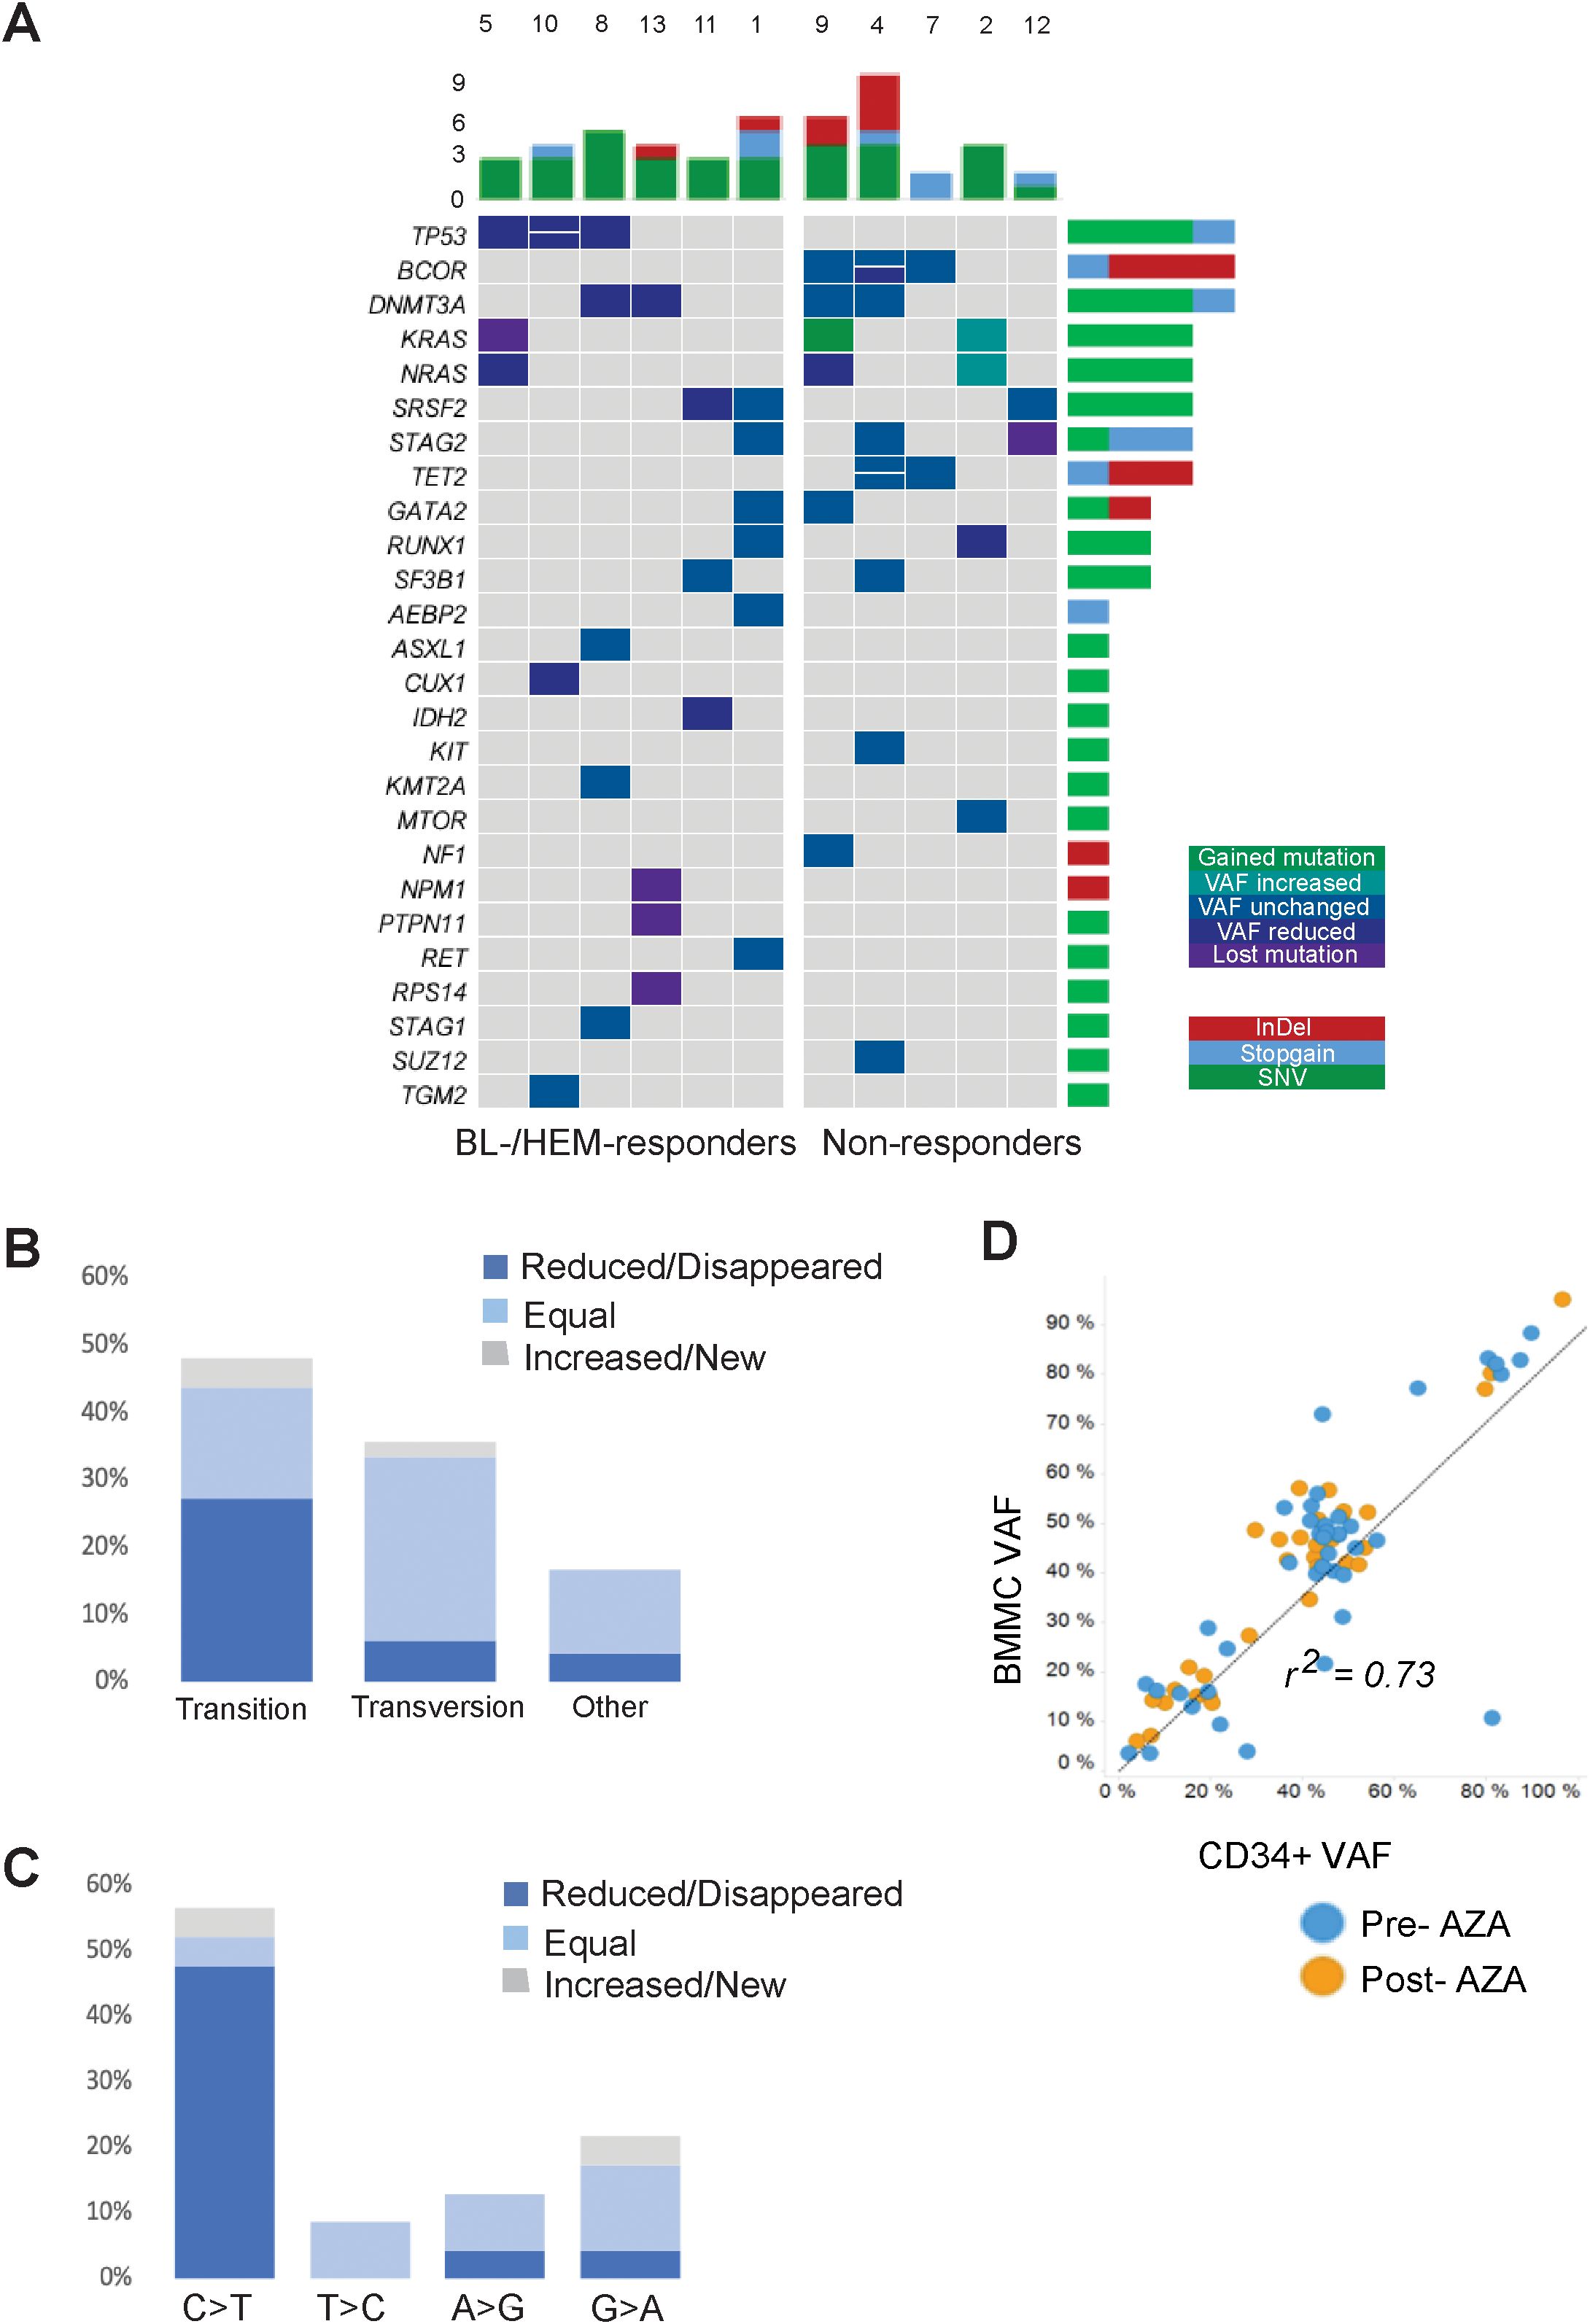
Figure 1. Comprehensive landscape of mutations in the MDS cohort. (A) Dynamics of gene mutations in CD34+ cells during AZA treatment. Genes are represented in rows; each column represents a patient. Dynamics are represented by a color gradient: green/cyan for newly acquire/increasing mutations, cobalt blue for stable mutations, and navy/violent colors for decreasing/disappearing mutations. (B) Proportion of transitions and transversions and how they change after AZA treatment. (C) Graphical representation of transition mutations and how they change after AZA treatment. (D) Ratio between VAF from BMMCs and CD34+ population. Blue plots represent mutations before AZA treatment and orange plots represent mutations after therapy.
Nucleoside inhibitors such as AZA can alter the composition of the dNTP pool, thereby inducing DNA damage responses and cell death (14). To assess if AZA alters nucleotide substitutions due to an imbalanced dNTP pool, we measured the frequencies of transitions and transversions. Pre-AZA samples showed transition and transversion proportions of 47.9% and 35.4%, respectively (Figure 1B). Notably, AZA treatment led to a significantly greater VAF reduction in transitions than transversions. In contrast, 76.5% of transversions exhibited no change in VAF versus 34.8% of transitions (Figure 1B). Among transition mutations, C>T was the most frequent, with eight cases exhibiting decreased, three cases exhibiting loss, and two cases exhibiting gain or stable VAF (Figure 1C). To determine the contribution of malignant clones to mature hematopoietic cells, we compared VAFs of CD34+ cells and matched BMMCs. While there was a high VAF correlation between pre-/post- AZA samples for both cell types (r=0.73), BMMCs consistently showed slightly higher VAFs (Figure 1D).
3.2 AZA treatment induces widespread gene expression changes in MDS HSPCs
We compared the transcriptional profiles of pre- and post-AZA MDS HSPCs with age-matched, healthy controls. Pre-treatment HSPCs exhibited 584 up-regulated genes and 1,040 down-regulated genes compared to controls (abs log2fold change (FC)≥1, p-value<0.01) (complete list in Supplementary Table 4). Post-AZA treatment samples showed 270 up-regulated and 1,230 down-regulated genes (abs log2fold change (FC)≥1, p-value<0.01) compared to controls (complete list in Supplementary Table 5). Pathways significantly enriched in pre-AZA patient HSPCs included oxidative phosphorylation and MYC targets. Post AZA treatment, all of these pathways lost enrichment, while pathways associated with unfolded protein response, secretion, reactive oxygen, interferon alpha, cell cycle, and DNA repair were enriched (Figure 2).
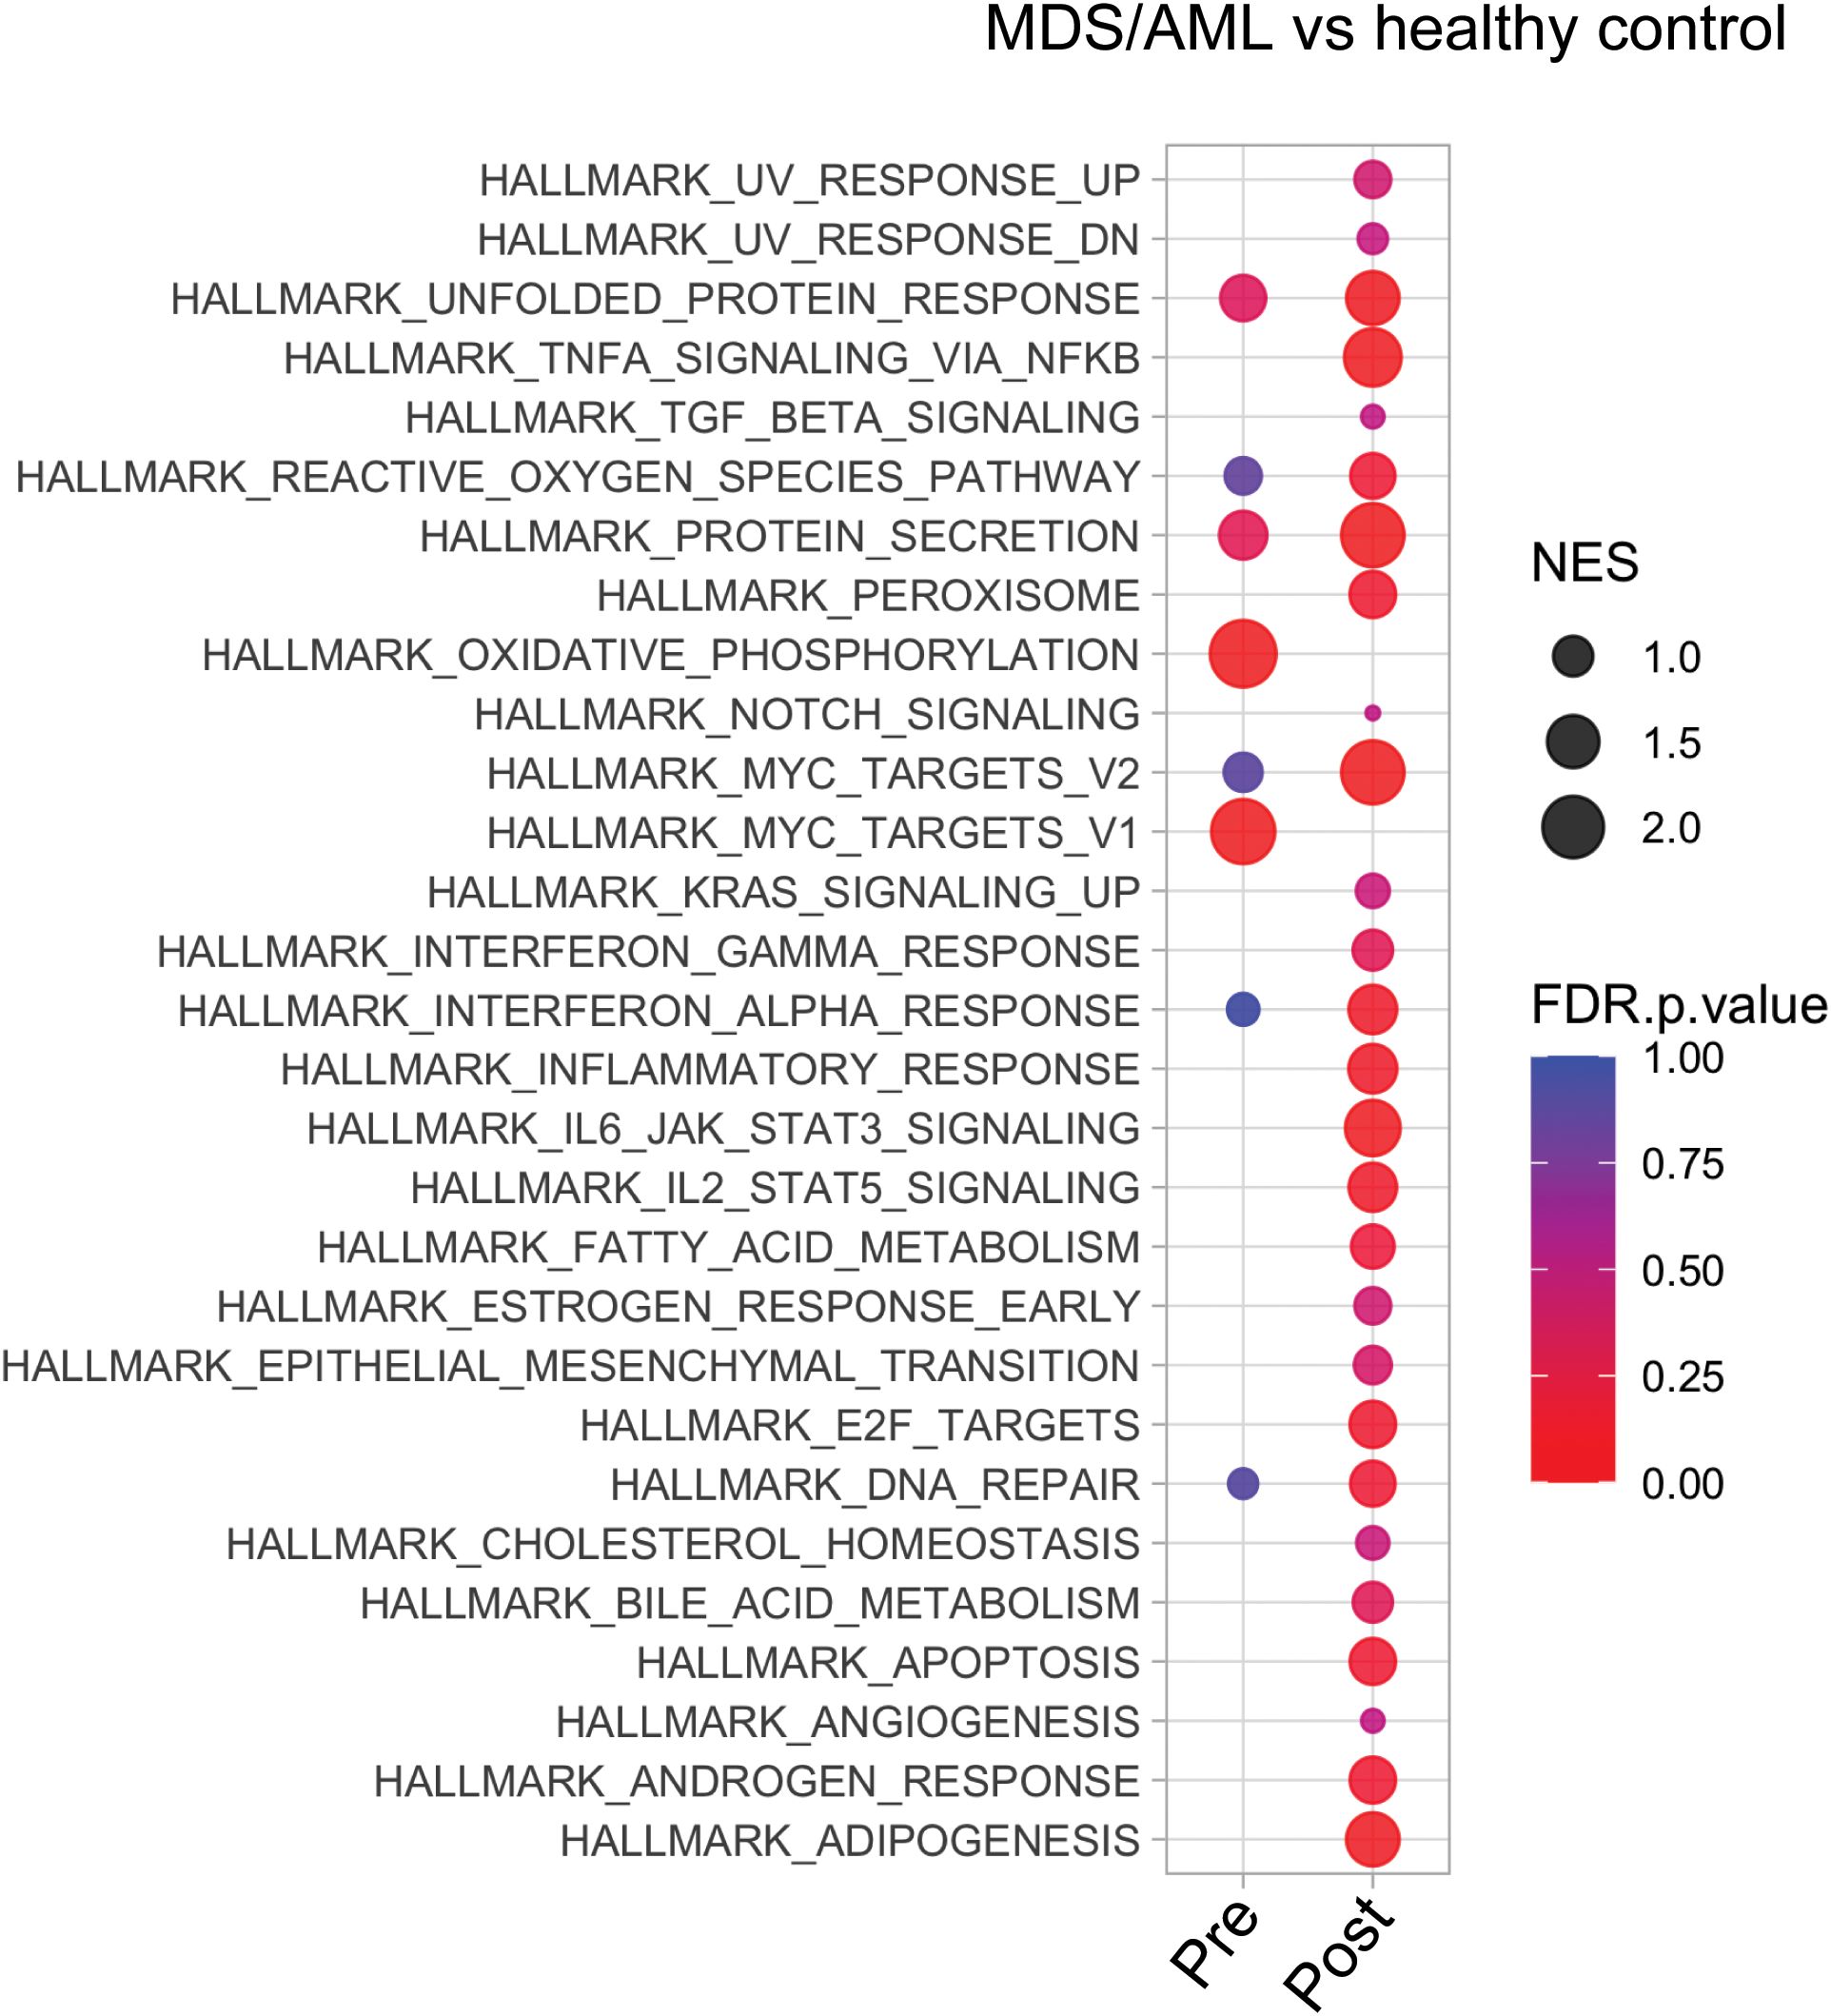
Figure 2. Transcriptional analysis of MDS HSPCs in comparison to healthy control CD34+ cells. Pathway analysis of pre- and post-treatment MDS HSPCs in comparison to healthy, age-matched controls.
3.3 Gene signatures at diagnosis differ based on AZA response type
3.3.1 Blast response
To identify pathways that might determine blast response, we identified the differentially expressed genes (DEGs) in pre-treatment samples of blast responder (BL-R) and blast non-responder (BL-NR) patients compared to age-matched controls. Genes up-regulated in BL-R patients were enriched in pathways such as protein secretion, MTOR signaling, E2F targets, DNA repair, and apoptosis, consistent with an enrichment of cycling cells. In contrast, genes up-regulated in BL-NR patients were enriched for pathways such as TNFa signaling via NFkB and MYC target genes (Figure 3A). TNFa signaling has been shown to promote HSC renewal and myeloid-biased regeneration (15) as well as leukemia-initiating cell capacity in AML (16). MYC is a well-known driver of AML pathogenesis and promotes leukemia stem cell (LSC) self-renewal and chemotherapy resistance (17–19). Since these data suggest that AZA resistance is due to enrichment for LSC transcriptional programs, we assessed the expression of LSC genes (20). BL-NR patients showed increased expression of these genes compared to BL-R patients and controls (Figure 3B).
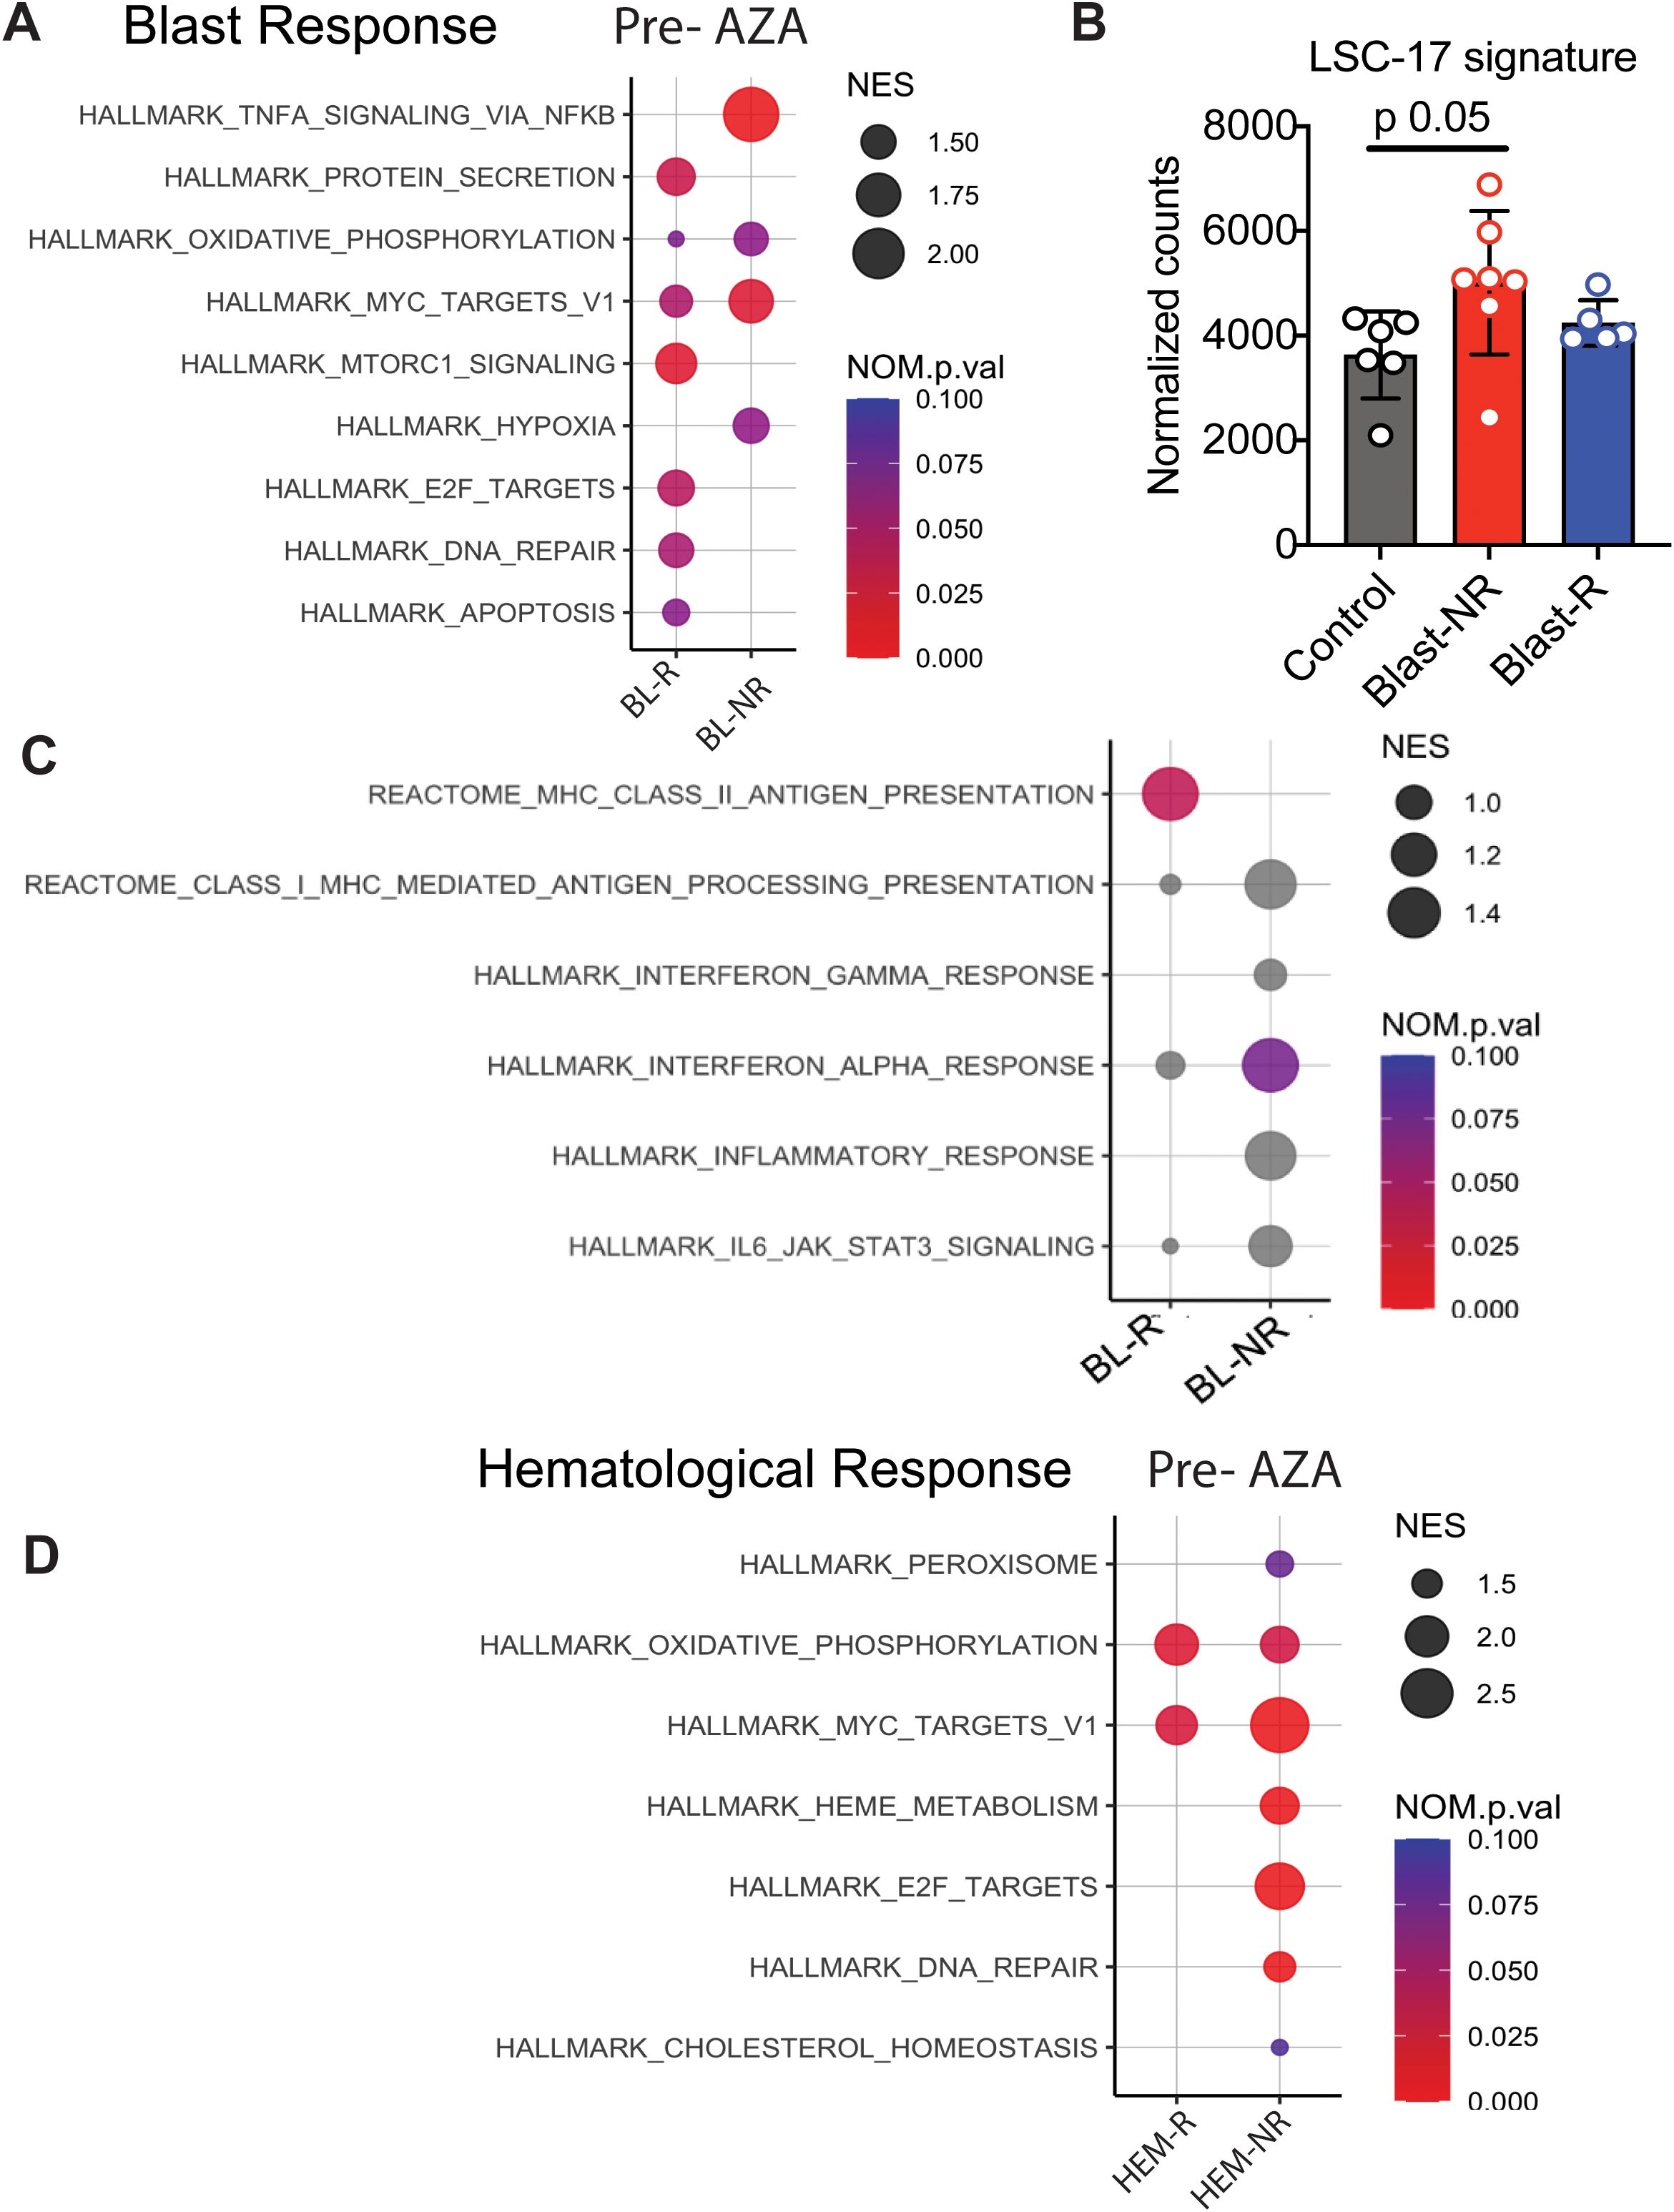
Figure 3. Transcriptional profiles of MDS patients associated with blast response before AZA treatment. (A) Pathway analysis of blast responders (BL-R) and non-responders (BL-NRs) before treatment with AZA. (B) Expression of LSC-17 genes in MDS HSPCs, based on BL-R and BL-NR gene signature. (C) Immunological pathway analysis of BL-R and BL-NRs before treatment with AZA. (D). Pathway analysis of hematological responders (HEM-R) and non-responders (HEM-NRs) before treatment with AZA.
Since the immune system surveils neoplastic HSPCs in MDS/AML (21), we next investigated whether HSPCs in MDS exhibit evidence of cell-intrinsic differences in immune recognition. Notably, BL-R samples were enriched for genes associated with major histocompatibility class II (MHC class II) presentation, while BL-NR samples did not exhibit enrichment of Hallmark immunological pathways, including inflammation-associated and interferon-associated genes (Figure 3C).
3.3.2 Hematological response
Given that hematological and blast responses may depend on distinct molecular mechanisms, we separately investigated samples based on hematological response. Prior to therapy, hematological responder (HEM-R) and hematological non-responder (HEM-NR) patient samples were enriched in pathways such as oxidative phosphorylation and MYC target genes compared to controls, but HEM-NR samples were uniquely enriched for genes present in the E2F target, DNA repair, and heme metabolism signatures (Figure 3D).
3.4 AZA induces similar transcriptional signatures regardless of treatment response
In order to evaluate MDS HSPC responses to AZA treatment, we compared the transcriptional profiles of paired pre-/post-AZA samples.
3.4.1 Blast response
Fewer DEGs were identified in post- vs pre-AZA specimens in BL-R than in BL-NR patients (1,810 vs 2,300, respectively; complete lists in Supplementary Tables 6, 7). Despite these differences, AZA induced enrichment of almost all Hallmark pathways including cell cycle changes in both BL-R and BL-NR groups, similar to prior studies (22). A notable exception was the TNFa pathway, which was significantly enriched in pre-AZA BL-NR samples. Compared to pre-treatment samples, post-AZA BL-R patients showed enrichment of MYC targets, E2F targets, and DNA repair pathways (Figure 4A), and post-AZA BL-NR samples showed significant expression of cell cycle genes (Figure 4B).
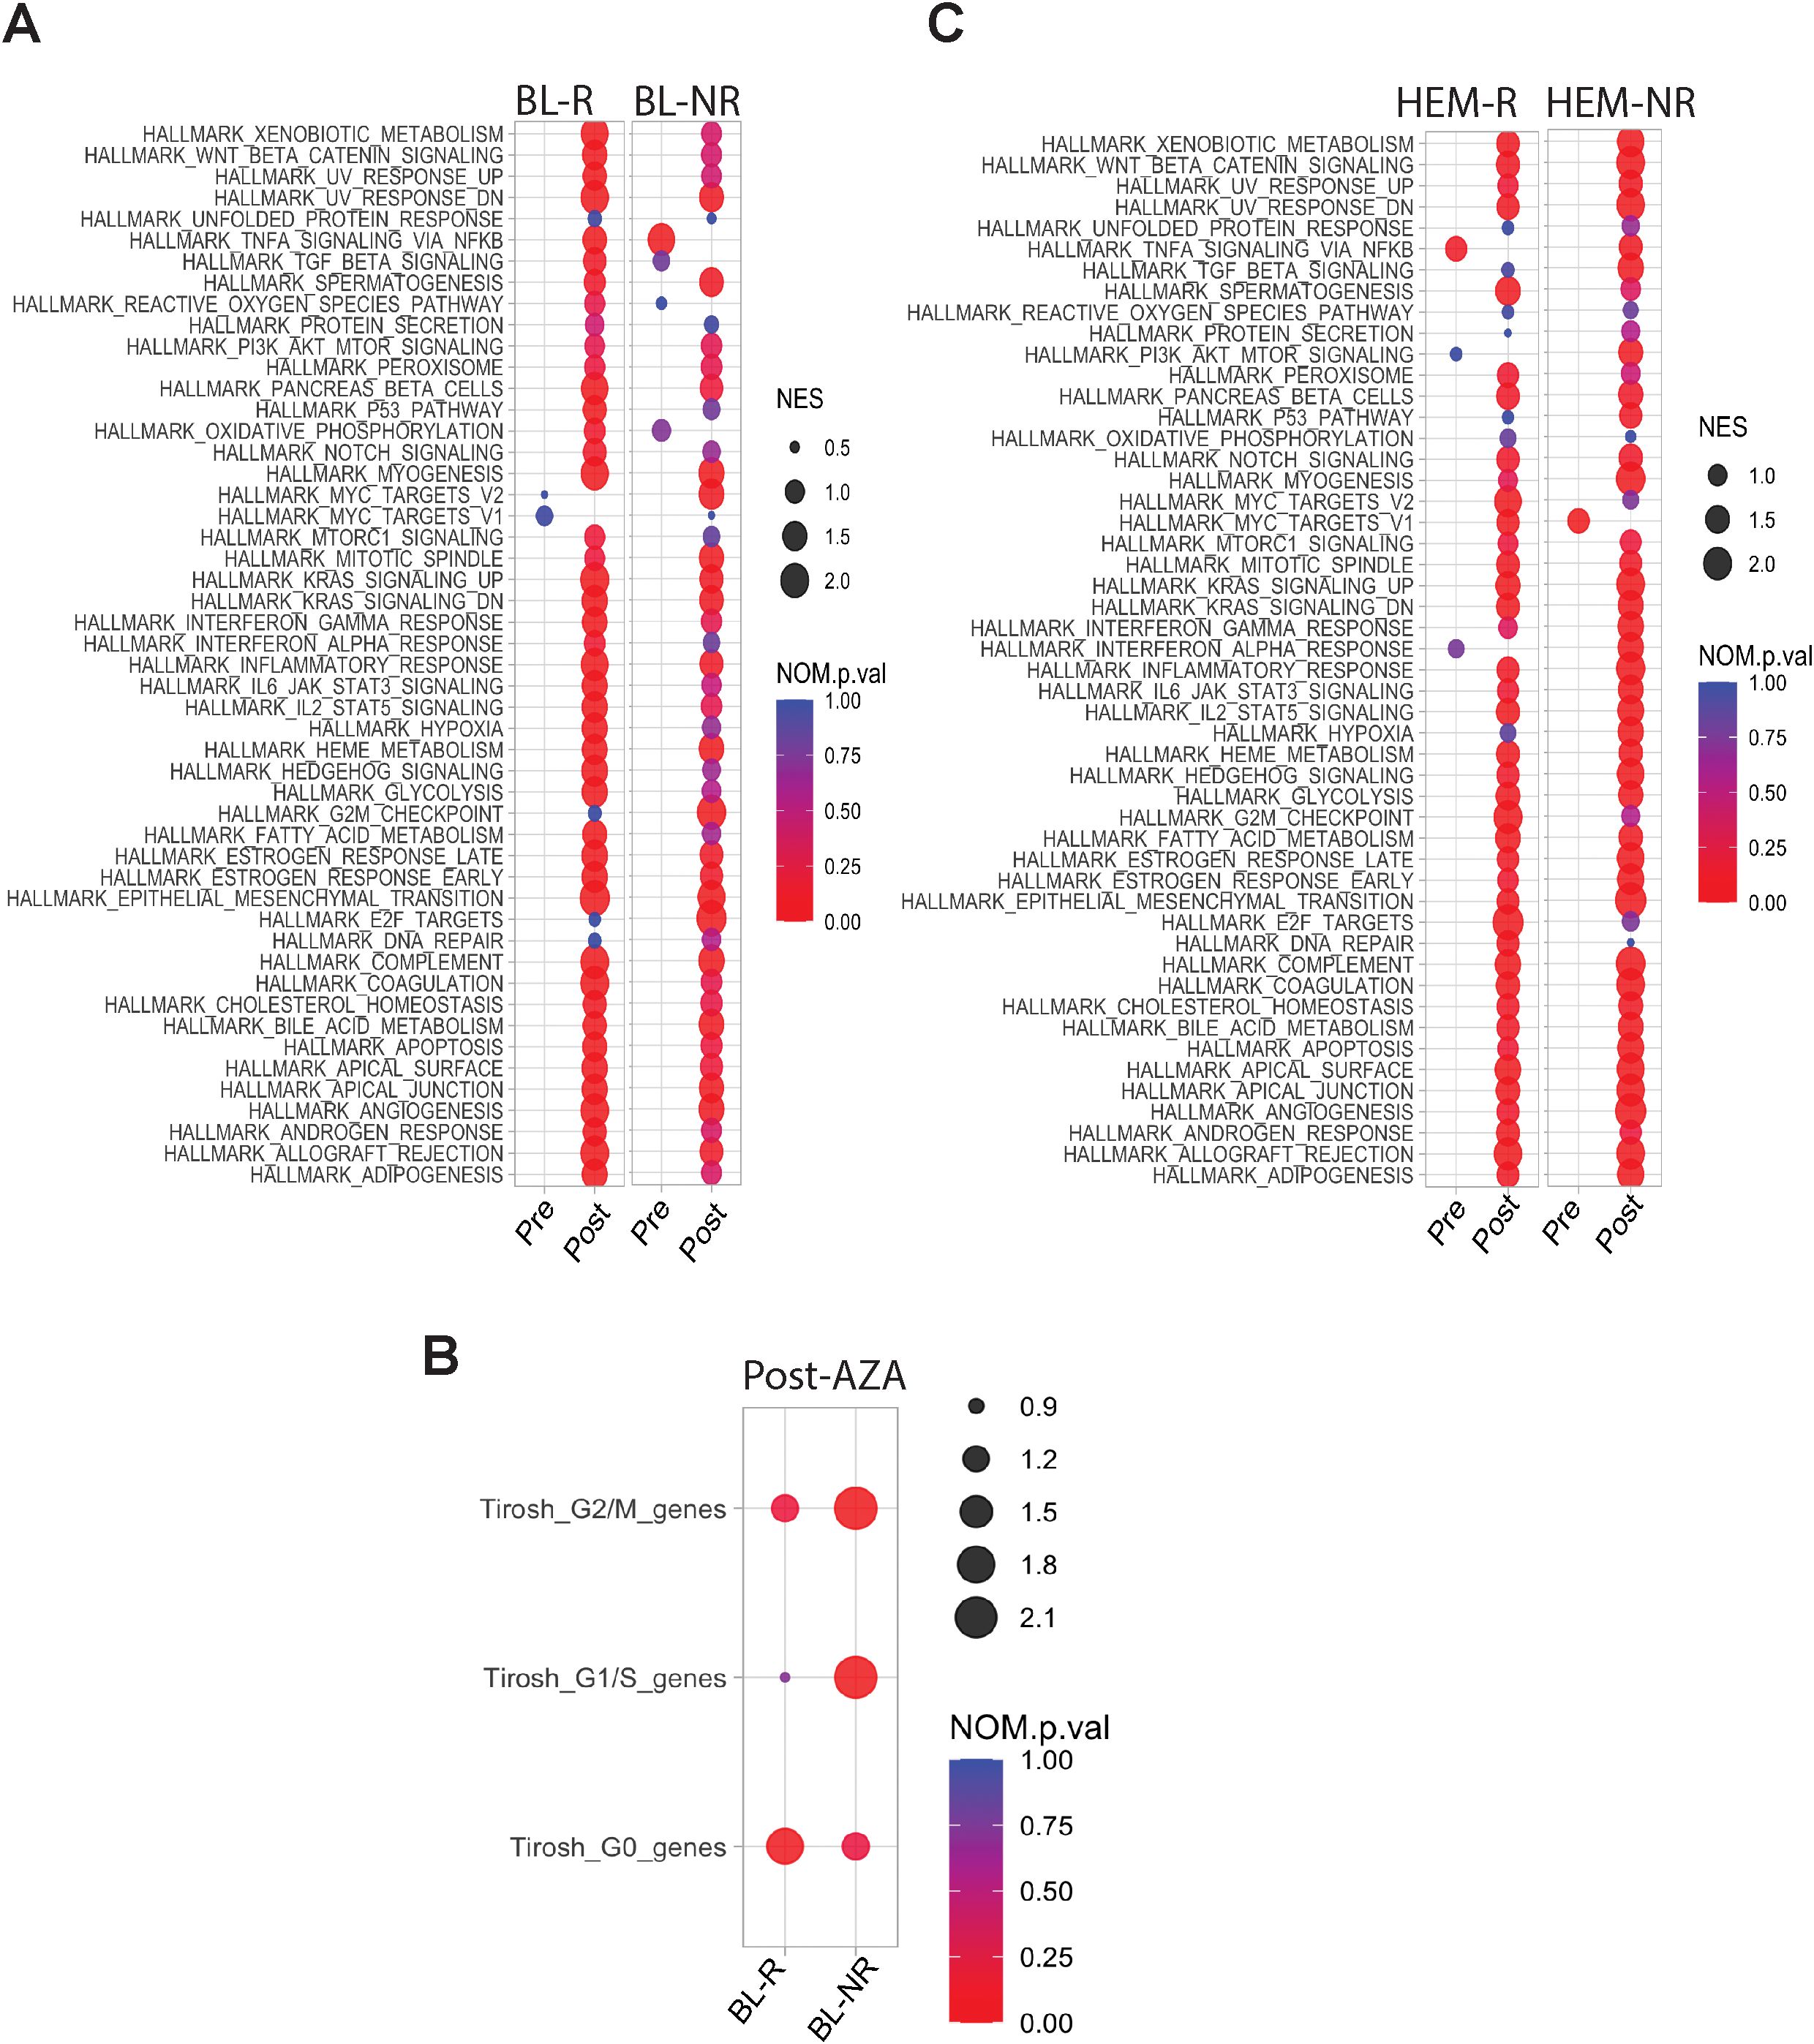
Figure 4. Transcriptional profiles of pre-/post-AZA treatment MDS HSPCs. (A) Pathways enriched in BL-R and BL-NR samples pre-/post-AZA (B) Cell cycle associated pathways in BL-R and BL-NR samples pre-/post-AZA (C) Pathways enriched in HEM-R and HEM-NR samples pre-/post-AZA.
3.4.2 Hematological response
Post-AZA, more DEGs were identified in HEM-NR than in HEM-R patients (3,202 genes vs 1,570 genes, respectively) (complete lists in Supplementary Tables 8, 9). Pathway analysis showed significant enrichment of the TNFa signaling via NFkB pathway in pre-AZA HEM-R patients, which was lost upon AZA treatment (Figure 4C). Pre-AZA HEM-NR samples showed enrichment of MYC target genes (Figure 4C). Analysis of cell cycle gene expression changes showed that AZA induces cell cycle genes irrespective of hematological response type (Supplementary Figure 1A).
3.5 Blast response to AZA is associated with specific transcriptional programs
To evaluate potential AZA induced changes in differentiation, we performed a CIBERSORTx analysis using established gene expression profiles from healthy HSPC populations (23). Comparisons of pre- and post-AZA samples revealed no significant changes among the HSPC populations assessed (Supplementary Figure 1B). Early (low-risk) MDS shows reduced frequencies of immunophenotypically defined B-cell progenitors (24). While pre-AZA HSPCs showed down-regulation of B-lymphocyte genes (43 out of 56 genes) compared to healthy controls (Table 2; Supplementary Table 10), CIBERSORTx analysis predicted negligible numbers of common lymphoid progenitors (CLP) in patient samples. After AZA treatment, specific B-cell development genes were induced, with 30 genes up-regulated in post-AZA vs pre-AZA, but CIBERSORTx did not predict a restoration of CLP numbers. While BL-R samples showed a trend toward up-regulation of B-cell development genes compared to BL-NR samples, no correlation was found between hematological response and induction of B-cell genes.
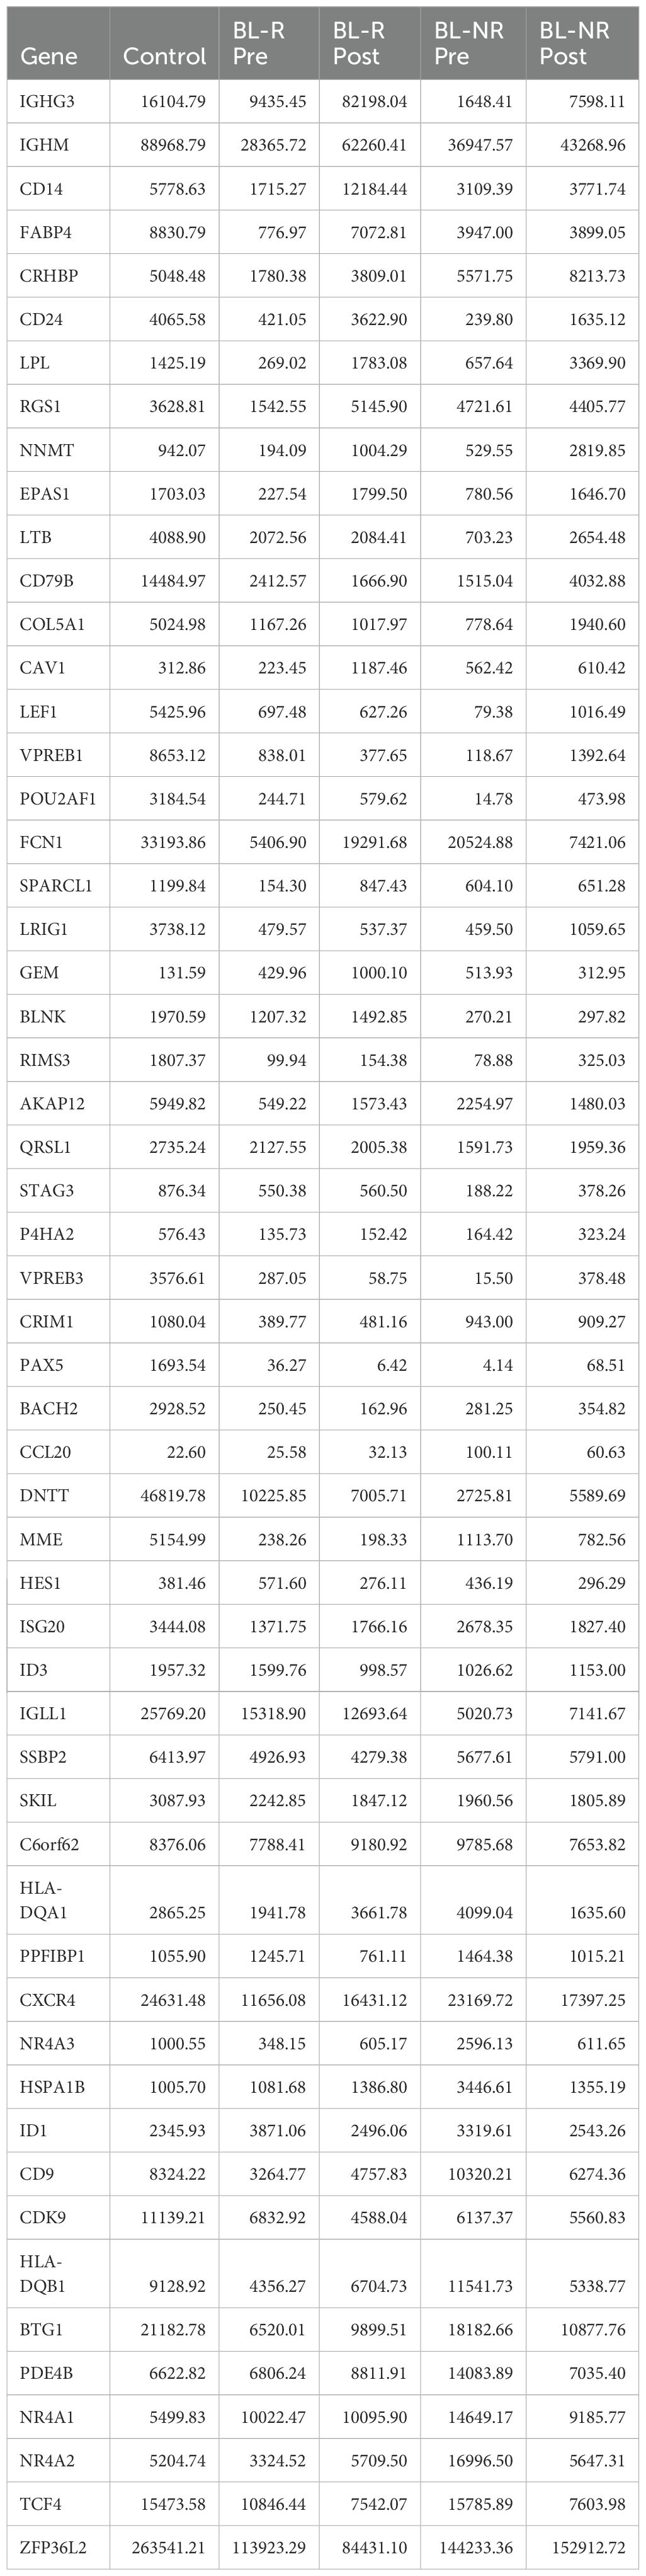
Table 2. Average expression of B-cell development genes in healthy controls, pre- and post-AZA treatment in blast responder (BL-R) and non-responder (BL-NR) patients.
3.6 Blast response gene signature can predict AZA response and overall survival
To determine whether gene signatures associated with blast response may predict MDS/AML patient outcomes, we first generated gene expression profiles for the pre-AZA BL-R and BL-NR groups by identifying genes significantly and uniquely expressed in each group compared to healthy, age-matched controls. BL-R and BL-NR groups comprised 1,292 and 1,748 genes respectively. We then generated a score that would allow measurement of the similarity of any diagnostic MDS sample to the BL-R or BL-NR patients in our cohort, and enable assignment of each new patient sample to BL-R-like or BL-NR-like groups based on their transcriptional score. Utilizing this strategy to classify 183 MDS patients [GSE19429 (12)], we found that BL-NR-like patients showed significantly poorer survival than BL-R-like patients (Figure 5A). We further stratified the BL-NR-like patients into BL-NR-like ‘high’ and BL-NR-like ‘low’ groups. BL-NR-like ‘high’ patients showed significantly shorter survival compared to NR-like ‘low’ patients (Figure 5B). No significant differences in survival were observed between BL-R-like ‘high’ and BL-R-like ‘low’ groups, although BL-R-like ‘high’ patients showed a trend towards longer survival (Figure 5C). We evaluated the available clinical parameters for these two groups of patients, and found that compared to the BL-NR-like patients, BL-R-like patients were significantly enriched for patients in the very low IPSS score group (Pearson’s Chi-squared test with Yates’ continuity correction p-value =0.05) as well as in the refractory anemia with ring sideroblasts (RARS) morphologic subtype of MDS (Pearson’s Chi-squared test with Yates’ continuity correction p-value =0.04) (Supplementary Figure 2). We also investigated the clinical parameters associated with 37 MDS patients re-classified as putative BL-NR-like and BL-R-like in a second data cohort [GSE111085 (25)], but did not find any significant association with any IPSS category or disease subtype (Supplementary Figure 2).
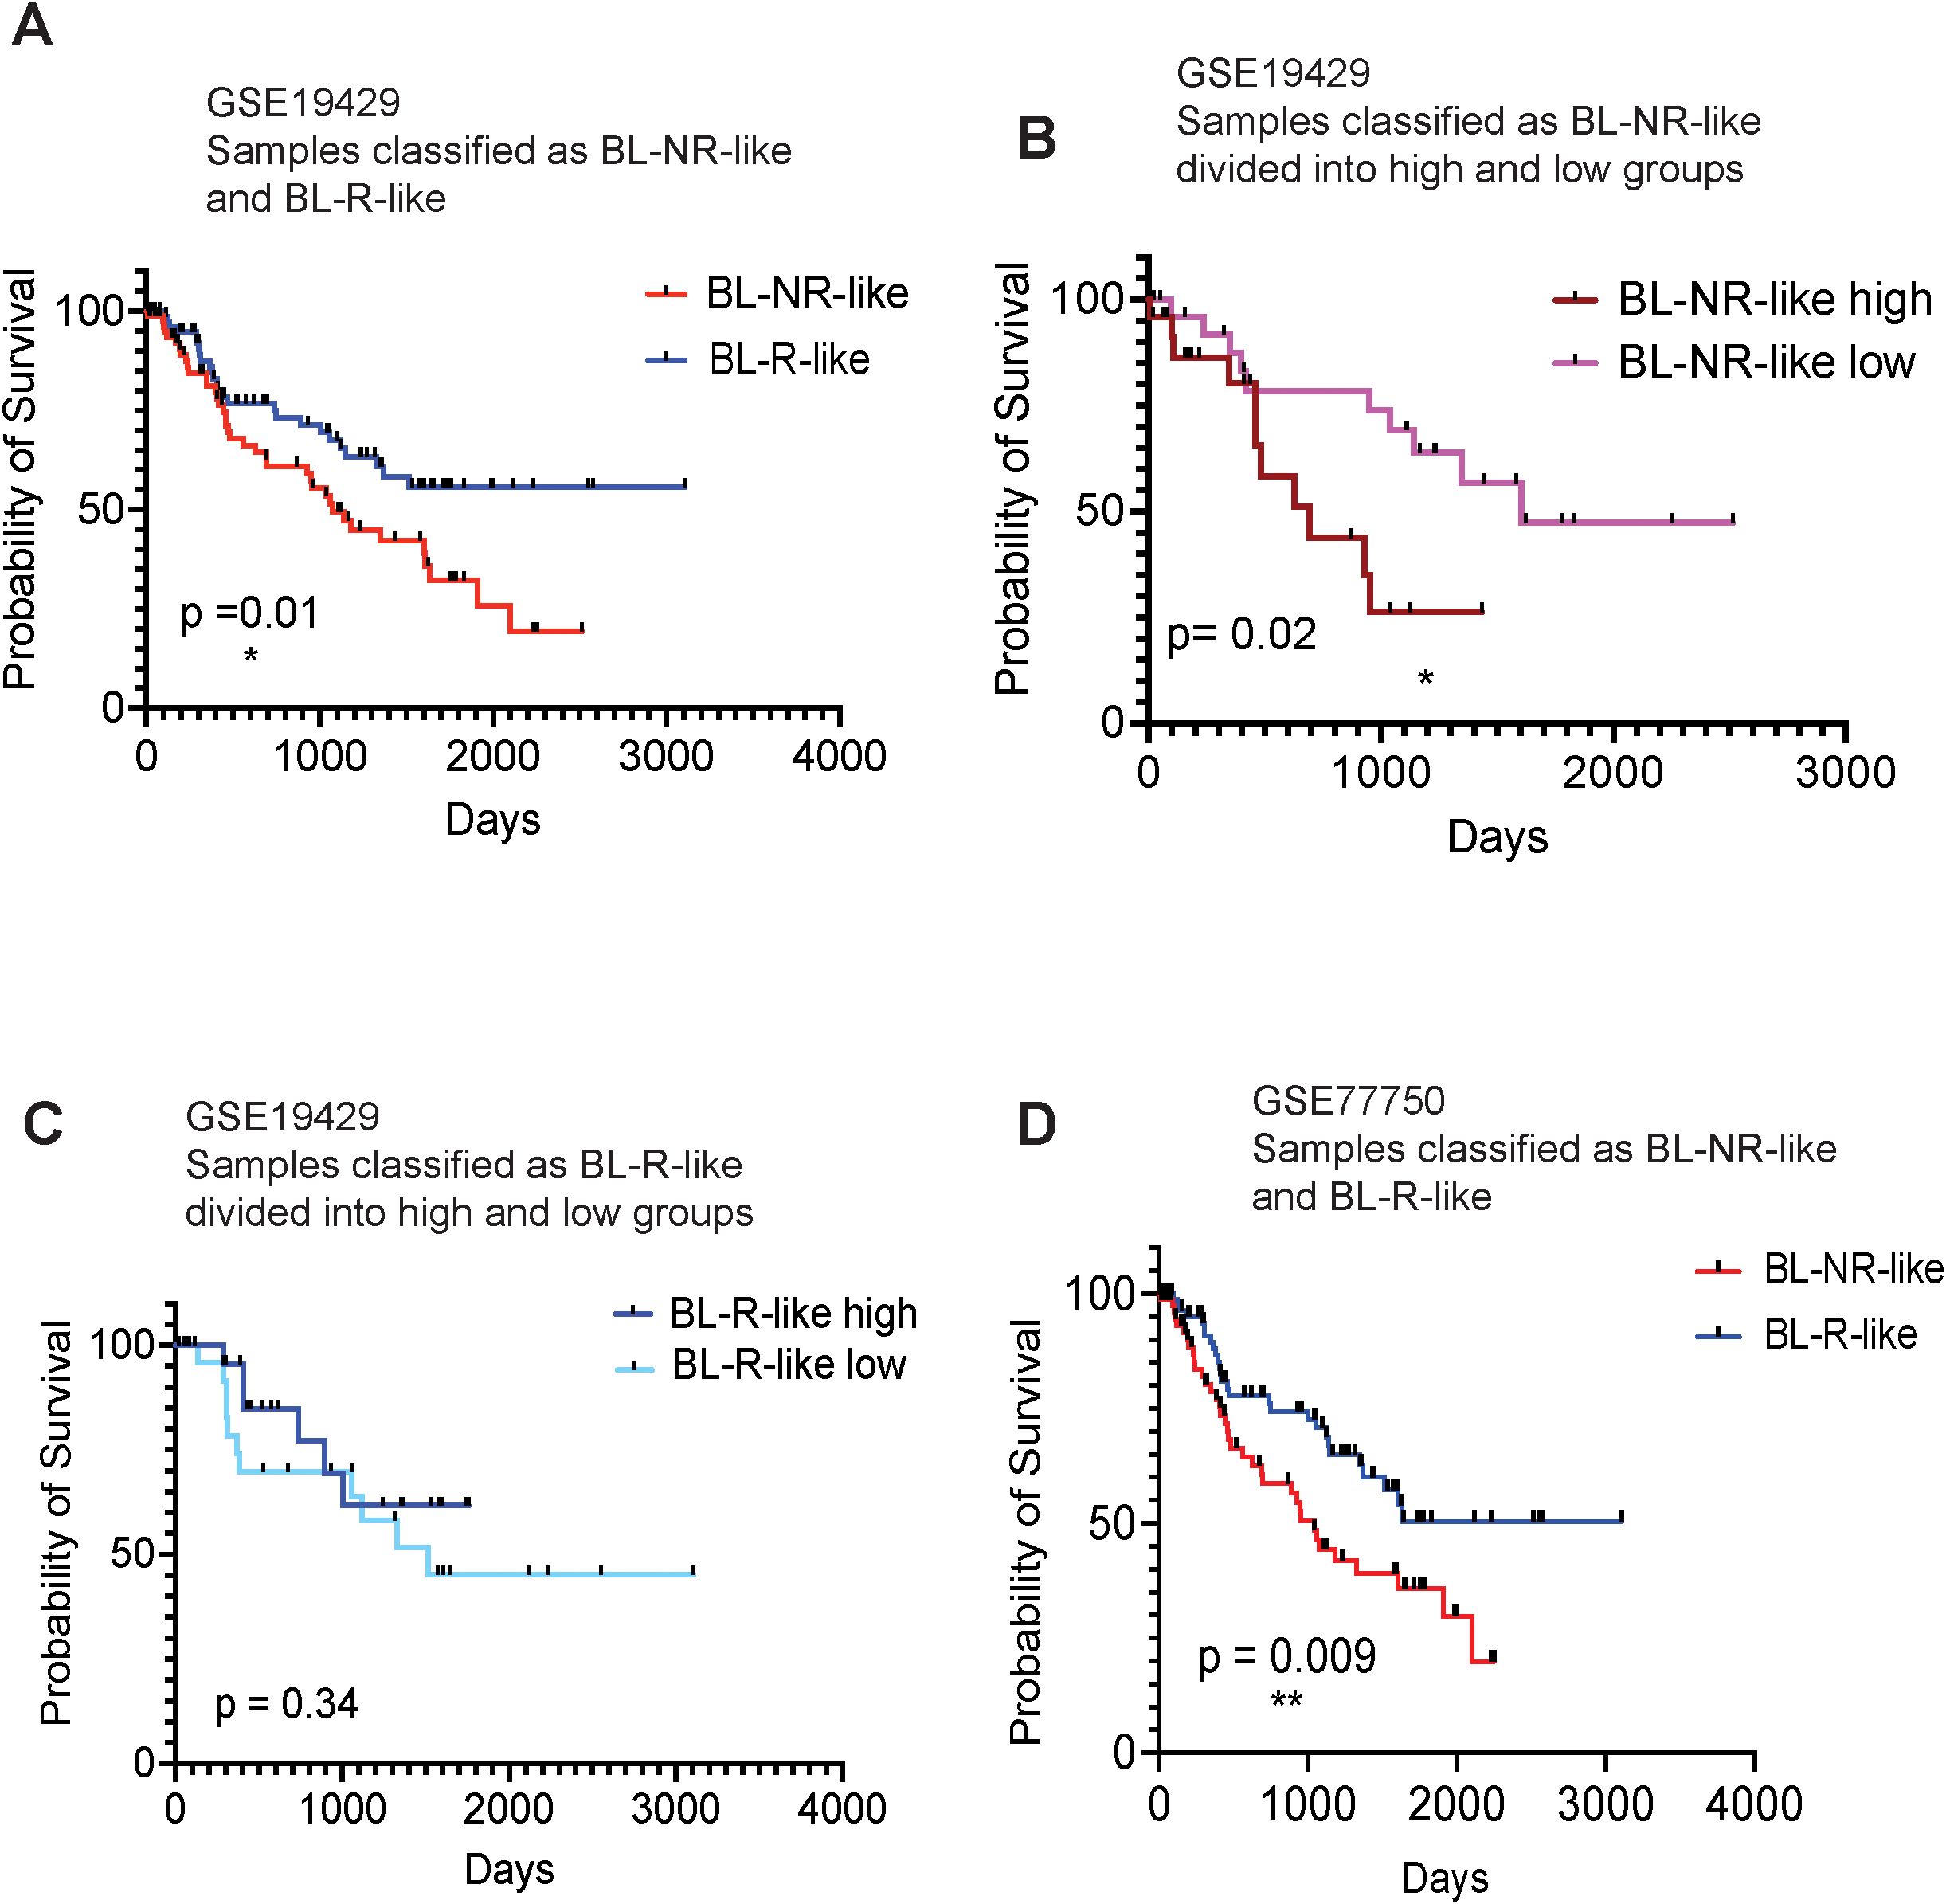
Figure 5. Kaplan-Meier survival analysis of MDS patients, based on BL-R and BL-NR gene signature (A) Survival analysis of patients, recorded in GSE19429, based on sample classification into blast R-like, or NR-like, according to our blast-R and blast-NR gene signature. (B) Survival analysis of NR-like patients from (A), based on high, or low expression of blast-NR signature. (C) Survival analysis of R-like patients from (A), based on high, or low expression of blast-R signature. (D) Survival analysis of patients recorded in GSE77750, classified as blast-R-like or NR-like, based on our blast-R and blast-NR gene signature.
To further investigate the ability of our transcriptional classifier to predict survival, we examined the publicly available gene expression profiles of 22 MDS/AML patients (13 responders and 9 non-responders; GSE77750) (13). We applied our approach to derive independent BL-NR and BL-R gene signatures from this dataset and classified the MDS patients in (12) as BL-NR-like and BL-R-like. When the GSE77750-derived transcriptional classifier was used, BL-NR-like patients exhibited significantly worse outcomes than BL-R-like patients (Figure 5D). Of note, our prognostic transcriptional classifier outperformed the algorithm originally described in this study.
We next evaluated MDS patient outcomes in the patient cohort in ref (12). using the same strategy to develop a transcriptional classifier based on hematological response. HEM-NR-like patients did not exhibit significant differences in survival compared to the HEM-R-like patients (Supplementary Figure 3). Examination of clinical histories revealed that three of the HEM-R patients (P1, P10, P13) also were BL-NRs. Given the potential contribution of blast number to patient outcomes, we re-evaluated the cohort after excluding these 3 patients from the analysis. This analysis confirmed no difference in survival between HEM-R-like and HEM-NR-like patients (data not shown).
4 Discussion
For over a decade, AZA has been the standard of care for MDS. However, only ~50% of patients will respond, and even those who do, have a poor prognosis after initial response (4, 25). Furthermore, clinical outcomes for AZA refractory/relapsed patients are extremely poor (25, 26). We evaluated paired pre-/post-AZA samples to better understand the biological consequences and mechanisms of AZA therapy. We found that AZA reduced the mutational burden in the majority of patients, particularly in those who exhibited clinical response to therapy. Our limited data appear to confirm prior reports that AML/MDS patients harboring TP53 and DNMT3A p.R696H mutations respond to HMA therapy (27, 28). 3 patients harboring mutations in BCOR mutations exhibited no response, suggesting its role in AZA resistance, as has been suggested by prior studies in AML (29). We also observed that transitions, especially C>T, predominated over transversions, consistent with previous studies (30). Interestingly, the VAF of transition mutations was reduced or disappeared in most cases, suggesting that the 5mC mutations may be reversed by AZA. Collectively, these findings highlight the mutation-specific alterations associated with AZA response.
Comparison of pre-AZA HSPCs to age-matched healthy controls revealed enrichment of several pathways that promote self-renewal of HSC and LSCs. However, following AZA treatment, MDS HSPCs showed widespread induction of pathways including those associated with inflammation, cell cycling, and apoptosis. To detect potential outliers in our sample cohort, we conducted single sample GSEA (ssGSEA), but did not identify clear outliers based on pathway differences (data not shown). Although these pathway changes were observed in all patients regardless of blast or hematological response, blast non-responder (BL-NR) patients showed a lack of enrichment for cell cycle-associated pathways pre-treatment, consistent with prior reports that AZA resistant HSPCs are more quiescent (25). Compared to blast responder (BL-R) patients and age-matched healthy controls, BL-NR patients exhibited increased expression of a clinically-relevant LSC- signature. Additionally, BL-NR HSPCs showed lower expression of genes associated with MHC class II presentation than BL-R HSPCs, indicating that differences in immune cell recognition and clearance may affect patient response to AZA therapy. This is consistent with prior studies demonstrating the importance of immune cell-mediated blast clearance in MDS and AZA enhancement of this activity (31–35). Collectively, these findings indicate that multiple cell-intrinsic differences contribute to AZA resistance in MDS HSPC.
While prior studies have attempted to develop transcriptional signatures that predict AZA response or survival, these efforts have not resulted in robust methods to predict outcomes (13, 25). In contrast to previous studies, we compared patient samples to healthy controls and refined gene sets by only considering genes associated with the presence or absence of response. Our method applied to one MDS patient cohort (13) outperformed the prognostic gene signature derived utilizing gene expression data from the same cohort.
While our studies suggest that a transcriptional classifier may be used to predict AZA responses, they only focused on genomic and transcriptomic changes following AZA treatment. We expect that an integrated evaluation of epigenetic and post-transcriptional states with mutational and transcriptional states associated with AZA resistance would increase our ability to predict patient responses to AZA.
Data availability statement
Processed files are available at GEO, accession no. GSE272173.
Ethics statement
The study received official institutional approval from Hospital Universitario de Salamanca, Salamanca, Spain (Approval Number: PI 2021 03 704). The studies were conducted in accordance with the local legislation and institutional requirements. The participants provided their written informed consent to participate in this study.
Author contributions
MdRG: Writing – original draft, Writing – review & editing, Conceptualization, Data curation, Formal analysis, Investigation, Methodology, Software, Validation, Visualization. SC: Conceptualization, Data curation, Formal analysis, Investigation, Methodology, Software, Validation, Visualization, Writing – original draft, Writing – review & editing. JMHS: Data curation, Methodology, Software, Writing – original draft. MDC: Writing – review & editing. CYP: Conceptualization, Funding acquisition, Project administration, Resources, Supervision, Writing – review & editing. JMHR: Conceptualization, Funding acquisition, Project administration, Resources, Supervision, Writing – review & editing.
Funding
The author(s) declare financial support was received for the research, authorship, and/or publication of this article. Supported by NIH/NCI R01CA249054 (CYP) and PI20/00970, PI23/01103 and GRS 2876/A1/2023 (MDC). SC has been a recipient of National Cancer Center Postdoctoral Award (2020-2022) and NYUGSoM NYSTEM training grant (2022-2023).
Acknowledgments
We thank members of the CYP lab for their critical feedback throughout the course of these studies.
Conflict of interest
The authors declare that the research was conducted in the absence of any commercial or financial relationships that could be construed as a potential conflict of interest.
The author(s) declared that they were an editorial board member of Frontiers, at the time of submission. This had no impact on the peer review process and the final decision.
Publisher’s note
All claims expressed in this article are solely those of the authors and do not necessarily represent those of their affiliated organizations, or those of the publisher, the editors and the reviewers. Any product that may be evaluated in this article, or claim that may be made by its manufacturer, is not guaranteed or endorsed by the publisher.
Supplementary material
The Supplementary Material for this article can be found online at: https://www.frontiersin.org/articles/10.3389/fonc.2024.1438052/full#supplementary-material
Supplementary Figure 1 | Transcriptional analysis of MDS HSPCs. (A) Cell cycle associated pathways in HEM-R/-NR pre-/post-AZA. (B) Imputation of the progenitor population distribution within MDS/AML CD34+ cell population by CIBERSORTx analysis, pre- and post-AZA. We did not observe any statistically significant difference between any of the pre-/post- comparisons. Samples have been color coded by their BL, or HEM- response.
Supplementary Figure 2 | Clinical information of the patient samples from GSE19429, and GSE111085, which were re-classified as BL-R-like and BL-NR-like.
Supplementary Figure 3 | Kaplan-Meir survival analysis of MDS patients, based on HEM-R and HEM-NR gene signature. Survival analysis of MDS patients (data from GSE19429), based on sample classification into HEM-R-like, or HEM-NR-like, according to our HEM-R and HEM-NR gene signature.
Supplementary Table 1 | Clinical and biological characteristics of the patients treated with 5-azacytidine.
Supplementary Table 2 | Myeloid-related genes included in the NGS panel.
Supplementary Table 3 | Description of all mutations presented in MDS HSPCs.
Supplementary Table 4 | List of genes differentially expressed between pre-treatment MDS HSPCs and healthy controls.
Supplementary Table 5 | List of genes differentially expressed between post-treatment MDS HSPCs and healthy controls.
Supplementary Table 6 | List of genes differentially expressed between pre- and post-treatment blast responders (BL-R).
Supplementary Table 7 | List of genes differentially expressed between pre- and post-treatment blast non-responders (BL-NR).
Supplementary Table 8 | List of genes differentially expressed between pre- and post-treatment hematological responders (HEM-R).
Supplementary Table 9 | List of genes differentially expressed between pre- and post-treatment hematological non-responders (HEM-NR).
Supplementary Table 10 | List of B-lymphocyte genes expressed in pre- and post-treatment patient samples and healthy controls.
References
1. Nimer SD. Myelodysplastic syndromes. Blood. (2008) 111:4841–51. doi: 10.1182/blood-2007-08-078139
2. Tefferi A, Vardiman JW. Myelodysplastic syndromes. N Engl J Med. (2009) 361:1872–85. doi: 10.1056/NEJMra0902908
3. Jabbour E, Takahashi K, Wang X, Cornelison AM, Abruzzo L, Kadia T, et al. Acquisition of cytogenetic abnormalities in patients with IPSS defined lower-risk myelodysplastic syndrome is associated with poor prognosis and transformation to acute myelogenous leukemia. Am J Hematol. (2013) 88:831–7. doi: 10.1002/ajh.23513
4. Fenaux P, Mufti GJ, Hellstrom-Lindberg E, Santini V, Finelli C, Giagounidis A, et al. Efficacy of azacitidine compared with that of conventional care regimens in the treatment of higher-risk myelodysplastic syndromes: a randomised, open-label, phase III study. Lancet Oncol. (2009) 10:223–32. doi: 10.1016/S1470-2045(09)70003-8
5. Montalban-Bravo G, Garcia-Manero G. Myelodysplastic syndromes: 2018 update on diagnosis, risk-stratification and management. Am J Hematol. (2018) 93:129–47. doi: 10.1002/ajh.24930
6. Kaminskas E, Farrell AT, Wang YC, Sridhara R, Pazdur R. FDA drug approval summary: azacitidine (5-azacytidine, Vidaza) for injectable suspension. Oncologist. (2005) 10:176–82. doi: 10.1634/theoncologist.10-3-176
7. Fenaux P, Mufti GJ, Hellstrom-Lindberg E, Santini V, Gattermann N, Germing U, et al. Azacitidine prolongs overall survival compared with conventional care regimens in elderly patients with low bone marrow blast count acute myeloid leukemia. J Clin Oncol. (2010) 28:562–9. doi: 10.1200/JCO.2009.23.8329
8. Silverman LR, Demakos EP, Peterson BL, Kornblith AB, Holland JC, Odchimar-Reissig R, et al. Randomized controlled trial of azacitidine in patients with the myelodysplastic syndrome: a study of the cancer and leukemia group B. J Clin Oncol. (2002) 20:2429–40. doi: 10.1200/JCO.2002.04.117
9. Bernal T, Martinez-Camblor P, Sanchez-Garcia J, de Paz R, Luno E, Nomdedeu B, et al. Effectiveness of azacitidine in unselected high-risk myelodysplastic syndromes: results from the Spanish registry. Leukemia. (2015) 29:1875–81. doi: 10.1038/leu.2015.115
10. Silverman LR, Fenaux P, Mufti GJ, Santini V, Hellstrom-Lindberg E, Gattermann N, et al. Continued azacitidine therapy beyond time of first response improves quality of response in patients with higher-risk myelodysplastic syndromes. Cancer. (2011) 117:2697–702. doi: 10.1002/cncr.25774
11. Cheson BD, Bennett JM, Kantarjian H, Pinto A, Schiffer CA, Nimer SD, et al. Report of an international working group to standardize response criteria for myelodysplastic syndromes. Blood. (2000) 96:3671–4. doi: 10.1182/blood.V96.12.3671
12. Pellagatti A, Cazzola M, Giagounidis A, Perry J, Malcovati L, Della Porta MG, et al. Deregulated gene expression pathways in myelodysplastic syndrome hematopoietic stem cells. Leukemia. (2010) 24:756–64. doi: 10.1038/leu.2010.31
13. Monika Belickova M, Merkerova MD, Votavova H, Valka J, Vesela J, Pejsova B, et al. Up-regulation of ribosomal genes is associated with a poor response to azacitidine in myelodysplasia and related neoplasms. Int J Hematol. (2016) 104:566–73. doi: 10.1007/s12185-016-2058-3
14. Balakrishnan K, Nimmanapalli R, Ravandi F, Keating MJ, Gandhi V. Forodesine, an inhibitor of purine nucleoside phosphorylase, induces apoptosis in chronic lymphocytic leukemia cells. Blood. (2006) 108:2392–8. doi: 10.1182/blood-2006-03-007468
15. Yamashita M, Passegue E. TNF-alpha coordinates hematopoietic stem cell survival and myeloid regeneration. Cell Stem Cell. (2019) 25:357–72 e7. doi: 10.1016/j.stem.2019.05.019
16. Kagoya Y, Yoshimi A, Kataoka K, Nakagawa M, Kumano K, Arai S, et al. Positive feedback between NF-kappaB and TNF-alpha promotes leukemia-initiating cell capacity. J Clin Invest. (2014) 124:528–42. doi: 10.1172/JCI68101
17. Kim J, Woo AJ, Chu JL, Snow JW, Fujiwara Y, Kim CG, et al. A myc network accounts for similarities between embryonic stem and cancer cell transcription programs. Cell. (2010) 143:313–24. doi: 10.1016/j.cell.2010.09.010
18. Li L, Osdal T, Ho YW, Chun S, McDonald T, Agarwal P, et al. SIRT1 activation by a c-MYC oncogenic network promotes the maintenance and drug resistance of human FLT3-ITD acute myeloid leukemia stem cells. Cell Stem Cell. (2014) 15:431–46. doi: 10.1016/j.stem.2014.08.001
19. Fauriat C, Olive D. AML drug resistance: c-Myc comes into play. Blood. (2014) 123:3528–30. doi: 10.1182/blood-2014-04-566711
20. Ng SW, Mitchell A, Kennedy JA, Chen WC, McLeod J, Ibrahimova N, et al. A 17-gene stemness score for rapid determination of risk in acute leukaemia. Nature. (2016) 540:433–7. doi: 10.1038/nature20598
21. Vegivinti CTR, Keesari PR, Veeraballi S, Martins Maia CMP, Mehta AK, Lavu RR, et al. Role of innate immunological/inflammatory pathways in myelodysplastic syndromes and AML: a narrative review. Exp Hematol Oncol. (2023) 12:60. doi: 10.1186/s40164-023-00422-1
22. Bankova AK, Pang WW, Velasco BJ, Long-Boyle JR, Shizuru JA. 5-Azacytidine depletes HSCs and synergizes with an anti-CD117 antibody to augment donor engraftment in immunocompetent mice. Blood Adv. (2021) 5:3900–12. doi: 10.1182/bloodadvances.2020003841
23. Corces MR, Buenrostro JD, Wu B, Greenside PG, Chan SM, Koenig JL, et al. Lineage-specific and single-cell chromatin accessibility charts human hematopoiesis and leukemia evolution. Nat Genet. (2016) 48:1193–203. doi: 10.1038/ng.3646
24. Sternberg A, Killick S, Littlewood T, Hatton C, Peniket A, Seidl T, et al. Evidence for reduced B-cell progenitors in early (low-risk) myelodysplastic syndrome. Blood. (2005) 106:2982–91. doi: 10.1182/blood-2005-04-1543
25. Unnikrishnan A, Papaemmanuil E, Beck D, Deshpande NP, Verma A, Kumari A, et al. Integrative genomics identifies the molecular basis of resistance to azacitidine therapy in myelodysplastic syndromes. Cell Rep. (2017) 20:572–85. doi: 10.1016/j.celrep.2017.06.067
26. Prebet T, Gore SD, Esterni B, Gardin C, Itzykson R, Thepot S, et al. Outcome of high-risk myelodysplastic syndrome after azacitidine treatment failure. J Clin Oncol. (2011) 29:3322–7. doi: 10.1200/JCO.2011.35.8135
27. Welch JS, Petti AA, Miller CA, Fronick CC, O’Laughlin M, Fulton RS, et al. TP53 and decitabine in acute myeloid leukemia and myelodysplastic syndromes. N Engl J Med. (2016) 375:2023–36. doi: 10.1056/NEJMoa1605949
28. Metzeler KH, Walker A, Geyer S, Garzon R, Klisovic RB, Bloomfield CD, et al. DNMT3A mutations and response to the hypomethylating agent decitabine in acute myeloid leukemia. Leukemia. (2012) 26:1106–7. doi: 10.1038/leu.2011.342
29. Honda A, Koya J, Yoshimi A, Miyauchi M, Taoka K, Kataoka K, et al. Loss-of-function mutations in BCOR contribute to chemotherapy resistance in acute myeloid leukemia. Exp Hematol. (2021) 101-102:42–8 e11. doi: 10.1016/j.exphem.2021.07.005
30. Xu L, Gu ZH, Li Y, Zhang JL, Chang CK, Pan CM, et al. Genomic landscape of CD34+ hematopoietic cells in myelodysplastic syndrome and gene mutation profiles as prognostic markers. Proc Natl Acad Sci U S A. (2014) 111:8589–94. doi: 10.1073/pnas.1407688111
31. Ebelt ND, Zuniga E, Johnson BL, Diamond DJ, Manuel ER. 5-azacytidine potentiates anti-tumor immunity in a model of pancreatic ductal adenocarcinoma. Front Immunol. (2020) 11:538. doi: 10.3389/fimmu.2020.00538
32. Gang AO, Frosig TM, Brimnes MK, Lyngaa R, Treppendahl MB, Gronbaek K, et al. 5-Azacytidine treatment sensitizes tumor cells to T-cell mediated cytotoxicity and modulates NK cells in patients with myeloid Malignancies. Blood Cancer J. (2014) 4:e197. doi: 10.1038/bcj.2014.14
33. Costantini B, Kordasti SY, Kulasekararaj AG, Jiang J, Seidl T, Abellan PP, et al. The effects of 5-azacytidine on the function and number of regulatory T cells and T-effectors in myelodysplastic syndrome. Haematologica. (2013) 98:1196–205. doi: 10.3324/haematol.2012.074823
34. Ebelt ND, Manuel ER. 5-azacytidine-mediated modulation of the immune microenvironment in murine acute myeloid leukemia. Cancers (Basel). (2022) 4:e197. doi: 10.3390/cancers15010118
Keywords: myelodysplastic syndrome (MDS), hematopoietic stem/progenitor cells (HSPCs), mutations, gene expression, patient survival, prognosis
Citation: González MdR, Chakraborty S, Hernández-Sánchez JM, Diez Campelo M, Park CY and Hernández Rivas JM (2024) Molecular profiling of pre- and post- 5-azacytidine myelodysplastic syndrome samples identifies predictors of response. Front. Oncol. 14:1438052. doi: 10.3389/fonc.2024.1438052
Received: 24 May 2024; Accepted: 27 August 2024;
Published: 23 September 2024.
Edited by:
Ulrich Germing, Heinrich Heine University of Düsseldorf, GermanyReviewed by:
Diego A. Pereira-Martins, University of Groningen, NetherlandsAnna M. Eiring, Texas Tech University Health Sciences Center El Paso, United States
Copyright © 2024 González, Chakraborty, Hernández-Sánchez, Diez Campelo, Park and Hernández Rivas. This is an open-access article distributed under the terms of the Creative Commons Attribution License (CC BY). The use, distribution or reproduction in other forums is permitted, provided the original author(s) and the copyright owner(s) are credited and that the original publication in this journal is cited, in accordance with accepted academic practice. No use, distribution or reproduction is permitted which does not comply with these terms.
*Correspondence: Christopher Y. Park, Christopher.park@nyulangone.org; Jesús María Hernández Rivas, jmhr@usal.es
†These authors have contributed equally to this work