
95% of researchers rate our articles as excellent or good
Learn more about the work of our research integrity team to safeguard the quality of each article we publish.
Find out more
ORIGINAL RESEARCH article
Front. Oncol. , 03 May 2023
Sec. Thoracic Oncology
Volume 13 - 2023 | https://doi.org/10.3389/fonc.2023.1150539
This article is part of the Research Topic Real-World Data and Real-World Evidence in Lung Cancer View all 23 articles
 Qiuxi Zhou1†
 Qiao He2†Ling Peng1
 Yecai Huang3Kexun Li4Kun Liu4Da Li1Jing Zhao1Kairong Sun5Aoshuang Li6
 Wenwu He4*
Objective: Preoperative noninvasive diagnosis of the benign or malignant solitary pulmonary nodule (SPN) is still important and difficult for clinical decisions and treatment. This study aimed to assist in the preoperative diagnosis of benign or malignant SPN using blood biomarkers.
Methods: A total of 286 patients were recruited for this study. The serum FR+CTC, TK1, TP, TPS, ALB, Pre-ALB, ProGRP, CYFRA21-1, NSE, CA50, CA199, and CA242 were detected and analyzed.
Results: In the univariate analysis, age, FR+CTC, TK1, CA50, CA19.9, CA242, ProGRP, NSE, CYFRA21-1, and TPS showed the statistical significance of a correlation with malignant SPNs (P <0.05). The highest performing biomarker is FR+CTC (odd ratio [OR], 4.47; 95% CI: 2.57–7.89; P <0.001). The multivariate analysis identified that age (OR, 2.69; 95% CI: 1.34–5.59, P = 0.006), FR+CTC (OR, 6.26; 95% CI: 3.09–13.37, P <0.001), TK1 (OR, 4.82; 95% CI: 2.4–10.27, P <0.001), and NSE (OR, 2.06; 95% CI: 1.07–4.06, P = 0.033) are independent predictors. A prediction model based on age, FR+CTC, TK1, CA50, CA242, ProGRP, NSE, and TPS was developed and presented as a nomogram, with a sensitivity of 71.1% and a specificity of 81.3%, and the AUC was 0.826 (95% CI: 0.768–0.884).
Conclusions: The novel prediction model based on FR+CTC showed much stronger performance than any single biomarker, and it can assist in predicting benign or malignant SPNs.
A solitary pulmonary nodule (SPN) is a single intraparenchymal lung lesion with a diameter of less than 3 cm. Most SPNs are benign nodules, such as pulmonary hamartoma and tuberculoma (1). The incidence of malignancies for SPNs ranged from 0.5% to 3.5%, mostly primary lung cancer (2). It depends on the age of patients, smoking status, history of cancer, nodule diameter, nodule volume, spiculated margins, and nodule location (3). The most common pathological types of malignant SPNs are adenocarcinoma and squamous cell carcinoma (4, 5). However, both nodules share similar imaging features, such as spiculated margins and lobulated structures (6, 7). The imaging diagnostics of lung cancer patients include morphological imaging modalities such as chest X-ray (CXR) and computed tomography (CT) and nuclear medicine procedures such as positron emission tomography (PET). Most of the pulmonary nodules smaller than 1 cm will not be visible on chest radiographs (8). Additionally, at least 95% of the nodules identified by computed tomography (CT) are benign (9). In clinical practice, differentiating malignant from benign nodules by conventional imaging alone has been challenging, with false positive and false negative rates up to 75% and 48%, respectively (10). Functional abnormalities can be found using PET before they appear morphologically on traditional imaging, and some studies have shown good diagnostic performance in SPN (11, 12). However, their performance is affected by the patient’s stratification. A meta-analysis comparing the diagnostic value of 18F-FDG-PET/CT versus CT observed no significant differences in sensitivity, specificity, PLR, NLR, DOR, and AUC (10). Serum biomarkers have many advantages over tissue-based detection, such as being non-invasive and easily repeatable. Nevertheless, they have low sensitivity in diagnosing malignancies yet high false-positive rates in benign tumors or infections (13). The utility of single serum biomarkers in SPN diagnosis is thus limited, and clinical guidelines generally recommend that combinations of serum biomarkers be used to improve detection efficiency (14). Though many prediction models have been developed, few are widely used in clinical practice (15, 16). It is, therefore, imperative to identify novel biomarkers and prediction models supporting the early diagnosis of non-small cell lung cancer (NSCLC).
Folate receptor alpha (FRα) is a glycoprotein that is anchored to the cell membrane of normal epithelial cells and highly expressed in a variety of tumor cells of epithelial origin, including lung, colorectal, ovarian, etc. (17–19). An FR-based CTC detection has been developed, and the related FR-positive CTC (FR+CTC) detection kit has been approved by the CFDA for clinical application. FR+CTCs have high sensitivity (73.2%–81.8%) and specificity (84.1%–93.2%) for the diagnosis of lung cancer (20, 21). FR+CTCs combined with common cancer biomarkers have been proven to improve diagnostic efficiency significantly in patients with NSCLC (20, 22). Xue et al. reported that FR+CTCs are reliable biomarkers that have a better performance than serum carcinoembryonic antigen (CEA), neuron−specific enolase (NSE), cytokeratin 19 fragments (CYFRA21−1), squamous cell carcinoma antigen (SCC), progastrin−releasing peptide (Pro-GRP), and heat shock protein 90−α (Hsp90α) in patients with small-sized nodules (23). FR+CTCs for the diagnosis of SPNs have been examined in a small prospective study (24). However, the utility of FR+CTC levels in combination with serum and tumor biomarkers to build a diagnostic model in NSCLC patients with SPNs was not reported.
In this study, we aimed to explore the expression of peripheral blood FR+CTCs, establish a diagnostic model based on FR+CTCs, and combine serum biomarkers in patients with SPNs. Furthermore, the study helps guide the clinical treatment strategies for pulmonary nodules.
A total of 1,627 patients diagnosed with lung cancer or pulmonary nodules at the Sichuan Cancer Hospital & Institute from November 2016 to December 2020 were analyzed retrospectively. Finally, 271 patients were included in this study (Figure 1) based on the inclusion and exclusion criteria as follows: (1) Patients with chest CT images indicated pulmonary nodules; (2) pulmonary nodules were less than 3 cm; and (3) pretreatment hematological detection, including folate receptor-positive circulating tumor cell (FR+CTC) level, thymidine kinase 1 (TK1), total protein (TP), albumin (ALB), pre-albumin (PALB), pro-gastrin-releasing peptide (ProGRP), recombinant cytokeratin fragment antigen 21-1 (CYFRA21-1), tissue polypeptide specific antigen (TPS), neuron-specific enolase (NSE), carbohydrate antigen 50 (CA50), carbohydrate antigen 199 (CA19.9), and carbohydrate antigen 242 (CA242) were available. Exclusion criteria: (1) patients had a history of malignancy or any other serious chronic diseases; and (2) patients underwent surgery, chemotherapy, anti-infection, anti-tuberculosis, or targeted therapy.
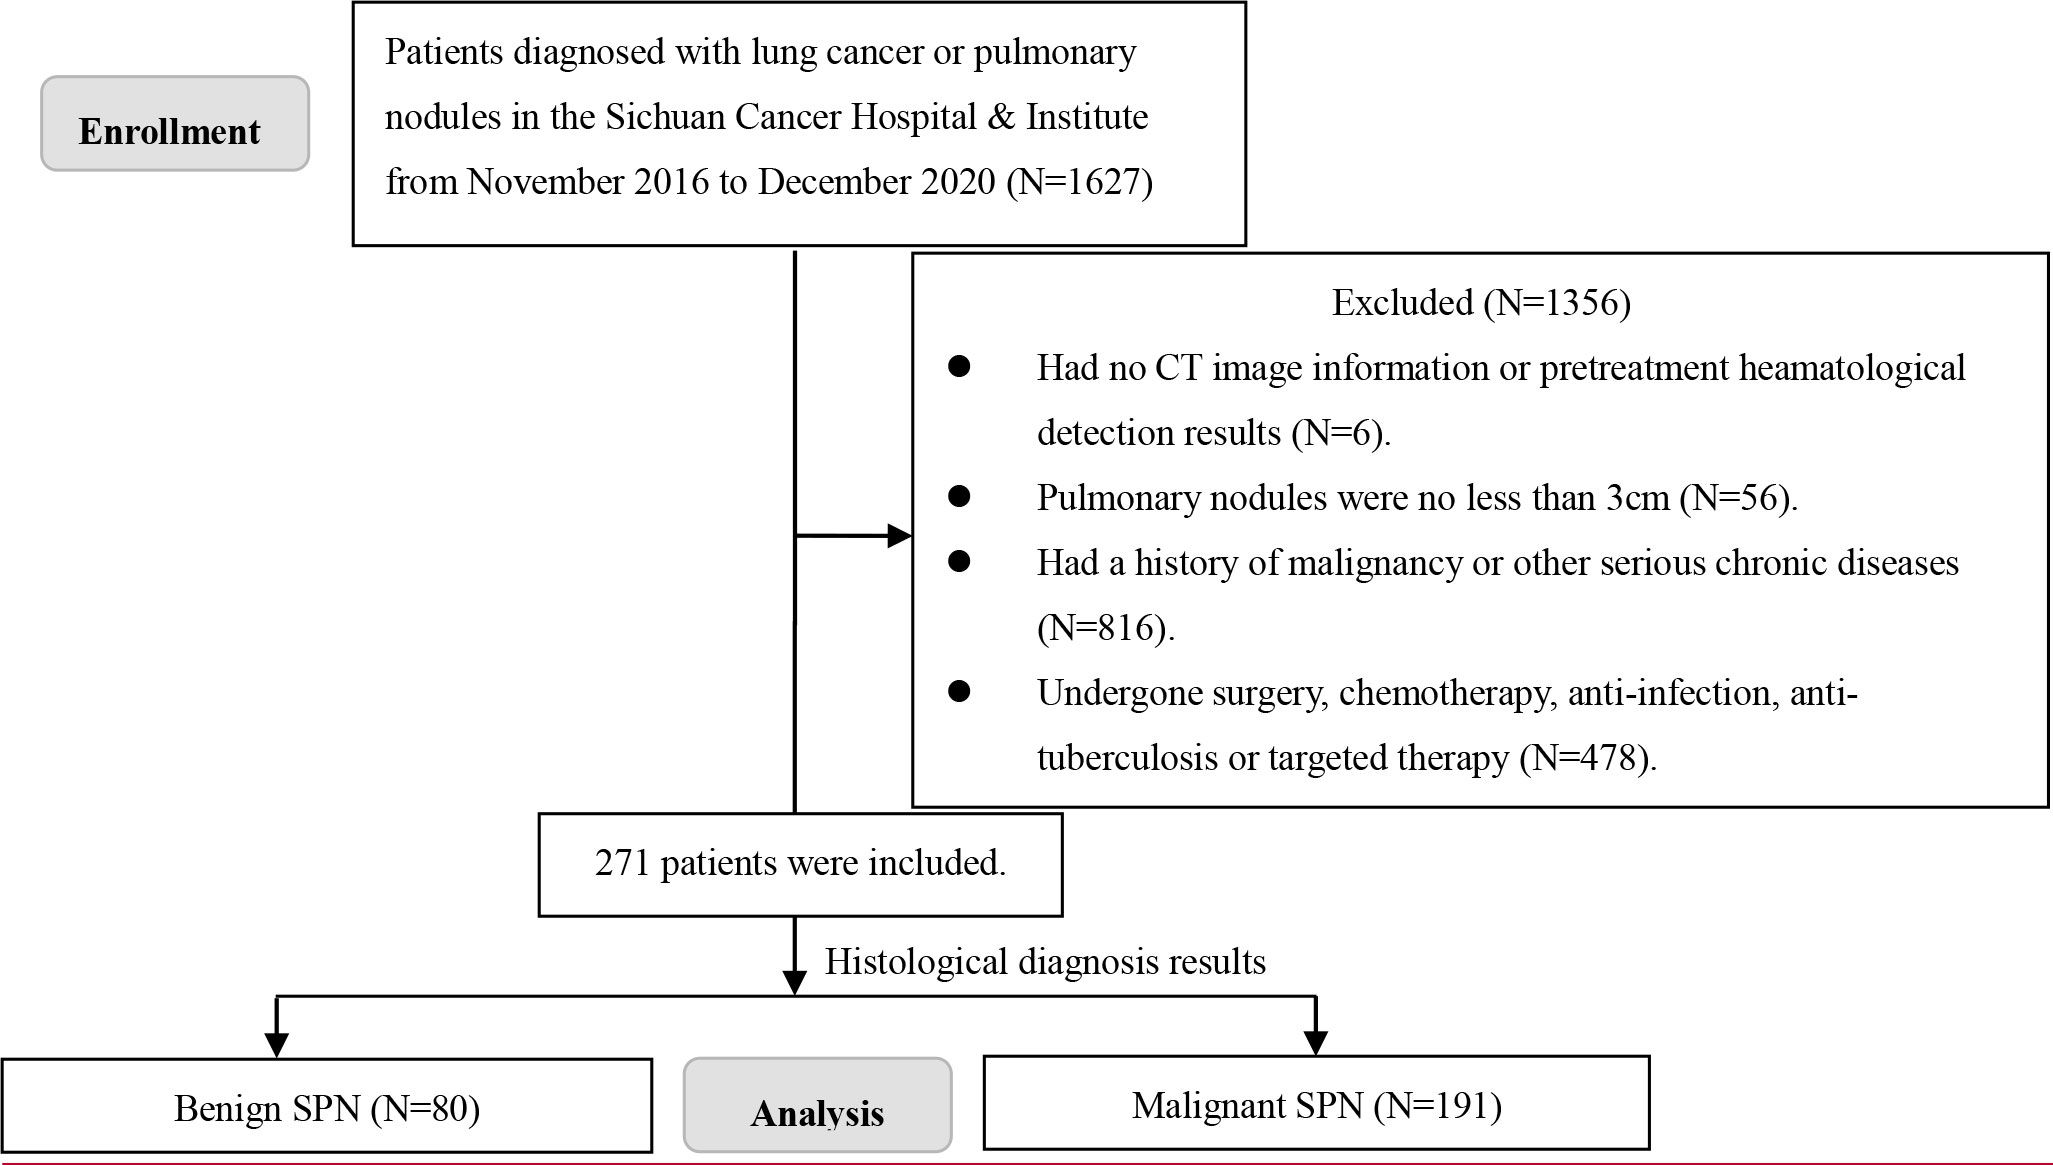
Figure 1 Screening flowchart of the participants.
This study was approved by the Ethics Committee of Sichuan Cancer Hospital (No. SCCHEC-02-2017-042). All samples for hematological detection were collected from each patient before the initiation of treatment. Demographic characteristics were collected through the hospital information system (HIS). We present the following article in accordance with the Transparent Reporting of a multivariable prediction model for Individual Prognosis Or Diagnosis (TRIPOD) reporting guideline.
After collection, whole blood samples for Transparent Reporting of a multivariable prediction model for Individual Prognosis Or Diagnosis FR+CTC detection were conducted within 24 h according to the manufacturer’s protocol for the CytoploRare Kit (Genosaber Biotech, Shanghai, China). At first, the erythrocytes were lysed with lysing buffer, and then leukocytes and macrophages were removed with anti-CD45 and anti-CD14, respectively. Secondly, the enriched samples were labeled with detection probes that contained conjugates of a tumor-specific ligand folic acid and a synthesized oligonucleotide. The oligonucleotide (5’-CTCAA CTGGT GTCGT GGAGT CGGCA ATTCA GTTGA GGGTT CTAA-3’) was used for subsequent PCR amplification.
Folate receptor-expressing cells were eluted and quantified by the ABI 7500 Real-Time PCR System (ThermoFisher, MA, USA) after washing out free conjugates. The primer sequences were as follows: forward primer 5’-TATGA TTATG AGGCA TGA-3’; reverse primer 5’-GGTGT CGTGG AGTCG-3’; and TaqMan probe 5’-FAM-CAGTT GAGGG TTC-MGB-3’. The quantitative analysis of FR-positive CTC was calculated through the amplification curve of the sample and standard reference.
TK1 was detected by enhanced chemiluminescence dot blot assay (Sino-Swed Tong Kang Bio-Tech, Shenzhen, China). The serum TP, ALB, and pre-ALB were determined with a Clinical Laboratory Beckman Coulter AU5800. CA50 and CA242 were measured with the electrochemiluminescence immunoassay system CL-6000i (Mindray, China). In addition, the electrochemiluminescence immunoassay system LIAISON® XL (Nanjing Tao Ze Bio-Technology, China) was also used to detect TPS and NSE. Moreover, ProGRP, CYFRA21-1, and CA199 were detected by the electrochemiluminescence immunoassay system Cobas E411 (Roche, Germany), respectively.
At first, numerical data was applied to the normality test. Normally distributed data were shown as mean ± standard deviation (SD). Alternatively, other data were shown as medians (interquartile range, IQR). Student’s t-tests were used to analyze normally distributed data between groups. Also, non-normally distributed data were analyzed by the Mann–Whitney U test. Categorical data were presented as numbers (percentages) and compared using the Chi-square test. The clinical data and hematological biomarkers were used to construct a univariate logistic regression model and a multivariate logistic regression model for the whole cohort. The final multivariate logistic model was developed by stepwise regression to obtain the best result with the smallest Akaike information criterion (AIC) (25). A nomogram was drawn based on the multivariate logistic regression model. The validity of the nomogram was evaluated by the calibration curve and the Hosmer–Lemeshow goodness of fit test. The receiver operating characteristic (ROC) curve was used to evaluate the diagnostic value of hematological biomarkers based on the area under the curve (AUC). We define the maximum Youden Index as the optimal cutoff value. Statistical analysis was conducted using R software version 4.1.0 (The Free Software Foundation, Boston, MA, USA). The “pROC” and “ggplot2” packages were used to draw the ROC and calibration curves. The “generalhoslem” package was used to conduct the Hosmer–Lemeshow test. A two-sided P <0.05 was considered significant.
In total, 191 malignant solitary pulmonary nodules (SPNs) and 80 benign SPN patients with pretreatment hematological biomarkers were included in this study (Figure 1). The mean age of the malignant and benign SPN groups was 59.24 ± 10.91 years old and 52.48 ± 9.51 years old, respectively. The median FR+CTC level in the malignant SPN group was 10.69 (95% CI: 9.16, 13.59), which was higher than that of the benign SPN group at 8.91 (95% CI: 6.68, 13.36) (P = 0.0014) (Figure 2A) (Table 1). CA19.9, ProGRP, CYFRA21.1, and TPS were significantly different between the malignant and benign groups (all P <0.05) (Figures 2B–E) (Table 1). The detailed information on the clinical characteristics and pretreatment hematological biomarkers of the patients is summarized in Table 1.
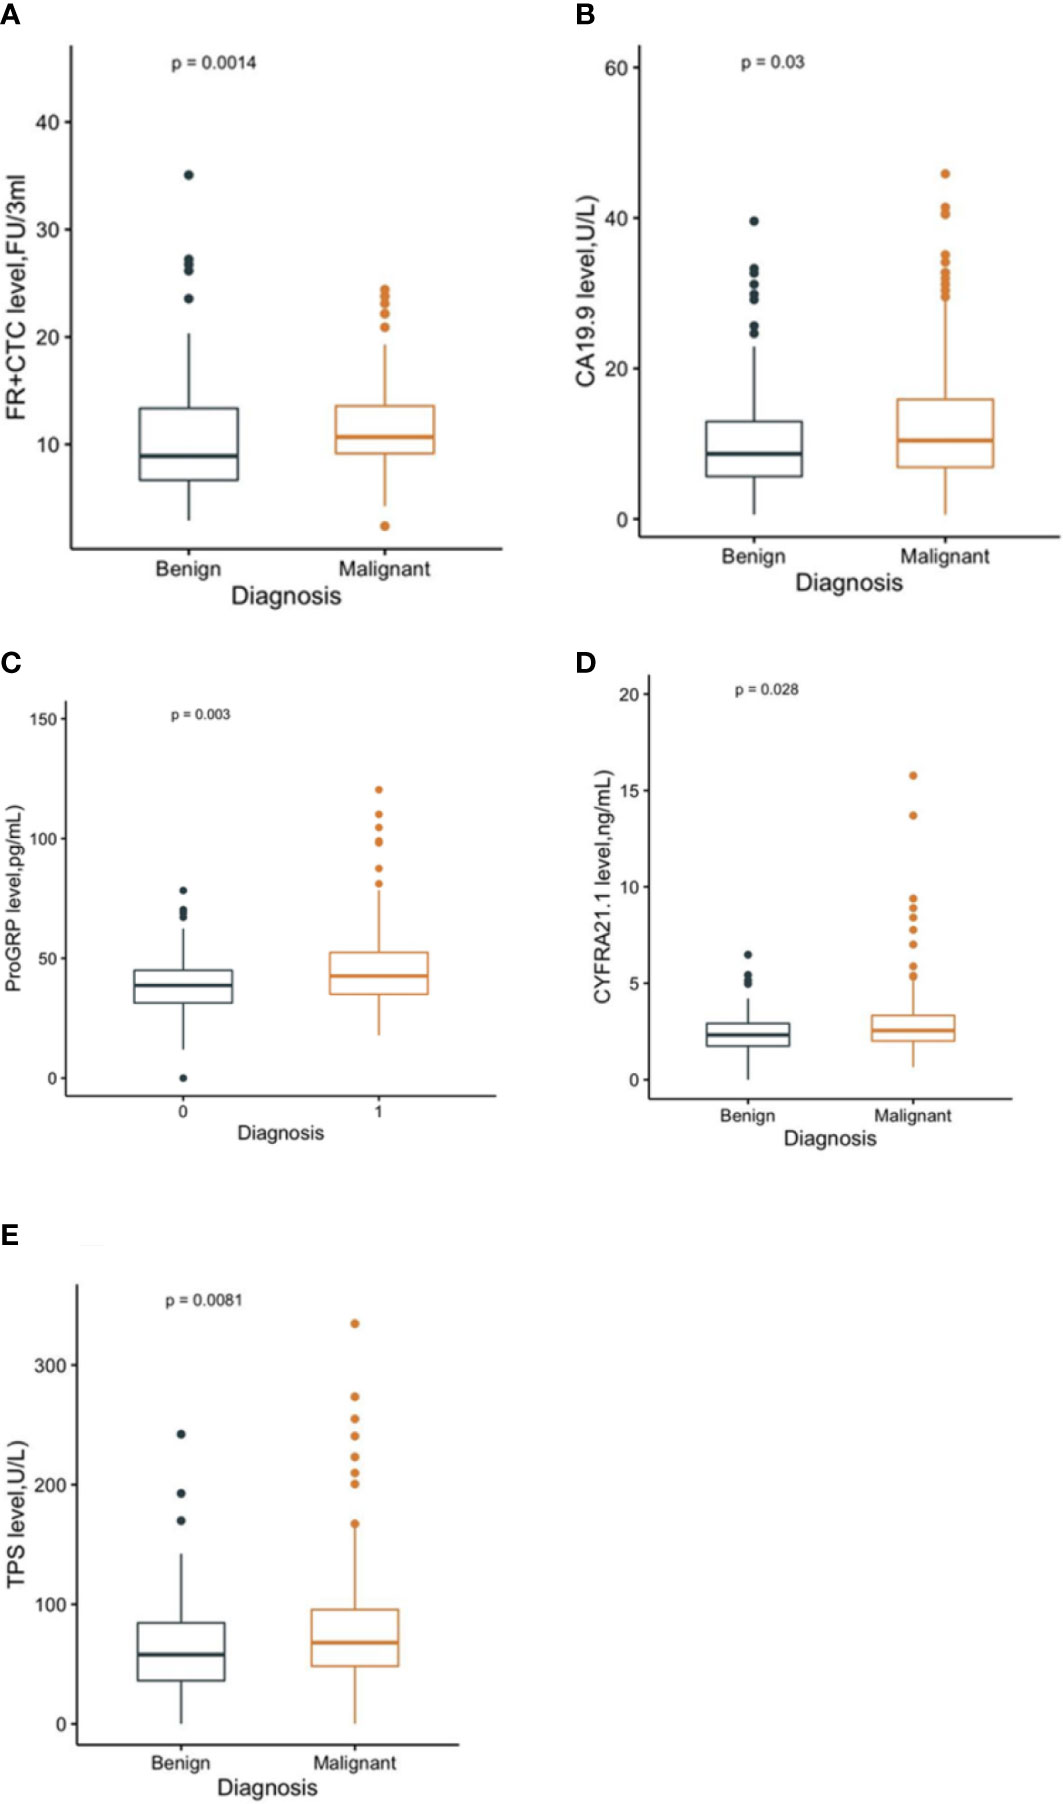
Figure 2 The level of FR+CTC (A), CA19.9 (B), ProGRP (C), CYFRA21.1 (D), and TPS (E) in malignant and benign groups, respectively.
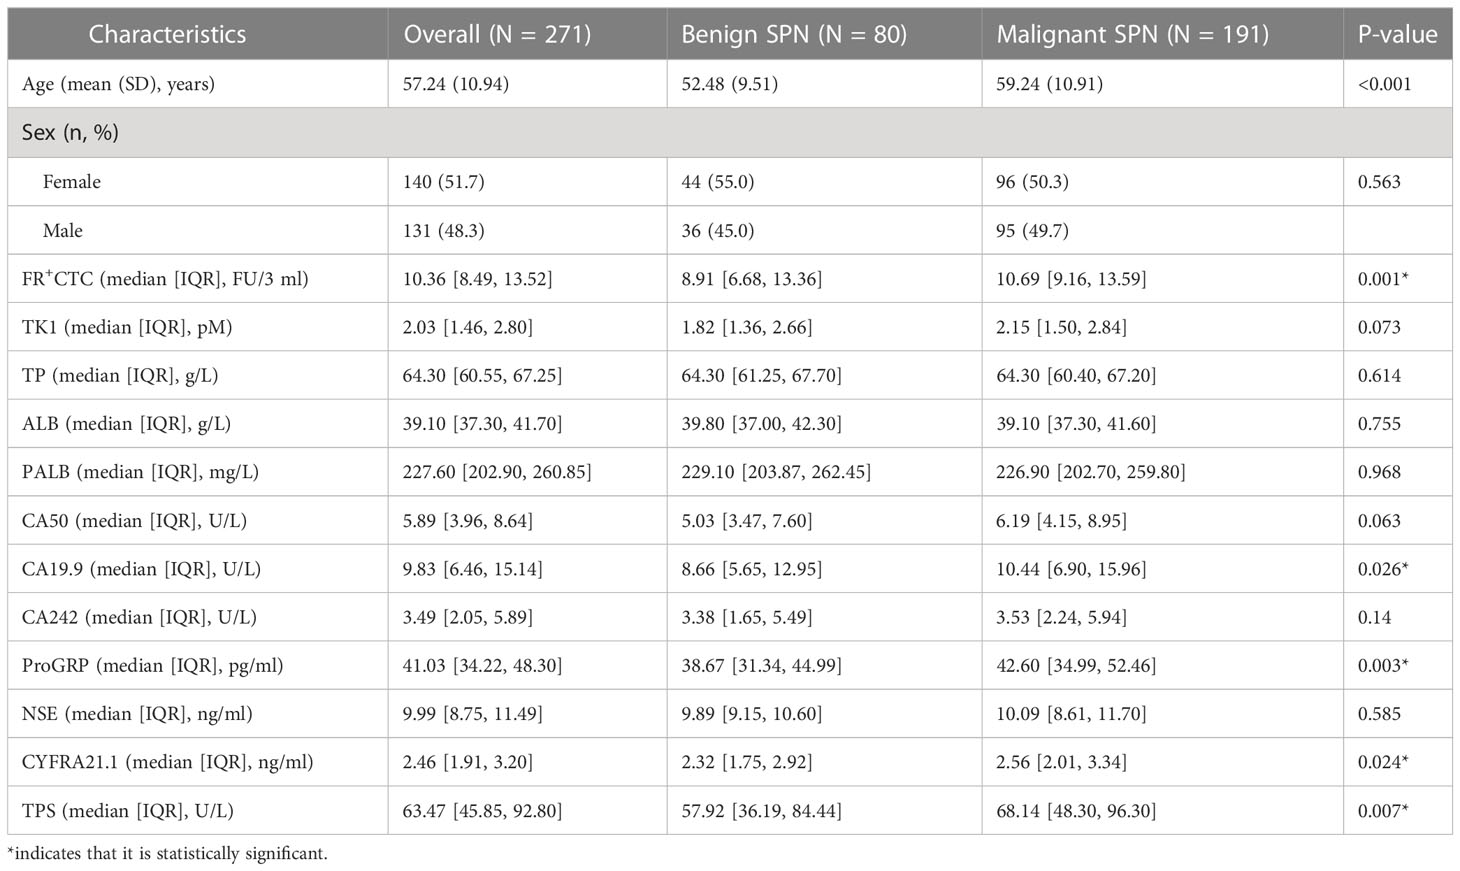
Table 1 Baseline characteristics of benign and malignant SPNs.
In the univariate analysis, sex, TP, ALB, and PALB were not significantly correlated with malignant SPNs (all P >0.05, Table 2). Age, FR+CTC, TK1, CA50, CA19.9, CA242, ProGRP, NSE, Cyfra21.1, and TPS showed statistical significance of correlation with malignant SPNs (all P <0.05, Table 2). The highest performing hematological biomarker is FR+CTC (odd ratio [OR], 3.44; 95% CI: 2.57–7.89; P <0.001) (Table 2). These factors, which showed significant results in the univariate analysis, were prepared for multivariate analysis. AIC was applied to variate selection, and age, FR+CTC, TK1, CA50, CA242, ProGRP, NSE, and TPS were included in the final multivariate prediction model. The formula of the prediction model was: (logit(p) = −3.09 + 0.99 ∗ Age + 1.83 ∗ CTC + 1.57 ∗ TK1 + 0.56 ∗ CA50 + 0.84 ∗ CA242 + 0.52 ∗ ProGRP + 0.72 ∗ NSE + 0.56 ∗ TPS). The multivariate analysis identified that age (OR, 2.69; 95% CI: 1.34–5.59; P = 0.006), FR+CTC (OR, 6.26; 95% CI: 3.09–13.37; P <0.001), TK1 (OR, 4.82; 95% CI: 2.40–10.27; P <0.001) and NSE (OR, 2.06; 95% CI: 1.07–4.06; P <0.001) are independent predictors (Table 2).
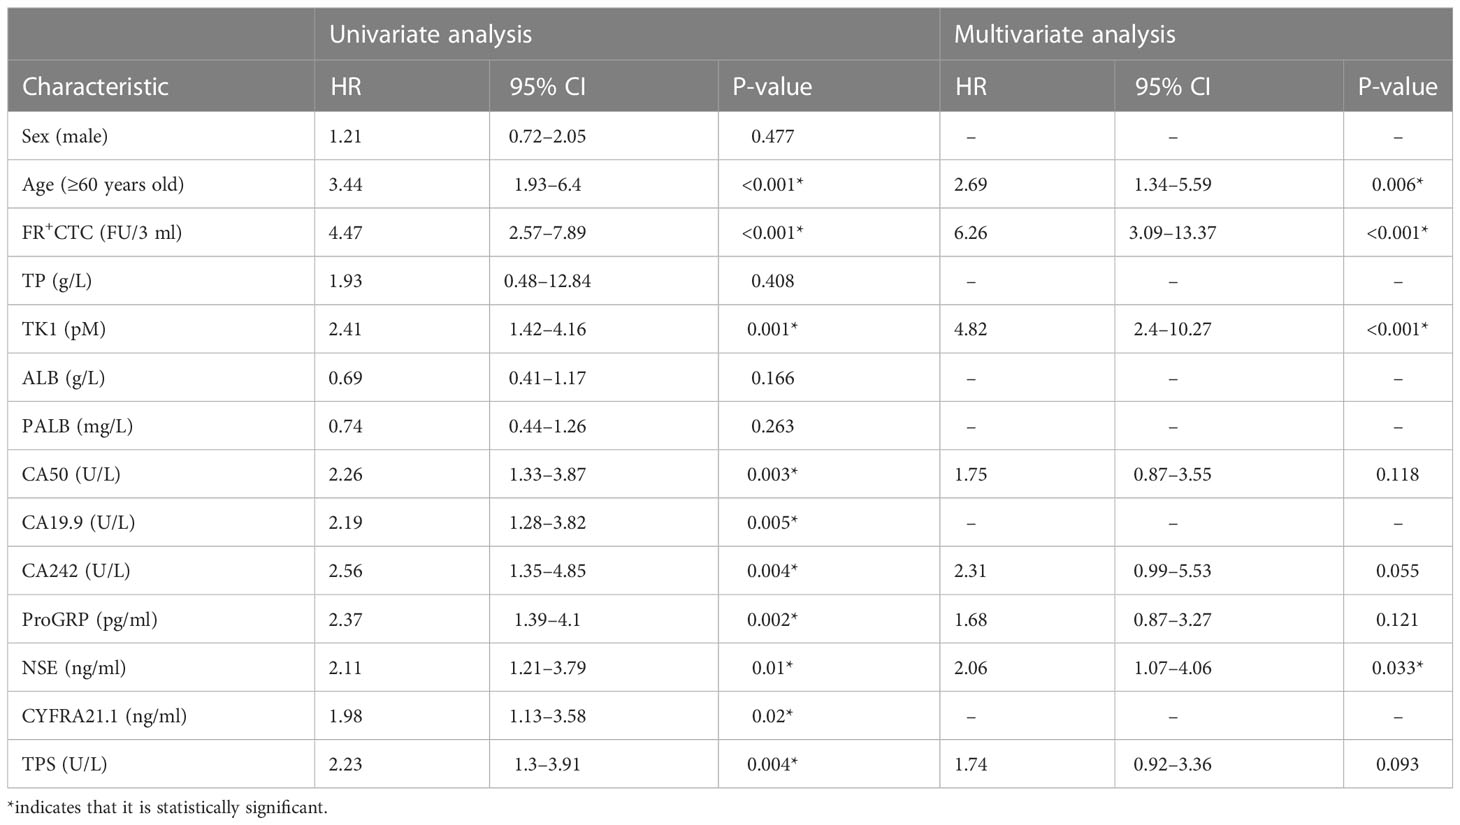
Table 2 Univariate and multivariate analysis of distinguishing malignant SNPs.
The ROC curve was used to further analyze the diagnostic value of pretreatment hematological biomarkers in distinguishing malignant SNPs (Figure 3). The optimal diagnostic cutoff values for FR+CTC, TK1, CA50, CA242, ProGRP, NSE, and TPS were 9.005 FU/3 ml, 1.965 pM, 5.24 U/L, 1.705 U/L, 41.085 pg/ml, 10.515 ng/ml, and 67.155 U/L, respectively. A single marker did not perform well in distinguishing between malignant and benign SNPs (all AUC <0.70) (Table 3). The multivariate prediction model, based on stepwise logistic regression and combined age, FR+CTC, TK1, CA50, CA242, ProGRP, NSE, and TPS, showed much stronger performance, with a sensitivity of 71.1% and specificity of 81.3%, and the AUC was 0.826 (95% CI: 0.768–0.884) (Table 3; Figure 3).
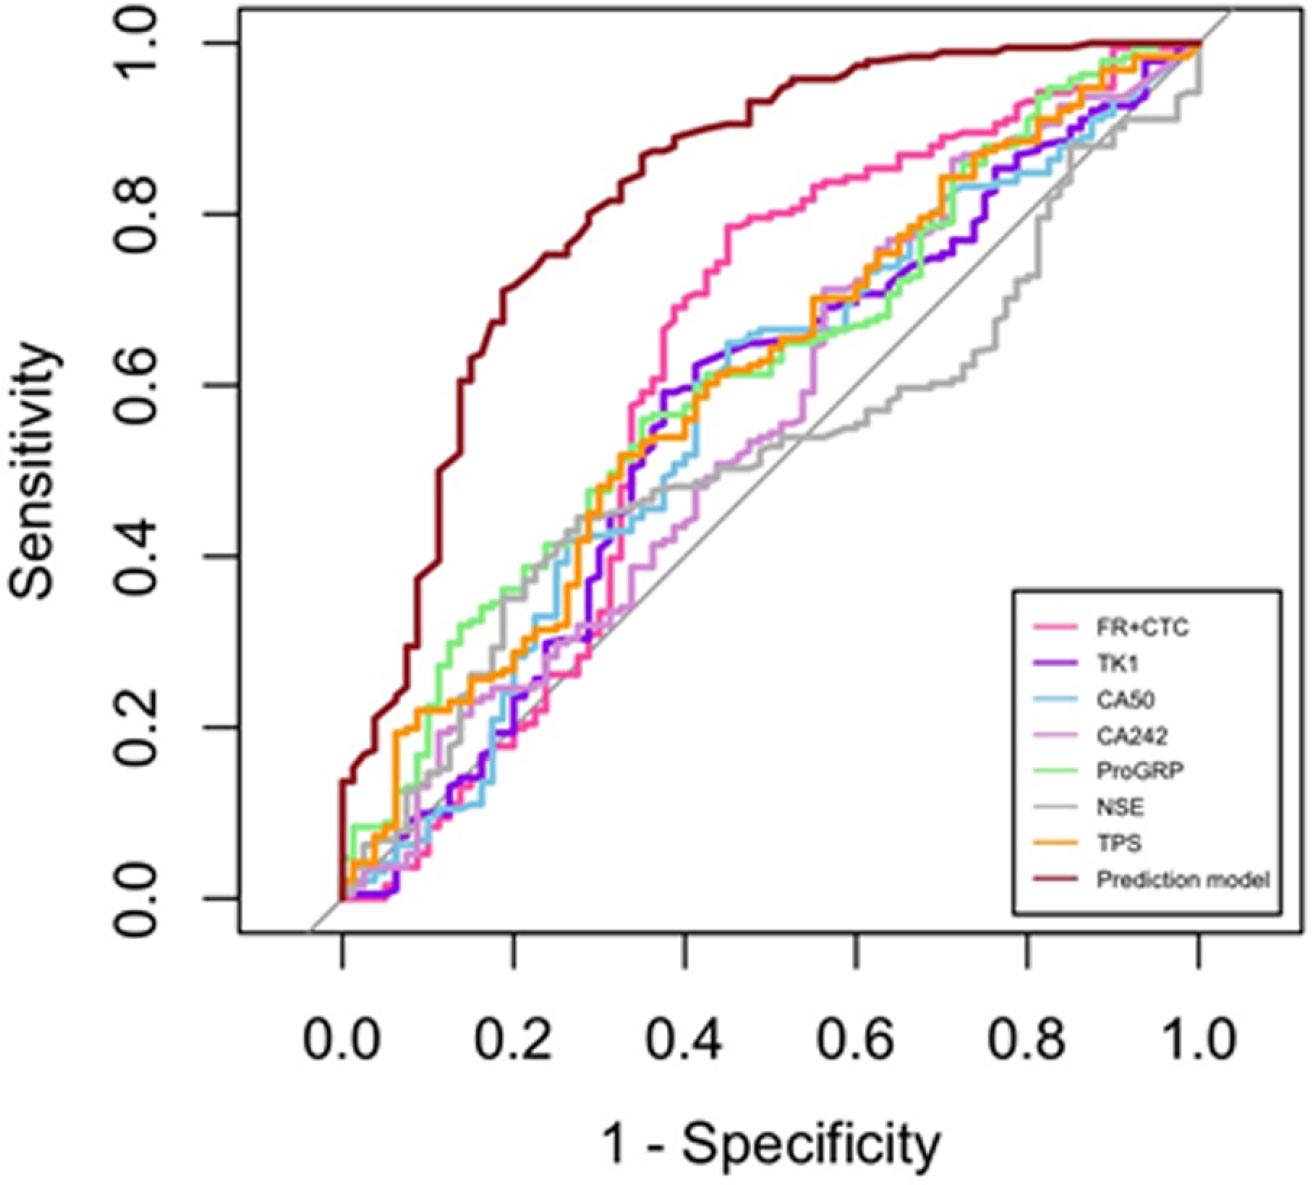
Figure 3 Receiver operating characteristic (ROC) curve-single marker and prediction model.
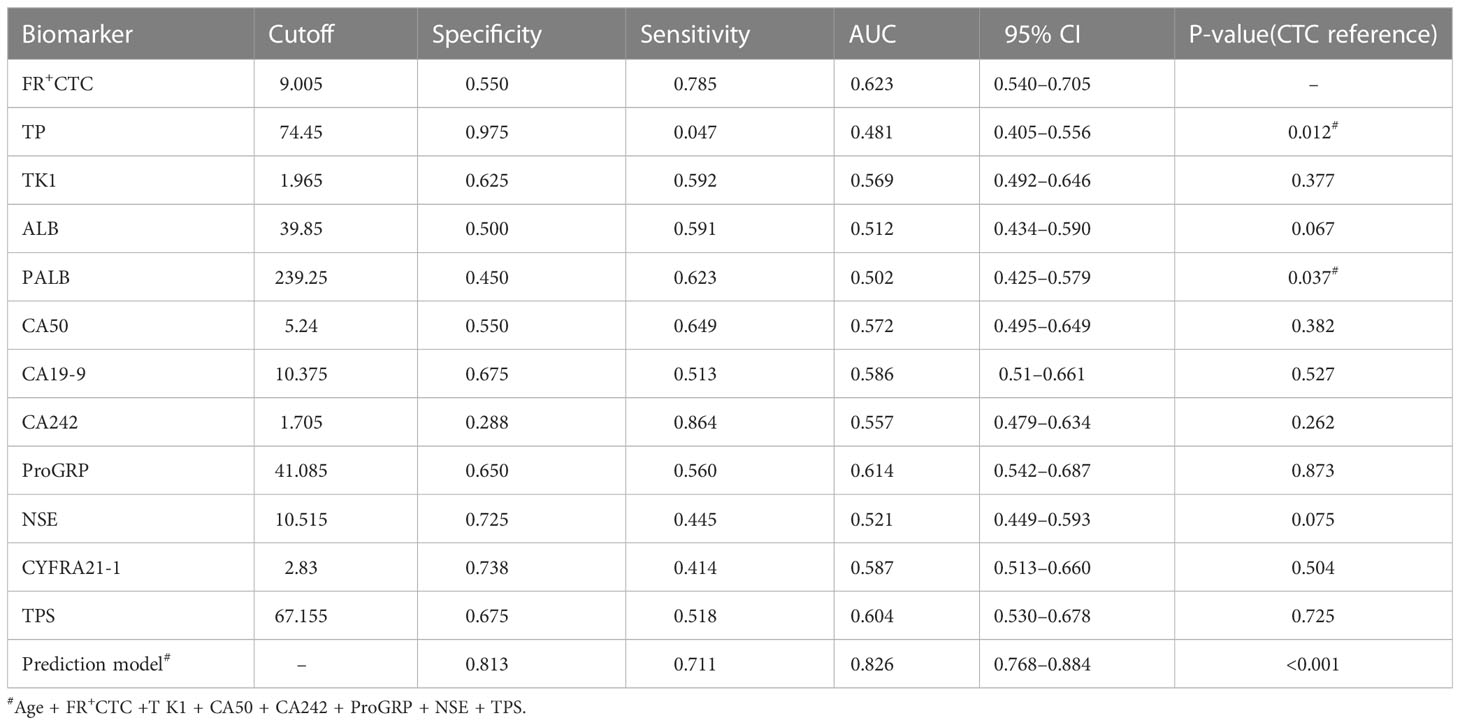
Table 3 The diagnosis values of hematological biomarkers.
The prediction model containing age, FR+CTC, TK1, CA50, CA242, ProGRP, NSE, and TPS was presented as a nomogram (Figure 4A). The Hosmer–Lemeshow test yielded significant goodness of fit (P = 0.04) (Figure 4B), and the C-index of the nomogram was 0.826 (Table 3).
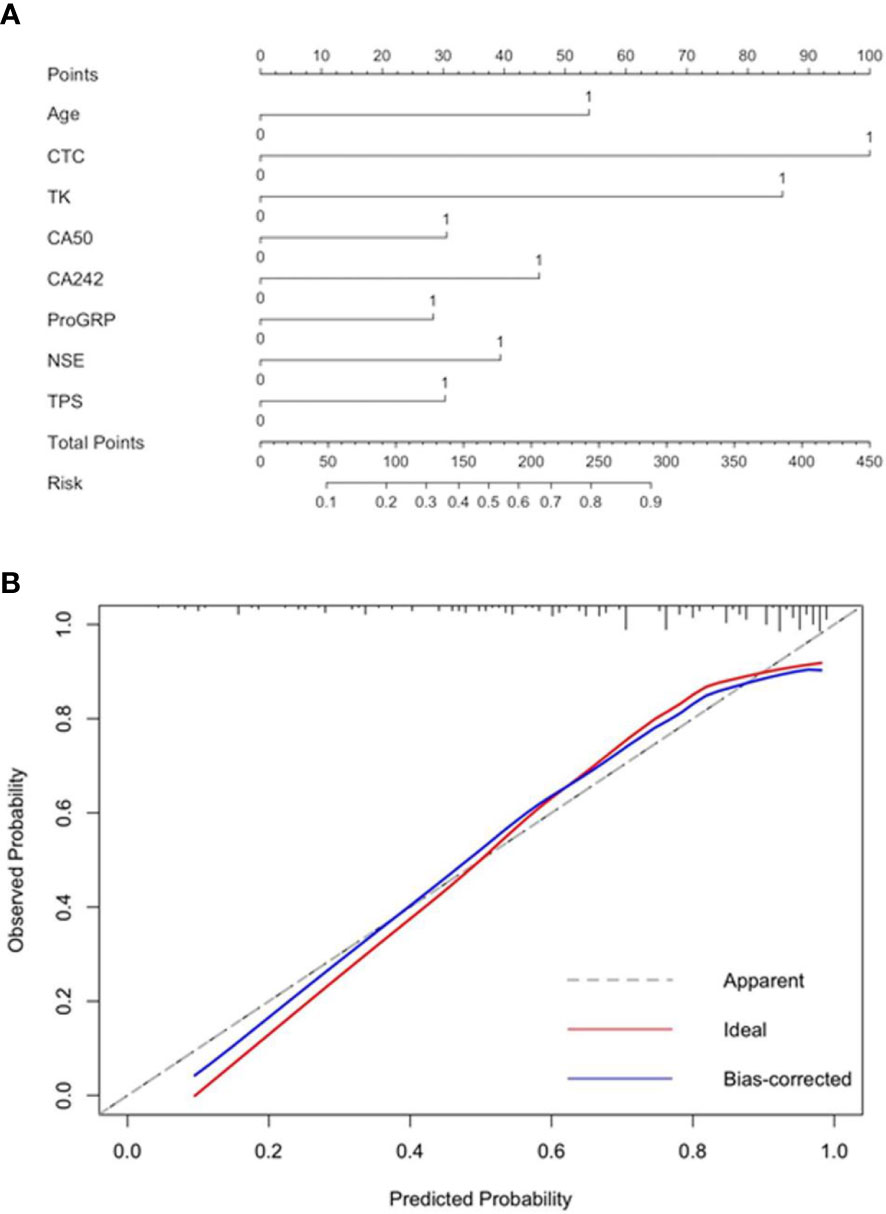
Figure 4 Nomogram (A) and the result of Hosmer–Lemeshow test for the model (B).
The popularization of computed tomography (CT) increases the detection rate of pulmonary nodules. However, at least 95% of all identified pulmonary nodules are benign (9). Currently, the differentiation between benign and malignant SNPs smaller than 3 cm is still a major clinical challenge. A study by Laura et al. on 18F-FDG-PET/CT showed good diagnostic performance in SPN, reporting a sensitivity and specificity of 85.6% and 85.7%, respectively (12). However, they excluded indeterminate SPN patients. Moreover, in many infectious and inflammatory disorders with active macrophages, especially granulomatous diseases, FDG-PET may produce false positive results (10%–25%) (26). A review published in JAMA reveals that most of the detected benign nodules are granulomas or intrapulmonary lymph nodes (9), impacting the accuracy of PET imaging results. To improve the diagnostic accuracy, we detected the hematologic biomarkers of these patients and found that a single biomarker was poor at predicting the benign and malignant SNPs. Univariate and multivariate analyses were used to establish the first liquid biopsy model to predict benign and malignant SNPs. The novel predicting liquid biopsy model combined age, FR+CTC, TK1, CA50, CA242, ProGRP, NSE, and TPS, with a sensitivity of 71.1% and a specificity of 81.3%. It has excellent predictive value. In addition, the nomogram was generated from the predicting liquid biopsy model, which is more convenient for daily use by clinicians.
In a previous study, FR+CTC displayed the highest AUC compared with NSE, CEA, CA125, Cyfra21-1, and SCC Ag and could satisfactorily discriminate patients with NSCLC from controls, even in early-stage NSCLC (20). The results of our study are consistent with the previous study; the AUC of FR+CTC was higher than that of NSE and Cyfra21-1. In the study by Wang et al., FR+CTC showed the highest diagnostic efficiency in the diagnosis of lung cancer when compared with CEA, CYFRA21-1, and NSE. Notably, the combination of FR+CTC, NSE, CEA, and CYFRA21-1 could significantly improve diagnostic efficacy in differentiating patients with lung cancer from those with benign lung disease (27). Xue et al. reported that FR+CTC showed the highest AUC value among CEA, NSE, CYFRA21−1, SCC, ProGRP, and Hsp90α in the whole cohort and for participants with nodule sizes of ≤3 cm, the AUC, sensitivity, and specificity were 0.8063 (95% CI: 0.6769–0.9356), 80.00%, and 75.00%, respectively, which were lower than in the whole cohort (23). While in our study, all participants had a nodule size of ≤3 cm, however, the AUC, sensitivity, and specificity were lower in the above study. This difference may be caused by the small sample size. Recently, Zhou et al. found that the AUC of FR+CTC was the highest compared with CEA, CYFRA21-1, NSE, and SCC. The sensitivity and specificity for differentiating malignant from benign nodules were 78.6%–82.7% and 68.8%–78.4%, respectively (28). In our study, the prediction model was not developed based on significant factors in the results of multivariate analysis, while it was based on significant variables selected by AIC. In this way, enough variables were included in the model to avoid errors caused by the inclusion of variables only based on multivariate regression statistical differences. Our study found that the prediction model combined age, FR+CTC, TK1, CA50, CA242, ProGRP, NSE, and TPS had the best performance. However, multivariate analysis revealed that only older, higher FR+CTC levels, higher TK1 levels, and higher NSE are significant independent risk factors for malignant SPNs. By contrast, CA50, CA242, ProGRP, and TPS have been ignored. Among them, ProGRP was proven to be a novel biomarker in lung cancer (23). CA50, CA242, and TPS were proven to be novel biomarkers in lung cancer patients, although with a relatively lower AUC value (<0.7). In the previous study, CA50 and CA242 showed poor diagnostic efficacy for lung cancer screening with low AUC values. However, when combined with the other carbohydrate antigen (CA) biomarkers (CA125, CA15-3, CA19-9, and CA724), the AUC value was up to 0.776. Moreover, when coupled with CYFR21, CEA, NSE, and SCC, the AUC value was up to 0.884 (29). TPS is a specific fragment of keratin 18, which belongs to type I intermediate filaments found in epithelia. The TPS level significantly differed between the control and NSCLC groups, but multivariate analyses showed it was not an independent prognostic factor for advanced NSCLC (30). In the metastatic lung adenocarcinoma group, the TPS level is higher than in the non-metastatic group. However, it cannot predict the metastatic status because of the low AUC value (31). TK1 is strongly associated with DNA synthesis and cell proliferation and has demonstrated high diagnostic value in NSCLC. The serum levels of TK1 in NSCLC patients were higher than those of healthy individuals, and the AUC value was 0.667 (32), which is a promising biomarker for lung cancer.
Some limitations must be considered in our study. Firstly, this is a retrospective single-center study. A multicenter cohort study is warranted. Secondly, the sample size is not large enough. Therefore, it cannot represent the situation of all populations. Finally, the application value of this novel model is limited, and it is only suitable for the diagnosis of small pulmonary nodules. We will initiate a study on its relationship with prognosis after surgery.
We established a preoperative prediction model with age and hematological indicators to improve the diagnostic workflow for small pulmonary nodules. In the meantime, we provide a nomogram that can be used for preoperative screening of early NSCLC patients and helps thoracic surgeons make a clinical decision.
The raw data supporting the conclusions of this article will be made available by the authors, without undue reservation.
The studies involving human participants were reviewed and approved by the Ethics Committee of Sichuan Cancer Hospital. The patients/participants provided their written informed consent to participate in this study.
Conception and design: QZ and QH. Administrative support: WH and LP. Provision of study materials or patients: DL, JZ, and YH. Collection and assembly of data: KS, AL, KXL, and KL. Data analysis and interpretation: QZ and WH. Manuscript writing: QZ, QH, and WH. All authors contributed to the article and approved the submitted version.
The authors declare that the research was conducted in the absence of any commercial or financial relationships that could be construed as a potential conflict of interest.
All claims expressed in this article are solely those of the authors and do not necessarily represent those of their affiliated organizations, or those of the publisher, the editors and the reviewers. Any product that may be evaluated in this article, or claim that may be made by its manufacturer, is not guaranteed or endorsed by the publisher.
1. Sim YT, Poon FW. Imaging of solitary pulmonary nodule-a clinical review. Quant Imaging Med Surg (2013) 3(6):316–26. doi: 10.3978/j.issn.2223-4292.2013.12.08
2. Stiles BM, Pua B, Altorki NK. Screening for lung cancer. Surg Oncol Clin N Am (2016) 25(3):469–79. doi: 10.1016/j.soc.2016.02.002
3. Gould MK, Donington J, Lynch WR, Mazzone PJ, Midthun DE, Naidich DP, et al. Evaluation of individuals with pulmonary nodules: when is it lung cancer? diagnosis and management of lung cancer, 3rd ed: American college of chest physicians evidence-based clinical practice guidelines. Chest. (2013) 143(5 Suppl):e93S–e120S. doi: 10.1378/chest.12-2351
4. Yang Y, Wang WW, Ren Y, Jin XQ, Zhu QD, Peng CT, et al. Computerized texture analysis predicts histological invasiveness within lung adenocarcinoma manifesting as pure ground-glass nodules. Acta Radiol (2019) 60(10):1258–64. doi: 10.1177/0284185119826536
5. Lee G, Park H, Sohn I, Lee SH, Song SH, Kim H, et al. Comprehensive computed tomography radiomics analysis of lung adenocarcinoma for prognostication. Oncologist. (2018) 23(7):806–13. doi: 10.1634/theoncologist.2017-0538
6. Shen Y, Xu F, Zhu W, Hu H, Chen T, Li Q. Multiclassifier fusion based on radiomics features for the prediction of benign and malignant primary pulmonary solid nodules. Ann Transl Med (2020) 8(5):171. doi: 10.21037/atm.2020.01.135
7. Zhang Y, Cheng J, Hua X, Yu M, Xu C, Zhang F, et al. Can spectral CT imaging improve the differentiation between malignant and benign solitary pulmonary nodules? PloS One (2016) 11(2):e0147537. doi: 10.1371/journal.pone.0147537
8. MacMahon H, Naidich DP, Goo JM, Lee KS, Leung ANC, Mayo JR, et al. Guidelines for management of incidental pulmonary nodules detected on CT images: from the fleischner society 2017. Radiology. (2017) 284(1):228–43. doi: 10.1148/radiol.2017161659
9. Mazzone PJ, Lam L. Evaluating the patient with a pulmonary nodule: a review. JAMA. (2022) 327(3):264–73. doi: 10.1001/jama.2021.24287
10. Jia Y, Gong W, Zhang Z, Tu G, Li J, Xiong F, et al. Comparing the diagnostic value of (18)F-FDG-PET/CT versus CT for differentiating benign and malignant solitary pulmonary nodules: a meta-analysis. J Thorac Dis (2019) 11(5):2082–98. doi: 10.21037/jtd.2019.05.21
11. Ruilong Z, Daohai X, Li G, Xiaohong W, Chunjie W, Lei T. Diagnostic value of 18F-FDG-PET/CT for the evaluation of solitary pulmonary nodules: a systematic review and meta-analysis. Nucl Med Commun (2017) 38(1):67–75. doi: 10.1097/MNM.0000000000000605
12. Evangelista L, Cuocolo A, Pace L, Mansi L, Del Vecchio S, Miletto P, et al. Performance of FDG-PET/CT in solitary pulmonary nodule based on pre-test likelihood of malignancy: results from the ITALIAN retrospective multicenter trial. Eur J Nucl Med Mol Imaging (2018) 45(11):1898–907. doi: 10.1007/s00259-018-4016-1
13. Jiang ZF, Wang M, Xu JL. Thymidine kinase 1 combined with CEA, CYFRA21-1 and NSE improved its diagnostic value for lung cancer. Life Sci (2018) 194:1–6. doi: 10.1016/j.lfs.2017.12.020
14. Stieber P, Hatz R, Holdenrieder S, Molina R, Nap M, von Pawel J, et al. National academy of clinical biochemistry guidelines for the use of tumor markers in lung cancer. In: NACB: practice guidelines and recommendations for use of tumor markers in the clinic lung cancer (Section 3P) (2006). NACB, and the NACB office at AACC, 2101 L Street, N.W., Suite 202, Washington, DC 20037-1526.
15. Molina R, Marrades RM, Auge JM, Escudero JM, Vinolas N, Reguart N, et al. Assessment of a combined panel of six serum tumor markers for lung cancer. Am J Respir Crit Care Med (2016) 193(4):427–37. doi: 10.1164/rccm.201404-0603OC
16. Xu L, Su Z, Xie B. Diagnostic value of conventional tumor markers in young patients with pulmonary nodules. J Clin Lab Anal (2021) 23:e23912. doi: 10.1002/jcla.23912
17. Iwakiri S, Sonobe M, Nagai S, Hirata T, Wada H, Miyahara R. Expression status of folate receptor alpha is significantly correlated with prognosis in non-small-cell lung cancers. Ann Surg Oncol (2008) 15(3):889–99. doi: 10.1245/s10434-007-9755-3
18. Shia J, Klimstra DS, Nitzkorski JR, Low PS, Gonen M, Landmann R, et al. Immunohistochemical expression of folate receptor α in colorectal carcinoma: patterns and biological significance. Hum pathology (2008) 39(4):498–505. doi: 10.1016/j.humpath.2007.09.013
19. Basal E, Eghbali-Fatourechi GZ, Kalli KR, Hartmann LC, Goodman KM, Goode EL, et al. Functional folate receptor alpha is elevated in the blood of ovarian cancer patients. PloS One (2009) 4(7):e6292. doi: 10.1371/journal.pone.0006292
20. Yu Y, Chen Z, Dong J, Wei P, Hu R, Zhou C, et al. Folate receptor-positive circulating tumor cells as a novel diagnostic biomarker in non-small cell lung cancer. Trans Oncol (2013) 6(6):697–702. doi: 10.1593/tlo.13535
21. Lou J, Ben S, Yang G, Liang X, Wang X, Ni S, et al. Quantification of rare circulating tumor cells in non-small cell lung cancer by ligand-targeted PCR. PloS One (2013) 8(12). doi: 10.1371/journal.pone.0080458
22. Chen X, Zhou F, Li X, Yang G, Zhang L, Ren S, et al. Folate receptor-positive circulating tumor cell detected by LT-PCR-Based method as a diagnostic biomarker for non-Small-Cell lung cancer. J Thorac Oncol (2015) 10(8):1163–71. doi: 10.1097/JTO.0000000000000606
23. Xue Y, Cong W, Xie S, Shu J, Feng G, Gao H. Folate-receptor-positive circulating tumor cells as an efficacious biomarker for the diagnosis of small pulmonary nodules. J Cancer Res Ther (2018) 14(7):1620–6. doi: 10.4103/jcrt.JCRT_905_17
24. Jiang T, Zhao J, Zhao C, Li X, Shen J, Zhou J, et al. Dynamic monitoring and predictive value of circulating tumor cells in EGFR-mutated advanced non-Small-Cell lung cancer patients treated with first-line EGFR tyrosine kinase inhibitors. Clin Lung Cancer (2019 ) 20:124–133. doi: 10.1016/j.cllc.2018.11.014
25. Akaike H. A new look at the statistical model identification. IEEE Trans Automat Contr (1974) 19(6):716–23. doi: 10.1109/TAC.1974.1100705
26. Yilmaz F, Tastekin G. Sensitivity of (18)F-FDG PET in evaluation of solitary pulmonary nodules. Int J Clin Exp Med (2015) 8(1):45–51.
27. Wang L, Wu C, Qiao L, Yu W, Guo Q, Zhao M, et al. Clinical significance of folate receptor-positive circulating tumor cells detected by ligand-targeted polymerase chain reaction in lung cancer. J Canc (2017) 8(1):104–10. doi: 10.7150/jca.16856
28. Zhou Q, Geng Q, Wang L, Huang J, Liao M, Li Y, et al. Value of folate receptor-positive circulating tumour cells in the clinical management of indeterminate lung nodules: a non-invasive biomarker for predicting malignancy and tumour invasiveness. EBioMedicine. (2019) 41:236–43. doi: 10.1016/j.ebiom.2019.02.028
29. Wen Z, Huang Y, Ling Z, Chen J, Wei X, Su R, et al. Lack of efficacy of combined carbohydrate antigen markers for lung cancer diagnosis. Dis Markers (2020) 2020:4716793. doi: 10.1155/2020/4716793
30. Jiang AG, Chen HL, Lu HY. The relationship between Glasgow prognostic score and serum tumor markers in patients with advanced non-small cell lung cancer. BMC canc (2015) 15:386. doi: 10.1186/s12885-015-1403-x
31. Ren X, Zhang Y, Lyu Y, Jin B, Guo H, Wu J, et al. Lactate dehydrogenase and serum tumor markers for predicting metastatic status in geriatric patients with lung adenocarcinoma. Cancer Biomarkers section A Dis markers (2019) 26(2):139–50. doi: 10.3233/cbm-190201
Keywords: pulmonary nodules, diagnosis, biomarkers, hematological index model, nomogram
Citation: Zhou Q, He Q, Peng L, Huang Y, Li K, Liu K, Li D, Zhao J, Sun K, Li A and He W (2023) Preoperative diagnosis of solitary pulmonary nodules with a novel hematological index model based on circulating tumor cells. Front. Oncol. 13:1150539. doi: 10.3389/fonc.2023.1150539
Received: 24 January 2023; Accepted: 19 April 2023;
Published: 03 May 2023.
Edited by:
Yiyan Liu, University of Louisville, United StatesReviewed by:
Hongdian Zhang, Tianjin Medical University Cancer Institute and Hospital, ChinaCopyright © 2023 Zhou, He, Peng, Huang, Li, Liu, Li, Zhao, Sun, Li and He. This is an open-access article distributed under the terms of the Creative Commons Attribution License (CC BY). The use, distribution or reproduction in other forums is permitted, provided the original author(s) and the copyright owner(s) are credited and that the original publication in this journal is cited, in accordance with accepted academic practice. No use, distribution or reproduction is permitted which does not comply with these terms.
*Correspondence: Wenwu He, d2Vud3VfaGVAMTI2LmNvbQ==
†These authors have contributed equally to this work
Disclaimer: All claims expressed in this article are solely those of the authors and do not necessarily represent those of their affiliated organizations, or those of the publisher, the editors and the reviewers. Any product that may be evaluated in this article or claim that may be made by its manufacturer is not guaranteed or endorsed by the publisher.
Research integrity at Frontiers
Learn more about the work of our research integrity team to safeguard the quality of each article we publish.