Corrigendum: Positive Reciprocal Feedback of LncRNA ZEB1-AS1 and HIF-1α Contributes to Hypoxia–Promoted Tumorigenesis and Metastasis of Pancreatic Cancer
 Yan Jin
 Zhengming Zhang1†
- 1Department of Gastrointestinal Surgery, The First Affiliated Yijishan Hospital of Wannan Medical College, Wuhu, China
- 2Department of Gastroenterology, Union Hospital, Tongji Medical College, Huazhong University of Science and Technology, Wuhan, China
- 3Department of Emergency Surgery, Union Hospital, Tongji Medical College, Huazhong University of Science and Technology, Wuhan, China
- 4Department of Pathology, The First Affiliated Yijishan Hospital of Wannan Medical College, Wuhu, China
Background: Many studies have reported the roles of the extracellular hypoxia microenvironment in the tumorigenesis and metastasis of multiple cancers. However, long noncoding RNAs (lncRNAs) that induce cancer oncogenicity and metastasis of pancreatic cancer (PC) under hypoxia conditions remain unclear.
Methods: In PC cells, the expression levels of lncRNAs in different conditions (normoxia or hypoxia) were compared through RNA sequencing (RNA-seq). The effects of the zinc finger E-box-binding homeobox 1 (ZEB1-AS1) antisense lncRNA on PC cells cultured in normoxia/hypoxia medium were measured through gain and loss-of-function experiments. Fluorescence in situ hybridization and luciferase reporter assays in addition to in vivo studies were utilized to explore the adaptive mechanisms of ZEB1-AS1 in the hypoxia-promoted proliferation, migration, and invasion ability of PC cells. Moreover, the level of ZEB1-AS1 and its associated targets or pathways were investigated in both PC and pancreatic normal tissues.
Results: RNA-seq revealed that ZEB1-AS1 was significantly upregulated in PC cells under hypoxia conditions. The ZEB1-AS1 expression level was closely associated with poor prognosis of PC patients. Knockdown of ZEB1-AS1 suppressed the proliferation, migration, and invasion of PC cells in vitro as well as PC xenograft tumor growth in vivo. In PC cells, RNAi-mediated reduction of ZEB1-AS1 inhibited zinc finger E-box-binding homeobox 1 (ZEB1), while ZEB1-AS1 overexpression rescued ZEB1 expression, indicating that ZEB1-AS1 promotes ZEB1 expression. Moreover, hypoxia-inducible factor-1α (HIF-1α)induced the expression of ZEB1-AS1 by binding to the ZEB1-AS1 promoter, which contains a putative hypoxia response element (HRE). Mechanistically, ZEB1-AS1 scaffolded the interaction among HIF-1α, ZEB1, and histone deacetylase 1 (HDAC1), leading to deacetylation-mediated stabilization of HIF-1α. We further revealed that ZEB1 induced the deacetylase capacity of HDAC1 to suppress the acetylation or degradation of HIF-1α, improving HIF-1α assembly. Thus, hypoxia-induced ZEB1-AS1 facilitated ZEB1 transcription and the stability of HIF-1α, which promoted the metastasis of PC cells. Clinically, dysregulated ZEB1 and HIF-1α expression was significantly correlated with histological grade, lymphatic metastasis, and distant metastasis in PC patients.
Conclusions: Our results emphasized that the positive reciprocal loop of HIF-1α/ZEB1-AS1/ZEB1/HDAC1 contributes to hypoxia-promoted oncogenicity and PC metastasis, indicating that it might be a novel therapeutic target for PC.
Introduction
Pancreatic cancer (PC) is often diagnosed at advanced stages of the disease when the treatment options are limited and consequently lead to the poor overall patient survival rates (1). PC is one of the most lethal types of cancer with increasing incidence and mortality rates worldwide (2, 3). Early invasion and metastasis are the main factors that challenge the treatment of these patients (4). Therefore, the potential molecular mechanism of the oncogenicity and metastasis ability of PC needs to be discovered and elucidated.
Long noncoding RNAs (lncRNAs) are noncoding RNAs that are more than 200 nucleotides in length, and they may be pivotal regulators of oncogenesis, indicating their potential in therapeutic strategies for improving the clinical outcomes of PC patients (5, 6). Accumulating evidence has suggested the role of lncRNAs in human disease etiopathogenesis, including cell differentiation, cell cycle progression, epigenetic regulation and malignant neoplasms. Takahashi et al. revealed that lncRNA-HULC, which is suppressed by microRNA-133b, accelerates PC cell invasion, migration and EMT (7). Liu et al. showed that accumulation of lncRNA-CF129 inhibits pancreatic cell oncogenicity via MKRN1-induced ubiquitin-dependent p53 degradation following transcriptional suppression of FOXC2 (8). Other studies have reported that lncRNA GLS-AS and lncRNA MTSS1-AS influence the modulation of PC progression (9, 10). Our previous findings demonstrated the crucial role of lncRNA-NUTF2P3 in inducing KRAS levels by participating in miR-3923 knockdown in PC (11). In addition, we also reported that lncRNA-MTA2TR enhances PC by depriving acetylation and aggregation of hypoxia-inducible factor-1α (HIF-1α) (12). These studies establish that lncRNAs play notable roles in mediating PC initiation and progression. Nevertheless, the roles of lncRNAs in PC need further investigation to explore the underlying mechanism and enrich the therapeutic targets for PC patients.
Recent evidence had received significant attention that tumor microenvironment (TME) plays a crucial role in the malignant biological behavior and progression of tumor cells (13). TME harbors cancer cells and other molecules that contribute to tumor cell growth and proliferation (14). Because of dense desmoplasia and extensive aberrant blood supply, hypoxia micrornvironment is a characteristic feature of PC (15). As a well-known hallmark of tumors, extracellular hypoxia facilitates epithelial-mesenchymal transition (EMT) via HIF-1α in a variety of tumors including PC (16). Surendra et al. suggested that MUC1-regulated HIF-1α stabilization mediates glucose metabolism under hypoxia microenvironment in PC (17). Emerging evidence indicated that hypoxia-induced HIF-1α stabilization and assessment contributes to progression and metastasis of pancreatic cancer (18). Moreover, our previous investigation indicated that miR-646 participated in the hypoxia-induced metastasis of PC by directly regulating the expression of MIIP, which regulates tumor progression and EMT (19). Although preliminary studies on the hypoxia-induced development of PC were performed, further studies are significantly needed to focus more on novel therapies targeting the tumor hypoxia environment of PC.
Many studies have suggested that lncRNAs may be affected by hypoxia medium in various tumors. In colorectal carcinoma, hypoxia-induced Lnc-LUCAT1 accelerates the LUCAT1/PTBP1 interaction and subsequently leads to poor prognosis and worse efficiency of clinical chemotherapy (20). Li et al. showed that lncRNA N O R A D is significantly upregulated in hypoxia and regulate the expression of the small GTP binding protein RhoA and EMT in PC (21). Considering that the hypoxia microenvironment is also a distinctive extracellular characteristic of PC cells, we attempted to investigate whether lncRNAs are induced by the hypoxia microenvironment. Our previous study suggested that lncRNA-NUTF2P3-001 is a potent tumor promoter, which is upregulated by HIF-1α under hypoxia microenvironment in PC (11). Nevertheless, precise regulatory mechanisms of lncRNAs are still not totally explored.
Histone deacetylases (HDACs) are transcriptional regulatory proteins that regulate transcription factors by drawing off acetyl groups from histones or served as posttranslational modifications (PTMs) which determine protein activity and stability (22, 23). Research verified that HIF-1α can recruit HDACs and then transcriptionally regulated target gene expression (24, 25). Previously, we revealed that MIIP induced acetylation of HIF-1α and further promotes HIF-1α degradation by suppressing the deacetylase ability of HDAC6 (19). However, whether and how HDACs involved in HIF-1α activation during hypoxia and influenced tumor progression in PC remain unclear.
The understanding of the molecular mechanism in PC progression has greatly improved in recent decades. Zinc finger E-box-binding homeobox 1 (ZEB1) plays a pivotal role in cancer progression and EMT process, including in PC progression (26, 27). In addition, expression of ZEB1 is induced via multifarious signaling pathways, including β-catenin, miRNA, lncRNAs and other factors in tumor cells (28–30).
Here, we addressed whether hypoxia-induced HIF-1α directly regulates ZEB1 expression during hypoxia in PC progression. It was also suspected that ZEB1 is essential to HIF-1α protein activation and potential recruitment and interaction of HDACs. In the present study, we found an upregulated lncRNA-ZEB1-AS1 through microarray analysis for further investigation, which is approximate to ZEB1. More studies were further adopted to investigate reciprocal feedback on lncRNA-ZEB1-AS1 and HIF-1α in PC oncogenic progression.
Materials and Methods
PC Patients and PC Tissue Samples
Tissue samples in this study were all gained from patients experiencing operative treatments in the First Affiliated Yijishan Hospital of Wannan Medical College (Wuhu, Anhui province, China), from May 2017 to July 2021. Our research group randomly selected 119 both PC and paired normal peritumoral (NP) tissue samples from patients without preoperative chemotherapy or radiotherapy. Clinicopathological data of patients collected in this study are all shown in Table 1. Operation application on those patients included pancreatectomy as well as choledochojejunostomy and gastroenterostomy, according to the criteria of the National Comprehensive Cancer Network (NCCN 2019) guideline for PC (31). Histopathology from the Department of Pathology was applied to finalize the diagnosis of PC. The samples were gathered from the PC tissues by resection or palliative surgery. A tissue biopsy gun (MG15-22, Tempe, AZ, USA) was also used to assemble PC tissues for unresectable PC patients. Next, these samples were all embedded in paraffin or stored by liquid nitrogen cryotherapy. All protocols were accepted in advance by the ethics committee of our hospital.
TABLE 1
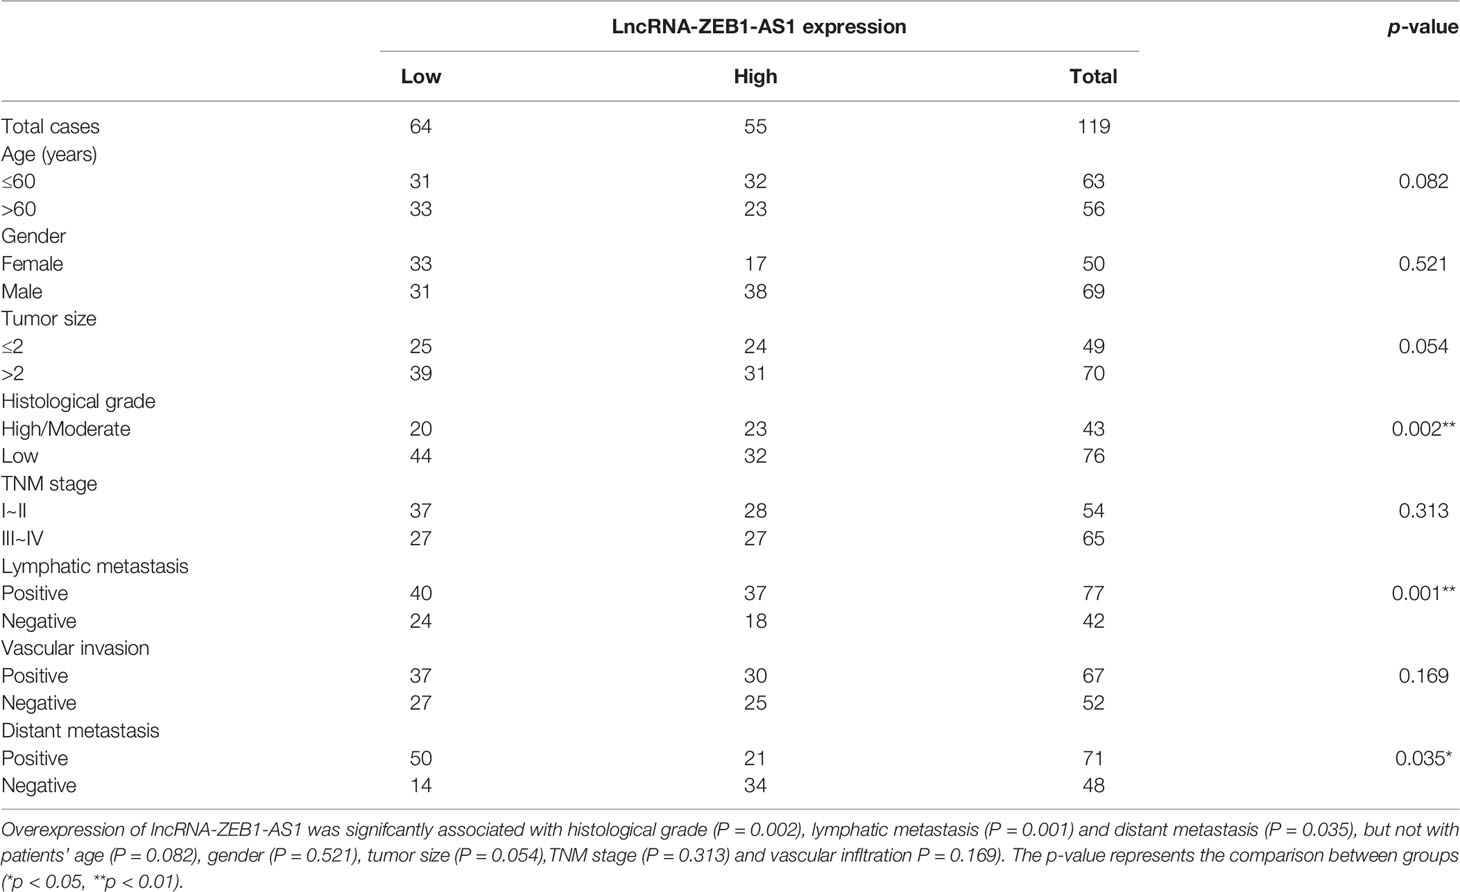
Table 1 Clinicopathological correlations of lncRNA-ZEB1-AS1 expression in pancreatic cancer.
Cell Culture
The PC cell lines containing PANC-1, BXPC-3, AsPC-1, SW1990, and MIAPaCa-2 cell lines were all acquired from the American Type Culture Collection (ATCC, Rockville, MD, USA), while human pancreatic duct epithelial (HPDE) cells were obtained from China Beijing Be-Na Culture Collection (BNCC, Beijing, China). PC cells were authenticated and identified by DNA fingerprinting in recent 6 months, and these cell lines were passaged for less than 6 months after resuscitation. Next, we cultivated these cell lines in HyClone RPMI-1640 medium matched up with 10% characterized fetal bovine serum and penicillin (100 U/ml)–streptomycin (100 mg/ml) combination in a steady incubator of unflagging 37°C. Hypoxia simulation models were designed as our previous study (11, 12, 19), which contain two protocols: (1) hypoxia induced by fixed concentration (100 µM) of CoCl2 solution and (2) hypoxia induced in modular incubator chamber. The specific protocols were stated thoroughly (32).
Transfection
Human short interfering RNAs (RNAi) for HIF-1α (siHIF-1α), ZEB1-AS1 (siZEB1-AS1), ZEB1 (siZEB1), histone deacetylase 1 (HDAC1) (siHDAC1), and negative controls (siNC) were obtained from Ribo Biological Company (Guangzhou, China). The plasmids including HIF-1α, ZEB1-AS1, ZEB1, and HDAC1 and the corresponding NC plasmid were synthesized and purchased from GeneChem Company (Shanghai, China). Based on provided instructions, lipofectamine 2000 (Invitrogen, USA) were utilized for transfections. Lentivirus vector containing ZEB1-AS1-siRNA (LV-siZEB1-AS1) and matched NC (LV-siNC) were gathered from China GeneChem Co. as well. Protein and total RNA were extracted at 48 h posttransfection after BXPC-3/PANC-1 cells were incubated in a solution with polybrene and lentivirus. Total sequences of siRNAs are exhibited on Supplementary Table S1.
qRT-PCR
Total RNAs were extracted from samples or cells by means of RNAiso Plus via official protocols (TaKaRa, Dalian, China). All mRNAs and lncRNAs were reverse transcribed through the protocol of the PrimeScript®RT Master Mix Perfect Real Time (TaKaRa, Dalian, China) and One Step PrimeScript® miRNA cDNA Synthesis Kit (Perfect Real Time) (TaKaRa, Dalian, China), following qRT-PCR analysis with the SYBR Premix Ex Taq II (TaKaRa, Dalian, China) as the official protocol. Expression levels of lncRNA and mRNA were measured via algorithm of 2−△△CT. This research applied GAPDH to standardize the level of lncRNA and mRNA expression. All qRT-PCR tests were independently tested three times. Total primers are exhibited in Supplementary Table S2.
RNA Stability Assay
Pancreatic cancer cells were treated with RNA polymerase II inhibitor α-amanitin (50 μM, Sigma-Aldrich, St. Louis,MO, USA) RNAs to block new synthesis. We then collected cells at different time points (0, 6, 12, 18, and 24 h), and total RNA were extracted by using Trizol reagent (TaKaRa, Dalian, China). The levels of RNA were recorded by qRT-PCR and normalized to 18S rRNA, the percentage of the remaining RNA to test RNA degradation were measured relative to time 0.
MTT Assay for Cell Proliferation
A proven technique of MTT assay was employed to measure the proliferation ability of PC cells. Cells were cultivated in 96-well plate (2,000/well) containing eight vices well corresponding with each sample. After cells were stably planted at 37°C, the proliferation of cells was observed and recorded from the next 1 to 5 days. For detecting the ability of proliferation of PC cells, we cultured cells by adding 20 μl MTT (5 mg/ml) to each well for 4 h. After that, we replaced the mixture with 150 μl DMSO (Sigma, USA). Following complete dissolution of the crystal in each well, ELISA reader was adopted to record the absorbance at 570 nm.
Wound-Healing and Transwell Invasion Assays
In this study, a wound-healing assay was used to evaluate the migration capacity. We seeded PC cells into 12-well plates, and cells rise to 90% confluence manually. The cell monolayer was scratched by the tip of a micropipette and gowned in a serum-free solution. After incubation for 24 h, cell migration images were measured at 0, 24, and 48 h based on the width of the wound scratches. To explore the invasion ability, Transwell migration assays (Corning-Costar, NY, USA, pore size 8 μm) mixed with Matrigel (Sigma, USA) were applied to determine the cell invasion capacity. We placed 5 × 10⁴ PC cells, coated with 250 μl serum-free medium in the upper chamber, while the lower chamber with 700 μl solution blended with 30% FBS. Following 2 days of fixation and staining, we collected the lower chamber and further calculated the number of cells from nine fields via a CX33 biological microscope (Olympus, Beijing, China).
Western Blotting and Coimmunoprecipitation
Western blot analysis has been done through repeated experiments previously (19). Protein extracts from PC cells and the concentration of protein were quantified using a BCA assay. Next, the appropriate denatured protein (30 µg per well) was separated in polyacrylamide gel electrophoresis and transferred to polyvinylidene fluoride membranes (PVDF). For this study, antibodies were recorded as follows: Rabbit anti-ZEB1 (1:1,000, catalog#3396, Abcam, Cambridge, MA, USA), HIF-1α (1:1,000, catalog#279654, Abcam), HDAC-1 (1:1,000, catalog#10197-1-AP, Proteintech, Rosemont, IL, USA), PAN-AC (1:1,000, catalog#A2391, ABclonal, Woburn, MA, USA), GAPDH (1:1,000, catalog#10494-1-AP, Proteintech). On the other hand, coimmunoprecipitation was adopted to evaluate the combining capacity on protein level. Lysates from PC cells were blended with control mouse/rabbit IgG or primary antibodies at steady-state level of 4°C throughout the night. We mingled lysates with Protein A/G PLUS-Agarose (Santa Cruz Co., Beijing, China) at 4°C for 1.5 h. Next, we separated agarose and then acquired even volumes of each sample using a lysis buffer. Western blot analysis was used for further assessments. All Western blot reactions were independently tested in triplicate.
Chromatin immunoprecipitation
In this study, chromatin immunoprecipitation (ChIP) assay was conducted by adopting the EZ-ChIPTM kit (Millipore, Billerica, MA, USA), containing anti-HIF-1α and anti-RNA polymerase II antibodies (catalog#ab264350, Abcam) in accordance with manufacturer’s specification. We employed matching IgG as controls. Later, we amplified bound DNA by PCR techniques and obtained results through electrophoretic separation on a 2% agarose gel. All ChIP assays were independently tested in triplicate.
Fluorescence In Situ Hybridization
For single-molecule RNA fluorescence in situ hybridization (FISH), we purchased The FISH Tag™ RNA Multicolor Kit (Invitrogen, USA) and MAXIscript® Kit (ThermoFisher, Waltham, MA, USA). The course of experiments of RNA FISH was applied according to provided instructions (33, 34). In this study, nucleus of PC cells was stained with DAPI and red fluorescent probe was synthesized to identify ZEB1-AS1. Hybridization with probes was performed all night at 55°C. A laser scanning microscope (Carl Zeiss, Jena, Germany) was used for recording the stained results of FISH.
Luciferase Reporter Assays
How HIF-1α modulates the binding activity of a potential hypoxia response element (HRE) on the ZEB1-AS1 promoter during normoxia/hypoxia medium was evaluated by luciferase reporter assays. We transfected wild-type (WT) HRE sequence and mutant (MUT) HRE sequence into PANC-1 cells. Next, these cells were transfected with siNC and siHIF-1α which expressed pGL3-based construct involving the HRE of ZEB1-AS1. Dual-Luciferase Report Assay kit (Promega, Madison, WI, USA) was used for luciferase activity evaluation based on the manufacturer’s instruction (11). The intensity of the luciferase activity was standardized to Renilla luciferase. All researches were independently tested three times.
Immunohistochemistry
Immunohistochemistry was conducted as a previously described method. Paraffin-embedded PC tissue sections from patients were collected, dried, dewaxed, and rehydrated. Sections were incubated with the primary antibody to ZEB1 (1:1,000, catalog#3396, Abcam) or primary anti-HIF-1α antibody (1:1,000, catalog#279654, Abcam) and a horseradish peroxidase-conjugated secondary antibody (1:200, rabbit anti-goat). Immunohistochemical staining samples of HIF-1α and ZEB1 were estimated under CX33 biological microscope (Olympus, Beijing, China). Intensity score was calculated for each sample from 0 to 3 (units of intensity) as previously described (12), and the average intensity score was further examined for each PC patient.
Xenograft Assay
For animal experiment, we implanted PC cells, which are steadily transfected with LV-siZEB1-AS1#1, LV-siZEB1-AS1#2, or LV-siNC, subcutaneously in 4-week-old nude BALB/c mice based on 2 × 10⁶ cells per mouse (Beijing HFK Bio-Technology Co., Beijing, China). Five mice comprised each group and reared for 27 days. Tumor volumes (0.5 × L (length) × W2 (width)) were calculated every 3 days. Tumor weights were weighed after adjacent sacrifice of mice. Solid tumor tissues containing lungs and liver of the mice were excised, and we further stained the samples with H&E. The expression of ZEB1 and ZEB1-AS1 were calculated from five sections of metastasis tissue in each mice. Our in vivo experiments were approved by the Animal Research Committee of the First Affiliated Yijishan Hospital of Wannan Medical College.
Statistical Analysis
IBM SPSS Statistics (SPSS v21.0) was applied for all analyses. Data analyses are all based on means ± SD. Specifically, group differences were evaluated by t-test. Paired t-test was employed to compare ZEB1-AS1 in paired PC tissues. The correlation between ZEB1-AS1 and ZEB1 expression was measured by Pearson’s correlation. We used Chi-square test to analyze the relation between ZEB1-AS1 and clinical characteristics. Kaplan-Meier approach was performed to describe the patients’ survivals. Further research of receiver operating characteristic curve analysis (ROC) was applied to evaluate the ability of biomarks to forecast the mortability risk of PC and area under the curve (AUC) was used to measure predictive capability (35). All assays were independently tested in triplicate. Significant differences were significant at *p < 0.05 and **p < 0.01 as marked significance.
Results
ZEB1-AS1 Is Overexpressed in Human PC
To determine the underlying dysregulated lncRNAs that induce the tumorigenesis of PC, we analyzed a lncRNA microarray. Compared with paired noncancerous peritumoral (NP) tissues, hierarchical clustering data demonstrated that lncRNA-ZEB1-AS1 (ZEB1-AS1) was one of the significantly upregulated lncRNAs in PC samples (Figure 1A). Compared with the normal HPDE cell line, the expression of ZEB1-AS1 in five PC cell lines (BXPC-3, PANC-1, SW1990, MIAPaCa-2, and AsPC-1) was significantly higher (Figure 1B). Moreover, FISH analysis was performed to determine whether ZEB1-AS1 is located in the nucleus or cytoplasm of BXPC-3/PANC-1 cells. It was indicated that ZEB1-AS1 was mainly located in the nucleus (Figure 1C). Although ZEB1-AS1 was a well-known oncogene in many tumors, there has been little research on PC. Hence, it was selected for further investigation in consideration of the genomic location on ZEB1 and ZEB1-AS1 (Figure 1D). The full-length ZEB1-AS1 sequence was determined, and the secondary structure of ZEB1-AS1 was determined with minimum free energy (MFE) by searching the NONCODE online database (Supplementary Figures S1A, B). Online tools, including the Coding Potential Assessment Tool (CPAT) and Coding Potential Calculator (CPC), predicted that ZEB1-AS1 is a potential noncoding RNA (Supplementary Figures S1C, D).
FIGURE 1
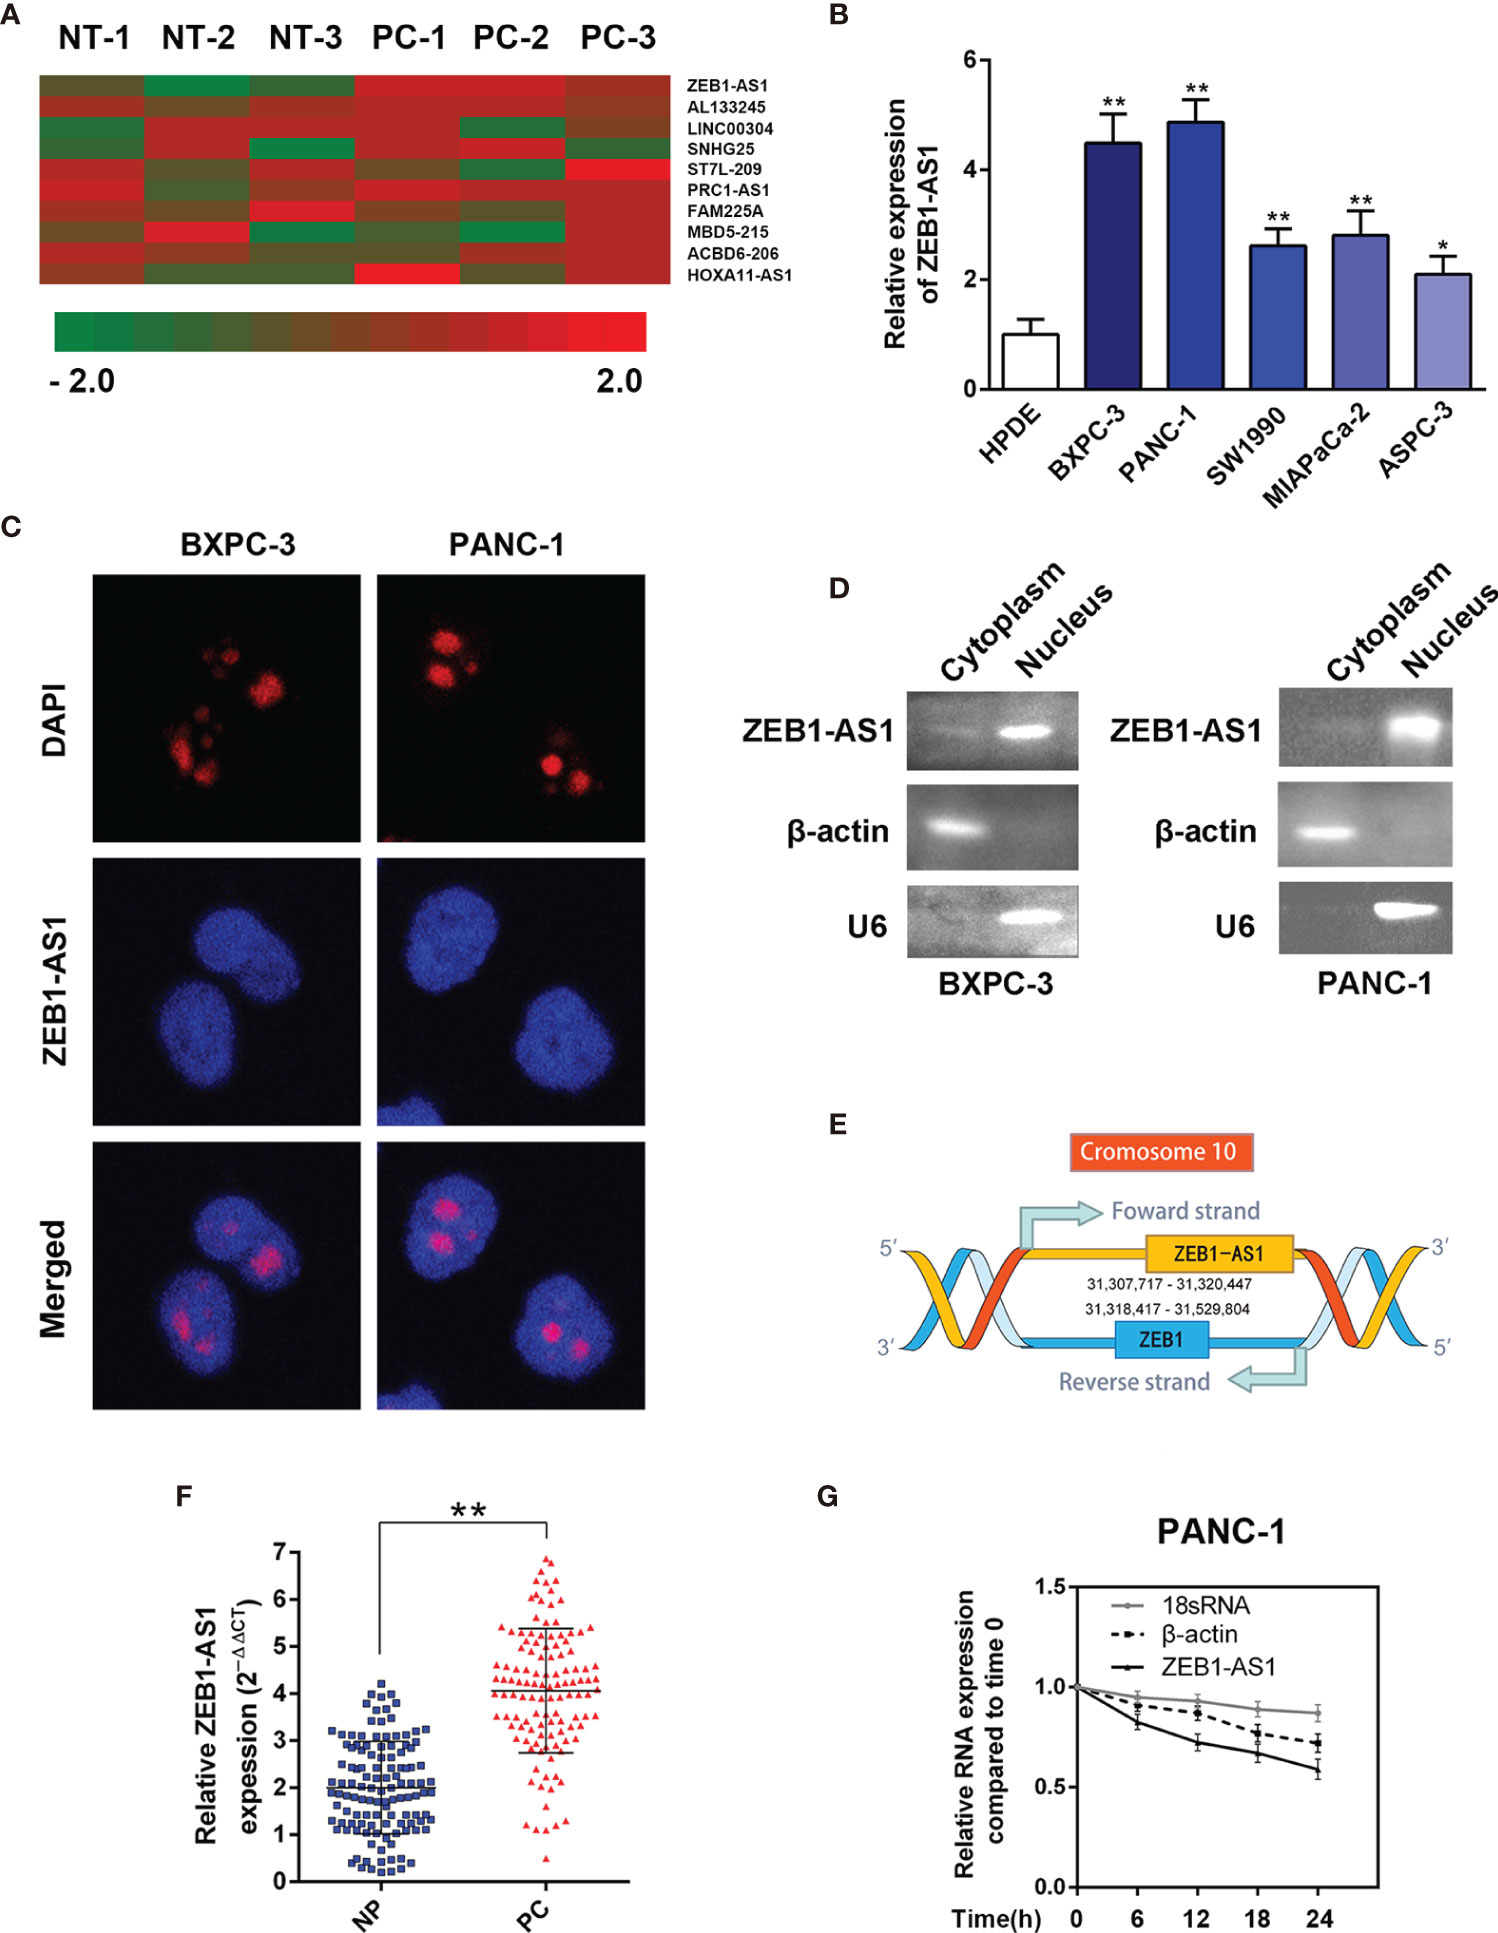
Figure 1 LncRNA-ZEB1-AS1 expression is elevated in PC tissues and associated with PC progression. (A) Hierarchical clustering assessment of lncRNAs differentially expressed between normal pancreatic (NP) and pancreatic cancer (PC) tissues, which include lncRNA-ZEB1-AS1 (ZEB1-AS1). (B) ZEB1-AS1 expression was further compared among HPDC cells and the BxPC-3, PANC-1, SW1990, MIAPaCa, and ASPC-3 cell lines. (C) Single-molecule RNA FISH detection of ZEB1-AS1 (red) in indicated PANC-1/BxPC-3 cells. DAPI-stained nuclei were blue. (D) The expression level of ZEB1-AS1 in the subcellular fractions of BxPC-3 and PANC-1 cells was detected by qRT-PCR. The products of qRT-PCR were then separated by 2% agarose gel electrophoresis; U6 and β-actin were used as markers of the nucleus and cytoplasm, respectively. (E) Genomic location of ZEB1-AS1 and ZEB1 with transcript orientation marked by arrows. (F) ZEB1-AS1 expression was assessed by qRT-PCR in 119 PC and paired NP tissues. (G) RNA synthesis in PANC-1 cells was blocked by α-amanitin (50 µM), and ZEB1-AS1 stability was assessed by qRT-PCR compared with 0 h RNA polymerases II and I were used to transcribe β-actin and 18S rRNA, respectively. All data were presented as means ± SD of at least three independent experiments. Values are significant at *p < 0.05 and **p < 0.01 as indicated.
To further verify the microarray results, ZEB1-AS1 levels were measured in 119 paired PC and NP tissues using real-time PCR analysis. The ZEB1-AS1 transcript levels in the PC tissues were significantly higher than those in paired noncancerous tissues (Figure 1E). After blocking RNA synthesis through the RNA polymerase II inhibitor, α-amanitin, in PANC-1 cells, the levels of ZEB1-AS1 were evaluated. The results indicate that α-amanitin treatment decreased ZEB1-AS1 level significantly after 24 h, instead of the level of 18S mRNA. The results verified that ZEB1-AS1 synthesis was regulated by RNA polymerase II rather than RNA polymerase I (Figure 1F).
ZEB1-AS1 Promotes Proliferation Ability and Invasion Capacity in PC Cells
Because ZEB1-AS1 is upregulated in PC tissues, short interference siRNAs for ZEB1-AS1 (siZEB1-AS1) were utilized to suppress the levels of ZEB1-AS1 in PC cells. Two siZEB1-AS1 siRNAs targeting ZEB1-AS1 were designed, and they significantly knocked down endogenous ZEB1-AS1 expression and were used for further experiments (Figure 2A). To elucidate potential impacts of ZEB1-AS1, we transfected siZEB1-AS1 and a ZEB1-AS1 overexpression (ZEB1-AS1-OE) vector into BXPC-3 and PANC-1 cells. Knockdown of ZEB1-AS1 suppressed the proliferation and migration of BXPC-3 and PANC-1 cell lines (Figures 2B, C). In addition, Matrigel-coated Transwells confirmed that ZEB1-AS1 depletion caused a significant inhibition of the invasion ability of BXPC-3 and PANC-1 cells (Figure 2D). Furthermore, transfection of ZEB1-AS1-OE into BXPC-3 and PANC-1 cells resulted in overexpression of ZEB1-AS1 compared with the vector control (Supplementary Figure S2A). Moreover, overexpression of ZEB1-AS1 markedly induced the proliferation, migration, and invasion capacity of these cells (Supplementary Figures S2B–D). Taken together, these results demonstrated that ZEB1-AS1 promotes the proliferation capacity and invasion ability of PC cells.
FIGURE 2
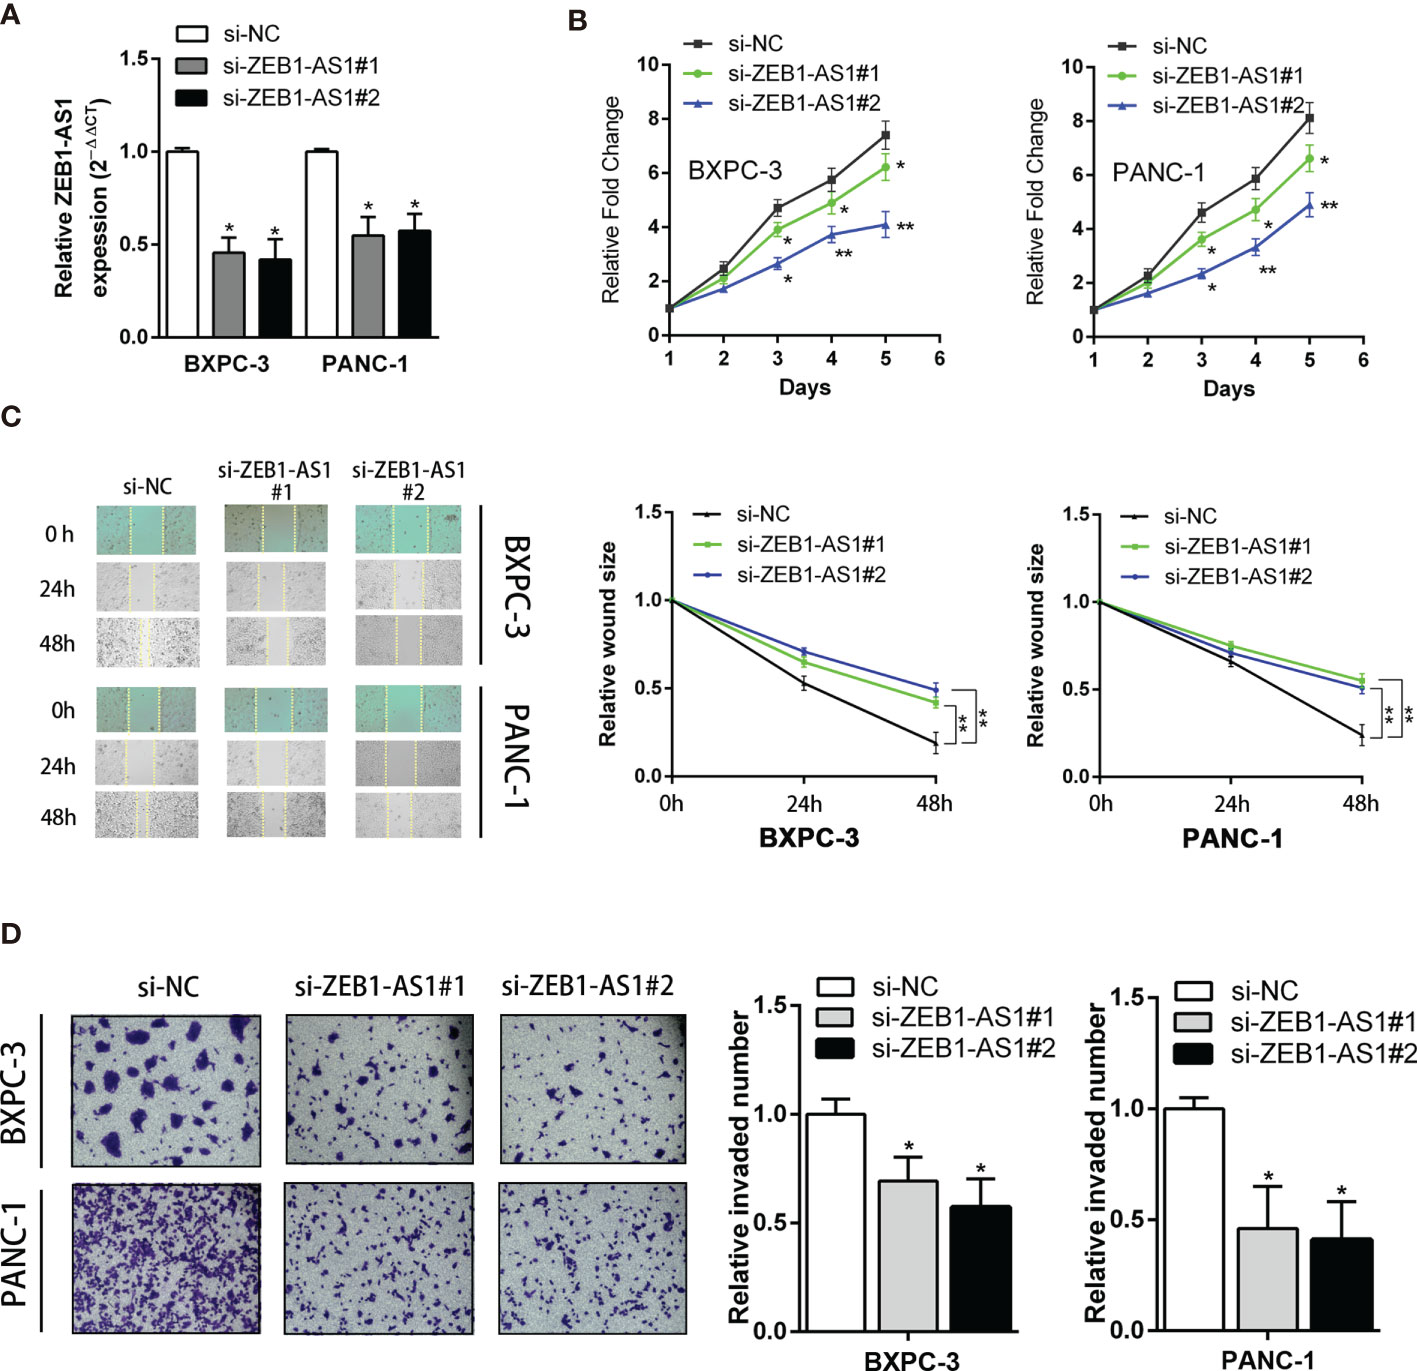
Figure 2 Knockdown of ZB1-AS1 inhibited proliferation, migration, and invasion of PC cells. (A) ZEB1AS1 inhibiting efficiency in BxPC-3 and PANC-1 cells were analyzed by qRT-PCR. (B) Proliferation of BxPC-3/PANC-1 cells underexpressing ZEB1-AS1 or negative control was assessed via MTT assays for 5 days. (C) Migration ability was evaluated by wound-healing assay. Representative images (left) and relative wound size are shown (right). (D) Transwell assay (left) was designed to assess the invasion ability of those transfected BxPC-3/PANC-1 cells. Average counts of five random microscopic fields were analyzed. The histogram (right) shows the percentage of invaded PC cell number. All data were presented as means ± SD of at least three independent experiments. Values are significant at *p < 0.05 and **p < 0.01 as indicated.
ZEB1 Is a Key Target of ZEB1-AS1 Implementing the Biological Action of PC Cells Under Hypoxia Conditions
Many studies have established that lncRNAs modulate the levels of neighboring genes by cis regulation. As ZEB1-AS1 is near the ZEB1 gene, which is a tumorigenic driver in several cancers, we hypothesized that ZEB1-AS1 exerts a cis-acting role on ZEB1 expression. The expression of ZEB1 increased with prolonged culture in a hypoxia microenvironment from 0 to 48 h (Figure 3A). However, the expression quantity of ZEB1 under normoxia conditions from 0 to 48 h of culture did not show a significant difference (Supplementary Figure S3A). In BXPC-3 and PANC-1 cells, ZEB1-AS1 knockdown significantly decreased ZEB1 mRNA and protein expression (Figure 3B). It is inspiring to note that overexpression of ZEB1-AS1 showed a similar trend (Figure 3C).
FIGURE 3
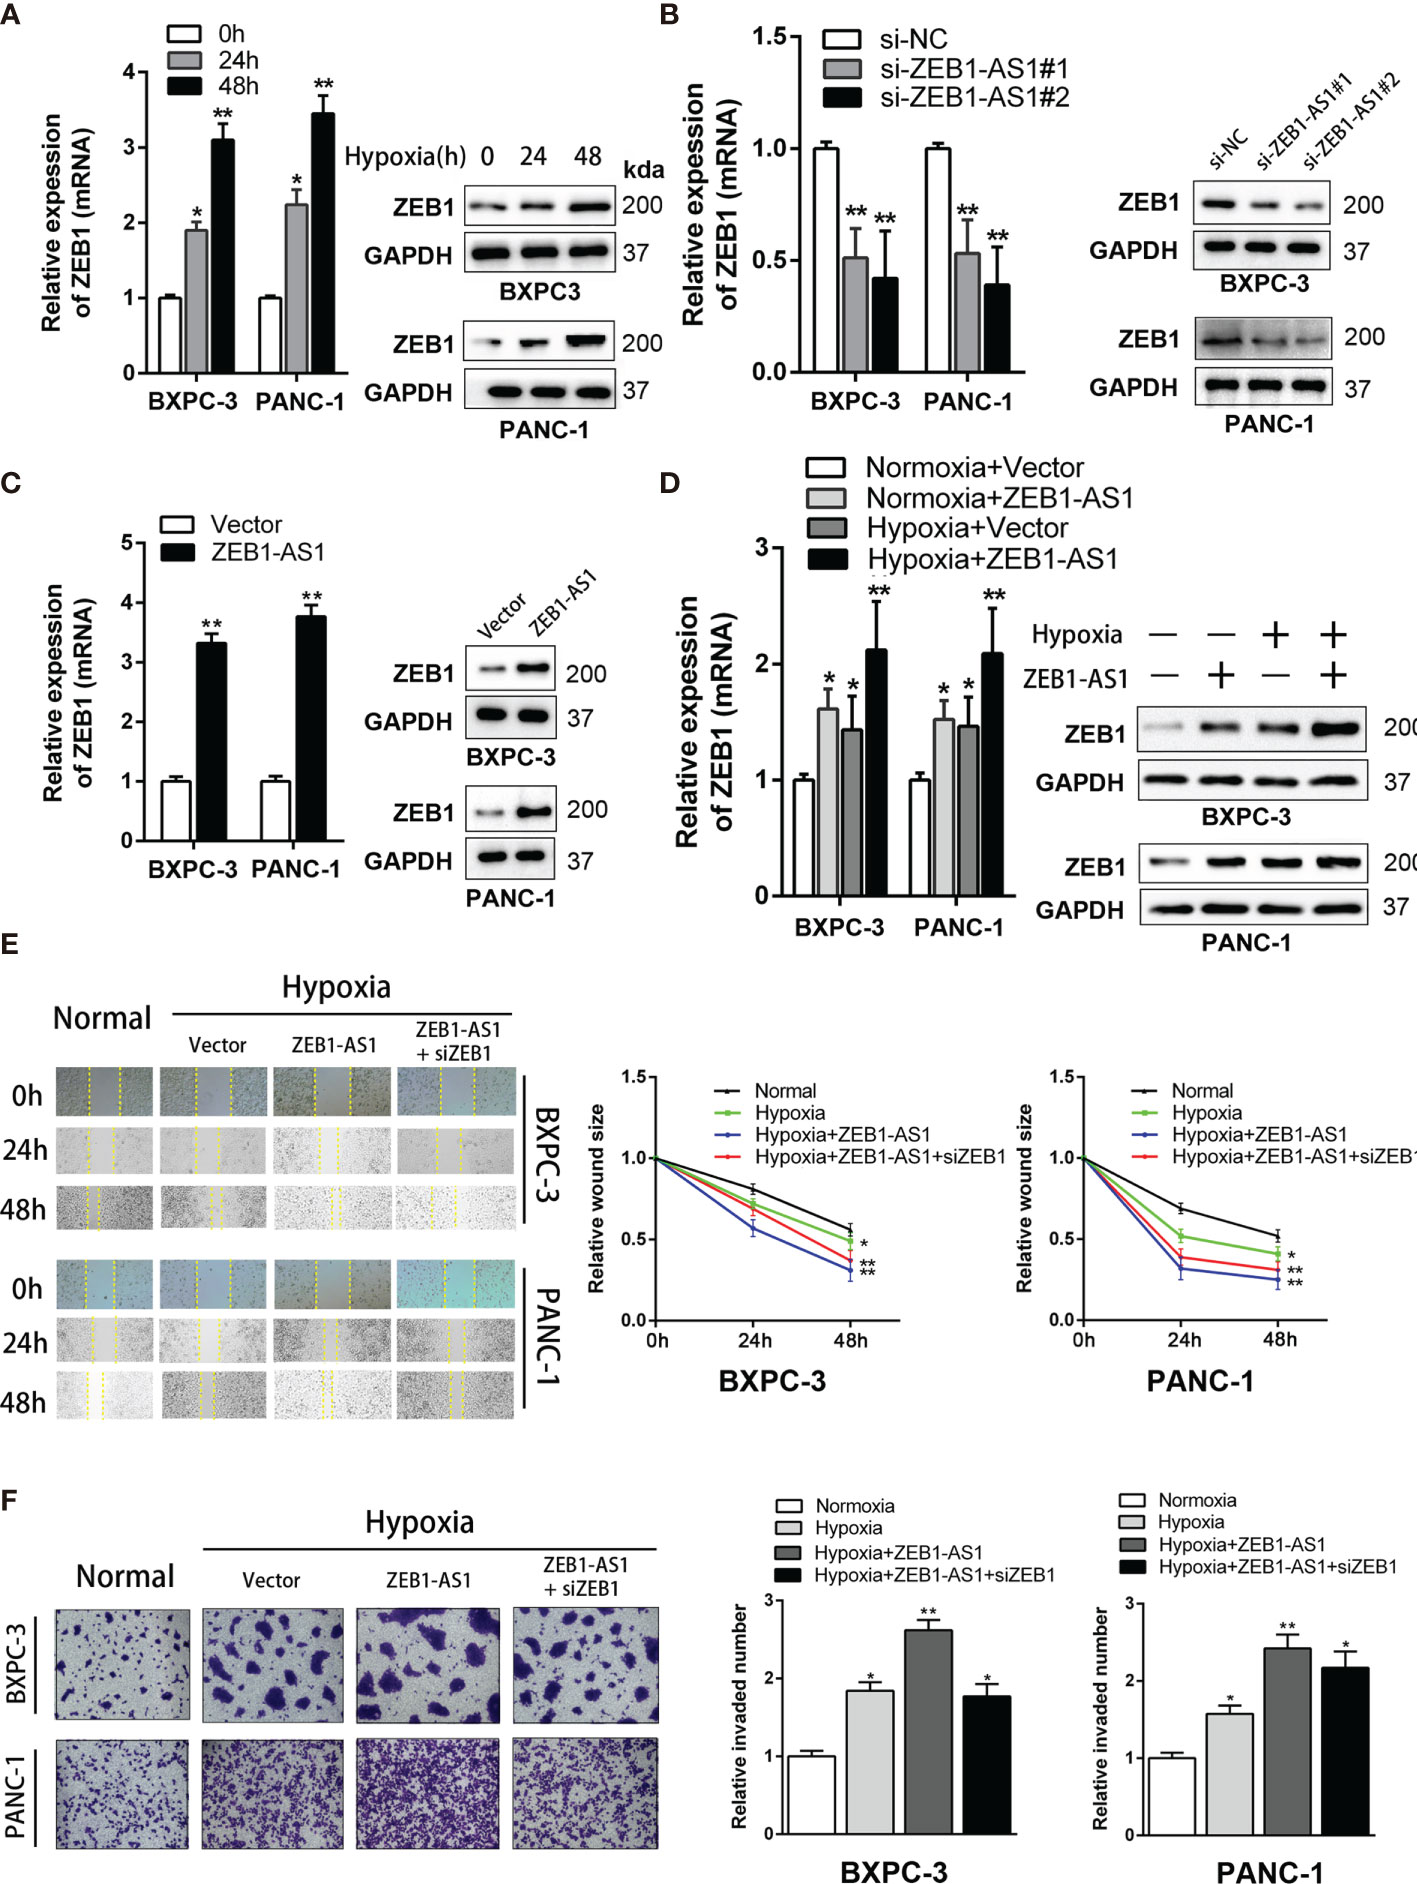
Figure 3 ZEB1 is a critical target of ZEB1-AS1 exerting functions in PC cells during hypoxia condition. (A) Expression of ZEB1 in BxPC-3/PANC-1 cells cultured with hypoxia medium for 0, 24, and 48 h were analyzed at the mRNA (left) and protein (right) levels by qRT-PCR and Western blot analysis, respectively. (B) Expression of ZEB1 in BxPC-3/PANC-1 cells transfected with ZEB1-AS1 siRNAs (si-ZEB1-AS1#1, si-ZEB1-AS1#2) or the negative control siRNA (siNC) was analyzed at the mRNA (left) and protein (right) levels by qRT-PCR and Western blot analysis, respectively. (C) Expression of ZEB1 in BxPC-3/PANC-1 cells transfected with ZEB1-AS1 overexpression plasmid (ZEB1-AS1) or the empty vector plasmid (Vector) was analyzed at the mRNA (left) and protein (right) levels by qRT-PCR and Western blot analysis, respectively. (D) ZEB1 in ZEB1-AS1 overexpressing BxPC-3/PANC-1 cells cultured in normal or hypoxia condition was analyzed at the mRNA and protein levels by qRT-PCR and Western blot analysis, respectively. (E, F) Migration and invasion ability of four groups of BxPC-3/PANC-1 cells were recorded by the Wound healing assay and Transwell assay, representative images were shown (left). Average counts of five random microscopic fields were analyzed. The histogram (right) shows the percentage of migrated or invaded PC cells number. All data were presented as means ± SD of at least three independent experiments. Values are significant at *p < 0.05 and **p < 0.01 as indicated.
Hypoxia medium (hypoxia microenvironment undergoing 48 h) was used for further experiments. In this study, hypoxia medium increases the mRNA and protein levels of ZEB1-AS1-induced ZEB1 expression (Figure 3D), indicating that ZEB1 is a potential target of ZEB1-AS1 under hypoxia conditions. Similarly, the invasion and migration capacities of BXPC-3 and PANC-1 cells were upregulated in ZEB1-AS1-overexpressing cells under hypoxia conditions, and these effects were weakened by si-ZEB1 (Figures 3E, F). Together, these results demonstrated that ZEB1 is critical for ZEB1-AS1 to exert its oncogenic and malignant functions in PC cells under hypoxia conditions.
ZEB1-AS1 Is Modulated Transcriptionally by HIF-1α in PC Cells Under Hypoxia Conditions
Next, we investigated the potential mechanism by which hypoxia conditions control ZEB1-AS1 expression in PC cells. Recent studies have investigated whether variable expression of lncRNAs is attributed to hypoxia conditions in a variety of cancer cells. Because our previous research indicated that hypoxia facilitates lncRNA-NUTF2P3 enrichment (11), we investigated whether transcriptionally upregulated ZEB1-AS1 is closely related to the hypoxia environment of PC. Genomic structure analysis indicated one predictable HRE in the promoter region of ZEB1-AS1, suggesting that ZEB1-AS1 is a hypoxia-responsive lncRNA (Figure 4A). The levels of ZEB1-AS1 also statistically increased under hypoxia medium but are insignificantly different under normoxia environment in the same time course (from 0 to 48 h) of the experiment (Supplementary Figures S3B, C).
FIGURE 4
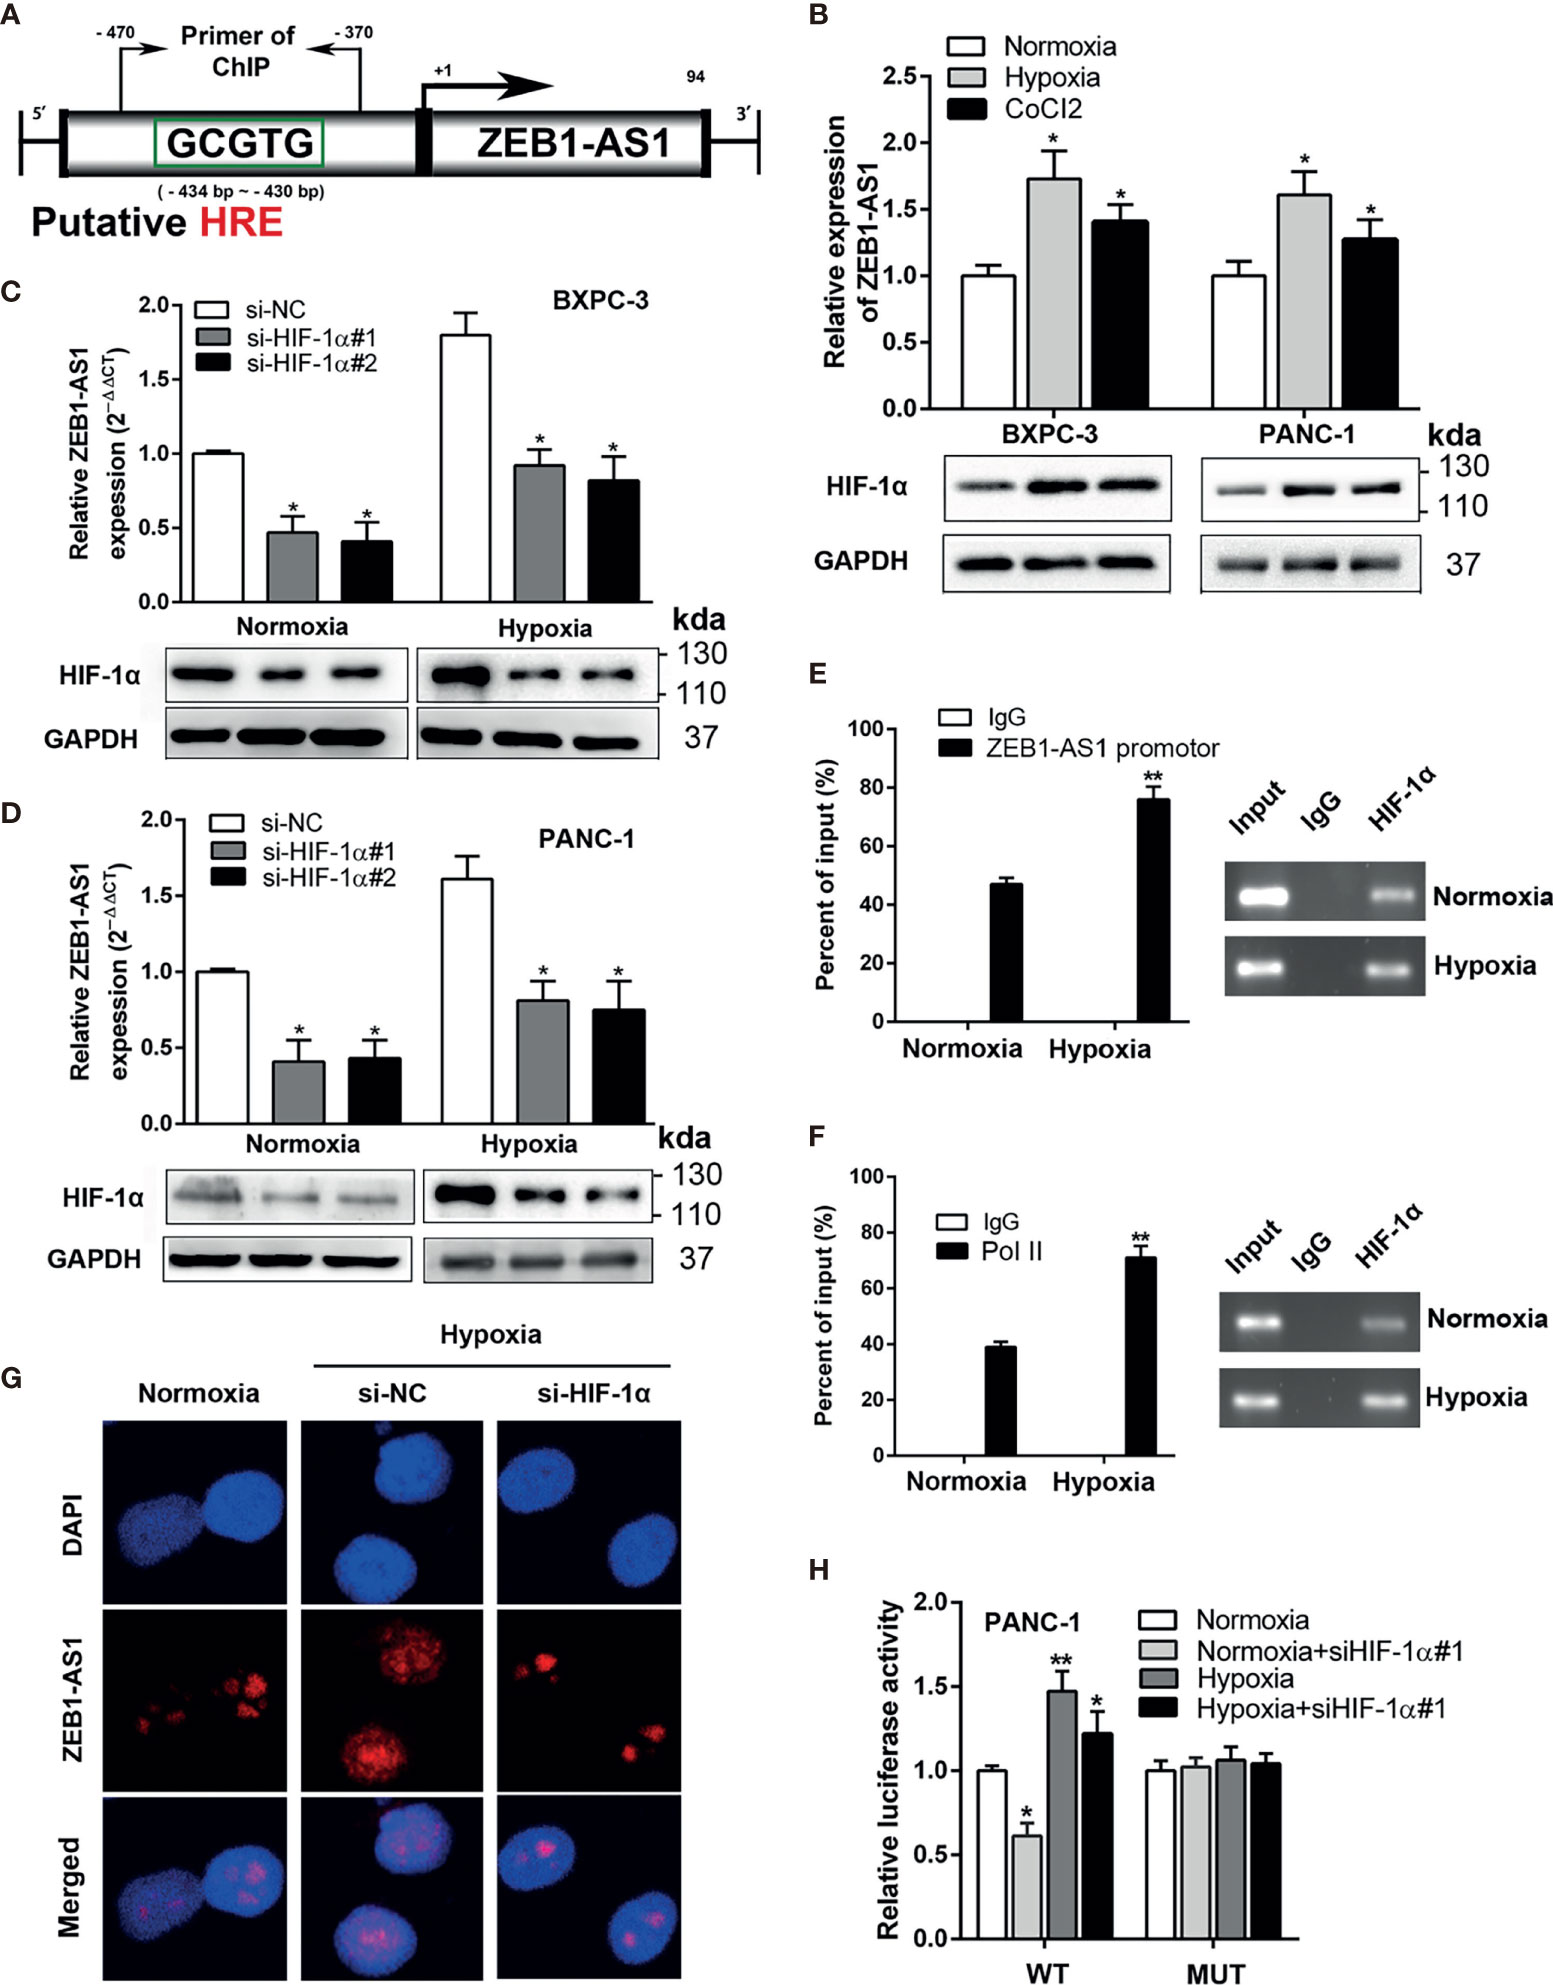
Figure 4 ZEB-1AS1 transcription is regulated by HIF-1α during hypoxia medium. (A) A putative hypoxia-responsive element (HRE) was found in the promoter region of ZEB1-AS1. (B) The expression levels of ZEB1-AS1 (upper) and HIF-1α protein (lower) in BXPC-3/PANC-1 cells were measured after being cultured during normoxia, hypoxia (1%O2), or CoCl2 (concentration of 100 µM under 48 h) at the mRNA and protein levels by qRT-PCR and Western blot analysis, respectively. (C, D) After knockdown of HIF-1α with siRNA, the expression of ZEB1-AS1 was evaluated by qRT-PCR in BXPC-3 and PANC-1 cells under normoxia or hypoxia (upper). Lower diagrams indicated HIF-1α protein levels by Western blot analysis. (E) ChIP assays with anti-HIF-1α antibody were performed to affirm the binding between HIF-1α and HRE of ZEB1-AS1 promoter region in PANC-1 cells under normoxia or hypoxia condition. (F) After being cultured in hypoxia or normoxia, ChIP assays with anti-Pol II antibody were performed to ascertain the binding capacity between Pol II and ZEB1-AS1 promoter region in PANC-1 cells. (G) After knockdown of HIF-1α, the expression of ZEB1-AS1 was shown by FISH assays in PANC-1 cells during normoxia and hypoxia condition. (H) Wild-type ZEB1-AS1 promoter-containing pGL3 reporter vector (WT) or mutant-type ZEB1-AS1 promoter-containing pGL3 reporter vector (MUT) of ZEB1-AS1 promoter sequence firefly luciferase reporter activity in PANC-1 cells transfected with siNC or siHIF-1α and cultured under normoxia or hypoxia conditions were assessed by Renilla luciferase reporter assays after 48 h All data were presented as means ± SD of at least three independent experiments. Values are significant at *p < 0.05 and **p < 0.01 as indicated.
After treatment with hypoxia medium or chemically inducing hypoxia with CoCl2 (100 µM) for 48 h, the level of ZEB1-AS1, in accordance with HIF-1α expression, was significantly increased in BXPC-3 and PANC-1 cells (Figure 4B). Moreover, HIF-1α knockdown suppressed hypoxia-induced ZEB1-AS1 upregulation in PC (Figures 4C, D). ChIP assays showed that the HRE region in the ZEB1-AS1 promoter modulated HIF-1α binding to the ZEB1-AS1 promoter area, which was further increased under hypoxia conditions (Figure 4E). Pol-II was also shown to bind to the HRE of the ZEB1-AS1 promoter region. Similarly, this binding was enhanced during hypoxia medium, indicating a protranscriptional ability of this binding (Figure 4F). Furthermore, RNA-FISH assay demonstrated that hypoxia-induced ZEB1-AS1 overexpression was suppressed through HIF-1α knockdown (Figure 4G). To further verify the functional binding of HIF-1α to the ZEB1-AS1 promoter region, we performed a luciferase reporter assay in PANC-1 cells, which were transfected with luciferase reporter vectors containing the WT promoter of ZEB1-AS1 or MUT promoter of ZEB1-AS1. Hypoxia medium remarkably increased the luciferase activity in cells transfected with WT but not MUT ZEB1-AS1. However, knockdown of HIF-1α decreased the hypoxia-induced luciferase activity of PC cells transfected with WT ZEB1-AS1 (Figure 4H). Thus, these findings suggested that ZEB1-AS1 is transcriptionally regulated by HIF-1α in PC cells in hypoxia medium.
ZEB1-AS1 Stabilizes HIF-1α Protein Through ZEB1-Mediated Deacetylation
The relationship between ZEB1-AS1 and HIF-1α was further explored to determine the mechanism by which ZEB1-AS1 affects the interaction between HIF-1α and the ZEB1 promoter. The results showed that the protein level of HIF-1α was suppressed by the knockdown of ZEB1-AS1, indicating that HIF-1α may be a direct target of ZEB1-AS1 in BXPC-3 and PANC-1 cells. However, downregulation of ZEB1-AS1 did not affect the mRNA expression of HIF-1α, and a similar experimental result was repeated by RNA agarose gel electrophoresis (Figure 5A). These findings indicated that ZEB1-AS1 influenced the level of HIF-1α at the posttranscriptional level and not at the transcriptional level. Furthermore, we investigated how ZEB1-AS1 regulates the protein stability of HIF-1α. The HIF-1α protein level was measured following cycloheximide (CHX) treatment, which disrupts protein synthesis. During CHX treatment, the stability of HIF-1α was inhibited via downregulation of ZEB1-AS1 in a time-dependent manner (Figure 5B). Next, MG132 (proteasome inhibitor) was used to rescue the decrease in HIF-1α protein levels in ZEB1-AS1 knockdown PC cells (Figure 5C). We further verified that ZEB1-AS1 knockdown significantly induced HIF-1α acetylation and decreased the ZEB1 and HIF-1α binding under hypoxia conditions (Figure 5D). Moreover, we demonstrated that ZEB1 overexpression rescued the ZEB1-AS1 knockdown-induced downregulation of HIF-1α and decreased HIF-1α and ZEB1 binding, and it reduced the acetylation level of HIF-1α (Figure 5E).
FIGURE 5
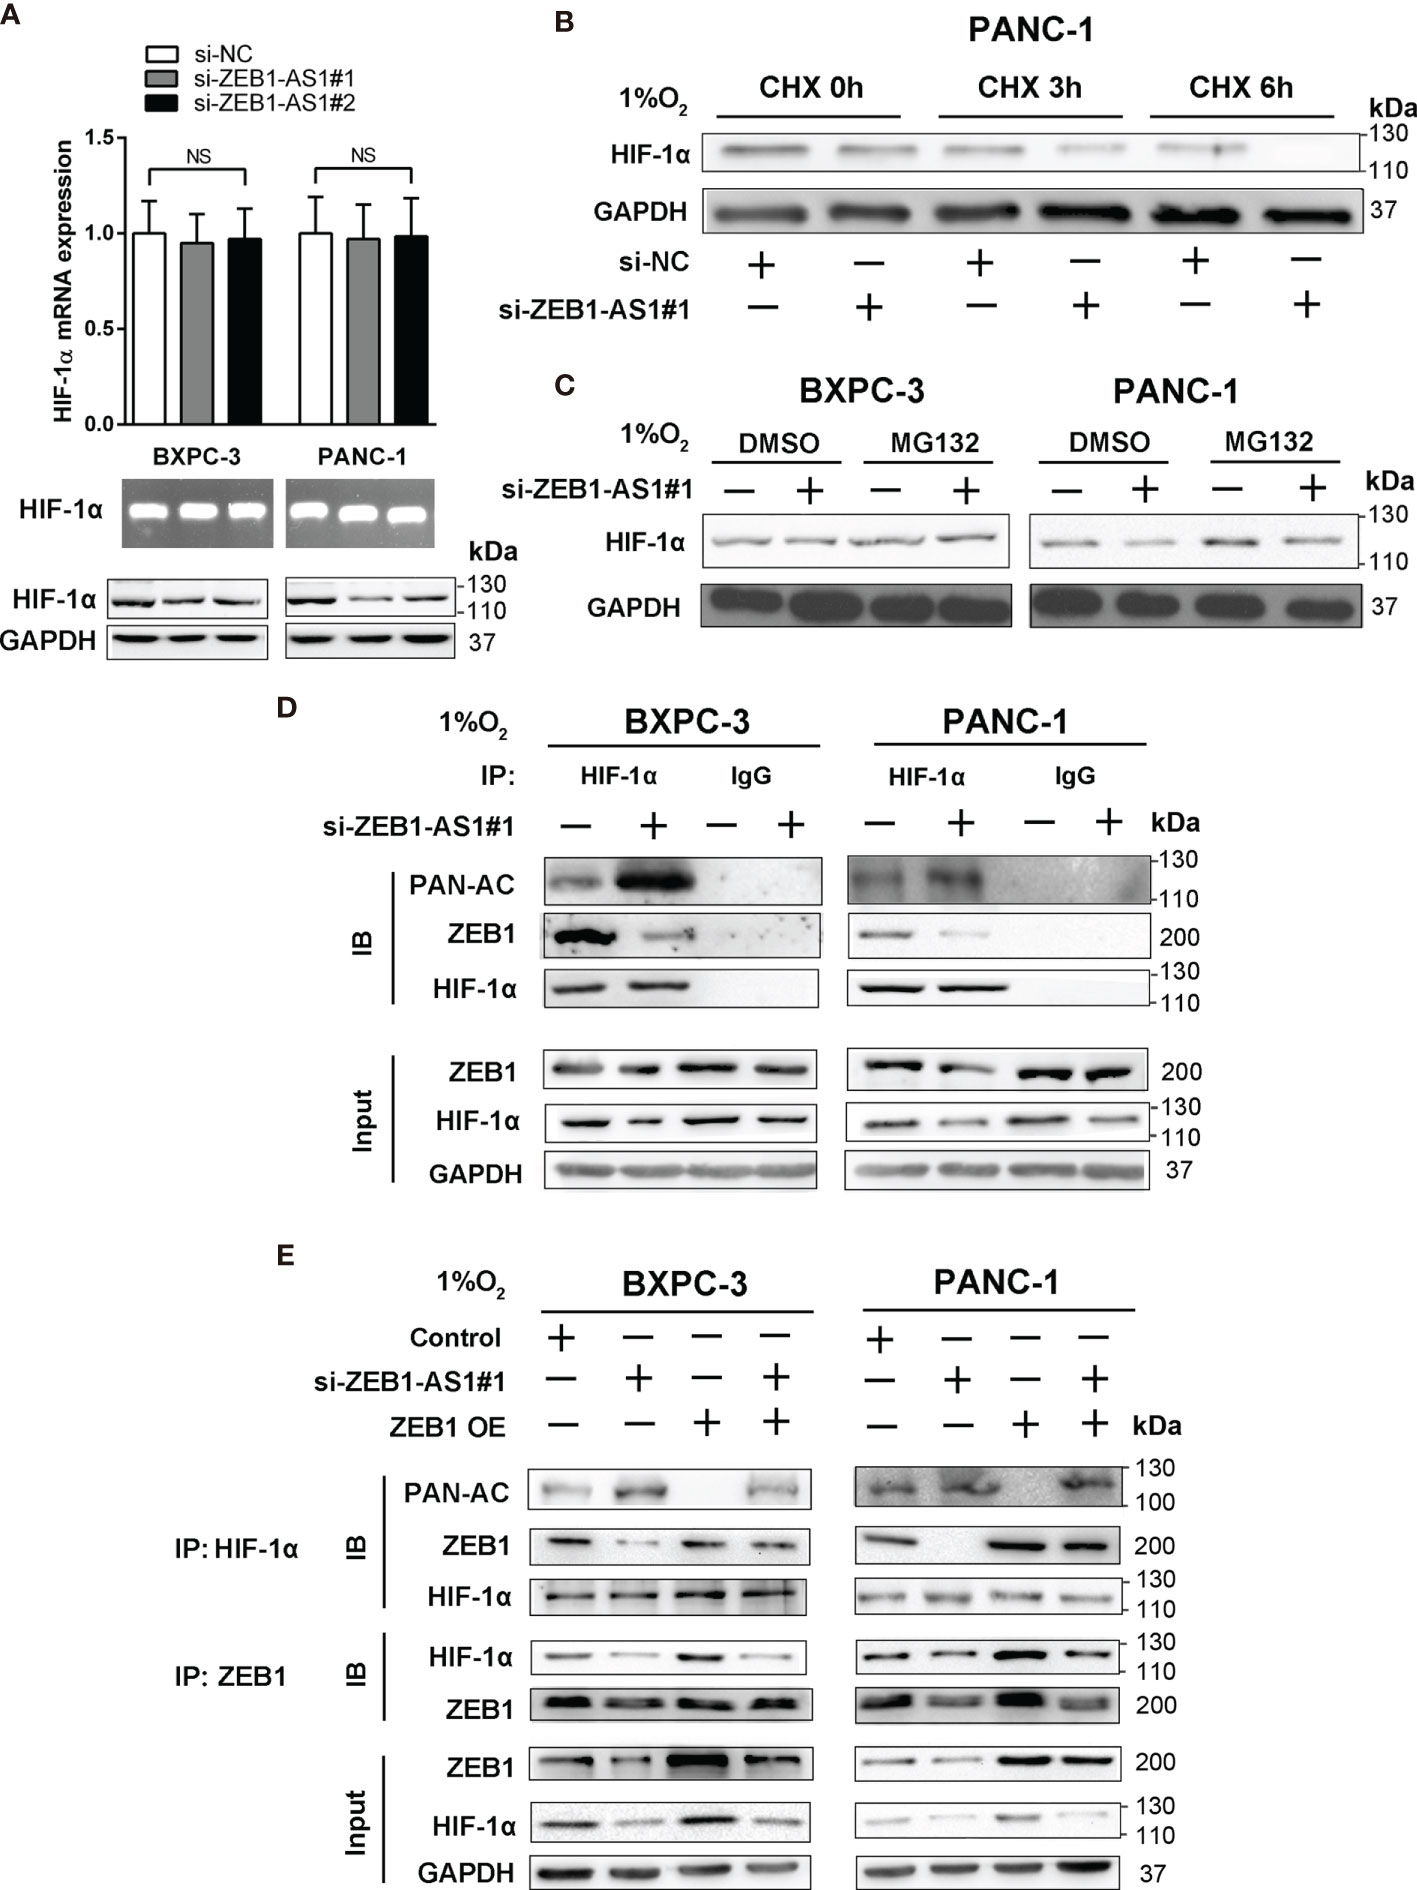
Figure 5 Hypoxia-induced ZEB1-AS1 stabilizes HIF-1α by promoting deacetylation. (A) HIF-1α mRNA and protein levels were analyzed by qRT-PCR (upper), 2% agarose gel electrophoresis (middle), and Western blot (lower) analysis in ZEB1-AS1-knockdown BxPC-3/PANC-1 cells. (B) The effect of ZEB1-AS1 knockdown on stabilization of HIF-1α was measured in PANC-1 cells treated with cycloheximide (CHX) under hypoxia conditions of three time points (0, 3, and 6 h). (C) HIF-1α levels in the ZEB1-AS1-knockdown BxPC-3/PANC-1 cells were analyzed under hypoxia condition with or without MG132 treatment. (D) HIF-1α acetylation and the binding between HIF-1α and ZEB1 in the ZEB1-AS1-knockdown BxPC-3/PANC-1 cells under hypoxia condition for 24 h were analyzed in the cell lysates following antiacetylation, anti-HIF-1α, or anti-ZEB1 immunoprecipitation. (E) The acetylation of HIF-1α and the binding between HIF-1α and ZEB1 in the BxPC-3/SW1990 cells, cultured under hypoxia condition, transfected with siZEB1-AS1 or/and ZEB1-OE were analyzed by immunoprecipitation with antiacetylation, anti-HIF-1α, or anti-ZEB1 antibody. All data were presented as means ± SD of at least three independent experiments. NS means the difference is not significant.
HDAC1 interacts with HIF-1α and decreases the protein level of HIF-1α. Research has shown that the transcriptional repressor, ZEB1, recruits HDAC1-containing corepressor complexes (CRC) to decrease transcription of the cadherin 1 (CDH1) gene and downregulate E-cadherin in PC. Thus, we hypothesized that HDAC1 participates in ZEB1-AS1-promoted destabilization of HIF-1α in PC cells. Coimmunoprecipitation (CoIP) demonstrated that HIF-1α and HDAC1 bind to each other and that this binding is intensified by hypoxia conditions (Supplementary Figure S4A). This result indicated that HDAC1, HIF-1α, and ZEB1 may form a ZEB1-AS1-induced complex. To investigate whether HDAC1 is involved in the regulation of HIF-1α protein expression by ZEB1, we used trichostatin A (TSA), a specific inhibitor of HDACs, to assess the stability of HIF-1α protein. The results showed that TSA aggravated the inhibitory effect of ZEB1 knockdown on HIF-1α protein levels under hypoxia conditions in PC (Supplementary Figure S4B). Consistently, TSA downregulated the upregulation of HIF-1α at the protein level, which was promoted by ZEB1 overexpression (Supplementary Figure S4C). In addition, overexpression of HDAC1 rescued the suppression of HIF-1α expression by ZEB1 knockdown. However, HDAC1 knockdown inhibited HIF-1α expression, which was upregulated by ZEB1 overexpression (Supplementary Figures S5A, B). To evaluate the effect of HDAC1 on the interaction of HIF-1α with ZEB1, we measured the acetylated levels of HIF-1α via a CoIP assay. The results revealed that ZEB1 repressed TSA-induced HIF-1α acetylation (Supplementary Figure S5C). In contrast, TSA-induced si-ZEB1 accelerated HIF-1α protein acetylation (Supplementary Figure S5D). Together, these results suggested that ZEB1-AS1 promotes an interaction among HDAC1, HIF-1α, and ZEB1, which inhibits acetylation of HIF-1α by promoting the deacetylase capacity of HDAC1, further resulting in HIF-1α stabilization.
Depletion of ZEB1-AS1 Inhibits the Progression and Metastasis of PC In Vivo
To further evaluate the role of ZEB1-AS1, PANC-1 cells stably transfected with a lentiviral vector including a NC sequence (LV-siNC) or ZEB1-AS1-siRNA sequences (LV-siBZEB1-AS1#1 or LV-siBZEB1-AS1#2) were implanted into 4-week-old nude mice. Compared with the LV-siNC group, the tumor size of the LV-siZEB1-AS1 groups was smaller. Simultaneously, the visible number of liver or lung metastases were lower in the LV-siZEB1-AS1 groups (Figure 6A), and the tumor growth rate and weight of the LV-siZEB1-AS1 groups were suppressed (Figures 6B, C). qRT-PCR analysis showed that the transcription levels of ZEB1-AS1 and ZEB1 in the LV-siZEB1-AS1 group were significantly lower than those of the LV-siNC group (Figures 6D, E). Next, we found that both the number of mice with lung or liver metastases and the number of distinct metastatic nodes in the LV-siZEB1-AS1 groups were significantly reduced compared with the control mice (Figures 6F, G). We further verified the above results via H&E staining and further detected the RNA expression quantity of ZEB1 and ZEB1-AS1 in lung or liver metastases (Supplementary Figure S6). Similarly, LV-SiZEB1-AS1 suppressed the proliferation and metastasis ability of BXPC-3 cells in vivo (Supplementary Figures S7 and S8). Overall, these results confirmed the tumorigenic mechanism of ZEB1-AS1 in PC cells.
FIGURE 6
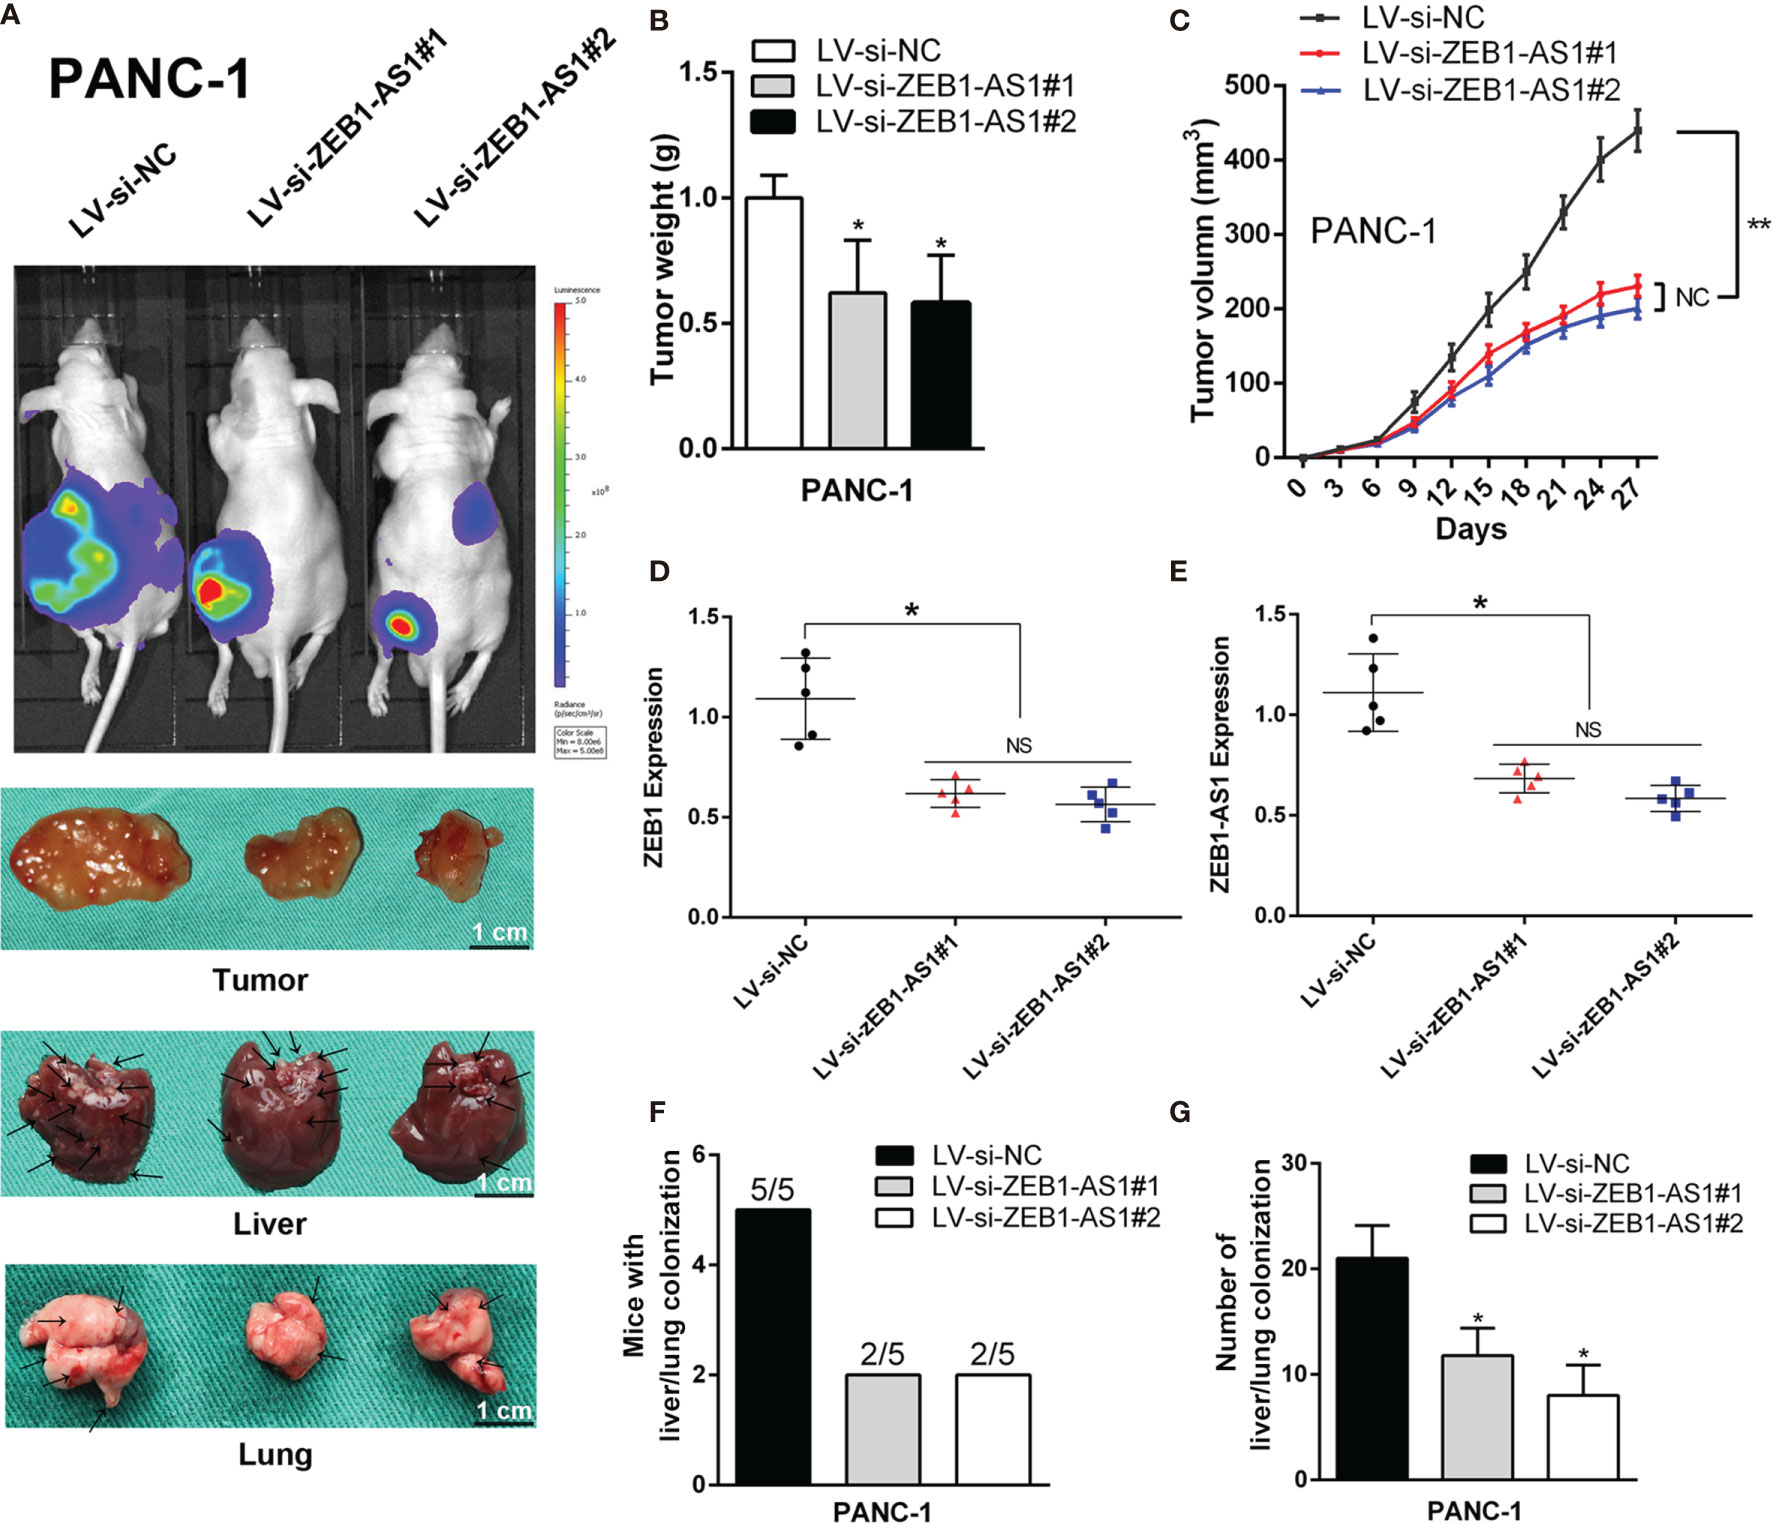
Figure 6 ZEB1-AS1 facilitates the in vivo invasion and proliferation of PANC-1 cells. PANC-1 cells were stably transfected with lentivirus containing si-ZEB1-AS1 sequence. Transfected cells were injected subcutaneously into the right flank of 4-week-old male BALB/c nude mice. (A) After stably transfected, mice were sacrificed after 4 weeks. The fluorescence imaging in vivo demonstrated the subcutaneous tumor, liver, and lung invasion nodules. Arrows indicate the invasion nodules. Scale bars, 1 cm. (B, C) Tumor weight and volume in LV-siNC, LV-si-ZEB1-AS1#1, and LV-si-ZEB1-AS1#2 groups. The tumor volumes were calculated every 3 days (tumor volume = 0.5 × length × width2). (D, E) ZEB1-AS1 and ZEB1 expression was detected in the subcutaneous tumor from LV-si-ZEB1-AS1#1, LV-si-ZEB1-AS1#2, or LV-siNC group. (F) Liver metastasis was measured with the indicated PANC-1 cells. N = 5 mice in each group. (G) The number of visible liver metastases per five sections in each nude mouse. All data were presented as means ± SD of at least three independent experiments. The arrows showed the invasion nodules. Values are significant at *p < 0.05 and **p < 0.01 as indicated. NS means the difference is not significant.
The ZEB1-AS1/ZEB1 Feedback Loop Is Correlated With PC Prognosis
The clinicopathological results showed that the overexpression level of ZEB1-AS1 was positively associated with histological grade, lymphatic invasion, and distant metastasis in PC patients (Table 1). Furthermore, Kaplan-Meier analysis revealed that PC patients with high expression of ZEB1 experienced a shorter overall survival (OS) time than those patients with low ZEB1 expression (Figure 7A). The Kaplan-Meier study also demonstrated a correlation between higher ZEB1-AS1 mRNA expression and shorter OS (Figure 7B). In addition, we found that ZEB1-AS1 and ZEB1 expression suggested a positive relationship in 119 patients with PC, which was assessed via Pearson’s correlation analysis or Chi-square test (Figures 7C, D). Moreover, the survival analysis indicated that low expression levels of both ZEB1 and ZEB1-AS1 were most beneficial to the OS of patients followed by the high expression level of either ZEB1 or ZEB1-AS1, while overexpression levels of both ZEB1 and ZEB1-AS1 had the worst effect (Figure 7E). We further performed a ROC curve analysis of the predictive value for OS. The results confirmed that the combination of ZEB1 and ZEB1-AS1 showed a preferable additive value (Figure 7F). Immunohistochemical (IHC) assays demonstrated that the protein expression of both ZEB1 and HIF-1α positively correlated with the expression levels of ZEB1-AS1 (Figures 7G, H). TCGA data from ChIPBase V2.0 (36) revealed that HIF-1α expression had a positive relationship with ZEB1 levels in PC (Figure 7I). Therefore, these results suggested that HIF-1α/ZEB1-AS1/ZEB1/HDAC1 signaling is involved in the oncogenesis and metastasis of PC (Figure 7J).
FIGURE 7
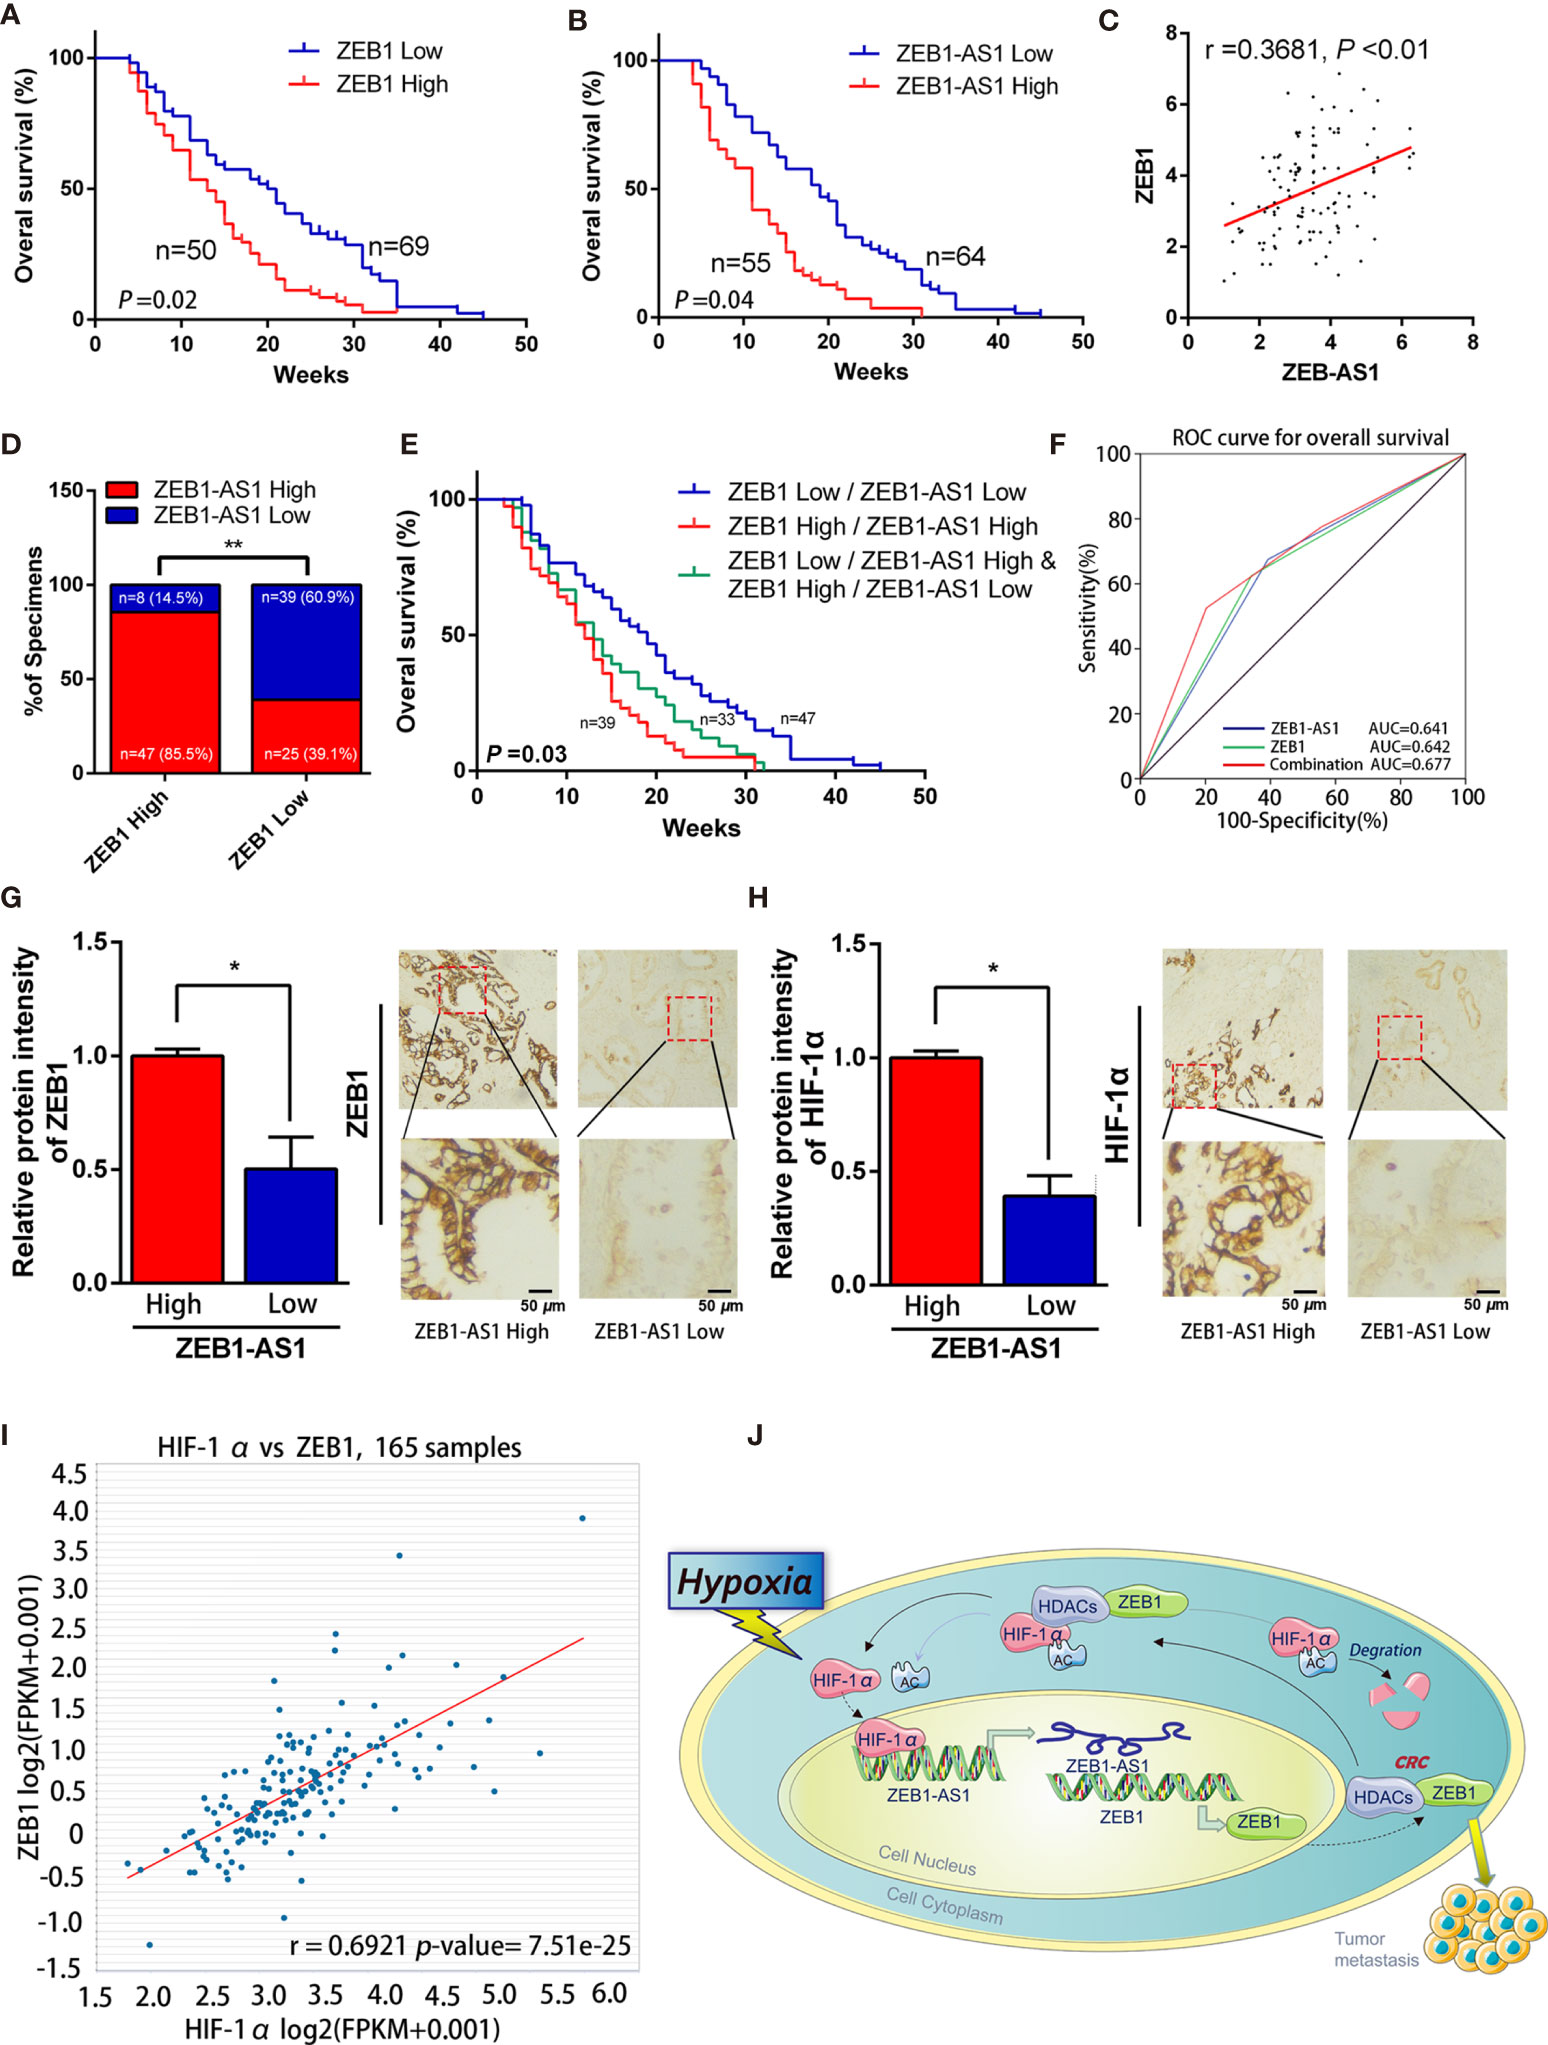
Figure 7 ZEB1-AS1 was upregulated in PC and correlates with poor clinical outcome. (A) Overall survival of 119 patients with PC was analyzed by generation of Kaplan-Meier curves. The low or high ZEB1 groups are below or above the 50th percentile of ZEB1 expression, respectively. (B) Overall survival of 119 patients with PC was analyzed by generation of Kaplan-Meier curves. The low or high ZEB1-AS1 groups are below or above the 50th percentile of ZEB1-AS1 expression, respectively. (C) Pearson’s correlation analysis was applied to confirm the relationship of the expression between ZEB1-AS1 and ZEB1 in 119 patients with PC. (D) Correlation between ZEB1-AS1 and ZEB1 in specimens of patients with PC were analyzed by Chi-square test. (E) Kaplan-Meier analysis of overall survival for patients with 119 PC patients based on the number of upregulated molecular markers including ZEB1-AS1 and ZEB1. Patients were divided into three groups based on the expression of ZEB1-AS1 and ZEB1 at RNA levels. (F) ROC curve analysis for overall survival for ZEB1-AS1 (AUC = 0.641 (95% CI, 0.536–0.746), p = 0.012), ZEB1 (AUC = 0.642 (95% CI, 0.536–0.748), p = 0.012) as individual biomarkers or for the combined panel (AUC = 0.677 (95% CI, 0.572–0.781), p = 0.002). Area under the curve (AUC) was measured to assess predictive capability; 95% CI, 95% confidence interval. (G, H) ZEB1 and HIF-1α expression in high or low levels of ZEB1-AS1 from tissues of PC patients analyzed by IHC. Histogram showed the relative protein intensity via IHC scores (left). Representative images of stained sections were confirmed (right). (I) Correlation of ZEB1 and HIF-1α RNA expression was analyzed from the TCGA pancreatic cancer dataset through applying online database ChIPBase. (J) A graphical representation of the proposed mechanisms, hypoxia induced ZEB1-AS1 expression which promotes ZEB1 upregulation and then further cause malignant progression of PC cells.
Discussion
Although thousands of lncRNAs have been explored, the full functional mechanism of most molecules is still unclear, especially in pancreatic cancer. Many studies have reported that ZEB1-AS1 correlates with bladder cancer, prostate cancer, gastric cancer, and colorectal cancer (37–40). Nonetheless, the connection between ZEB1-AS1 and PC is rarely reported. In addition, overexpression of ZEB1-AS1 is related to malignant characteristics and short overall survival (41). In PC patients, high expression of ZEB1-AS1 was usually positively related to histological grade, TNM stage, lymphatic invasion, vascular invasion, distant metastasis, and short overall survival time (42). Thus, these data demonstrated that ZEB1-AS1 may promote oncogenesis and metastasis of PC.
As ZEB1-AS1 is adjacent to ZEB1, which is a metastasis-related protein in various tumors (43), ZEB1 is a transcription factor that induces EMT and plays a crucial role in the progression of DNA damage, cancer cell differentiation, metastasis, and chemoresistance in human cancers (26, 44, 45). It is well known that ZEB1-AS1 is an antisense lncRNA, which is derived from the promoter region of ZEB1. ZEB1-AS1 induced ZEB1 expression in direct or indirect way in different cancers, and it is demonstrated to be closely related to the unfavorable prognosis of malignant tumors such as prostatic carcinoma (38), glioma (46), and hepatocellular carcinoma (47). However, Liu et al. reported that ZEB1 contrarily inhibited ZEB1-AS1 expressions in osteosarcoma cell (48). Now, this leads us to ask: how ZEB1-AS1 regulates ZEB1 in PC unprecedentedly?
The present study suspected weather the ZEB1 was regulated by ZEB1-AS1 at the transcriptional level in PC, and we wonder if it is possible to establish a positive relationship between ZEB1 and ZEB1-AS1. Targeting the lncRNA/ZEB1 pathway may be a potential strategy for clinical treatments of PC.
According to recent studies, the hypoxia microenvironment of PC, owing to unlimited proliferation of tumor cells and aberrant blood supply, which increase oxygen consumption and generate a characteristic feature of the microenvironment of solid tumors (49). Compared with the areas of well-oxygenated tumors, hypoxia areas within PC are closely associated with tumor malignancy and with poor prognosis (50). Under hypoxia pressure, hypoxia-inducible factors (HIFs) is a chief regulator, which are composed of unstable subunits (HIF-α and HIF-β) and accumulates to abet cell resistance to temporary stress (51). Additionally, signaling routing among hypoxia-induced HIFs facilitate aggressive malignancy and treatment resistance in PC cells. Although studies of the relationship between hypoxia conditions and metastasis in PC are still in the early stage, hypoxia microenvironment has great potential as a target of pancreatic cancer to enhance tumor therapies in the future.
Recent studies have demonstrated that lncRNAs are affected under hypoxia conditions and are regulated by HIF-1α to a great extent. For example, lncRNA RP11 is promoted by hypoxia/HIF-1α and is vital for metastasis and EMT (52). Song et al. reported that hypoxia-induced lncRNA-AC020978 facilitates tumorigenesis and glycolytic metabolism via the PKM2/HIF-1α axis in nonsmall cell lung cancer (53). Similarly, our previous studies suggested that HIF-1α-induced lncRNA NUTF2P3-001 reduces miR-3923/KRAS expression, leading to metastasis of PC (11). In reaction to hypoxia, HIF-1α, which indicates HIF-1 activity, plays a major role in regulating downstream target genes (54). This active transcription factor binds to the HRE in the promotor region, thereby inducing downstream gene expression (55). Because the gene sequence analysis was available in the NCBI database, we are prone to collect potential HRE location in the promoter of ZEB1-AS1. Thus, it takes further experiments to prove the theory and to demonstrate the possibility of a pathway for hypoxia-induced ZEB1 regulation in PC, which is probably mediated by ZEB1-AS1.
In our previous study (12), we revealed that MTA2TR promotes the protein stability of HIF-1α through MTA2-promoted deacetylation. However, the potential regulatory mechanism of HIF-1α deacetylation is still unknown. Recent studies have verified that HIF-1α stability is modulated through VHL ubiquitination complex-mediated proteasomal degradation (56) and confirmed that HIF-1α stability is further managed by acetylation, which is regulated via the ARD1 gene (57) or the HDACs (58). In addition, our previous reports indicated that MIIP is an anticancer biomarker for the oncogenesis of PC, and we also affirmed that MIIP increases acetylation and induces HIF-1α protein degradation, which is reversed by HDAC6 overexpression (19).
As ZEB1-AS1 regulates ZEB1 expression, we investigated whether ZEB1-AS1 is involved in the protein stabilization of HIF-1α in hypoxia medium. Schneider et al. demonstrated that the ZEB1-HDAC axis is involved in EMT process (59). ZEB1 is a repressor of the CDH1 gene in pancreatic cancer, and the CDH1 gene is epigenetically silenced during the dynamic EMT process. One crucial pathway involves the transcriptional repressor, ZEB1, which recruits HDAC1- and/or HDAC2-containing CRCs to suppress transcription of the CDH1 gene. Aghdassi et al. also indicated that HDAC inhibitors or ZEB1 knockdown plays a role in antiproliferative and antimigratory characteristics in PC cells (60). In addition, our previous study demonstrated that HIF-1α/HADC1 transcriptionally restricts the expression of miR-548an under hypoxia conditions, leading to the progression of PC (61). We speculated that the potential connection among ZEB1, HDACs, and HIF-1α may regulate HIF-1α stability by modulating HDAC activity. Thus, these results strongly suggested that ZEB1 inhibits acetylation of HIF-1α by promoting the deacetylation activity of HDACs, thereby accelerating HIF-1α stabilization.
In conclusion, the present study demonstrated the complex involvement of the HIF-1α/ZEB1-AS1/ZEB1 pathway in adjusting the cellular response to the hypoxia environment of PC. Our findings suggested that ZEB1-AS1 may be a biological target for the clinical detection and treatment of PC.
Data Availability Statement
The datasets presented in this study can be found in online repositories. The names of the repository/repositories and accession number(s) can be found in the article/Supplementary Material.
Ethics Statement
The studies involving human participants were reviewed and approved by the Ethics Committee of Wannan Medical College. The patients/participants provided their written informed consent to participate in this study. The animal study was reviewed and approved by the Institutional Committee on Animal Care of Wannan Medical College.
Author Contributions
YJ, ZMZ, and QY conceived and coordinated the study and drafted and revised the manuscript. XH and QK performed the cell culture and some cellular experiments. HH and ZZ performed the molecular experiments. YJ, YX, and HS analyzed the data. All authors contributed to the article and approved the submitted version.
Funding
The authors would like to acknowledge the grant support from the National Natural Science Foundation of China (81902515) and the University Natural Science Research Project of Anhui Province (KJ2019A0429 and KJ2019A0412).
Conflict of Interest
The authors declare that the research was conducted in the absence of any commercial or financial relationships that could be construed as a potential conflict of interest.
Publisher’s Note
All claims expressed in this article are solely those of the authors and do not necessarily represent those of their affiliated organizations, or those of the publisher, the editors and the reviewers. Any product that may be evaluated in this article, or claim that may be made by its manufacturer, is not guaranteed or endorsed by the publisher.
Supplementary Material
The Supplementary Material for this article can be found online at: https://www.frontiersin.org/articles/10.3389/fonc.2021.761979/full#supplementary-material
Supplementary Figure 1 | The sequence, secondary structure and coding capacity of ZEB1-AS1. (A) The sequence and gene loci of lncRNA-ZEB1-AS1. (B) Prediction of ZEB1-AS1 secondary structure according to minimum free energy (MFE) and relative partition function from RNAfold web server. (C, D) The transcript’s noncoding nature was figured out by coding potential assessment tool (CPAT) and coding potential calculator (CPC). Results suggested that ZEB1-AS1 is more likely to be a noncoding sequence than a coding one.
Supplementary Figure 2 | ZEB1-AS1 overexpression impedes the proliferation and invasion in PC cell. (A) ZEB1-AS1 expression was recorded via qRT-PCR after the BXPC-3/PANC-1 cells transfected with a negative control plasmid (NC) or one encoding human full-length ZEB1-AS1. (B) Power of Proliferation in BXPC-3/PANC-1 cells, which overexpressing ZEB1-AS1 or control were detected by MTT assays for 5 days. (C) Migration capacity was evaluated via wound healing assay. Representative graphics (left) and relative wound size were analyzed (right). (D) Transwell assay (left) was designed to investigate the invasion extent of those transfected BXPC-3/PANC-1 cells. Mean values of five random micro areas were analyzed. The proportion of invaded PC cells number was measured through histogram (right). Data processing and statistical analysis used SPSS21.0 statistical analysis package and quantitative data were manifested as means ± SD of at least three experiments independently. Values with statistic difference are significant at *P < 0.05 and **P < 0.01 as marked significance.
Supplementary Figure 3 | The expression of ZEB1 and ZEB1-AS1 under normoxia/hypoxia conditions from 0 - 48 hours of culture. (A) Expression of ZEB1 in BxPC-3/PANC-1 cells cultured with normoxia medium (0 h, 24 h and 48 h) were evaluated at the mRNA (left) and protein (right) levels by qRT-PCR and Western blot analysis, respectively. (B, C) Indeed, we observed that under hypoxia conditions the levels of ZEB1-AS1 statistically increase when compared with control. However, it does not change under normoxia conditions. Data processing and statistical analysis used SPSS21.0 statistical analysis package and quantitative data were manifested as means ± SD of at least three experiments independently. Values with statistic difference are significant at *P < 0.05 and **P < 0.01 as marked significance.
Supplementary Figure 4 | HDAC1 is called for ZEB1-mediated HIF-1α deacetylation during hypoxia. (A) After PANC-1 cells were cultivated during normoxia/hypoxia medium, Co-IP was executed by the usage of an anti–HIF-1α or anti-HDAC1 antibody. The protein levels of HIF-1α and HDAC1 were certified via western blot analysis. (B) Following the treatment during hypoxia, protein level of HIF-1α in PANC-1 cells treated with histone deacetylase inhibitor - trichostatin A (TSA) and (or) ZEB1 inhibition (si-ZEB1) were recorded by WB. (C) WB analysis manifested plasmid pcDNA3-ZEB1 (ZEB1) reinforced HIF-1α level under hypoxia, which was reverted via TSA. Data processing and statistical analysis used SPSS21.0 statistical analysis package and quantitative data were manifested as means ± SD of at least three experiments independently. Values with statistic difference are significant at *P < 0.05 and **P < 0.01 as marked significance.
Supplementary Figure 5 | ZEB1 promotes deacetylation of HIF-1α via inhibiting acetylase capacity of HDAC1. (A) After treatment during hypoxia medium, the expression of HIF-1α was detected via WB analysis of PANC-1 cells transfected with pcDNA3-HDAC1 and (or) ZEB1 inhibition (si-ZEB1). (B) HDAC1 knockdown restrained HIF-1α expression, which was increased by plasmid pcDNA3-ZEB1 (ZEB1). (C) Following treated with MG132, analysis of Co-IP was conducted applying an anti-HIF-1α, anti-acetylation in PANC-1 cells treated with pcDNA3-ZEB1 (ZEB1) or TSA. Levels of HIF-1α, acetylated HIF-1α proteins were calculated by WB analysis. (D) Co-IP displayed that the TSA-induced HIF-1α acetylation was enhanced by ZEB1 inhibition (si-ZEB1) through using MG132. GAPDH played the role of endogenous control. All data were presented at lowst three independent experiments.
Supplementary Figure 6 | ZEB1-AS1 promotes the PC metastasis of BXPC-3 cells in mice. From the point of the pathology, H&E images of liver extracted from LV-si-ZEB1-AS1#1, LV-si-ZEB1-AS1#2 or LV-siNC group. Scale bars, 100 μm. (B) RNA expression quantity of ZEB1 and ZEB1-AS1 were measured from the liver metastases. (C) Applying H&E-stained images for description of lung tissue extracted from LV-si-ZEB1-AS1#1, LV-si-ZEB1-AS1#2 or LV-siNC group. The scale bars displayed 100 μm in the diagrams. (D) RNA expression level of ZEB1 and ZEB1-AS1 were detected from the lung metastases. quantitative data were manifested as means ± SD of at least three experiments independently. Values with statistic difference are significant at *P < 0.05 and **P < 0.01 as marked significance.
Supplementary Figure 7 | ZEB1-AS1 promotes the in vivo invasion ability and proliferation capacity of BXPC-3 cells. Following si-ZEB1-AS1 sequence lentivirus were stably transfected in PANC-1 cells, we injected transfected BXPC-3 cells into the 4-week-old nude mice (male BALB/c) at right flank subcutaneously. (A) After stably transfected and 4 weeks feeding, mice were sacrificed for further experiments. The fluorescence imaging in vivo demonstrated the subcutaneous tumor, liver and lung invasion nodules. Arrows showed the invasion nodules. Scale bars is 1 cm in the diagrams. (B, C) Tumor weight and volume in LV-siNC, LV-si-ZEB1-AS1#1 and LV-si- ZEB1-AS1#2 groups. We recorded and calculated the tumor volumes every 3 days via the equation: volume = 0.5×length×width2). (D, E) The expression of ZEB1-AS1 and ZEB1 were perceived in the subcutaneous tumor from LV-si-ZEB1-AS1#1, LV-si-ZEB1-AS1#2 or LV-siNC group. (F) Liver and lung metastasis was recorded of the indicated BXPC-3 cells. Each group contained 5 mice in this study. (G) The number of visible liver/lung metastases was measured in mouse. Data processing and statistical analysis used SPSS21.0 statistical analysis package and quantitative data were manifested as means ± SD of at least three experiments independently. Values with statistic difference are significant at *P < 0.05 and **P < 0.01 as marked significance.
Supplementary Figure 8 | ZEB1-AS1 promotes the PC metastasis of PANC-1 cells in mice. H&E images of liver extracted from LV-si-ZEB1-AS1#1, LV-si-ZEB1-AS1#2 or LV-siNC group of PANC-1 cells in mice. Scale bars, 100 μm. (B) The ZEB1 and ZEB1-AS1 expression were measured via qRT-PCR from the liver metastases. (C) Detecting H&E-stained images for lung tissue extracted from LV-si-ZEB1-AS1#1, LV-si-ZEB1-AS1#2 or LV-siNC group. The scale bars displayed 100 μm in the diagrams. (D) RNA expression level of ZEB1 and ZEB1-AS1 were evaluated from the lung metastases. quantitative data were manifested as means ± SD of at least three experiments independently. Values with statistic difference are significant at *P < 0.05 and **P < 0.01 as marked significance.
References
2. Siegel RL, Miller KD. Cancer Statistics, 2020. CA Cancer J Clin (2020) 70: (1):7–30. doi: 10.3322/caac.21590
3. Huang J, Lok V, Ngai CH, Zhang L, Yuan J, Lao XQ, et al. Worldwide Burden of, Risk Factors for, and Trends in Pancreatic Cancer. Gastroenterology (2021) 160(3):744–54. doi: 10.1053/j.gastro.2020.10.007
4. Mizrahi JD, Surana R, Valle JW, Shroff RT. Pancreatic Cancer. Lancet (London England) (2020) 395(10242):2008–20. doi: 10.1016/s0140-6736(20)30974-0
5. Ponting CP, Oliver PL, Reik W. Evolution and Functions of Long Noncoding RNAs. Cell (2009) 136(4):629–41. doi: 10.1016/j.cell.2009.02.006
6. Clark MB, Johnston RL, Inostroza-Ponta M, Fox AH, Fortini E, Moscato P, et al. Genome-Wide Analysis of Long Noncoding RNA Stability. Genome Res (2012) 22(5):885–98. doi: 10.1101/gr.131037.111
7. Takahashi K, Ota Y, Kogure T, Suzuki Y, Iwamoto H, Yamakita K, et al. Circulating Extracellular Vesicle-Encapsulated HULC Is a Potential Biomarker for Human Pancreatic Cancer. Cancer Sci (2020) 111(1):98–111. doi: 10.1111/cas.14232
8. Liu M, Zhong J, Zeng Z, Huang K, Ye Z, Deng S, et al. Hypoxia-Induced Feedback of HIF-1α and lncRNA-CF129 Contributes to Pancreatic Cancer Progression Through Stabilization of P53 Protein. Theranostics (2019) 9(16):4795–810. doi: 10.7150/thno.30988
9. Deng SJ, Chen HY, Zeng Z, Deng S, Zhu S, Ye Z, et al. Nutrient Stress-Dysregulated Antisense lncRNA GLS-AS Impairs GLS-Mediated Metabolism and Represses Pancreatic Cancer Progression. Cancer Res (2019) 79(7):1398–412. doi: 10.1158/0008-5472.can-18-0419
10. Hu Y, Wang F, Xu F, Fang K, Fang Z, Shuai X, et al. A Reciprocal Feedback of Myc and lncRNA MTSS1-AS Contributes to Extracellular Acidity-Promoted Metastasis of Pancreatic Cancer. Theranostics (2020) 10(22):10120–40. doi: 10.7150/thno.49147
11. Li X, Deng SJ, Zhu S, Jin Y, Cui SP, Chen JY, et al. Hypoxia-Induced lncRNA-NUTF2P3-001 Contributes to Tumorigenesis of Pancreatic Cancer by Derepressing the miR-3923/KRAS Pathway. Oncotarget (2016) 7(5):6000–14. doi: 10.18632/oncotarget.6830
12. Zeng Z, Xu FY, Zheng H, Cheng P, Chen QY, Ye Z, et al. lncRNA-MTA2TR Functions as a Promoter in Pancreatic Cancer via Driving Deacetylation-Dependent Accumulation of HIF-1α. Theranostics (2019) 9(18):5298–314. doi: 10.7150/thno.34559
14. Hinshaw DC, Shevde LA. The Tumor Microenvironment Innately Modulates Cancer Progression. Cancer Res (2019) 79(18):4557–66. doi: 10.1158/0008-5472.CAN-18-3962
15. Tao J, Yang G, Zhou W, Qiu J, Chen G, Luo W, et al. Targeting Hypoxic Tumor Microenvironment in Pancreatic Cancer. J Hematol Oncol (2021) 14(1):14. doi: 10.1186/s13045-020-01030-w
16. Jung HY, Fattet L, Yang J. Molecular Pathways: Linking Tumor Microenvironment to Epithelial-Mesenchymal Transition in Metastasis. Clin Cancer Res (2015) 21(5):962–8. doi: 10.1158/1078-0432.CCR-13-3173
17. Shukla SK, Purohit V, Mehla K, Gunda V, Chaika NV, Vernucci E, et al. MUC1 and HIF-1alpha Signaling Crosstalk Induces Anabolic Glucose Metabolism to Impart Gemcitabine Resistance to Pancreatic Cancer. Cancer Cell (2017) 32(1):71–87.e7. doi: 10.1016/j.ccell.2017.06.004
18. Jin X, Dai L, Ma Y, Wang J, Liu Z. Implications of HIF-1α in the Tumorigenesis and Progression of Pancreatic Cancer. Cancer Cell Int (2020) 20:273. doi: 10.1186/s12935-020-01370-0
19. Niu Y, Jin Y, Deng SC, Deng SJ, Zhu S, Liu Y, et al. MiRNA-646-Mediated Reciprocal Repression Between HIF-1α and MIIP Contributes to Tumorigenesis of Pancreatic Cancer. Oncogene (2018) 37(13):1743–58. doi: 10.1038/s41388-017-0082-2
20. Huan L, Guo T, Wu Y, Xu L, Huang S, Xu Y, et al. Hypoxia Induced LUCAT1/PTBP1 Axis Modulates Cancer Cell Viability and Chemotherapy Response. Mol Cancer (2020) 19(1):11. doi: 10.1186/s12943-019-1122-z
21. Li H, Wang X, Wen C, Huo Z, Wang W, Zhan Q, et al. Long Noncoding RNA NORAD, a Novel Competing Endogenous RNA, Enhances the Hypoxia-Induced Epithelial-Mesenchymal Transition to Promote Metastasis in Pancreatic Cancer. Mol Cancer (2017) 16(1):169. doi: 10.1186/s12943-017-0738-0
22. Li Y, Seto E. HDACs and HDAC Inhibitors in Cancer Development and Therapy. Cold Spring Harb Perspect Med (2016) 6(10):a026831. doi: 10.1101/cshperspect.a026831
23. Zhang H, Ji L, Yang Y, Zhang X, Gang Y, Bai L. The Role of HDACs and HDACi in Cartilage and Osteoarthritis. Front Cell Dev Biol (2020) 8:560117. doi: 10.3389/fcell.2020.560117
24. Schoepflin ZR, Shapiro IM, Risbud MV. Class I and IIa HDACs Mediate HIF-1α Stability Through PHD2-Dependent Mechanism, While HDAC6, a Class IIb Member, Promotes HIF-1α Transcriptional Activity in Nucleus Pulposus Cells of the Intervertebral Disc. J Bone Miner Res (2016) 31(6):1287–99. doi: 10.1002/jbmr.2787
25. Zhu S, Deng S, He C, Liu M, Chen H, Zeng Z, et al. Reciprocal Loop of Hypoxia-Inducible Factor-1α (HIF-1α) and Metastasis-Associated Protein 2 (MTA2) Contributes to the Progression of Pancreatic Carcinoma by Suppressing E-Cadherin Transcription. J Pathol (2018) 245(3):349–60. doi: 10.1002/path.5089
26. Krebs AM, Mitschke J, Lasierra Losada M, Schmalhofer O, Boerries M, Busch H, et al. The EMT-Activator Zeb1 Is a Key Factor for Cell Plasticity and Promotes Metastasis in Pancreatic Cancer. Nat Cell Biol (2017) 19(5):518–29. doi: 10.1038/ncb3513
27. Cortés M, Sanchez-Moral L, de Barrios O, Fernández-Aceñero MJ, Martínez-Campanario MC, Esteve-Codina A, et al. Tumor-Associated Macrophages (TAMs) Depend on ZEB1 for Their Cancer-Promoting Roles. EMBO J (2017) 36(22):3336–55. doi: 10.15252/embj.201797345
28. Liu M, Zhang Y, Yang J, Zhan H, Zhou Z, Jiang Y, et al. Zinc-Dependent Regulation of ZEB1 and YAP1 Coactivation Promotes Epithelial-Mesenchymal Transition Plasticity and Metastasis in Pancreatic Cancer. Gastroenterology (2021) 160(5):1771–83. doi: 10.1053/j.gastro.2020.12.077
29. Wei R, Penso NEC, Hackman RM, Wang Y, Mackenzie GG. Epigallocatechin-3-Gallate (EGCG) Suppresses Pancreatic Cancer Cell Growth, Invasion, and Migration Partly Through the Inhibition of Akt Pathway and Epithelial-Mesenchymal Transition: Enhanced Efficacy When Combined With Gemcitabine. Nutrients (2019) 11(8):1856. doi: 10.3390/nu11081856
30. Lu W, Zhang H, Niu Y, Wu Y, Sun W, Li H, et al. Linc00673 Regulated Non-Small Cell Lung Cancer Proliferation, Migration, Invasion and Epithelial Mesenchymal Transition by Sponging miR-150-5p. Mol Cancer (2017) 16(1):118. doi: 10.1186/s12943-017-0685-9
31. Tempero MA. NCCN Guidelines Updates: Pancreatic Cancer. J Natl Compr Cancer Netw: JNCCN (2019) 17(5.5):603–5. doi: 10.6004/jnccn.2019.5007
32. Wu D, Yotnda P. Induction and Testing of Hypoxia in Cell Culture. J Vis Exp (2011) 54):2899. doi: 10.3791/2899
33. Cox WG, Singer VL. Fluorescent DNA Hybridization Probe Preparation Using Amine Modification and Reactive Dye Coupling. BioTechniques (2004) 36(1):114–22. doi: 10.2144/04361rr02
34. Kosman D, Mizutani CM, Lemons D, Cox WG, McGinnis W, Bier E. Multiplex Detection of RNA Expression in Drosophila Embryos. Sci (New York NY) (2004) 305(5685):846. doi: 10.1126/science.1099247
35. Obuchowski NA, Bullen JA. Receiver Operating Characteristic (ROC) Curves: Review of Methods With Applications in Diagnostic Medicine. Phys Med Biol (2018) 63(7):07tr1. doi: 10.1088/1361-6560/aab4b1
36. Zhou KR, Liu S, Sun WJ, Zheng LL, Zhou H, Yang JH, et al. ChIPBase V2.0: Decoding Transcriptional Regulatory Networks of Non-Coding RNAs and Protein-Coding Genes From ChIP-Seq Data. Nucleic Acids Res (2017) 45(D1):D43–50. doi: 10.1093/nar/gkw965
37. Lin J, Zhan Y, Liu Y, Chen Z, Liang J, Li W, et al. Increased Expression of ZEB1-AS1 Correlates With Higher Histopathological Grade and Promotes Tumorigenesis in Bladder Cancer. Oncotarget (2017) 8(15):24202–12. doi: 10.18632/oncotarget.15527
38. Su W, Xu M, Chen X, Chen N, Gong J, Nie L, et al. Long Noncoding RNA ZEB1-AS1 Epigenetically Regulates the Expressions of ZEB1 and Downstream Molecules in Prostate Cancer. Mol Cancer (2017) 16(1):142. doi: 10.1186/s12943-017-0711-y
39. Li Y, Wen X, Wang L, Sun X, Ma H, Fu Z, et al. lncRNA ZEB1-AS1 Predicts Unfavorable Prognosis in Gastric Cancer. Surg Oncol (2017) 26(4):527–34. doi: 10.1016/j.suronc.2017.09.008
40. Jin Z, Chen B. lncRNA ZEB1-AS1 Regulates Colorectal Cancer Cells by MiR-205/YAP1 Axis. Open Med (Wars) (2020) 15:175–84. doi: 10.1515/med-2020-0026
41. Chen C, Feng Y, Wang X. lncRNA ZEB1-AS1 Expression in Cancer Prognosis: Review and Meta-Analysis. Clin chim Acta Int J Clin Chem (2018) 484:265–71. doi: 10.1016/j.cca.2018.06.007
42. Wei G, Lu T, Shen J, Wang J. lncRNA ZEB1-AS1 Promotes Pancreatic Cancer Progression by Regulating miR-505-3p/TRIB2 Axis. Biochem Biophys Res Commun (2020) 528(4):644–9. doi: 10.1016/j.bbrc.2020.05.105
43. Cheng L, Zhou MY, Gu YJ, Chen L, Wang Y. ZEB1: New Advances in Fibrosis and Cancer. (2021) 476: (4):1643–50. doi: 10.1007/s11010-020-04036-7
44. Zhang P, Wei Y, Wang L, Debeb BG, Yuan Y, Zhang J, et al. ATM-Mediated Stabilization of ZEB1 Promotes DNA Damage Response and Radioresistance Through CHK1. Nat Cell Biol (2014) 16(9):864–75. doi: 10.1038/ncb3013
45. Zhang X, Zhang Z, Zhang Q, Zhang Q, Sun P, Xiang R, et al. ZEB1 Confers Chemotherapeutic Resistance to Breast Cancer by Activating ATM. Cell Death Dis (2018) 9(2):57. doi: 10.1038/s41419-017-0087-3
46. Meng L, Ma P, Cai R, Guan Q, Wang M, Jin B, et al. ZEB1-AS1 Promotes the Tumorigenesis of Glioma Cancer Cells by Modulating the miR-200c/141-ZEB1 Axis. Am J Transl Res (2018) 10(11):3395–412.
47. Li T, Xie J, Shen C, Cheng D, Shi Y, Wu Z, et al. Upregulation of Long Noncoding RNA ZEB1-AS1 Promotes Tumor Metastasis and Predicts Poor Prognosis in Hepatocellular Carcinoma. Oncogene (2016) 35(12):1575–84. doi: 10.1038/onc.2015.223
48. Liu C, Pan C, Cai Y, Wang H. Interplay Between Long Noncoding RNA ZEB1-AS1 and miR-200s Regulates Osteosarcoma Cell Proliferation and Migration. J Cell Biochem (2017) 118(8):2250–60. doi: 10.1002/jcb.25879
49. Hu Q, Qin Y, Ji S, Xu W, Liu W, Sun Q, et al. UHRF1 Promotes Aerobic Glycolysis and Proliferation via Suppression of SIRT4 in Pancreatic Cancer. Cancer Lett (2019) 452:226–36. doi: 10.1016/j.canlet.2019.03.024
50. Qin Y, Zhu W, Xu W, Zhang B, Shi S, Ji S, et al. LSD1 Sustains Pancreatic Cancer Growth via Maintaining HIF1α-Dependent Glycolytic Process. Cancer Lett (2014) 347(2):225–32. doi: 10.1016/j.canlet.2014.02.013
51. Harris AL. Hypoxia–a Key Regulatory Factor in Tumour Growth. Nat Rev Cancer (2002) 2(1):38–47. doi: 10.1038/nrc704
52. Peng PH, Chieh-Yu Lai J, Hsu KW, Wu KJ. Hypoxia-Induced lncRNA RP11-390F4.3 Promotes Epithelial-Mesenchymal Transition (EMT) and Metastasis Through Upregulating EMT Regulators. Cancer Lett (2020) 483:35–45. doi: 10.1016/j.canlet.2020.04.014
53. Hua Q, Mi B, Xu F, Wen J, Zhao L, Liu J, et al. Hypoxia-Induced lncRNA-AC020978 Promotes Proliferation and Glycolytic Metabolism of Non-Small Cell Lung Cancer by Regulating PKM2/HIF-1α Axis. Theranostics (2020) 10(11):4762–78. doi: 10.7150/thno.43839
54. Carmeliet P, Dor Y, Herbert JM, Fukumura D, Brusselmans K, Dewerchin M, et al. Role of HIF-1alpha in Hypoxia-Mediated Apoptosis, Cell Proliferation and Tumour Angiogenesis. Nature (1998) 394(6692):485–90. doi: 10.1038/28867
55. Sokkar P, Sathis V, Ramachandran M. Computational Modeling on the Recognition of the HRE Motif by HIF-1: Molecular Docking and Molecular Dynamics Studies. J Mol Modeling (2012) 18(5):1691–700. doi: 10.1007/s00894-011-1150-0
56. Maxwell PH, Wiesener MS, Chang GW, Clifford SC, Vaux EC, Cockman ME, et al. The Tumour Suppressor Protein VHL Targets Hypoxia-Inducible Factors for Oxygen-Dependent Proteolysis. Nature (1999) 399(6733):271–5. doi: 10.1038/20459
57. Jeong JW, Bae MK, Ahn MY, Kim SH, Sohn TK, Bae MH, et al. Regulation and Destabilization of HIF-1alpha by ARD1-Mediated Acetylation. Cell (2002) 111(5):709–20. doi: 10.1016/s0092-8674(02)01085-1
58. Kim SH, Jeong JW, Park JA, Lee JW, Seo JH, Jung BK, et al. Regulation of the HIF-1alpha Stability by Histone Deacetylases. Oncol Rep (2007) 17(3):647–51. doi: 10.3892/or.17.3.647
59. Schneider G, Kramer OH, Saur DA. ZEB1-HDAC Pathway Enters the Epithelial to Mesenchymal Transition World in Pancreatic Cancer. Gut (2012) 61(3):329–30. doi: 10.1136/gutjnl-2011-301576
60. Aghdassi A, Sendler M, Guenther A, Mayerle J, Behn CO, Heidecke CD, et al. Recruitment of Histone Deacetylases HDAC1 and HDAC2 by the Transcriptional Repressor ZEB1 Downregulates E-Cadherin Expression in Pancreatic Cancer. Gut (2012) 61(3):439–48. doi: 10.1136/gutjnl-2011-300060
Keywords: pancreatic cancer, lncRNA-ZEB1-AS1, Zeb1, HIF-1α, metastasis, hypoxia
Citation: Jin Y, Zhang Z, Yu Q, Zeng Z, Song H, Huang X, Kong Q, Hu H and Xia Y (2021) Positive Reciprocal Feedback of lncRNA ZEB1-AS1 and HIF-1α Contributes to Hypoxia-Promoted Tumorigenesis and Metastasis of Pancreatic Cancer. Front. Oncol. 11:761979. doi: 10.3389/fonc.2021.761979
Received: 23 August 2021; Accepted: 02 November 2021;
Published: 22 November 2021.
Edited by:
Aamir Ahmad, University of Alabama at Birmingham, United StatesReviewed by:
Filipe Pinto, Universidade do Porto, PortugalRoger Chammas, University of São Paulo, Brazil
Copyright © 2021 Jin, Zhang, Yu, Zeng, Song, Huang, Kong, Hu and Xia. This is an open-access article distributed under the terms of the Creative Commons Attribution License (CC BY). The use, distribution or reproduction in other forums is permitted, provided the original author(s) and the copyright owner(s) are credited and that the original publication in this journal is cited, in accordance with accepted academic practice. No use, distribution or reproduction is permitted which does not comply with these terms.
*Correspondence: Yabin Xia, eGlheWFiaW4xOTcxQDE2My5jb20=
†These authors have contributed equally to this work