 Khanh Q. Nguyen
 Corey J. Morris
 John M. Green2
- 1Fisheries and Oceans Canada, St. John's, NL, Canada
- 2Department of Biology, Memorial University of Newfoundland, St. John's, NL, Canada
The Gilbert Bay Marine Protected Area (MPA), Labrador, was created in 2005 to conserve a coastal resident population of Atlantic cod (Gadus morhua). Scientific research and monitoring have been conducted consistently since 1998, and data have been used to assess the health of the Gilbert Bay cod population and provide management advice. This study has two parts: the first part applies a standard quantitative fisheries stock assessment methodology (length-based stock assessment) to provide growth and mortality parameters; and the second part considers all available MPA indicator monitoring data to evaluate which factors contribute most importantly to observed long-term population trends using Bayesian Model Averaging. Model results indicated that Gilbert Bay cod exhibit low growth rates and low natural mortality. It estimated that the protected population decreased from ~39,000 to ~9,000 individuals from 1998 to 2019. Those remaining individuals are mostly sexually immature and <35 cm total length (TL). In the second part of the study, monitoring data, including environmental metrics, annual abundances of cod eggs, pelagic juveniles, demersal juveniles (ages 1–4 years.), adults, and fishery removals, are used to assess which factors contributed most importantly to the observed population trends over time. Commercial cod landings adjacent the MPA boundaries explained 89.2% of the variability in cod egg density and 100% of the changes in adult fish abundance. Environmental conditions had a negligible role in cod population decline. Despite changes in fish community structure within Gilbert Bay, a reduction in fishing mortality on mature Gilbert Bay cod could enable the survival of strong year classes and promote recovery of the Gilbert Bay cod population.
1 Introduction
The Gilbert Bay Marine Protected Area (MPA), Labrador, was created in 2005 to protect a local Atlantic cod (Gadus morhua) population from overfishing (Canada Gazette, 2005). The behavior and survival of Gilbert Bay cod in its coastal habitat indicates that it is locally adapted to its environmental conditions (Green et al., 2023). Furthermore, the Gilbert Bay cod population is genetically discrete and locally adapted based on genomic analysis (Ruzzante et al., 2000; Sinclair-Waters et al., 2018) and therefore contributes importantly to the intraspecific biodiversity of Atlantic cod.
Research on Gilbert Bay cod has been ongoing since 1996 and in 1998 a study was initiated to better understand the biological characteristics of this resident Atlantic cod population (Morris and Green, 2002). Since then consistent annual sampling has been conducted to monitor important aspects of the population, including spawning time and egg production; larval, juvenile and adult abundance; and growth rates of individuals (Morris et al., 2022). Other research has studied the movement patterns of individual fish using both external tags as part of mark-recapture studies and telemetry tracking (Morris and Green, 2014; Morris et al., 2014; Green et al., 2023). During the course of 26 years of research there has been a significant reduction in abundance, and decrease in the size structure, of Gilbert Bay cod (Morris and Green, 2017, 2021). This decline has been attributed to commercial fishing adjacent to the MPA, where a portion of Gilbert Bay cod migrate in summer and mix with Atlantic cod from the northern cod population, the target of the fishery (Morris and Green, 2014, 2017, 2021). The extent to which commercial fishing is the cause of the decline in mature Gilbert Bay cod has been controversial (Morris and Green, 2014, 2017, 2021). It is argued by stakeholders, including the fishing industry, that other factors, such as climate change or predation, could have affected the population.
Measuring changes in a population's abundance and structure, and identifying factors that contribute most importantly to driving population dynamics, can better inform management decision making. Commercial fishing, changing environmental conditions, and changes in the structure of the fish community can all play critical roles in the population dynamics of exploited Atlantic cod stocks (Pedersen et al., 2017). The Gilbert Bay MPA indicator monitoring program includes biological, environmental, and fishery data, which are used in this study to examine the Gilbert Bay cod population and factors affecting it. The first part of this study includes an assessment of the Gilbert Bay cod population to estimate metrics commonly used in fishery management decision making. We use a methodology based on length-frequency catch data (Sparre and Venema, 1998) to estimate model parameters informing biological reference points. This analysis was conducted to better inform the sustainability of fishing activities in a fisheries management context (Froese, 2004; Cope and Punt, 2009) and the degree of uncertainty in the estimation of growth parameters (Mildenberger et al., 2017). The second part of this study investigates which factors best explain trends in the abundance of the Gilbert Bay cod population, based on available indicator data. We consider the role of fishery removals, environmental conditions, and potential impacts of a changing fish community as possible explanations for changes in the Gilbert Bay cod population (e.g., abundance of eggs, pelagic juveniles, and adult individuals). Combined, these analyses identify the most likely factors affecting MPA effectiveness and how a recovery of the Gilbert Bay cod population could be supported.
2 Method
2.1 Study site and data collection
Gilbert Bay is a 20 km long fjord-like inlet located along the coast of southern Labrador and was designated as a Marine Protected Area (MPA) in 2005 to protect its Atlantic cod population (Canada Gazette, 2005). All cod fishing is excluded from the MPA, however some activities such as indigenous harvesting of Arctic charr (Salvelinus aplinus) and Atlantic salmon (Salmo salar) are permitted inside MPA Zones 2 and 3 (Figure 1). Fishing activities inside the MPA are not known to catch significant quantities of Atlantic cod. The Gilbert Bay MPA includes an area of ~60 km2, divided into three zones (Figure 1), for management purposes. Field sampling associated with the study of Gilbert Bay cod is focused in Zone 1B (The Shinneys; Figure 1) because a large and representative number of the Gilbert Bay cod are known to overwinter and spawn in this area (Morris and Green, 2002; Morris et al., 2014). The data collected annually on Gilbert Bay cod as part of the MPA monitoring program, and the methods used, are described by Morris and Green (2014, 2017, 2021) and Morris et al. (2022). Briefly, data are collected on Atlantic cod eggs, pelagic juvenile densities, demersal juvenile year class abundance, and adult abundance. Environmental data include continuous water temperature measurements from moored thermistor probes and annual depth profiling of the water column to measure temperature and salinity. Other environmental data were obtained from long-term weather stations and river monitoring programs maintained by Environment Canada that describe regional environmental conditions in the Gilbert Bay area. Commercial fisheries data were collected by Fisheries and Oceans Canada.
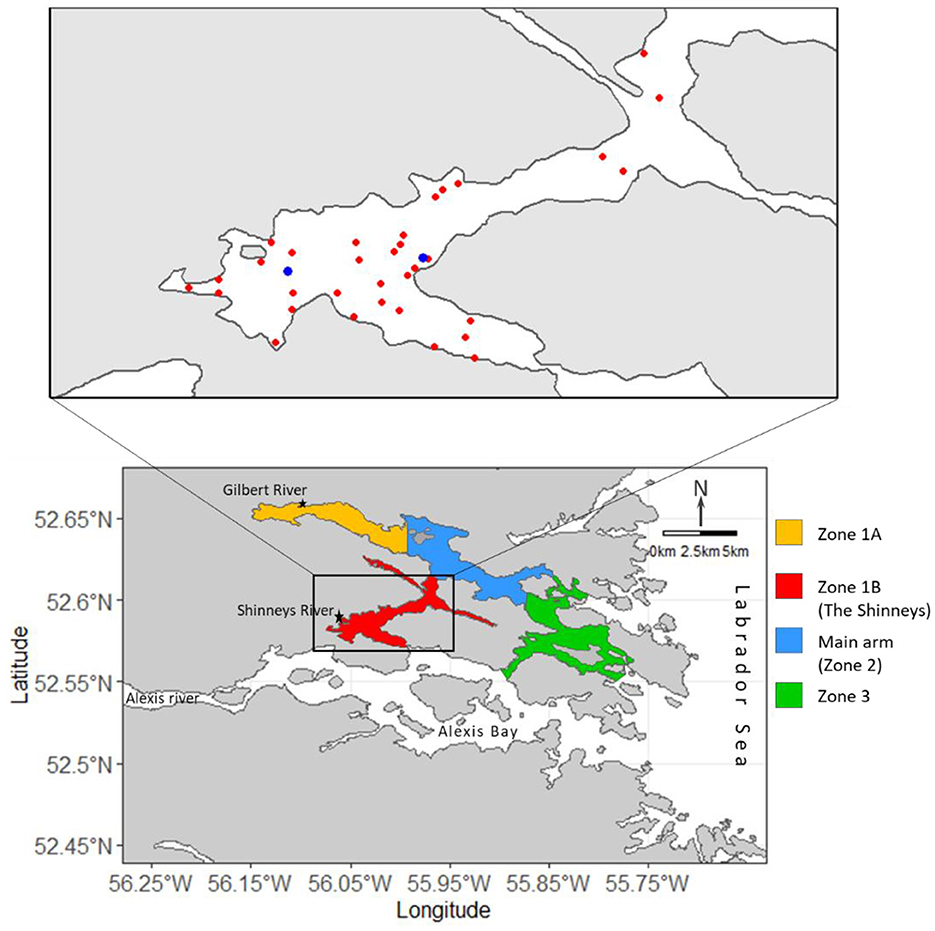
Figure 1. Map of the Gilbert Bay MPA, southeast Labrador. The area inside the black box indicates scientific monitoring locations inside MPA Zone 1B. Each red and blue dot represents angling and temperature logger sites, respectively. Some Gilbert Bay cod migrate from Zone 1B, through zones 2 and 3, and beyond, during summer and return to overwinter.
Cod egg sampling was conducted annually during the spring spawning season (over 10 days during late May-early June) at the same location in The Shinneys (Table 1). At this time of year, the water column in Gilbert Bay is highly stratified, with several meters of relatively fresh water at the surface resulting from the melting snowpack and increased river runoff. A 1 m diameter plankton net with 333 μm mesh was towed horizontally by a small boat (~5–7 m long) at depths of 1–2, 4–5, and 7–8 m. The depth of the net was controlled by boat speed measured using a handheld GPS (Garmin model 60CSx). Typically, replicate tows were carried out at each targeted depth. Tows were 15 min duration and conducted during the morning between 7:30 and 12:00 am local time. Eggs were preserved in a 5% unbuffered formalin/seawater solution and counted using a dissecting microscope upon return to the laboratory. The annual egg density estimate used to compare yearly differences in egg abundance was based on the sample with the highest egg concentration (number per m3; Table 1). The highest egg concentrations are sampled at the pycnocline because cod eggs float in the underlying saltier water but sink in the overlying fresh water. Typically, the highest concentrations of eggs were sampled at a depth of 4–5 m, however, occasionally higher egg densities were sampled at a slightly deeper depth (7–8 m). Plankton tows conducted near the pycnocline, and having the highest concentrations of cod eggs, were expected to provide the most consistent estimate of annual egg abundance. The same sampling method and net was used to collect pelagic juveniles, but only near-surface tows were made over several days in early August (Table 1). During this summer period, after the spring freshet is completed, the water column is no longer stratified with a strong surface freshwater layer and pelagic juvenile cod are sampled near the surface. The density of juveniles was defined as the number of individuals per plankton tow.
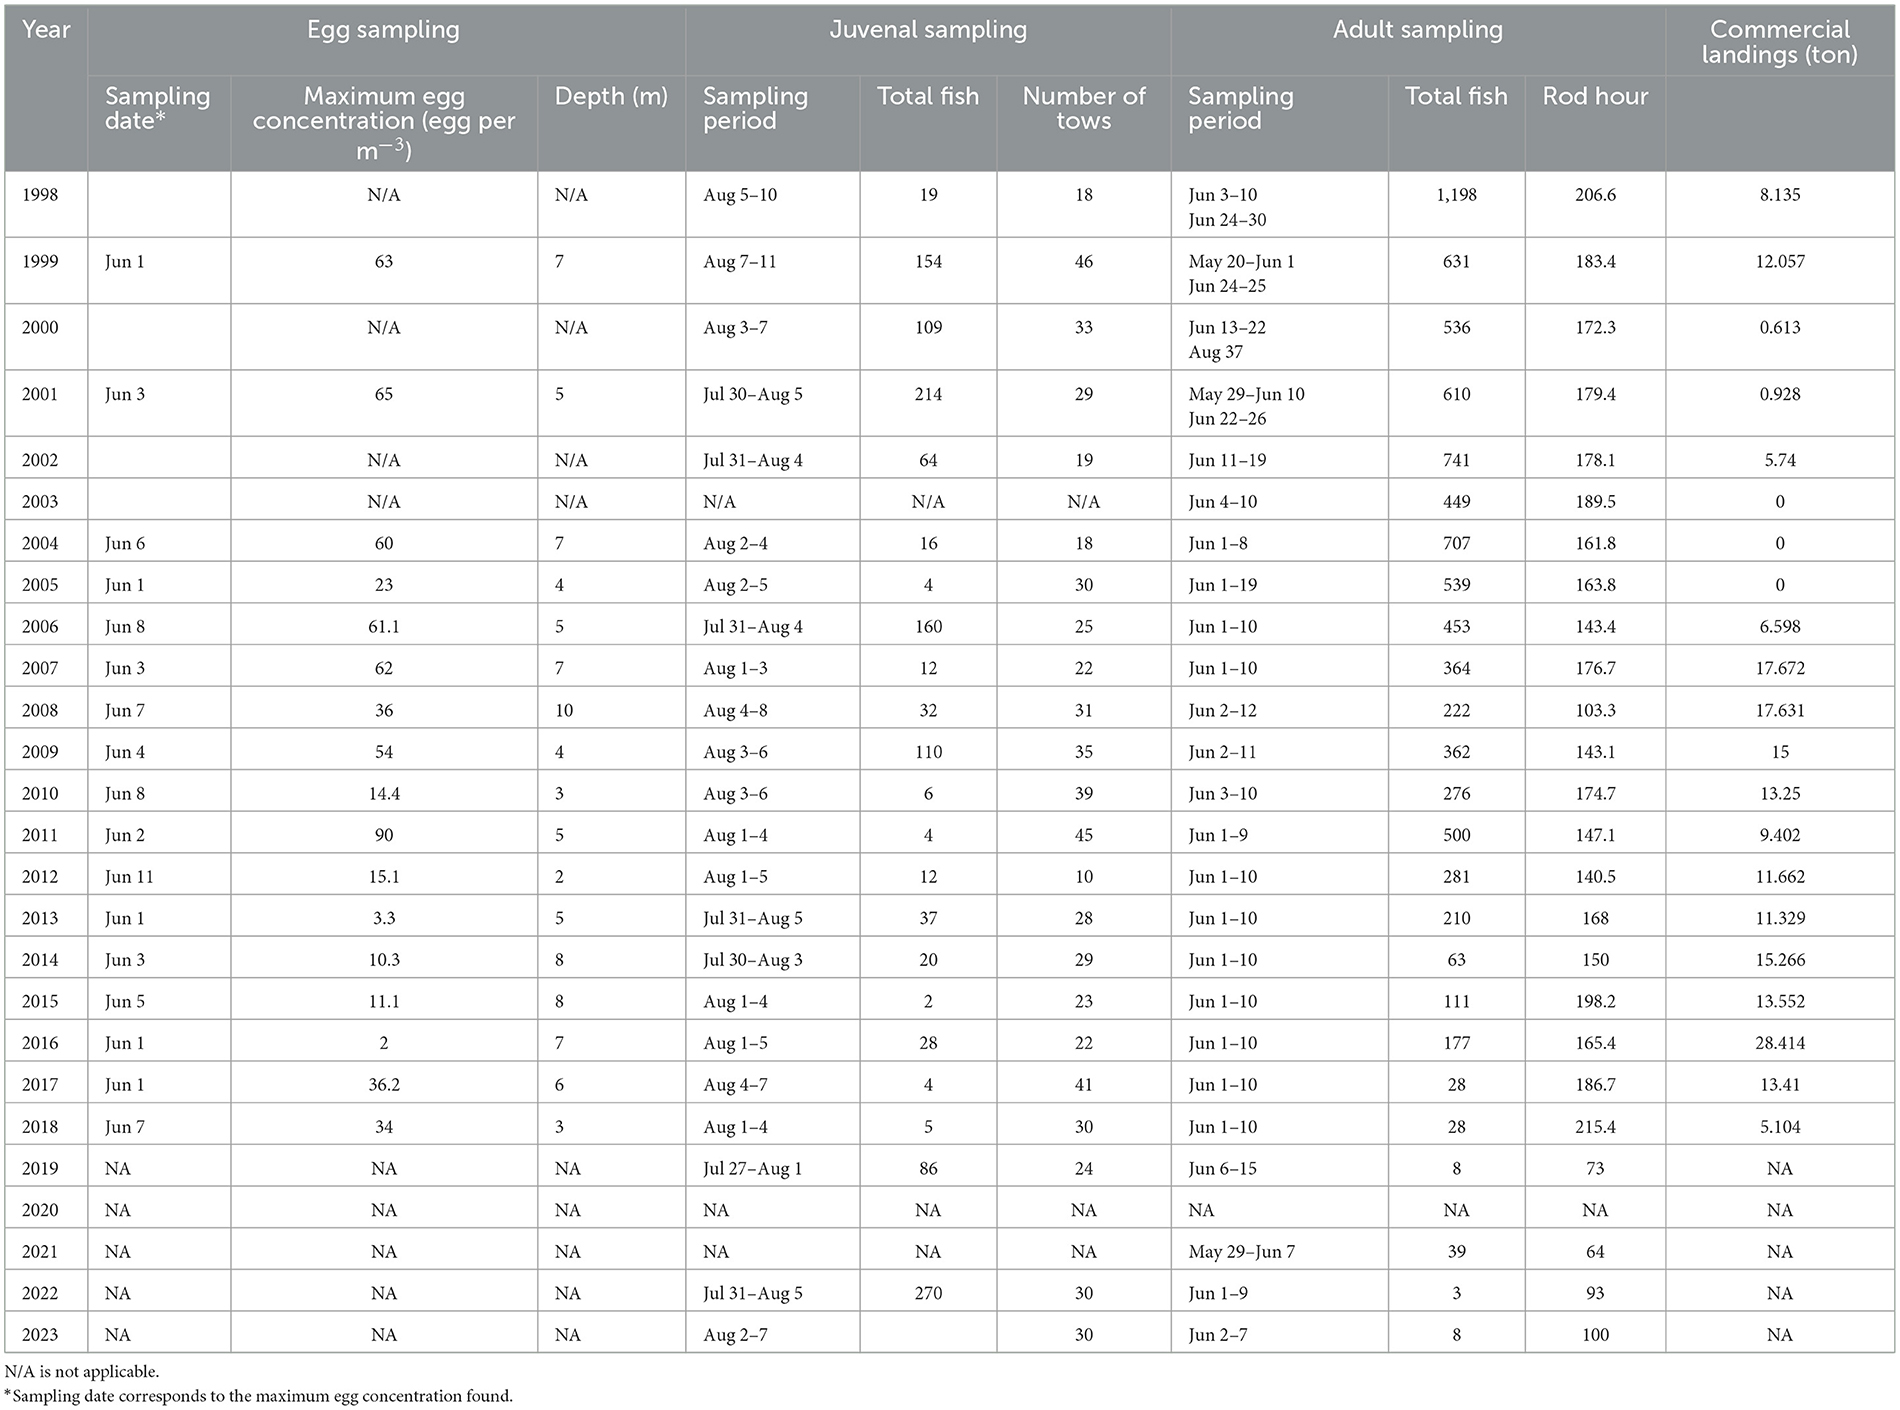
Table 1. Summary of data collection in The Shinneys and commercial landing, from 1998 to 2023.
Bay-cod at older ages were sampled annually during spring (late May-early June) at 27 fixed sites by angling (Figure 1). Fishing effort targeted shallow depths of ~8–10 m since Gilbert Bay cod prefer these depths in both cold or warm seasons (Green et al., 2023). Each fishing set included 30–120 min of angling by 2–5 people. The total length (TL) of all fish caught was recorded along with fishing location, time and set duration (Table 1). Most fish >32 cm were tagged with an external t-bar anchor tag and released at the tagging site, see Morris and Green (2002) for tagging details. The number of fish caught per year was standardized by the mean annual fishing effort, based on the Catch Per Unit Effort (CPUE) at each fishing site.
Annually sampled length-frequency distributions of Gilbert Bay cod include most younger year classes, which inform their growth, abundance, and survival. Separate modes in the length-frequency distribution identify Gilbert Bay cod ages 1–4; however, increasing variability in length at age results in overlapping modes at older ages (Morris et al., 2022). The midpoint for different modes in the length–frequency distribution was used to estimate the length of each age class. The recruitment of juvenile fish was assessed by comparing relative abundances of a cohort sampled between age 0+ and age 4+ years of age. The CPUE of angling data was measured as the number of fish caught divided by the number of people fishing multiplied by the time (h) each person fished. This was standardized by the average annual sampling effort during the 26-year period and used as an indicator of relative abundance (DFO, 2010; Morris and Green, 2017). Fish that are older than 4 years, are typically larger than 25–30 cm TL and have outgrown the size at which they are likely to be eaten by other fishes (e.g. sculpins and Rock cod), which is an important consideration in this study regarding the role of fish community changes over time.
Commercial fishing is another source of fish mortality and these data were provided by the Department of Fisheries and Oceans and are also reported elsewhere (see Morris and Green, 2014, 2017, 2021). Importantly these landings data only include commercial fishing within the reported home range of Gilbert Bay cod as reported by Morris et al. (2003) and Morris et al. (2014). This prior research identified areas outside the MPA where Gilbert Bay cod mix with Northern cod.
Environmental conditions were monitored using data gathered at the study site and from long term regional weather and river monitoring stations established by Environment Canada. Water temperature in Gilbert Bay was measured in the Shinneys at 3 and 8 m depths almost continuously every 2 h, from 1998 to June 2018, using Vemco mini-log T temperature loggers (Figure 1). Vertical profiles measuring water salinity, temperature, and density were collected during periods of plankton sampling using a Seabird 19 or handheld YSI probe. Monthly air temperature from 1935 to 2018 at Cartwright (Labrador) was taken from Environment Canada (Cyr et al., 2019), which was associated with the Gilbert Bay surface water temperature (Best et al., 2011). A river monitoring station on the Alexis River provided continuous daily freshwater runoff data from 1978 to 2018. While water from Alexis River does not flow directly into Gilbert Bay its close proximity (10–15 km) makes it a good proxy for the Shinneys River in terms of representing annual runoff and the timing of the spring freshet.
2.2 Stock assessment
The quantitative stock assessment for GB cod was performed based on two indicators: (1) fishing mortality (F) and exploitation rate (E) relative to biological reference points based on linearized catch curves and a yield per recruit (YPR) model (Sparre and Venema, 1998), and (2) reference length-based indicators (LBIs) of sustainable fishing relative to optimal points (Froese, 2004).
2.2.1 Growth parameters
Growth rate parameters were estimated for Gilbert Bay cod using three different sources of data: length-at-age, mark-recapture, and length frequency catch data (Morris et al., 2022). Lethal sampling to collect otoliths provided length-at-age data from 1998–2009. These data were compared with non-lethal sampling data (from mark-recapture measurements and length frequency analyses) which showed that the non-lethal methods were appropriate to estimate growth parameters (Morris et al., 2022). That study also included separate analysis of data for the 2010–2019 period. In the present study, we included non-lethal sampling data (length frequency catch data) from the entire sampling period (1998–2023) to estimate growth rate parameters for use in the stock assessment analysis.
A seasonally oscillating von Bertalanffy growth function (soVBGF) was used to estimate growth rate parameters using the Electronical LEngth Frequency ANalysis (ELEFAN) module developed by the FAO and adapted to the R analysis package TropFishR (Mildenberger et al., 2017). The soVBGM was considered to estimate the growth parameters because the water temperature in Gilbert Bay was below zero degree Celsius for 6 months annually, with little expected growth during this time (Morris et al., 2022). The equation of soVBGM is:
where Lt is the total length of the fish at time t, LInf is the asymptotic length of fish (cm), K is the growth rate coefficient (y−1), and t0 is the theoretical age of the fish when Lt is equal to zero. The value of t0 was obtained from ELEFAN as the output of K and LInf through the equation (Pauly, 1980): and S(t) = (CK/2π) sin 2π(t – ts), where C is intensity of seasonality, typically ranging from 0 to 1 (C >1 implies periods of reduction in length, which is rare), and ts is the fraction of a year (relative to the age of recruitment, t = 0) where the sine wave oscillation begins (i.e., turns positive). LMaxwas used to define initial seed value of LInf, which was obtained from the mean of the 1% largest fish in sample, calculated as LInf = LMax/0.95 (Pauly, 1983). Optimal bin size (OBS) was determined by the equation: (Wang et al., 2020). The VBGF parameters were assessed using a moving average over five size intervals. The estimated LInf and K values were used to calculate the growth performance index (phi prime, φ′) defined as the following: (Pauly et al., 1995). The maximum age (TMax) was estimated: TMax = 3/K (Pauly, 1980). The optimum size (Lopt) represents the size at which fishing would yield the highest sustainable biomass per recruit from a stock, and was calculated by the equation (Froese, 2004). The parameter tanchor denotes the fraction of the year where yearly repeating growth curves cross length equal to zero (Mildenberger et al., 2017). To improve cohort visualization, we converted fishing date to June 1st providing 1-year intervals for the length frequency catch data. We assumed that adult fish experienced negligible growth during our 10-day sampling period (late May–early June). The model was performed using ELEFAN through a simulated annealing algorithm (ELFAN_SA) (Xiang et al., 2013). The best fit model was selected based on the maximum score value obtained from bootstrapping (Schwamborn et al., 2019). Maximum density estimates and 95% confidence intervals (CIs) for all growth parameters were obtained based on the 1,000 resamples of the bootstrapping procedure (Mildenberger et al., 2017).
2.2.2 Mortality and exploitation rate
Once VBGM were estimated, linearized length-converted catch curves were produced taking into account growth seasonality. Catch curves were employed to the average catch numbers per length class across all years, based on scientific monitoring data collected in Zone 1B. Total instantaneous mortality rate (Z) was calculated based on the slope of the regression line of the descending part of the catch curve. The selection of points for the regression line was based on the age (length-derived) classes represented in the catch data. The Z equation forms:
where Ni is the number of individuals in length class i and dti the time needed by the fish to grow in class i (Pauly, 1990; Pauly et al., 1995). a is the intercept, b corresponds to Z (slope), and t is the relative age. The Z of length frequency data and the derivation of a selection ogive was estimated by means of the linearized length-converted catch-curve analysis method outlined by Mildenberger et al. (2017). The instantaneous natural mortality rate (M) was estimated upon a meta-analysis according to the empirical equation of Then et al. (2015), based on Linf and K:
With Linf and K values obtained from the length frequency data as described as above using ELEFAN_SA function in TropFishR package (Mildenberger et al., 2017). This approach is based on the empirical method with a cross-validation prediction error of 0.6 (Then et al., 2015). Uncertainties around the estimates of total mortality and fishing mortality are compounded by the error associated with the natural mortality estimate. The rate of fishing mortality (F) was obtained by subtracting natural mortality from total mortality (F = Z – M). The exploitation rate (E) was defined as E = F/Z. Estimated values of E were then compared with a reference value of 0.5, which has been proposed as a maximum sustainable yield (MSY) for most fish species (Gulland, 1971). In addition, estimated F values were compared against reference points obtained from the yield per recruit (YPR) prediction model (Beverton and Holt, 1957), also called Thompson and Bell model. There were three considerable thresholds in that model: (1) the highest biomass per recruit (FMax), (2) a 50% reduction of the biomass of the unexploited population (F0.5), and (3) a fishing mortality that corresponds to 10% of the slope of the yield per recruit curve in the origin (F0.1). In the YPR model, allometric length-weight relationship parameters a and b were required, which were obtained from existing estimations published by Morris and Green (2002) (W = 0.0059TL3.11). The bootstrapped ELEFAN-based curve fitting method was used to estimate the exploitation rates derived from maximum density values of distributions for each parameter that was obtained from the linearized length converted catch curve (Mildenberger et al., 2017).
2.2.3 Length-based indicators for sustainable fishing
In addition to the first stock assessment indicator based on the exploitation rate and fishing mortality (E and F) relative to biological reference points, we applied three Length Based Indicators (LBIs) proposed by Froese (2004) to assess the status and trends of the Gilbert Bay cod population within a stock assessment framework, which are described as “let them spawn,” “let them grow,” and “let the mega-spawners live,” following terminology used by Froese (2004). These LBIs were based on previous studies that have documented links between the variables involved in the estimation of the LBI with recruitment overfishing and/or growth overfishing and their associated reference points (RP) (Beverton, 1992; Myers and Mertz, 1998; Berkeley et al., 2004; Barneche et al., 2018). The LBI applied in this study included (Froese, 2004; Cope and Punt, 2009):
(1) Pmat, the proportion of mature fish sampled, with 100% as the reference target point, calculated as Pmat = % fish in sample > Lm, where Lm is the length at maturity. Morris and Green (2002) showed that GB cod reached mature sizes from 31 to 42.1 cm. Thus, we inferred the mean Lm = 37 cm (e.g., 50% of the fish are mature).
(2) Popt, the proportion of fish within a 10% range around the optimum length (Lopt) in the sample, with 100% as the reference target, calculated by: Popt = % fish ≥ Lopt – 10% and < Lopt + 10%, where Lopt was defined above.
(3) Pmega, the proportion of mega-spawners in the sample, with 30%−40% considered as a healthy age structure and being desirable, whereas < 20% will be a matter of concern (Froese, 2004). Pmega was calculated by: Pmega = % fish > Lopt +10%.
The sum of the three proportions (Pmat + Popt + Pmega) gives the Pobj value. This combined indicator is referred to as a decision tree (Cope and Punt, 2009), which provides a useful assessment tool for multi-gear fisheries, including hook-and-line and gillnets, where the assumption of trawl-like selectivity is not met. In the model, if Pobj is < 1 then the fisheries captured more immature fish; if Pobj ranges from 1 to 2, then the fisheries captured fish within a range of Lopt; and finally, if Pobj is > 2, then the fisheries captured more optimal-sized fish. Once a selectivity pattern was established based on Pobj, threshold values of Pmat, Pobj and/or the Lopt/Lm ratio point to an estimated probability of the stock spawning biomass (SB) being below established reference points, either 40% or 25% of the unfished spawning biomass (0.4 SB or 0.25 SB) was determined (Cope and Punt, 2009).
2.2.4 Population size estimates
While length frequency catch data can estimate population size, yearly estimation is affected by variation of Linf and K which can generate large confidence intervals (high uncertainty) (Yin and Sampson, 2004). Thus, we estimated the population size using mark-recapture methods following Ricker (1975) similar to that applied to the Gilbert Bay cod population previously (Morris et al., 2003). The equation is:
where N is the estimated population sizes in number, Ti is the total number of previously tagged fish at time i, Ci is the number fish caught at time i, and Ri is the number of tagged fish caught at time i. We assumed that there was no tagging mortality as presented by Morris et al. (2003) and Morris et al. (2014). Since 2019, few fish have been sampled that were large enough to tag, as such, recaptures since then have also been low. Thus, the recapture analysis was conducted using the 1998–2019 data.
2.3 Prioritization of factors impacting population trend
To test the hypothesis that fishery removals is limiting the recovery potential of the Gilbert Bay cod population, we examined overfishing effects by comparing fishery removals with the abundance of eggs, juveniles, and adult abundances collected during annual sampling (see Section 2.1). A Bayesian Model Averaging (BMA) model was used to predict which factors could best explain observed changes in the Gilbert Bay cod population. In the BMA model, sampled eggs and juvenile densities, and adult abundance were response variables. There was a total of 23 potential predictors (Table 2) affecting the response variables assumed to be influential on the variability of sampled egg/larvae density, or sampled cod abundance based on hook and line data, in the BMA analysis. The initial model for BMA is defined as:
where is the cod egg density, larvae density, or adult cod abundance, Xi is an explanatory variable (predictor) with i = 1–23 corresponding to various sampling data, fisheries and environmental factors are described in Table 2, βi is the regression coefficient for each explanatory variable, and ε is the error term [ε ~ N(0, σ2)]. Since egg, larvae, and cod abundance sampling data were collected before the commercial northern cod stewardship fishery each year, commercial landings data were considered to affect the egg, larvae density, and adult cod abundance during the following sampling year. The BMA model was implemented in the R software programs BMS (Zeugner and Feldkircher, 2015), it incorporated a Gaussian error structure with a log link, and was selected based on the Bayesian information criterion (BIC) (Burnham and Anderson, 2004). To avoid over-fitting the models and to obtain ecologically relevant responses, a full model using all explanatory variables, e.g., X1-X23 was initially tested, we then conducted stepwise model simplification, dropping the variables that had a posterior probability coefficient < 10, the remaining final BMA models included relevant explanatory variables (Hoeting et al., 1999; Lehmann et al., 2002; Sandman et al., 2008; Zeugner and Feldkircher, 2015; Piironen and Vehtari, 2017; Fragoso et al., 2018).
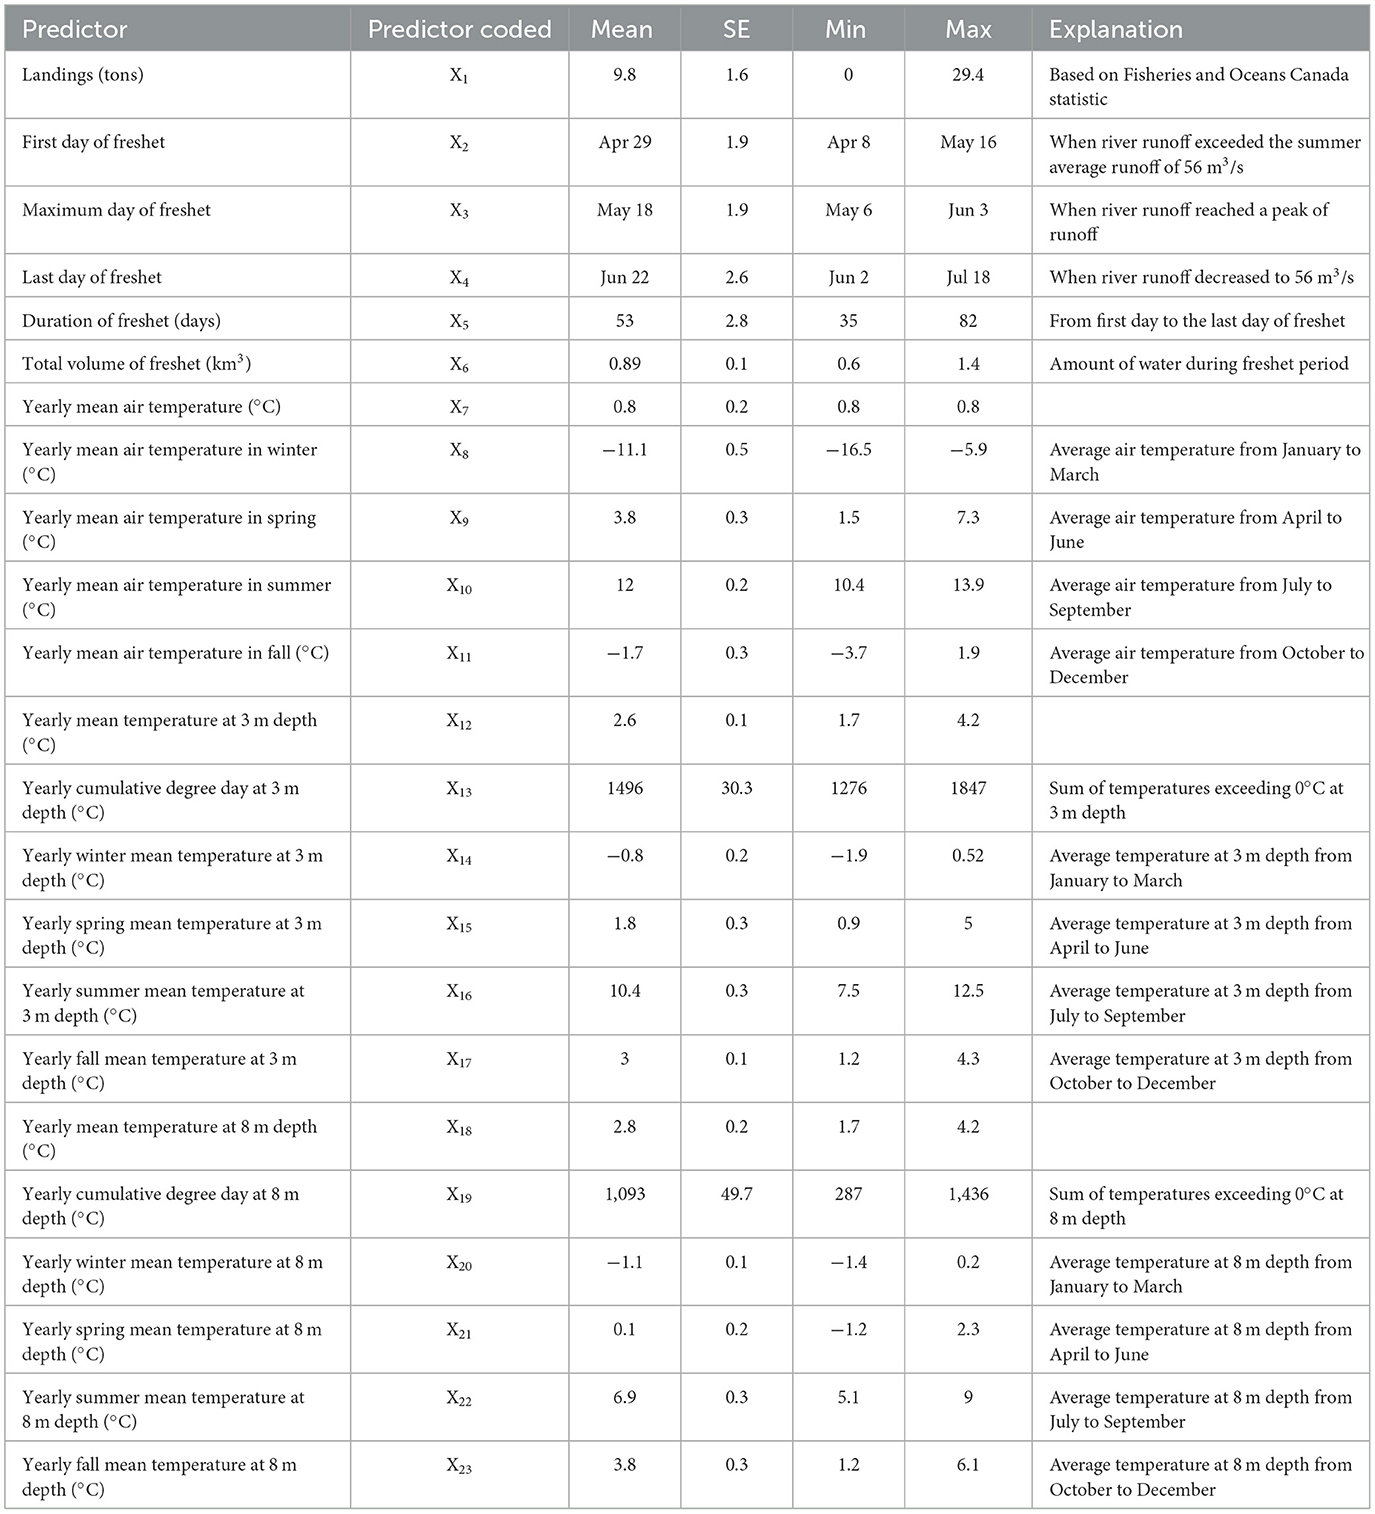
Table 2. Summary statistics for full data set.
After selecting models with the lowest BIC values, indicating most appropriate fit, we tested the likelihood of influence of the explanatory variables on egg and juvenile density, and adult cod abundance using Generalized Additive Models (GAMs) following the method of Bové et al. (2015). GAMs were used because the shape of the relationship between egg, juvenile density or adult cod abundance and fisheries and environmental variables was not known. Densities of egg or juvenile or adult abundance were the response variable; landings and environmental conditions selected from the BMA model were the explanatory variables. The analyses were performed using the mgcv package of R (Wood, 2017). We applied knots for each of the smoothers limited to four (k = 4), allowing the smoother to divide the response from each explanatory variable into a maximum of three parts.
3 Results
3.1 Stock indicator
3.1.1 Growth parameters
A total of 8,594 Gilbert Bay cod were sampled during spring, from 1998 to 2023 with the exception of 2020. Individual total lengths (TL) ranged between 9.2 to 100 cm with a mean of 40.6 (± 0.12 SE) cm (Figure 2), covering the length range of Atlantic cod surveyed in NAFO Division 2J, which is part of the northern cod stock adjacent Gilbert Bay, by DFO using trawl net and sentinel survey data (Rideout and Ings, 2021; Mello and Simpson, 2023). Growth parameters estimated using ELEFAN_SA algorithm of Gilbert Bay cod for the period of 1998–2023 are shown in Table 3. LInf and K were 62.4 cm and 0.16 cm*year−1, respectively, which are consistent with previous estimates by Morris et al. (2022). Other parameters that influenced the growth rate curve were also estimated (Table 3). The fit of estimated growth parameters and growth curves show a good visual fit with modes in the length frequency data (Figure 3). Estimated confidence intervals cover a narrow range indicating an overall low uncertainty in the estimations, and the data represented the size range of the population. The ELEFAN_SA approach showed that seasonal growth oscillations had a strong effect on growth rates (C = 0.76) as shown in Figure 3. Expectedly, Gilbert Bay cod grew faster at smaller sizes. Gilbert Bay cod lengths at age 1, 2, 3, and 4 was 8.9, 16.5, 22.9, and 28.5 cm, respectively, prior to reaching a minimum age of maturity at age 5 (33.3 cm TL). The maximum age (tmax) was estimated to be 19 years, which is similar to the length-at-age estimate based on otolith data (Morris et al., 2022).
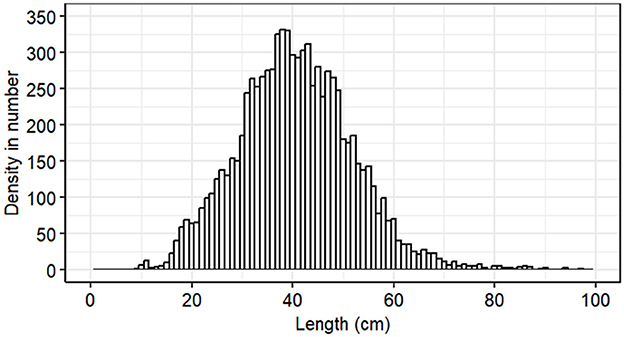
Figure 2. Length frequency distribution of 8,594 Gilbert Bay cod sampled from late May until early June, each year from 1998 to 2023, using angling 27 fixed stations.

Table 3. Estimated growth parameter for Gilbert Bay cod using ELEFAN_SA algorithm.
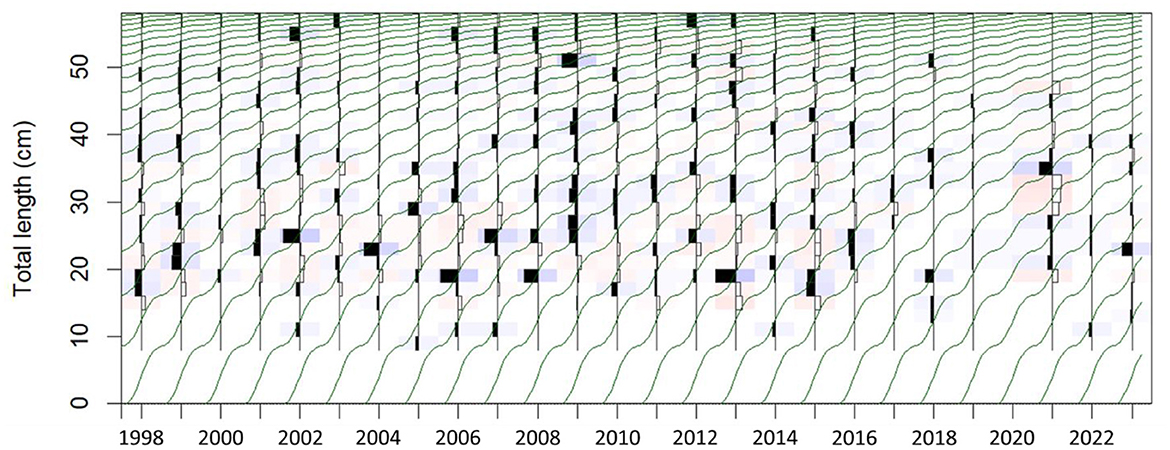
Figure 3. Length-frequency histograms with the growth curves (dark green lines) obtained through the bootstrapped ELEFAN with SA analysis superimposed for Gilbert Bay cod.
3.1.2 Mortality, exploitation rate, and biological reference points
Estimates of mortality, computed by applying the growth parameters of all data, showed that the overall fishing mortality rates for the protected Gilbert Bay cod population was 0.3 year−1, the estimated natural mortality was 0.12 year−1, and the total mortality estimate was 0.42 year−1 as derived from a linear length-converted catch curve (Figure 4). The length-based stock assessment showed that the estimated length at first capture (Lc), defined as length at which fish have a 50/50 probability to be caught, and also known as L50, was 35.6 cm which corresponds to a Gilbert Bay cod of about 6 years of age, within a range of maturity sizes (Figure 4) proposed by Morris and Green (2002). The Lopt was calculated as 48.9 cm. This was similar to the sentinel survey data for northern cod gillnet catches in the NAFO Division 2J from 1995–2000 (see figure 18 in Mello and Simpson, 2023). The graphical length-based cohort analysis results shown in Figure 5 generally reflect the fishing mortality over different length class (logistic curve) used in the data generation (red line in Figure 5), although the natural mortality of larger fish appears underrepresented resulting in lower natural mortality values. Higher natural mortality occurred for the immature population (< 40 cm TL; Figure 5). Estimated fishing mortality rates peaked at a larger size, about 48 cm (11 years of age). This agreed with the sentinel survey data for length frequency distributions of Atlantic cod by gillnets from 1995 to 2000 (Mello and Simpson, 2023).
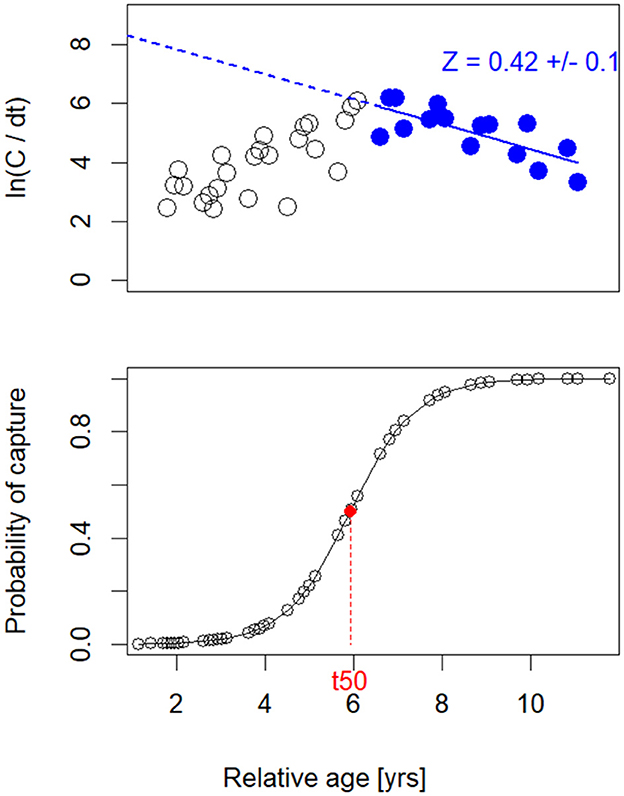
Figure 4. Length-converted catch curve (top panel) and capture probability (bottom panel) of Gilbert Bay cod, relative to age (years). Only blue circles in the top panel were used in the regression analysis to estimate Z. In the bottom panel, t50 indicates the relative age corresponding to the length at first capture at 35.6 cm.
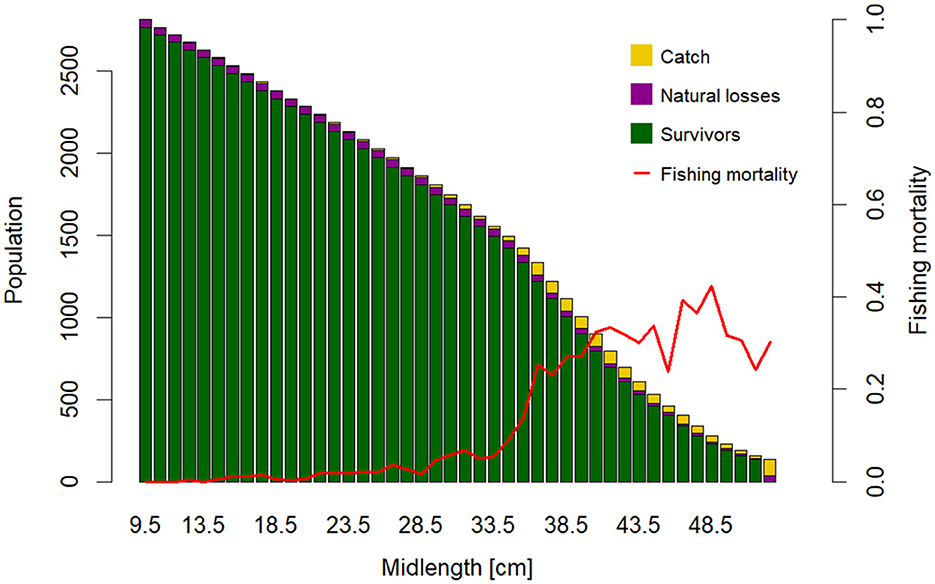
Figure 5. Results of Jones' length-based cohort analysis with the reconstructed population structure (survivors, natural losses and catch) in numbers per length class and the fishing mortality rate by length class (red line in both plots) for Gilbert Bay cod.
Estimated biological reference points are shown in Table 4. The exploitation rate for the entire data was computed as 0.72 year−1 (Table 4), which was higher than the value expected at FMSY (0.26 year−1; Figure 6), and higher than the optimal exploitation level (E0.5) of 0.29, which corresponds to 50% of the relative B'/R of an unexploited stock (Table 4). This indicates that the stock was overfished. The calculated ratio of Fcurr/Fmax was 1.16, which is considerably higher than 1, the optimum level, and another indicator of overfishing. The relative yield per recruit (Y'/R) and the relative biomass per recruit (B'/R) analyses were estimated using Lc/Linf = 0.58 and N/K = 0.71 as input for knife-edge selection procedures, respectively. The estimated maximum allowable limits of exploitation levels (EMSY) that give the maximum relative Y'/R was 0.62 (Table 4). The maximum sustainable yield per recruit (Y/RMSY) and biomass per recruit (B/RMSY) was 324 and 6,000 g per recruit, respectively. These modeling results indicate that the northern cod fishery adjacent the MPA resulted in a level of overexploitation on the Gilbert Bay cod population that would significantly reduce its abundance over the 26-year sampling period. The fishing mortality rate on the Gilbert Bay cod population would be higher than that populations maximum sustainable level of productivity based on commonly used fishery assessment methodologies (Figure 6).
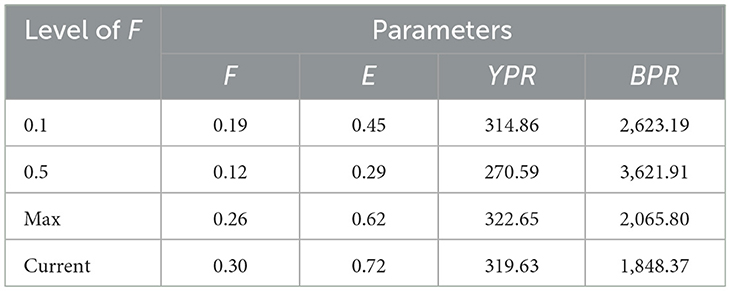
Table 4. Effect of fishing mortality changes on biological reference points of GB cod at different levels.
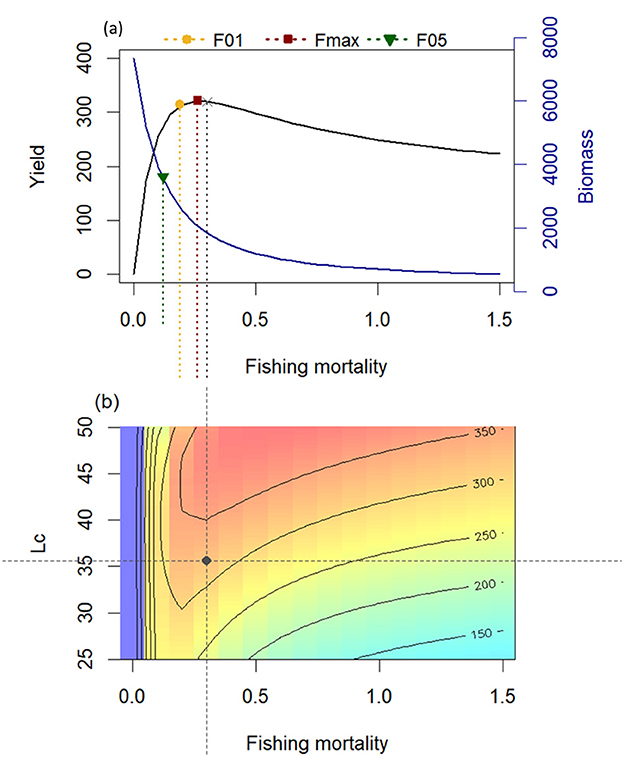
Figure 6. Results of the Thompson and Bell model for Gilbert Bay cod: (A) curves of yield and biomass per recruit and (B) exploration of impact of different exploitation rates and Lc values on the relative yield per recruit. The black dot represents yield and biomass per recruit under current fishing pressure (overfishing regime). The yellow and red dashed lines represent fishing mortality for maximum sustainable yield (Fmsy) and fishing mortality associated with a 50% reduction relative to the virgin biomass (F0.5), respectively. The x-axis corresponds to the fishing mortality of the fully exploited length classes.
3.1.3 Length-based indicators for fishing sustainability
To reflect the status and trends of the Gilbert Bay cod population, within a stock assessment framework, a straightforward set of indicators known as LBI was also employed. Table 5 shows the status and trends of the Gilbert Bay cod population based on Pmat, Popt, and Pmega as reference points in catch. There was a good fit with the individual reference target values proposed by Froese (2004). Mature-sized individuals dominated the sample, accounting for 63%. A low value of Pmega (Pmega = 0.1 vs. expected value of 0.4) indicated a fishery status that would benefit from “letting the mega-spawners live” (Froese, 2004) in order to develop a healthy fishery (Mora et al., 2009), or in this application enable a healthy population. Pmega = 0.1 is to fall within the critical concern status that is expected > 0.3 (Froese, 2004). In addition to a low spawner level (< 20%), the result of applying the decision-tree proposed by Cope and Punt (2009), which determines the intrinsic selectivity pattern of the fisheries, indicates that the Gilbert Bay cod population has a spawning biomass below the target reference point of 0.4 SB with 100% probability (Table 5). Here, Pobj < 1 (Table 5) indicated that there is a low number of spawners in the population (e.g., fisheries also captured immature-sized individuals).
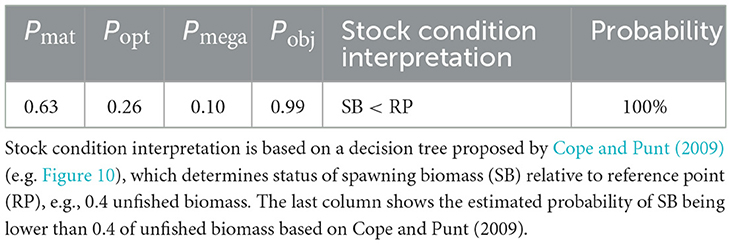
Table 5. Proportion of mature fish (Pmat), optimum-sized fish (Popt), larger than optimum size fish (Pmega) and objective proportion (Pobj = Pmat + Popt + Pmega) for Gilbert Bay cod as described in the methods, based on indicators suggested by Froese (2004).
3.1.4 Stock size
The GB cod population estimate from spring tagged-recapture data indicated that the population size decreased from ~39,000 individuals in 1998 to ~9,000 individuals in 2017 (Figure 7); while it is known that most of the remaining individuals are small in size, and immature, since very few sampled individuals were large enough to tag since 2017. The population remained at a high level in the early sampling period, e.g., 1998–2001, and then dramatically decreased, although there was a short period of increase from 2003 to 2005 while there was no northern cod fishery. An increase in abundance was also observed from 2009 to 2011, presumably a result of strong year classes recruiting to our sampling program. Recruitment of these small fish and their long-term survival into reproductive sizes is required to rebuild the population.
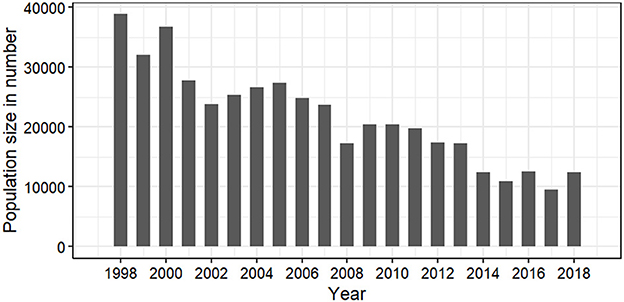
Figure 7. Estimated population size using the mark-recapture data sampled in spring 1998 to 2019.
3.2 Prioritizing factors impacting population trends
Commercial fishing as well as environmental factors could potentially affect the health of the Gilbert Bay cod population. The results presented here consider the relative contribution that these factors likely have in explaining cod egg density, juvenile cod abundance, and adult Gilbert Bay cod abundance, as measured during long term MPA indicator monitoring. This section addresses direct observation data and utilizes fitting of regression models to identify environmental and harvest variables associated with variation in abundance of eggs, juveniles, and adult cod in Gilbert Bay.
3.2.1 Cod egg density
The maximum annual concentrations of cod egg densities sampled over the study period from 1998 until 2018, varied between 2 and 90 egg per m3 (mean of 37.7 ± 6.4; Table 1). To examine factors influencing this annual variability, several explanatory variables and their influence on model fit were measured using the Bayesian Model Averaging model. The BMA model included 10 explanatory variables; landing volume (X1), first day of freshet (X2), maximum freshet (X3), duration of freshet (X5), total volume of freshet (X6), annual mean air temperature (X7), spring mean air temperature (X9), annual mean water temperature at 3 m depth (X10), cumulative degree day water temperature at 3 m depth (X11), and spring mean water temperature at 3 m depth (X12; Table 2). Explanatory variables selected from the top five candidate models, those having the lowest BIC values among 125 models considered, showed that commercial fishery landings and freshet features (timing and volume) could explain variations of the egg density in different years (Table 6). Temperature variables, both air and water, did not contribute to any of the tested models. Commercial fishery landings were the most important factor affecting egg density variability based on the highest posterior probability. Other predictors negligibly contributed to the egg density variation in all models. For example, landings accounted for 89.2% of the variability among the 125 models returned, compared to 60.6% for first day of freshet, 35.5% for duration of freshet, and 18.5% for maximum day of freshet, where the coefficient for a given predictor is not zero. R2 varied between 0.62 and 0.72 (0.69 for model 1), indicating the majority of variation in cod egg density could be explained by the BMA model.
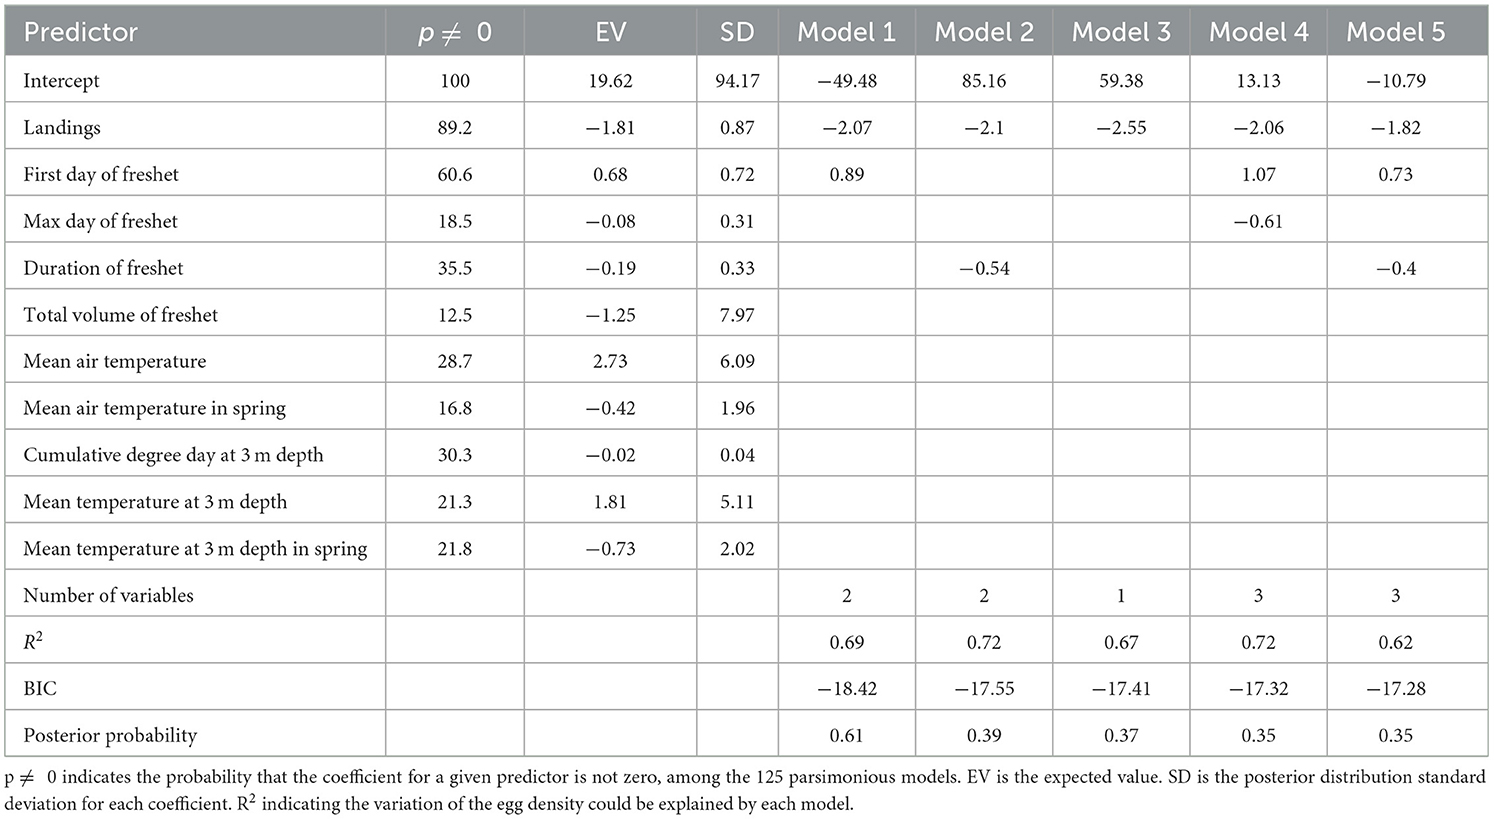
Table 6. Selected Models by Bayesian Model Averaging describing the variability of the cod egg density.
Based on the BMA model output, only four explanatory variables (X1, X2, X3, X4, see predictor definition in Table 2) were included in the GAM analysis. The partial effects of the predictors in the best five models are shown in Figure 8. Model predictions indicated that the cod egg density significantly decreased with increasing commercial fishery landings, short freshet duration, and late freshet season.
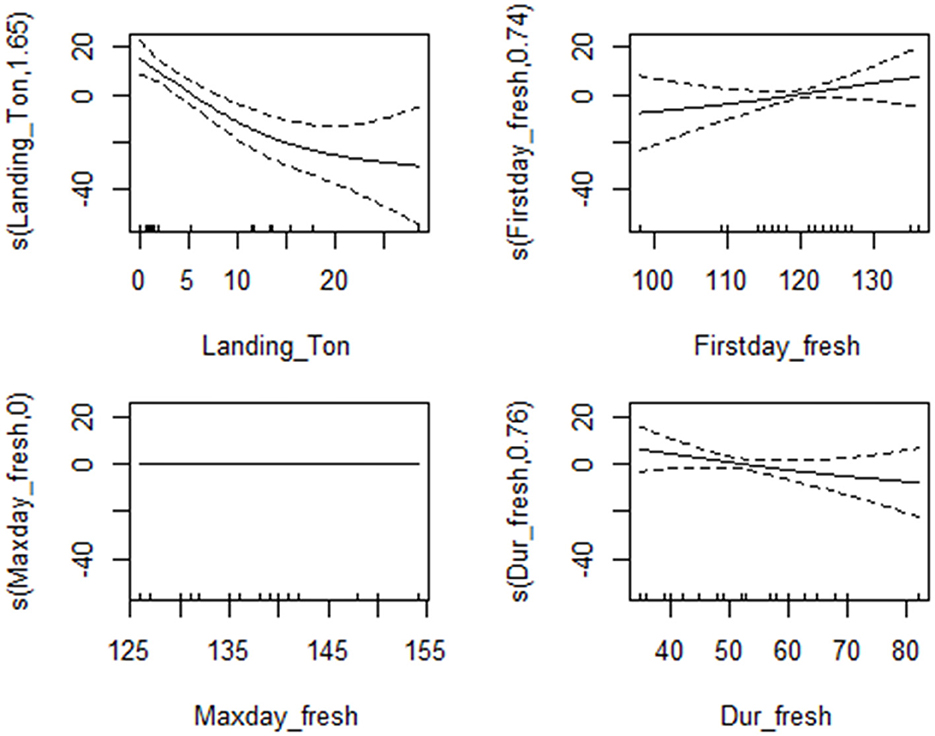
Figure 8. Partial response curves for model 1–5 of the GAMs for cod egg density in relation to environmental and fisheries variables. All graphs show the partial effects of each predictor on the egg density. Solid lines represent smooth regression curves with 95% CI (dashed lines), and the 0 value indicates an even split between the positive and negative effect of predictor on egg density. Values above 0 indicate a positive effect of the predictor on the egg density and vice versa.
3.2.2 Juvenile cod abundance
A total of 573 net hauls were conducted during early August between 1998 and 2018 (Table 1). The total length of sampled pelagic juveniles ranged between 6.89 and 57.08 mm, after accounting for shrinkage in 95% ethanol. Catch per haul varied from a low of 0.08 in 2011 to a high of 7.4 individuals in 2001 (mean of 1.8 ± 0.47 SE; Table 1). For our analysis, we included 10 potential explanatory variables in the BMA model; landings (X1), first day of freshet (X2), maximum day of freshet (X3), last day of freshet (X4), total volume of freshet (X6), mean annual air temperature (X7), mean summer air temperature (X10), mean annual temperature at 3 m depth (X12), cumulative degree day at 3 m depth (X13), and mean summer temperature at 3 m depth (X16; see Table 2 for more explanatory variable details). The best five models, which had the smallest BIC values, derived from the 56 candidate models, consisted of four explanatory variables. These variables included the amount of fish landed during the commercial fishery, first day of freshet, mean air temperature, and cumulative degree day at 3 m depth (Table 7). Fishery landings had the highest posterior probability with 81.7 % and occurred in four of five selected models (not in model 4), which was greater than the remaining explanatory variables (Table 7), however, the R2 was low for each of the best five models selected, ranging from 0.01 to 0.26. The poor fit indicates that the majority of variation in juvenile abundance could not be explained by the BMA model, at least with the data available, despite posterior probability ranging between 0.42 and 0.64 (Table 7). Four explanatory variables (X1, X2, X7, and X13) selected from the best 5 models were included in the GAM analysis and showed that juvenile abundance significantly decreased as explanatory variables X1 and X13 increased. By contrast, juvenile abundance increased with increasing X2 and X7 (Figure 9).
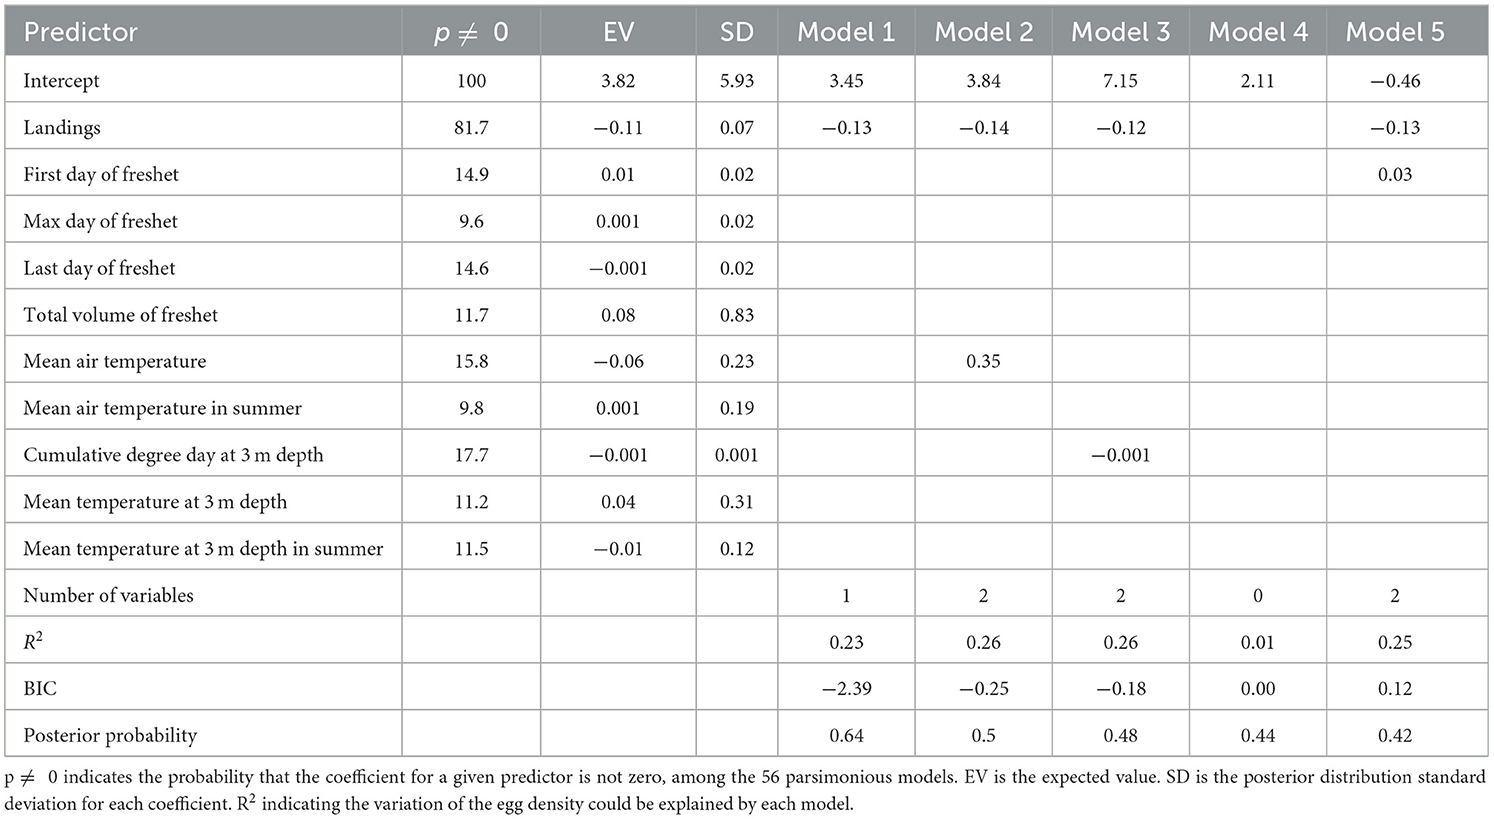
Table 7. Selected models by Bayesian model averaging describing the variability of the juvenile density.
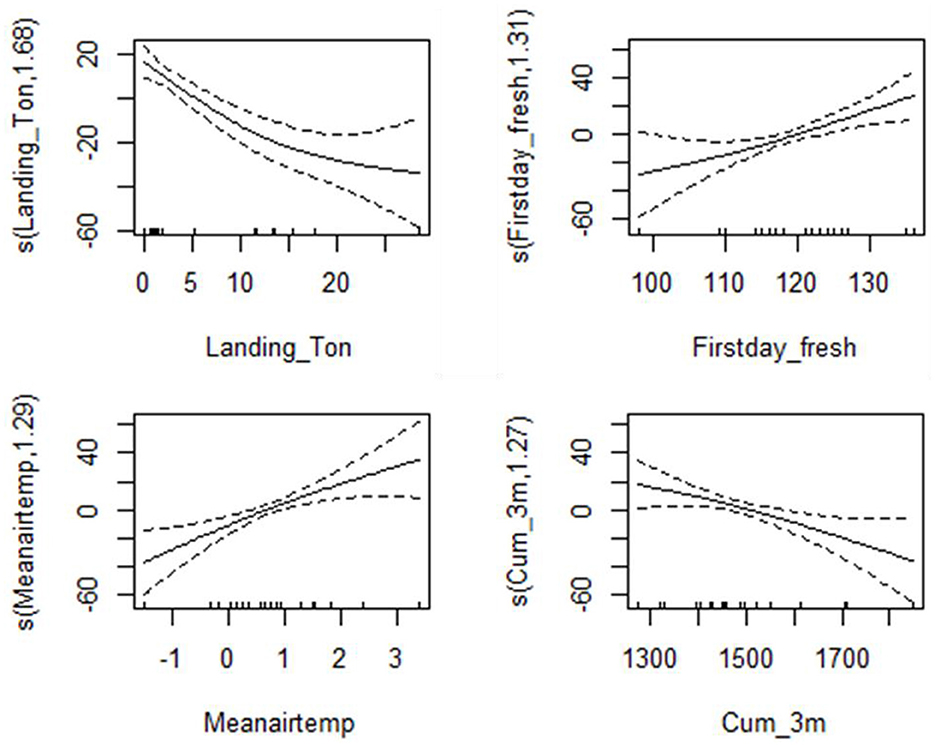
Figure 9. Partial response curves for model 1–5 of the GAMs for juvenile cod abundance in relation to environmental and fisheries variables. All graphs show the partial effects of each predictor on the adult cod abundance. Solid lines represent smooth regression curves with 95% CI (dashed lines), and the 0 value indicates an even split between the positive and negative effect of predictor on egg density. Values above 0 indicate a positive effect of the predictor on the egg density and vice versa.
3.2.3 Adult Gilbert Bay cod abundance
A total of 8,486 Gilbert Bay cod were sampled during the scientific spring monitoring program from 1998 to 2018 (Table 1), including 2,924 cod ≥45 cm. The standardized number of Gilbert Bay cod sampled during spring, based on mean annual sampling effort per site, ranged from 1–375 fish (mean of 137 ± 27.1 SE). There were 12 potential independent variables considered in the analysis associated with adult cod abundance, which included landing volume (X1), first day of freshet (X2), maximum day of freshet (X3), last day of freshet (X4), total volume of freshet (X6), mean air temperature (X7), spring mean air temperature (X9), summer mean air temperature (X10), mean temperature at 8 m depth (X18), cumulative degree day at 8 m depth (X19), spring mean temperature at 8 m depth (X21), and summer mean temperature at 8 m depth (X22; Table 2). Explanatory variables selected from the top five candidate models with the lowest BIC values, among 229 models considered, included: landings, total volume of freshet, mean air temperature, mean air temperature in spring, and summer temperature at 8 m depth (Table 8). The BMA model showed that the commercial fishery landings data was the most important predictor that explained variation of sampled cod abundance based on the highest posterior probability (100%). Landings, as a predictor, occurred in all five models, while other predictors had a very limited contribution. The R2 value varied between 0.59 and 0.69, and posterior model probability varied from 0.62 to 0.83, indicating that the BMA model could explain the variation in adult cod abundance reasonably well. Most freshet conditions had negligible impact on the modeled adult cod abundance (Table 8). The GAM analysis, similar to that used to examine egg and juvenile density, showed that our scientific sampling catch rates of adult cod significantly decreased with increased commercial landings. The model indicated that sampled adult cod abundance in June was significantly influenced by commercial fisheries during a previous year (Figure 10).
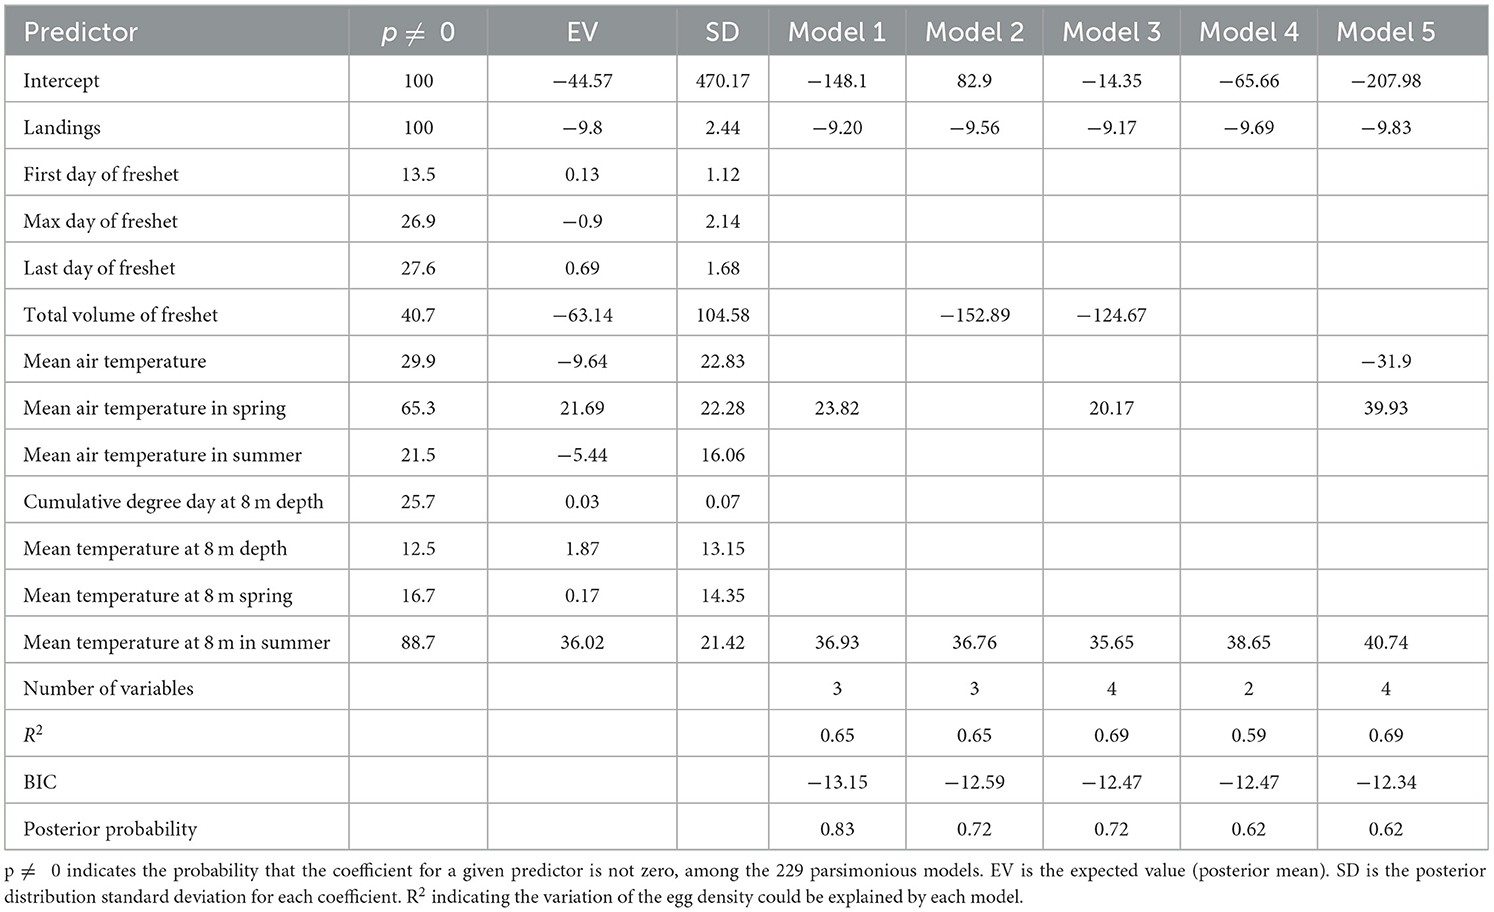
Table 8. Selected Models by Bayesian Model Averaging describing the variability of the adult fish abundance.
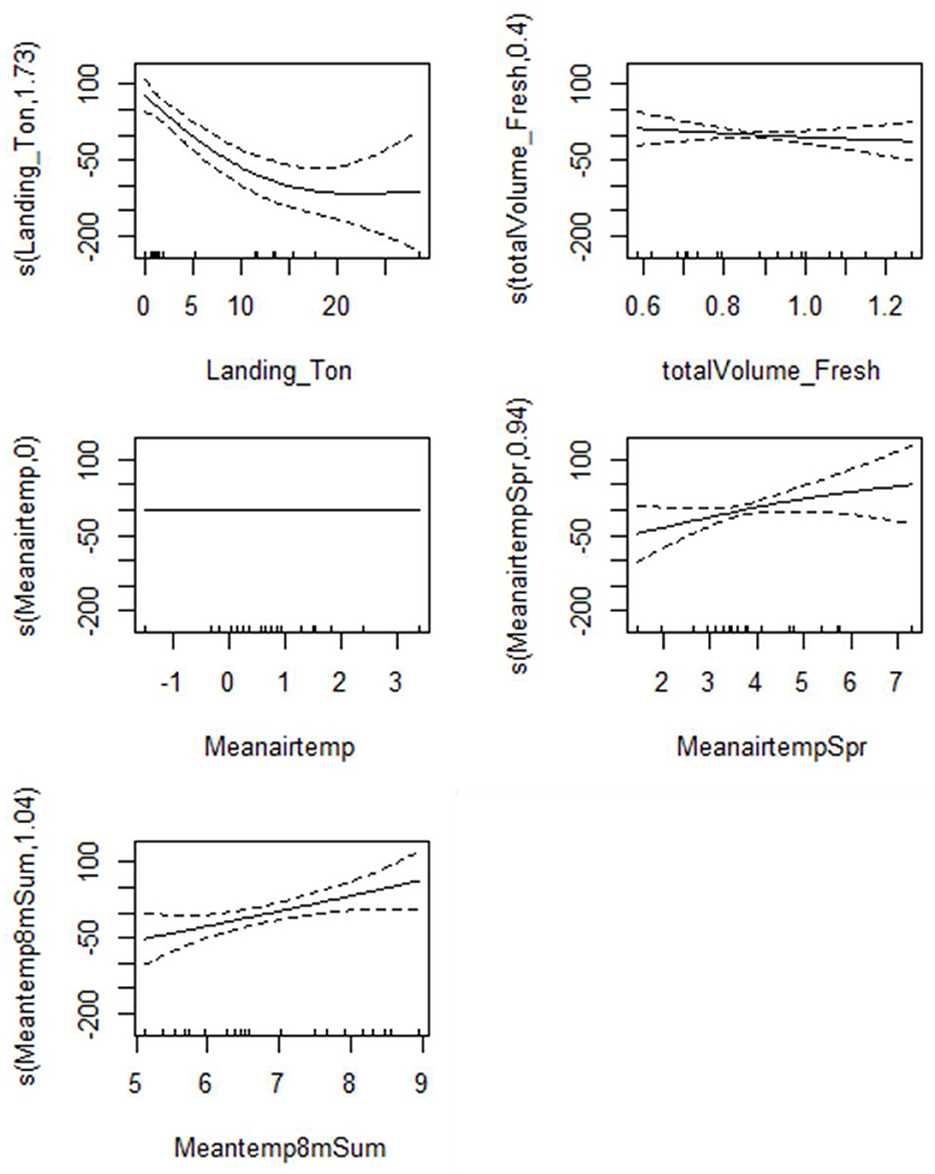
Figure 10. Partial response curves for model 1–5 of the GAMs for adult cod abundance in relation to environmental and fisheries variables. All graphs show the partial effects of each predictor on the adult cod abundance. Solid lines represent smooth regression curves with 95%CI (dashed lines), and the 0 value indicates an even split between the positive and negative effect of predictor on egg density. Values above 0 indicate a positive effect of the predictor on the egg density and vice versa.
3.3 Juvenile recruitment
In addition to fishery impacts and changing environmental conditions, there are concerns that changes in the fish community in Gilbert Bay might affect the recruitment of Gilbert Bay cod. It is suggested that interspecific competition and predation could affect the survival of juvenile Gilbert Bay cod. Therefore, measuring juvenile recruitment is an important indication of potential population recovery. Considering the relative strengths of juvenile year classes, based on monitoring data for fish that are ages 1–4 years, informs the recruitment of juvenile Gilbert Bay cod into the adult population. Length frequency histograms of Gilbert Bay cod sampled from larval surveys and hook and line data from 1998 to 2023 are plotted in Figure 11. These length frequency data was scaled by percent of catch sampled to denote population demographics. From the length frequency data, modes representing the different year classes indicate that Gilbert Bay cod grow ~100 mm TL by the end of the first growth season, 188 mm in the second, 266 mm in the third, and 334 mm in the fourth (Figure 11). The number of cod sampled decreased over our time series, however juvenile abundances were variable over time. Although not all year classes are represented in all samples, because annual recruitment is highly variable, modes representative of demersal juvenile cohorts (or their absence) were consistent and predictive over multiple consecutive years of data. Two year old cod in 1998 were highly abundant, suggesting a strong 1996 year class. This cohort provided the large number of fish at age 4+ sampled in 2001 (Figure 11). In contrast, the 1997 cohort was relatively weak, with very few age 2+ Gilbert Bay cod caught in 1999, and a continued absence of this year class was observed in sampling data from several subsequent annual length frequency distributions (Figure 11). The strong 1999–2001 year classes were apparent in the 2001, 2002, 2003, and 2004 length distributions (Figure 11). The low fish abundances at age 3–5 caught during 2008 and 2010 were probably due to weak year classes from 2003 to 2005. The high abundance of 1+, 2+, and 3+ year olds caught in 2007, 2008, and 2009, respectively suggested that the 2006 year class was relatively strong (Figure 11). Similar distributions also observed in 2010 and 2011 suggested that the 2009 year class was strong (Figure 11). During the most recent decade, during a time when the abundance of adult fish has been very low and after an increase in other fish species was observed in sampling (Morris and Green, 2021), the 2010, 2011, and 2015 year classes appear relatively weak, however 2013, 2014, 2016, 2018–2020 year classes appear strong (Figure 11). These relatively strong year classes, produced while overall spawner abundances have been very low, are critical for the recovery of the Gilbert Bay cod population. Their observed persistence throughout the juvenile stage until age 4 years, at relatively high abundances, indicates reasonable survival to a size where predation from sculpin and Rock Cod is far less likely. MPA monitoring at the study site (The Shinneys) to date has only sampled small (< 35 cm) sculpin and Rock Cod (Morris and Green, 2021), that are not likely to prey upon age 4 Gilbert Bay cod. The survival of year classes to age five and older suggests they will contribute to the spawning population, which is needed for population recovery.
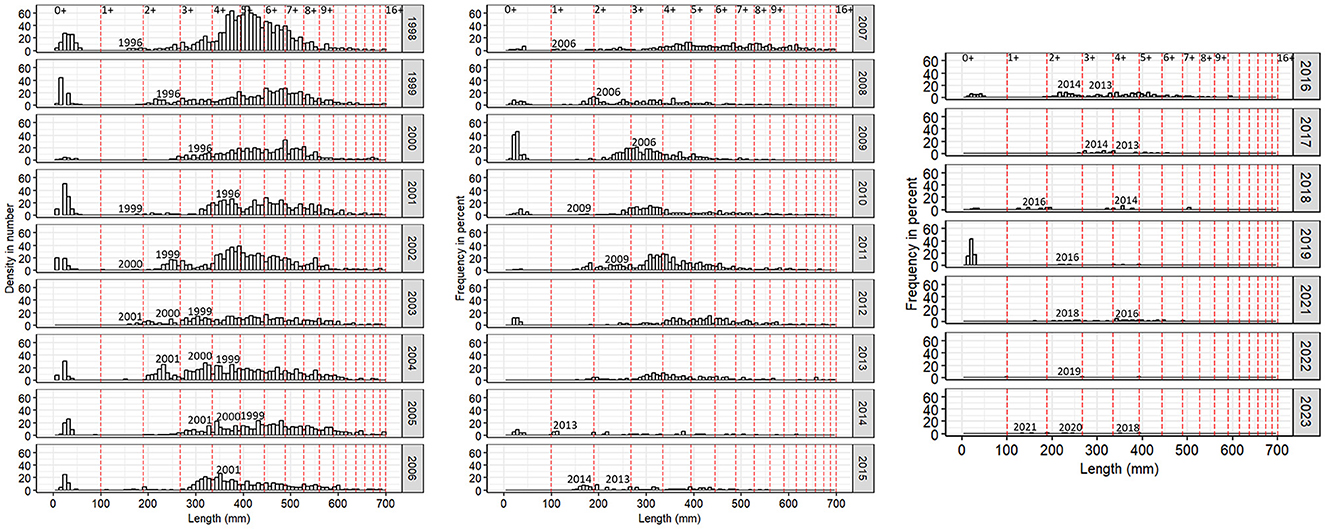
Figure 11. Length frequency distribution of juvenile and adult cod sampled from 1998 to 2023 in The Shinneys. A plankton net was used to catch juveniles (<100 mm) in early August, while larger fish were caught by angling in early June. Sample details are listed in Table 1. Vertical red dash lines represent year-at-age, predicted based on von-Bertalanffy growth rate models (Morris et al., 2022). Spawning years are indicated on the figure. Due to COVID19 pandemic, there was no sample collected in 2020. 2021–2023 juvenile sampling data were also not included.
4 Discussion
The Gilbert Bay long-term MPA monitoring program enables the scientific evaluation of MPA effectiveness toward its objectives and provides science advice to support management decisions. Our quantitative stock assessment has shown that commercial fishing in areas adjacent the MPA is the most influential and manageable factor affecting the Gilbert Bay cod population. Using a similar fisheries assessment approach as that applied to adjacent fisheries (DFO, 2022b), to generate standard growth rate estimates and biological references points, can provide valuable advice for both MPA and fisheries managers. In addition to identifying direct fishery impcats, our results showed that the Gilbert Bay cod population has slow individual growth rates and low productivity, likely as a result of living in an environment with below 0oC temperatures for about half the year (Green et al., 2023). There is no data on food availability to examine its potential role on population growth. However, Gilbert Bay cod are well adapted to local conditions leading to a low natural mortality among the adult population, compared to other Atlantic cod populations that are reportedly experiencing higher rates of natural mortality (DFO, 2022a,b). Local adaptation to its environment may have enabled the Gilbert Bay cod population to recover from temperature stressors that other Atlantic cod are less able to Morris and Green (2021). Using a MPA to protect the Gilbert Bay cod population, and its contribution to the biodiversity of Atlantic cod, was only partially successful. The MPA removed commercial fishing from the populations most important overwintering and spawning areas that slowed its depletion, but it did not protect the populations entire home range. As a result, individuals that moved outside the MPA during the commercial northern cod fishing season remained susceptible to commercial fishing.
The stock assessment models based on fishing mortality and exploitation rate, and length-based indicators of fishing sustainability, show that the Gilbert Bay cod population has been overfished as a result of the northern cod fishery. Gilbert Bay cod were impacted when the northern cod stock migrated into coastal areas during the summer, including Gilbert Bay and adjacent areas, where both Gilbert Bay cod and northern cod were mixed and exploited. Commercial landings in the vicinity of Gilbert Bay likely removed more Gilbert Bay cod than the population could sustain during 13 of the 18 years considered in this study. The reduction in large fish is linked to reductions in egg production and juvenile abundances in that the abundance of Atlantic cod eggs and pelagic juveniles was significantly lower after the adult population of Gilbert Bay cod was reduced by more than 90%. Gilbert Bay cod cannot likely recover their former age structure and abundance with the level of fishing mortality that currently exists in areas adjacent the MPA. Interestingly, some strong year classes of pelagic juveniles were produced and survived to maturation even after the adult Gilbert Bay cod population became very low. Thus, even at the current low level of adult population abundance, the production of some strong year classes suggests that a reduction in commercial fishing mortality could still promote recovery of the Gilbert Bay cod population toward a more healthy length frequency distribution, including a higher proportion of spawners.
When Gilbert Bay cod monitoring began in 1998, the population was high in abundance and contained a large proportion of adult spawners. These fish were either spawned or grew from young juveniles to adult sizes during the northern cod fishing moratorium from 1992 to 1998 (Morris and Green, 2002). Fish tracking studies conducted since 1998 have shown that many mature Gilbert Bay cod migrate to areas outside the MPA in summer, covering an area of ~270 km2, then return to the MPA during fall to overwinter and spawn (Morris et al., 2014). While outside the MPA, some Gilbert Bay cod were caught during the stewardship fishery for northern cod (Morris and Green, 2014, 2017; Green et al., 2023). In some years as much as 65% of the catch in areas close to MPA boundaries were identified genetically as being Gilbert Bay cod (Sinclair-Waters et al., 2018). Further to this, the size selectivity of gillnets, the main fishing gear used to harvest Atlantic cod along the south coast of Labrador (DFO, 2019), is consistent with size of fish now missing from MPA monitoring data. The commercial northern cod fishery in areas adjacent the MPA has been, and still is, the primary factor linked to the decline in the Gilbert Bay cod population (Morris and Green, 2014). As a result, the stock assessment results reported here show high rates of fishing mortality and exploitation of Gilbert Bay cod. Furthermore, a potential tipping-point transition associated with a low abundance of Gilbert Bay cod and changes in fish community structure within inner portions of Gilbert Bay, is a concern for the Gilbert Bay cod recovery (Morris and Green, 2021). Based on the data available, increased predation on juvenile Gilbert Bay cod because of fish community changes is not yet a significant cause of mortality; however, it will be important to monitor both the survival of juvenile year classes and the abundance and distribution of potentially predatory and/or competitive fish species over time. Factors affecting the production, survival, and behavior of individuals comprising future year classes of Gilbert Bay cod should continue to be an important monitoring and research priority for the MPA.
5 Conclusion
In this study, long-term monitoring data describing important population trends (including eggs, juveniles, adults) as well as threats affecting the Gilbert Bay cod population (such as fishing, fish-community changes, and environmental conditions) were evaluated. By incorporating available data into a quantitative fishery stock assessment approach we estimated model parameters and references levels consistent with the results of stock assessment processes, that are used to inform fisheries management decisions. This analysis indicates that the Gilbert Bay cod population has been overfished. Currently few commercial-size Gilbert Bay cod exist, which indicates the health of this population is poor. With current spawner numbers far below those of a healthy population, the remaining mature cod in Gilbert Bay are important for its recovery. Among the many factors considered, the analyses reported here indicate that fishing in areas adjacent the MPA has been the most important factor negatively affecting MPA goals and the recovery of the Gilbert Bay cod population. Significant population changes at the juvenile or adult stages were not associated with the environmental conditions considered. Despite significant declines in the adult population, as well as reduced abundances of eggs and early-stage juveniles, observation of some strong year classes produced after significant population decline suggests the population still has potential to recover if adequately protected from commercial fishing. Fishing in areas adjacent to the Gilbert Bay MPA during the northern cod fishery is the most likely and manageable factor affecting cod population recovery. Research on commercial fishing locations, timing, and catch composition within the Gilbert Bay cod's home range could improve future management decisions.
Data availability statement
The raw data supporting the conclusions of this article will be made available by the authors, without undue reservation.
Ethics statement
The animal study was approved by Canadian Council of Animal Care. The study was conducted in accordance with the local legislation and institutional requirements.
Author contributions
KN: Conceptualization, Data curation, Formal analysis, Investigation, Methodology, Software, Validation, Visualization, Writing – original draft, Writing – review & editing. CM: Conceptualization, Data curation, Funding acquisition, Investigation, Methodology, Project administration, Resources, Supervision, Validation, Visualization, Writing – original draft, Writing – review & editing. JG: Conceptualization, Investigation, Methodology, Supervision, Writing – original draft, Writing – review & editing. CP: Data curation, Investigation, Methodology, Writing – original draft. JH: Data curation, Investigation, Writing – original draft.
Funding
The author(s) declare that no financial support was received for the research and/or publication of this article. This work was funded by Fisheries and Oceans Canada.
Acknowledgments
Authors thank Fisheries and Oceans Canada for providing continuing support for the long-term data collection on the Gilbert Bay cod population. This study received much assistance from many people involved in the Gilbert Bay Marine Protected Area program. Authors are grateful to George Rowe and George Morris for their assistance with fieldwork. Authors also extend many thanks to the NunatuKavut Community Council for the valuable long-term field support. We wish to acknowledge Dr. Tony Kess, Dr. Divya Varkey, for their constructive. We also thank colleagues who reviewed the manuscript and offered valuable comments that substantially improved it.
Conflict of interest
The authors declare that the research was conducted in the absence of any commercial or financial relationships that could be construed as a potential conflict of interest.
Generative AI statement
The author(s) declare that no Gen AI was used in the creation of this manuscript.
Publisher's note
All claims expressed in this article are solely those of the authors and do not necessarily represent those of their affiliated organizations, or those of the publisher, the editors and the reviewers. Any product that may be evaluated in this article, or claim that may be made by its manufacturer, is not guaranteed or endorsed by the publisher.
References
Barneche, D. R., White, C. R., and Marshall, D. J. (2018). Fish reproductive-energy output increases disproportionately with body size. Science 645, 642–645. doi: 10.1126/science.aao6868
Berkeley, S. A., Hixon, M. A., Larson, R. J., and Love, M. S. (2004). Fisheries sustainability via protection of age structure and spatial distribution of fish populations. Fisheries 29, 23–32. doi: 10.1577/1548-8446(2004)29[23:FSVPOA]2.0.CO;2
Best, S., Lundrigan, S., Demirov, E., Wroblewski, J., and Bay, S. M. (2011). Interannual variability of physical oceanographic characteristics of Gilbert Bay: a marine protected area in Labrador, Canada. J. Mar. Syst. 88, 128–138. doi: 10.1016/j.jmarsys.2011.02.012
Beverton, R. J. H. (1992). Patterns of reproductive strategy parameters in some marine teleost fishes. J. Fish Biol. 41, 137–160. doi: 10.1111/j.1095-8649.1992.tb03875.x
Beverton, R. J. H., and Holt, S. J. (1957). On the dynamics of exploited fish populations U.K. Minist. Agric. Fish. Fish. Invest. Ser. 2. London: Springer, 19.
Bové, D. S., Held, L., and Kauermann, G. (2015). Objective Bayesian model selection in generalized additive models with penalized splines. J. Comput. Graph. Stat. 24, 394–415. doi: 10.1080/10618600.2014.912136
Burnham, K. P., and Anderson, D. R. (2004). Multimodel inference: understanding AIC and BIC in model Selection. Sociol. Methods Res. 33, 261–304. doi: 10.1177/0049124104268644
Canada Gazette (2005). Gilbert Bay Marine Protected Area Regulations Part 1, Vol. 139, 25, 2225–2252. Available at: http://canadagazette.gc.ca/partII/2005/20051019/html/sor295-e.html (accessed March 12, 2021).
Cope, J. M., and Punt, A. E. (2009). Length-based reference points for data-limited situations: applications and restrictions. Mar. Coast. Fish. 1, 169–186. doi: 10.1577/C08-025.1
Cyr, F., Colbourne, E., Holden, J., Snook, S., Han, G., Chen, N., et al. (2019). Physical oceanographic conditions on the Newfoundland and Labrador Shelf during 2017. DFO Can. Sci. Advis. Sec. Res. Doc. 2019/051. St. John's, NL.
DFO (2010). Review of the Gilbert Bay Marine Protected Area monitoring indicators, protocols and strategies, and an assessment of the Gilbert Bay cod population. DFOCan. Sci. Advis. Sec. Sci. Advis. Rep. 2010/027. St. John's, NL.
DFO (2019). Stock assessment of northern cod (NAFO Divisions 2J3KL) in 2019. DFOCan. Sci. Advis. Sec. Sci. Advis. Rep. 2019/050. Available at: https://waves-vagues.dfo-mpo.gc.ca/Library/40872142.pdf
DFO (2022a). Stock assessment of Northern cod (NAFO Divisions 2J3KL) in 2021. DFOCan. Sci. Advis. Sec. Sci. Advis. Rep. 2022/041. St. John's, NL.
DFO (2022b). Stock assessment of NAFO subdivision 3Ps cod. DFOCan. Sci. Advis. Sec. Sci. Advis. Rep. 2022/022. St. John's, NL.
Fragoso, T. M., Bertoli, W., and Louzada, F. (2018). Bayesian Model Averaging: a systematic review and conceptual classification. Int. Stat. Rev. 86, 1–28. doi: 10.1111/insr.12243
Froese, R. (2004). Keep it simple: three indicators to deal with overfishing. Fish Fish. 5, 86–91. doi: 10.1111/j.1467-2979.2004.00144.x
Green, J. M., Schornagal, D., Nguyen, K. Q., Pennell, C., and Morris, C. (2023). Field observations of the movements of locally adapted Atlantic cod (Gadus morhua) living in zero and sub-zero centigrade temperatures for half the year. Can. J. Zool. 102, 253–263. doi: 10.1139/cjz-2023-0067
Gulland, J. A. (1971). The Fish Resources of the Oceans. West Byfleet, Surrey: Fishing News (Books) Ltd.
Hoeting, J. A., Madigan, D., Raftery, A. E., and Volinsky, C. T. (1999). Bayesian model averaging: a tutorial. Stat. Sci. 14, 382–401. doi: 10.1214/ss/1009212519
Lehmann, A., Overton, J. M., and Leathwick, J. R. (2002). GRASP: generalized regression analysis and spatial prediction. Ecol. Modell. 157, 189–207. doi: 10.1016/S0304-3800(02)00195-3
Mello, L. G. S., and Simpson, M. R. (2023). Sentinel Surveys 1995-2020 – catch rates and biological information on Atlantic Cod (Gadus morhua) in NAFO Divisions 2J3KL. DFO Can. Sci. Advis. Sec. Res. Doc. 2023/041, iv + 33. St. John's, NL.
Mildenberger, T. K., Taylor, M. H., and Wolff, M. (2017). TropFishR: an R package for fisheries analysis with length-frequency data. Methods Ecol. Evol. 8, 1520–1527. doi: 10.1111/2041-210X.12791
Mora, C., Myers, R. A., Coll, M., Libralato, S., Pitcher, T. J., Sumaila, R. U., et al. (2009). Management effectiveness of the world's marine fisheries. PLoS Biol. 7:e1000131. doi: 10.1371/journal.pbio.1000131
Morris, C. J., and Green, J. M. (2014). MPA regulations should incorporate adaptive management-the case of Gilbert Bay Labrador Atlantic cod (Gadus morhua). Mar. Policy 49, 20–28. doi: 10.1016/j.marpol.2014.03.025
Morris, C. J., and Green, J. M. (2017). Assessment of Gilbert Bay's marine protected area indicator monitoring. DFO Can. Sci. Advis. Sec. Res. Doc. 2017/055, v + 21. St. John's, NL.
Morris, C. J., and Green, J. M. (2021). Is the protected Atlantic cod (Gadus morhua) population in Gilbert Bay, Labrador, nearing a tipping point? Aquat. Conserv. Mar. Freshw. Ecosyst. 31, 2995–3002. doi: 10.1002/aqc.3666
Morris, C. J., Green, J. M., and Simms, J. M. (2003). Abundance of resident Atlantic Cod in Gilbert Bay, Labrador, based on mark recapture, sampling catch per unit effort and commercial tag return data collected from 1998-2002. DFO Can. Sci. Advis. Sec. Res. Doc. 2003/039, i + 16.
Morris, C. J., Green, J. M., Snelgrove, P. V. R., Pennell, C. J., and Ollerhead, L. M. N. (2014). Temporal and spatial migration of Atlantic cod (Gadus morhua) inside and outside a marine protected area and evidence for the role of prior experience in homing. Can. J. Fish. Aquat. Sci. 71, 1704–1712. doi: 10.1139/cjfas-2014-0036
Morris, C. J., Nguyen, K. Q., and Green, J. M. (2022). Comparison of lethal and non-lethal age-based growth estimation methodologies to assess an endemic bay population of Atlantic cod (Gadus morhua). J. Nat. Conserv. 70:126265. doi: 10.1016/j.jnc.2022.126265
Morris, J., and Green, M. (2002). Biological characteristics of a resident population of Atlantic cod (Gadus morhua L.) in southern Labrador. ICES J. Mar. Sci. 59, 666–678. doi: 10.1006/jmsc.2002.1228
Myers, R. A., and Mertz, G. (1998). The limits of exploitation: a precautionary approach. Ecol. Appl. 8, 165–169. doi: 10.2307/2641375
Pauly, D. (1980). On the interrelationships between natural mortality, growth parameters, and mean environmental temperature in 175 fish stocks. ICES J. Mar. Sci. 39, 175–192. doi: 10.1093/icesjms/39.2.175
Pauly, D. (1983). Some simple methods for the assessment of tropical fish stocks. FAO Fisheries Technical Paper 234. Rome: FAO, 52.
Pauly, D. (1990). Length-converted catch curves and the seasonal growth of fishes. Fishbyte 8, 33–38.
Pauly, D., Moreau, J., and Abad, N. (1995). Comparison of age-structured and length-converted catch curves of brown trout Salmo trutta in two French rivers. Fish. Res. 22, 197–204. doi: 10.1016/0165-7836(94)00323-O
Pedersen, E. J., Thompson, P. L., Ball, R. A., Fortin, M. J., Gouhier, T. C., Link, H., et al. (2017). Signatures of the collapse and incipient recovery of an overexploited marine ecosystem. R. Soc. Open Sci. 4:170215. doi: 10.1098/rsos.170215
Piironen, J., and Vehtari, A. (2017). Comparison of Bayesian predictive methods for model selection. Stat. Comput. 27, 711–735. doi: 10.1007/s11222-016-9649-y
Ricker, W. E. (1975). Computation and interpretation of biological statistics of fish populations. Fish. Res. Board Canada Bull. 191:382.
Rideout, R. M., and Ings, D. W. (2021). “Research vessel bottom trawl survey report (NL Region): a stock-by-stock summary of survey information up to and including the 2019 spring and autumn surveys,” in Can. Tech. Rep. Fish. Aquat. Sci. 3425, vii + 52.
Ruzzante, D. E., Wroblewski, J. S., Taggart, C. T., Smedbol, R. K., Cook, D., Goddard, S. V., et al. (2000). Bay-scale population structure in coastal Atlantic cod in Labrador and Newfoundland, Canada. J. Fish Biol. 56, 431–447. doi: 10.1111/j.1095-8649.2000.tb02116.x
Sandman, A., Isaeus, M., Bergström, U., and Kautsky, H. (2008). Spatial predictions of Baltic phytobenthic communities: measuring robustness of generalized additive models based on transect data. J. Mar. Syst. 74, 86–96. doi: 10.1016/j.jmarsys.2008.03.028
Schwamborn, R., Mildenberger, T. K., and Taylor, M. H. (2019). Assessing sources of uncertainty in length-based estimates of body growth in populations of fishes and macroinvertebrates with bootstrapped ELEFAN. Ecol. Modell. 393, 37–51. doi: 10.1016/j.ecolmodel.2018.12.001
Sinclair-Waters, M., Bentzen, P., Morris, C. J., Ruzzante, D. E., Kent, M. P., Lien, S., et al. (2018). Genomic tools for management and conservation of Atlantic cod in a coastal marine protected area. Can. J. Fish. Aquat. Sci. 75, 1915–1925. doi: 10.1139/cjfas-2017-0254
Sparre, P., and Venema, S. (1998). Introduction to Tropical Fish Stock Assessment. Part 1. Manual. FAO fisheries technical paper. No. 306. 1, Rev. 2. Rome: FAO.
Then, A. Y., Hoenig, J. M., Hall, N. G., and Hewitt, D. A. (2015). Evaluating the predictive performance of empirical estimators of natural mortality rate using information on over 200 fish species. ICES J. Mar. Sci. 72, 82–92. doi: 10.1093/icesjms/fsu136
Wang, K., Zhang, C., Xu, B., Xue, Y., and Ren, Y. (2020). Selecting optimal bin size to account for growth variability in Electronic LEngth Frequency ANalysis (ELEFAN). Fish. Res. 225:105474. doi: 10.1016/j.fishres.2019.105474
Wood, S. N. (2017). Generalized Additive Models: An Introduction with R, 2nd Edn. New York, NY: Chapman and Hall/CRC.
Xiang, Y., Gubian, S., Suomela, B., and Hoeng, J. (2013). Generalized simulated annealing for global optimization: the GenSA package. R J. 5, 13–28. doi: 10.32614/RJ-2013-002
Yin, Y., and Sampson, D. B. (2004). Bias and precision of estimates from an age-structured stock assessment program in relation to stock and data characteristics. North Am. J. Fish. Manag. 24, 865–879. doi: 10.1577/M03-107.1
Keywords: marine protected area (MPA), Atlantic cod (Gadus morhua L.), assessment, Canada, conservation
Citation: Nguyen KQ, Morris CJ, Green JM, Pennell C and Hanlon JM (2025) An assessment of the protected Gilbert Bay cod population and evaluation of factors driving observed changes in abundance. Front. Ocean Sustain. 3:1561396. doi: 10.3389/focsu.2025.1561396
Received: 15 January 2025; Accepted: 24 February 2025;
Published: 14 March 2025.
Edited by:
Erlend Moksness, Blue Growth & Marine Services, NorwayReviewed by:
Ana Brasão, Lusofona University, PortugalEsben Moland Olsen, Norwegian Institute of Marine Research (IMR), Norway
Copyright © 2025 Nguyen, Morris, Green, Pennell and Hanlon. This is an open-access article distributed under the terms of the Creative Commons Attribution License (CC BY). The use, distribution or reproduction in other forums is permitted, provided the original author(s) and the copyright owner(s) are credited and that the original publication in this journal is cited, in accordance with accepted academic practice. No use, distribution or reproduction is permitted which does not comply with these terms.
*Correspondence: Corey J. Morris, Y29yZXkubW9ycmlzQGRmby1tcG8uZ2MuY2E=