 Ángel Borja1*
 Idoia Adarraga2Juan Bald1Maria Jesús Belzunce-Segarra1Igor Cruz2Javier Franco1
 Joxe Mikel Garmendia1Joana Larreta1
 Aitor Laza-Martínez3Alberto Manzanos4Mikel Aitor Marquiegui2Inma Martín1Julian Martínez2
 Iratxe Menchaca1
 Sarai Pouso1
 Marta Revilla1
 José Germán Rodríguez1José María Ruiz2
 Yolanda Sagarmínaga1
 Oihana Solaun1Ainhize Uriarte1
 Izaskun Zorita1
 Iñigo Muxika1
- 1AZTI, Marine Research, Basque Research and Technology Alliance (BRTA), Pasaia, Spain
- 2Sociedad Cultural INSUB, San Sebastián, Spain
- 3Department of Plant Biology and Ecology, Faculty of Science and Technology, University of the Basque Country (UPV/EHU), Leioa, Spain
- 4Basque Water Agency (URA), Vitoria-Gasteiz, Spain
Read the accompanying Opinion Article
Publishing datasets, using artificial intelligence to help with metadata, can enhance ocean sustainability research and management
This dataset provides 28 years of environmental monitoring data (1995–2023) from 51 stations in the estuaries and coastal areas of the Basque Country in the Bay of Biscay. Covering 130 variables across water, sediments, and biota, it includes detailed records of phytoplankton, macroalgae, macroinvertebrates, and fish. Compiled in collaboration with the Basque Water Agency (URA), the dataset supports analysis of environmental responses to human pressures and management interventions, identifying patterns of environmental quality improvement within a context of natural variability. Provided in a FAIR2 Data Package, the dataset is structured to ensure Findability, Accessibility, Interoperability, Reusability, and Artificial Intelligence-readiness, facilitated by structured metadata and Application Programming Interface access. This resource is intended for researchers and policymakers examining anthropogenic and natural influences on aquatic ecosystems, contributing to sustainable management, conservation practices, and alignment with European directives, including the Water Framework Directive.
 FAIR2 CERTIFIEDTM
Explore interactive data here:
https://doi.org/10.71728/r1rj-f947
1 Introduction
In the pursuit of understanding and preserving marine ecosystems, it is crucial to meticulously assess and interpret environmental trends that influence their health. The dataset presented by Borja et al. (2016), published in Science of the Total Environment, provides a framework for interpreting statistically significant trends within marine environments. The objective of this dataset (1995–2023) is to bridge existing knowledge gaps in environmental monitoring by offering a structured approach to analyze and predict the impacts of various environmental changes on marine ecosystems.
The motivation for creating this dataset arises from the growing need to effectively manage and conserve marine biodiversity in the face of increasing anthropogenic pressures and climate change, by the Basque Water Agency (URA), owner of the data. Traditional methods of environmental assessment often fall short in integrating multifaceted data to produce actionable insights. This dataset addresses this limitation by allowing the calculation of a suite of indices, including AZTI's Marine Biotic Index (AMBI), Multivariate-AMBI (M-AMBI), AZTI's Fish Index (AFI), and the Physico-Chemical Quality Index (PCQI), which collectively offer a holistic view of marine environmental quality (Borja et al., 2024).
By including variables such as dissolved oxygen, pH, nutrients, optical properties and pollutant concentrations, the dataset enables researchers to identify processes that contribute to trends in marine environments, such as eutrophication and changes in biodiversity. For instance, the dataset elucidates how increased flushing and efficient wastewater management can lead to higher dissolved oxygen levels, thereby enhancing biological diversity. Conversely, it highlights the potential adverse effects of reduced flushing and organic load increases, such as those from agricultural runoff, which can exacerbate eutrophication and degrade water quality.
The target audience for this dataset includes marine scientists, environmental policymakers, and conservation practitioners. Researchers can utilize this dataset to deepen their understanding of marine ecosystem dynamics and to develop predictive models that anticipate future environmental changes. Policymakers and practitioners can leverage these insights to formulate evidence-based strategies for marine conservation, resource management, and regulatory compliance.
The broader implications of this dataset extend to ensuring sustainable use of marine resources, and preserving ecosystem services that are vital for human wellbeing. By providing a robust framework for trend interpretation, this dataset facilitates informed decision-making processes that are essential for maintaining the ecological balance and resilience of marine environments.
In summary, the dataset (1995–2023) developed here addresses a critical need for integrated environmental assessment methodologies in marine ecosystems. Its approach to measuring environmental trends not only fills a significant research gap but also advances the field by offering a practical tool for various stakeholders engaged in marine ecosystem management. Through its application, the dataset has the potential to significantly contribute to the sustainable stewardship of our planet's marine resources.
2 Methods summary
This methods summary outlines the research design, sampling strategy, instrumentation, and measurement techniques used in this study. Sampling methods include the selection of monitoring stations, sample collection intervals, and specific approaches for water, sediment, and biota components. Instrumentation details cover the devices used for in situ measurements, laboratory analyses, and calibration procedures to ensure measurement accuracy. Measurement techniques describe the variables assessed, including water quality parameters (e.g., dissolved oxygen, pH, nutrients), sediment composition, and biotic indices.
Detailed protocols, quality control measures, and data handling processes are documented in the accompanying FAIR2 Data Package and Portal (https://doi.org/10.71728/r1rj-f947). These include guidelines on calibration protocols, data validation procedures, metadata integration, and data management standards, providing a complete record of methods for reproducibility and adherence to data standards.
2.1 Research design and approach
2.1.1 Objective and scope
This study assessed environmental quality trends in the Basque Country's marine ecosystems through long-term monitoring data spanning from 1995 to 2023 (with some fish data starting in 1989). It focused on key environmental components—water, sediment, and biota—to measure the influence of human activities, such as industrial and urban discharges, as well as the impact of management actions, like wastewater treatment. Data were gathered from 51 sampling stations across the Bay of Biscay (for water, sediments, phytoplankton and macroinvertebrates), with additional stations for biomonitors, macroalgae and fish. The study was designed to identify changes in environmental conditions and the effectiveness of management actions in improving ecological health.
The dataset responds to the estuarine and coastal monitoring and assessment required under the European Water Framework Directive (WFD; European Commission, 2000). As such, the names of the biological elements sampled within this directive are used in this paper, i.e. phytoplankton, macroalgae, macroinvertebrates and fish. However, the methods used to assess the status of these biological elements can use additional organisms, e.g. (i) in the case of macroalgae, the Rocky Intertidal Community Quality Index (RICQI) method includes also some fauna data (Díez et al., 2012), and (ii) in the case of fish, the AFI method includes also crustaceans (Uriarte and Borja, 2009). For the sake of WFD understanding, each biological element has been named as in the WFD, although in the dataset the additional information required to calculate those indices has been maintained.
2.1.2 Approach overview
The study utilized an observational monitoring approach, collecting data over nearly three decades to facilitate a robust trend analysis of ecosystem variables influenced by both anthropogenic and natural factors. Sampling adhered to standardized protocols for various components (water, sediment, and biota) established by the Basque Water Agency (URA) and AZTI. The methodology for water quality sampling followed EN 15972:2011 guidelines, ensuring data consistency and comparability across temporal and spatial scales.
2.2. Instrumentation and sample preparation
2.2.1 Setup of tools/systems
Instrumentation setups were standardized across water, sediment, and biota sampling to ensure consistent data collection. Water samples were collected with Niskin bottles or a bucket and parameters, like salinity, temperature, and dissolved oxygen, were sampled in situ using a CTD probe, regularly calibrated to align with EN 15972:2011 water quality standards. Sediment samples were taken by hand from intertidal estuarine zones and with a van Veen grab from subtidal estuarine and coastal locations, supporting analyses of variables like particulate organic carbon and redox potential. Biota (mussels or oysters) was sampled for contaminants analysis. Biodiversity sampling varied: fish were collected using a beam trawl, invertebrates in intertidal areas using quadrats and in subtidal areas using a van Veen grab (0.1 m2), phytoplankton through water sampling, using a Niskin bottle or a bucket, and macroalgae directly in the intertidal area, using quadrats.
2.2.2 Calibration of instruments
Calibration details were provided mainly for the CTD probe used in water sampling, following EN 15972:2011 standards for accuracy in dissolved oxygen, temperature, and salinity.
2.2.3 Sample preparation
Sample preparation varied by component type. Water samples were cooled to 4°C until processing within 24 h. When processed, they were filtered for the determination of suspended solids and chlorophyll-a, for the rest of the parameters the samples were frozen until their determination. Sediment samples were kept refrigerated until processing for particle size, organic matter and metals, where the sample was oven dried at 50°C for particle size and organic matter. Another replicate for organic contaminants was kept frozen before freeze-drying. Biota samples, such as mussels or oysters, were frozen before freeze-drying to detect contaminants. In addition, fish and invertebrates were also collected and analyzed on site for abundance assessment.
2.3 Data collection
2.3.1 Timing and frequency
Data collection occurred at regular intervals to ensure consistency across time and capture seasonal variations. Water samples were collected quarterly, with estuarine stations sampled at both high and low tides to assess tidal influences. Sediment sampling was conducted annually each winter, maintaining baseline consistency across years. Biota samples were collected in autumn. Biodiversity was collected twice a year (spring and summer) for phytoplankton up to 2008 and quarterly from then on, every 3 years in spring for macroalgae, every 3 years (annually in some stations) and in autumn for fish and invertebrate sampling in winter annually.
2.3.2 Variables and measurements
Explicitly measured variables were selected to provide a detailed assessment of environmental quality across water, sediment, and biota. Water variables included temperature, pH, dissolved oxygen, oxygen saturation, salinity, turbidity, total organic carbon, nutrients (nitrate, nitrite, ammonia, orthophosphate, silicate), and metal concentrations (copper, nickel, lead, zinc, etc.) and organic compounds. Sediment samples were analyzed for particulate organic carbon, redox potential, % gravel, % mud, % organic matter, metals and organic compounds. Biota measurements included contaminants in mussels and oysters (e.g., PAHs, heavy metals). Biodiversity measures include chlorophyll-a and cell counts in phytoplankton, macroalgae coverage, and fish and invertebrate abundance.
2.3.3 Post-processing
Statistical analyses were performed to assess environmental trends over time. Linear models were applied to examine trends in key variables, such as dissolved oxygen, nutrient levels, and contaminants. These trends were standardized for consistent interpretation; for example, an increase in dissolved oxygen indicated an improvement, whereas an increase in pollutants signified degradation. R software was employed for statistical resampling, specifically using the boot package for bootstrap confidence intervals. Detailed coding scripts were not provided. Additional information can be consulted in Borja et al. (2024).
2.4 Quality assurance and validation
2.4.1 Quality assurance measures
Standardized protocols were applied to maintain data consistency and accuracy. Water sampling followed EN 15972:2011 standards, aligning with European Union regulations to ensure reliable, comparable data across all 51 sampling stations. This consistency was critical for temporal and spatial analysis. Sediment and biota sampling followed URA and AZTI guidelines, although specific quality control measures, such as thresholds for acceptable data variability and protocols for handling outliers, were not documented.
2.4.2 Validation Information
Bootstrap resampling was used to establish non-parametric confidence intervals for each variable, providing a statistical validation for observed time-series trends. When independent datasets were available, high-variability variables underwent cross-validation and statistical adjustments to refine trend accuracy by accounting for environmental fluctuations. For variables without cross-validation, such as those affected by high natural variability (e.g., nutrient levels and sediment composition), trends were cautiously interpreted to account for the possibility that natural variability could influence observed changes. Additional information can be consulted in Borja et al. (2016, 2024).
3 Data overview
3.1 Data summary
The dataset represents a long-term monitoring network (1995–2023) in the Southeastern Bay of Biscay, focused on evaluating ecosystem components in response to natural variability, anthropogenic pressures and management actions. Variables cover water quality (seven measured in situ and 45 analyzed in the laboratory), sediment characteristics (one in situ and 50 in the laboratory), contaminants in biota (35 in the laboratory) and biological indicators such as phytoplankton, macroalgae (including seagrasses and certain intertidal macrofauna taxa characteristic of tidal zones), macroinvertebrates, and fish (including demersal crustaceans). Analytical methods—including colorimetry, gravimetry, and spectrometry—were used to measure in the laboratory 130 variables across water (five nutrients, nine metals and 31 organic compounds), sediment (five characterizing the sediment, nine metals and 36 organic compounds), and biota (seven metals and 28 organic compounds). Additional information can be consulted in Borja et al. (2024). The data reveal trends in biological quality, with observed correlations to factors like salinity and rainfall (Borja et al., 2016). Such patterns emphasize the value of systematic monitoring for understanding interactions between human activities and environmental conditions. Developed with the Basque Water Agency (URA), the dataset highlights responses of ecosystem quality to management interventions, such as pollutant reduction measures, over nearly three decades. This assessment provides a basis for distinguishing natural variability from anthropogenic impacts and supports future applications in marine management and adaptive monitoring strategies essential for evidence-based decision-making in marine ecosystem management.
3.2 Quantitative summary of the dataset
This dataset provides an extensive record of sampling activities across six primary components: macroalgae, phytoplankton, macroinvertebrates, fish, sediments, and water samples. The summary below captures detailed information on sample counts, temporal coverage, geographic distribution, species diversity, measurement variability, environmental correlations, data completeness, and insights into observed trends.
3.2.1 Total number of records
The total number of records available in the dataset corresponds to each sampling event and variables associated to each element:
• Macroalgae: 28,373 records
• Phytoplankton: 57,945 records
• Fish: 3,629 records
• Macroinvertebrates: 28,041 records
• Sediments: 56,150 records
• Water samples: 271,925 records
• Biota samples: 12,852 records.
The sample sizes across these components reflect varying sampling intensity and objectives for each category. Water samples, the most frequently collected, account for high-frequency monitoring of environmental parameters, while fish records, with a lower count, reflect a more targeted monitoring approach.
3.2.2 Temporal coverage
• Overall time range: 1995 to 2023, with variability in sampling frequency by component.
• Macroalgae: Sampled every 3 years at each station, since 2003, with annual sample counts ranging from 675 to 1,877 (mean: 1,290). Intensive sampling was conducted from 2005 to 2015, providing detailed data during this period.
• Phytoplankton: Sampled annually from 2002 with consistent coverage, peaking from 2010 to 2018. Annual sample counts vary from 624 to 5,191 (mean: 2,634), allowing robust temporal analysis.
• Fish: Sampled every three years from 1989 (but with some stations sampled annually), with lower sample intensity ranging from 13 to 265 samples per year (mean: 104), reflecting a targeted approach with fewer samples.
• Macroinvertebrates: Sampled annually from 1995, with sample counts per year ranging from 330 to 1,494 (mean: 967). Sampling frequency increased after 2005 due to expanded station coverage.
• Sediments: Sampled annually, with 30 years of data beginning in 1994. Sample counts range from 78 (in early years) to 2,798 per year (mean: 1,872), with full coverage by 2005.
• Water samples: Collected at high frequency, potentially monthly or every 3 months, with annual counts ranging from 602 to 13,338 (mean: 9,064). The dataset contains up to 1,620 unique sampling dates, enhancing the dataset's capacity for high-resolution temporal analysis.
• Biota samples: Sampled annually, from 1995, in autumn. There is a gap in data between 2017 and 2019, included.
3.2.3 Geographic coverage
• Sampling locations: The dataset includes 714 unique geographic sites, spanning both coastal and estuarine regions of the Basque Country.
• Geographic focus: Sampling sites are primarily located along the Basque coast and estuarine zones within the Bay of Biscay, providing robust spatial data for coastal and estuarine ecosystems. Sampling density varies by component, reflecting monitoring priorities across regions.
3.2.4 Attribute or category diversity (unique taxa)
• Macroalgae: 306 unique taxa
• Phytoplankton: 505 unique taxa
• Fish: 132 unique taxa
• Macroinvertebrates: 1,493 unique taxa
Trends in diversity: Temporal fluctuations in species richness show peak diversity in phytoplankton around 2015, likely influenced by changes in fixatives and laboratory staff or increased sampling efforts. Species diversity across macroinvertebrates and macroalgae also reflects natural variability within estuarine and coastal ecosystems.
3.2.5 Environmental correlations
• Dissolved oxygen and temperature: Moderate negative correlation (r = −0.45), indicating that dissolved oxygen levels generally decrease as temperature increases, a common characteristic in aquatic ecosystems under thermal influence.
• Dissolved oxygen and pH: Weak positive correlation (r = 0.22), suggesting a slight association between pH and dissolved oxygen.
• Temperature and pH: Minimal correlation (r = −0.03), indicating negligible association between these two parameters.
3.2.6 Data completeness
• Missing data: The dataset demonstrates a high level of completeness, with only 0.66% missing entries in the water samples and <0.001% in sediments, enabling consistent longitudinal trend analysis with minimal bias due to missing data.
3.2.7 Key observations and patterns
• Temporal trends: Periods of intensified sampling correlate with peaks in species richness, highlighting potential biodiversity responses to environmental conditions. Additional information can be consulted in Borja et al. (2016).
• Spatial focus: Sampling efforts are concentrated along the Basque coast and estuarine regions, with intensive monitoring in targeted areas, supporting focused studies on biodiversity and ecosystem health.
• Diversity patterns: Phytoplankton show the highest species richness, while fish demonstrate stable yet lower diversity compared to other groups, reflecting different ecological roles within these marine systems.
• Environmental drivers: Moderate correlations with pH and dissolved oxygen suggest that these parameters may influence species abundance, particularly in phytoplankton, pointing to potential environmental drivers of biodiversity within the dataset.
3.3 FAIR2 compliance certification
The dataset supporting the findings of this study is available through a FAIR2 Data Portal, which ensures that the data adhere to the principles of Findability, Accessibility, Interoperability, and Reusability (FAIR), with additional emphasis on including detailed Contextual metadata and AI-Readiness and Responsible AI practices. All raw data, metadata, and supplementary materials, including detailed protocols and methods, are accessible via the FAIR2 Data Portal (https://doi.org/10.71728/r1rj-f947).
The dataset has been structured to ensure compliance with FAIR2 standards (see fair2.ai), enabling easy integration with other datasets and promoting reuse in future research. Researchers can access the dataset in multiple formats, and appropriate documentation is provided to facilitate transparency and reproducibility. Any updates or corrections to the dataset will also be managed and tracked through the portal, ensuring long-term accessibility and version control (Table 1).
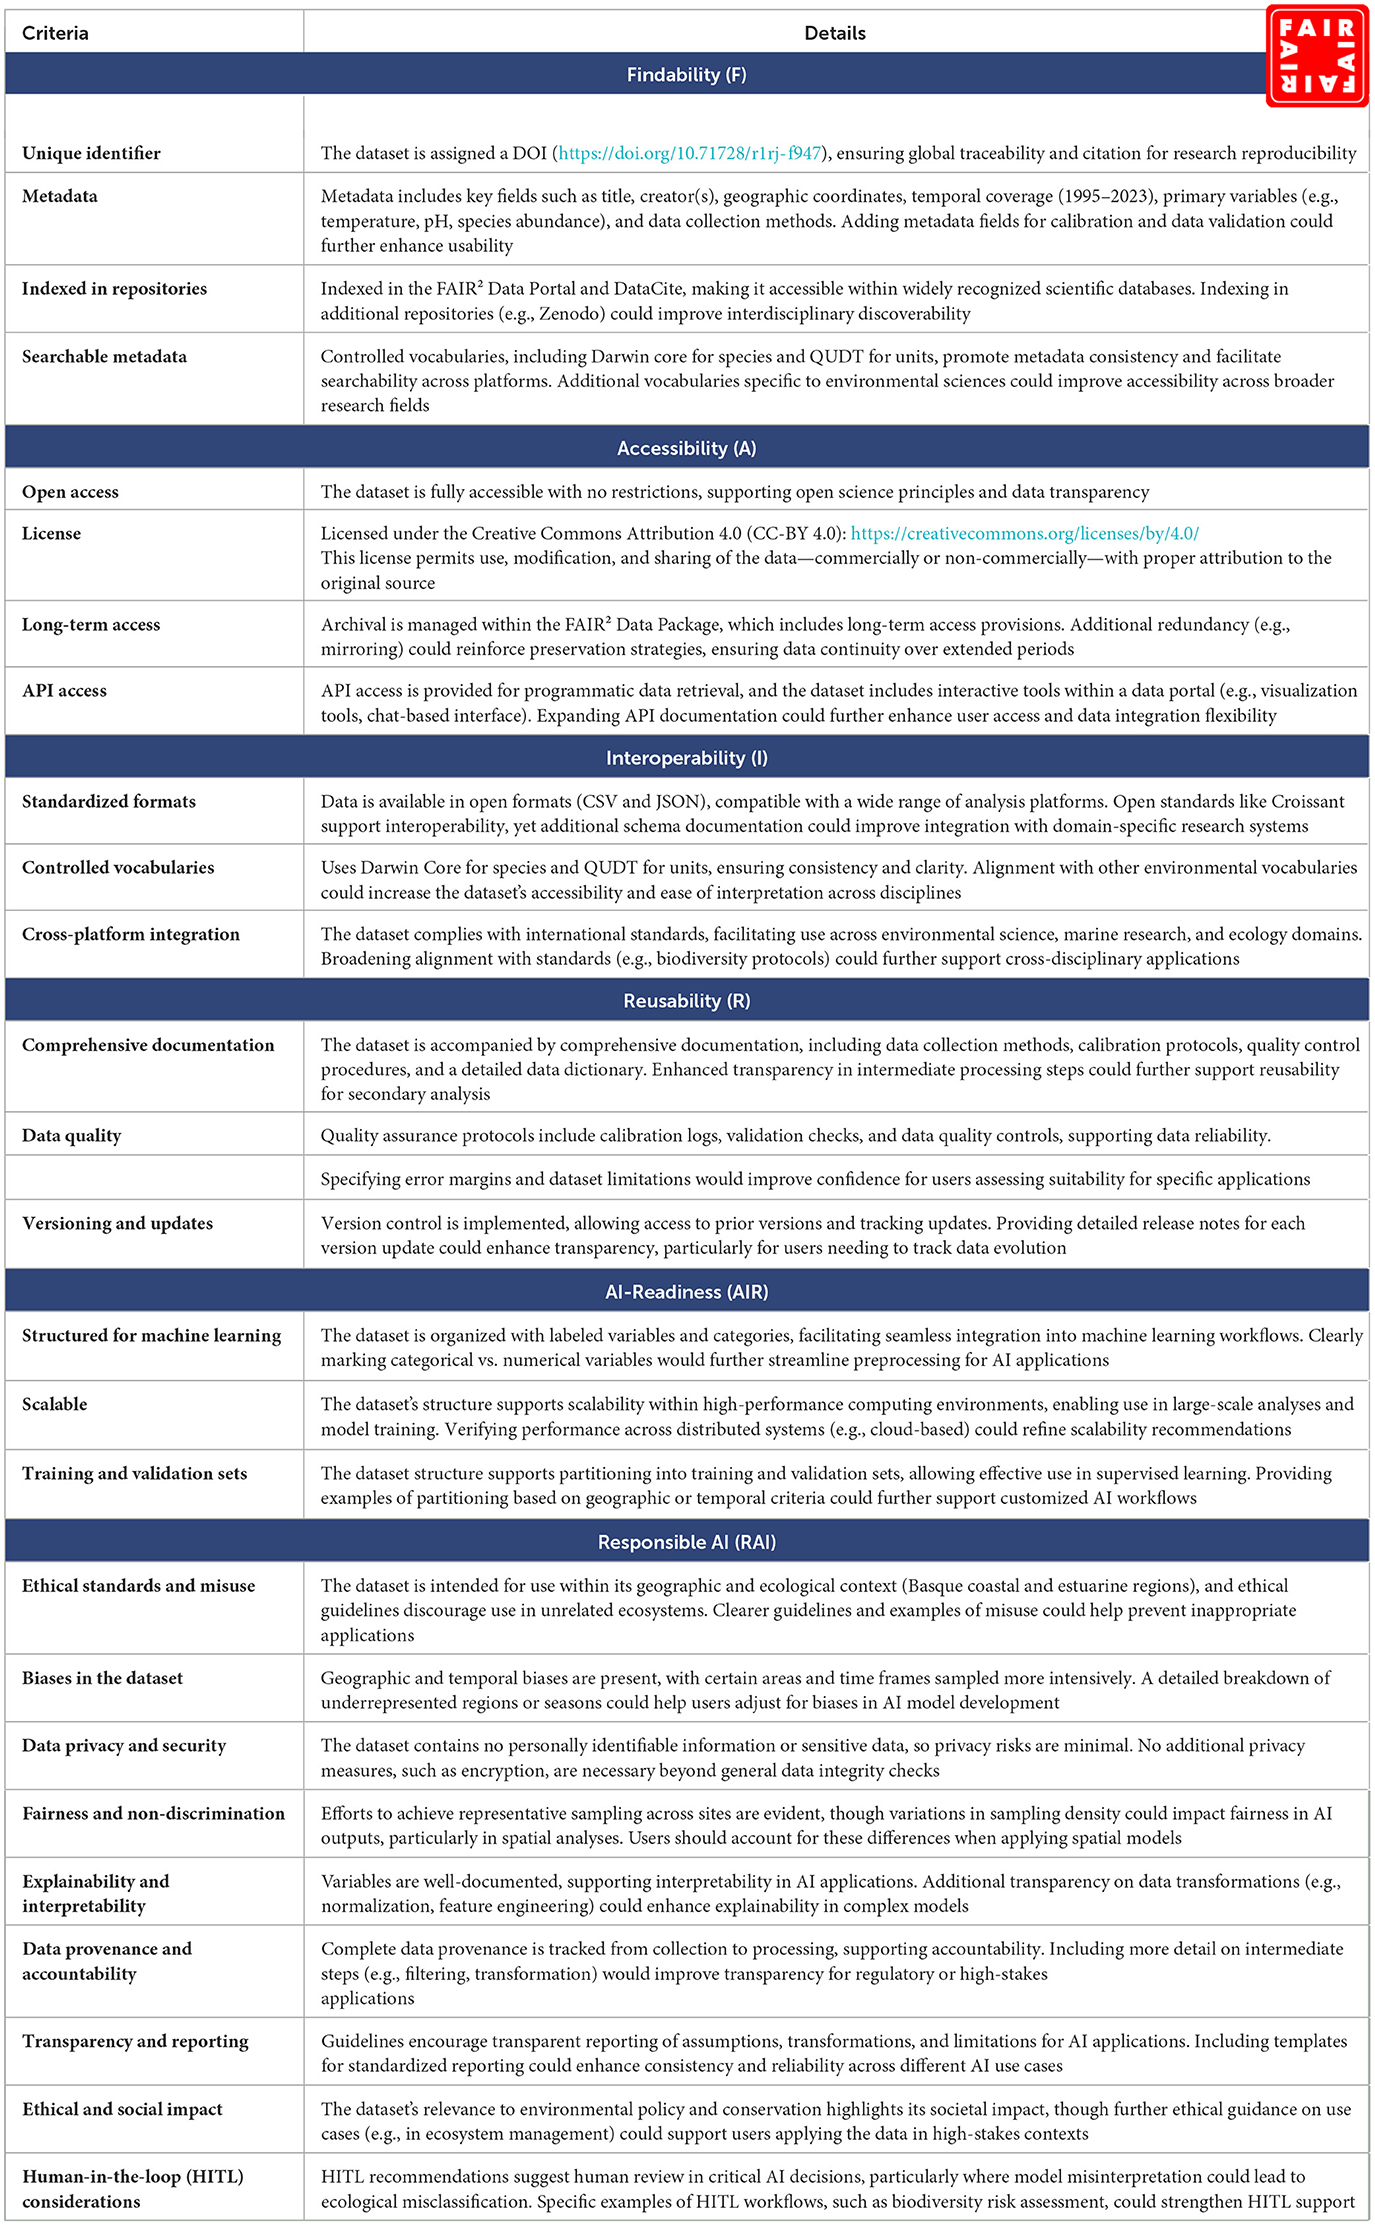
Table 1. Summary of criteria for FAIR2 certification, including findability, accessibility, interoperability, reusability, AI readiness, and responsible AI alignment.
4 Visual overview
Figure 1 highlights the sampling points across different geographic locations, with points colored by taxonomic groups (e.g., macroalgae, phytoplankton, fish, macroinvertebrates).
• Colors: Each color represents a different taxonomic group, providing a clear distinction between the sampled entities (water, sediment, phytoplankton, invertebrates; macroalgae; fish; biota).
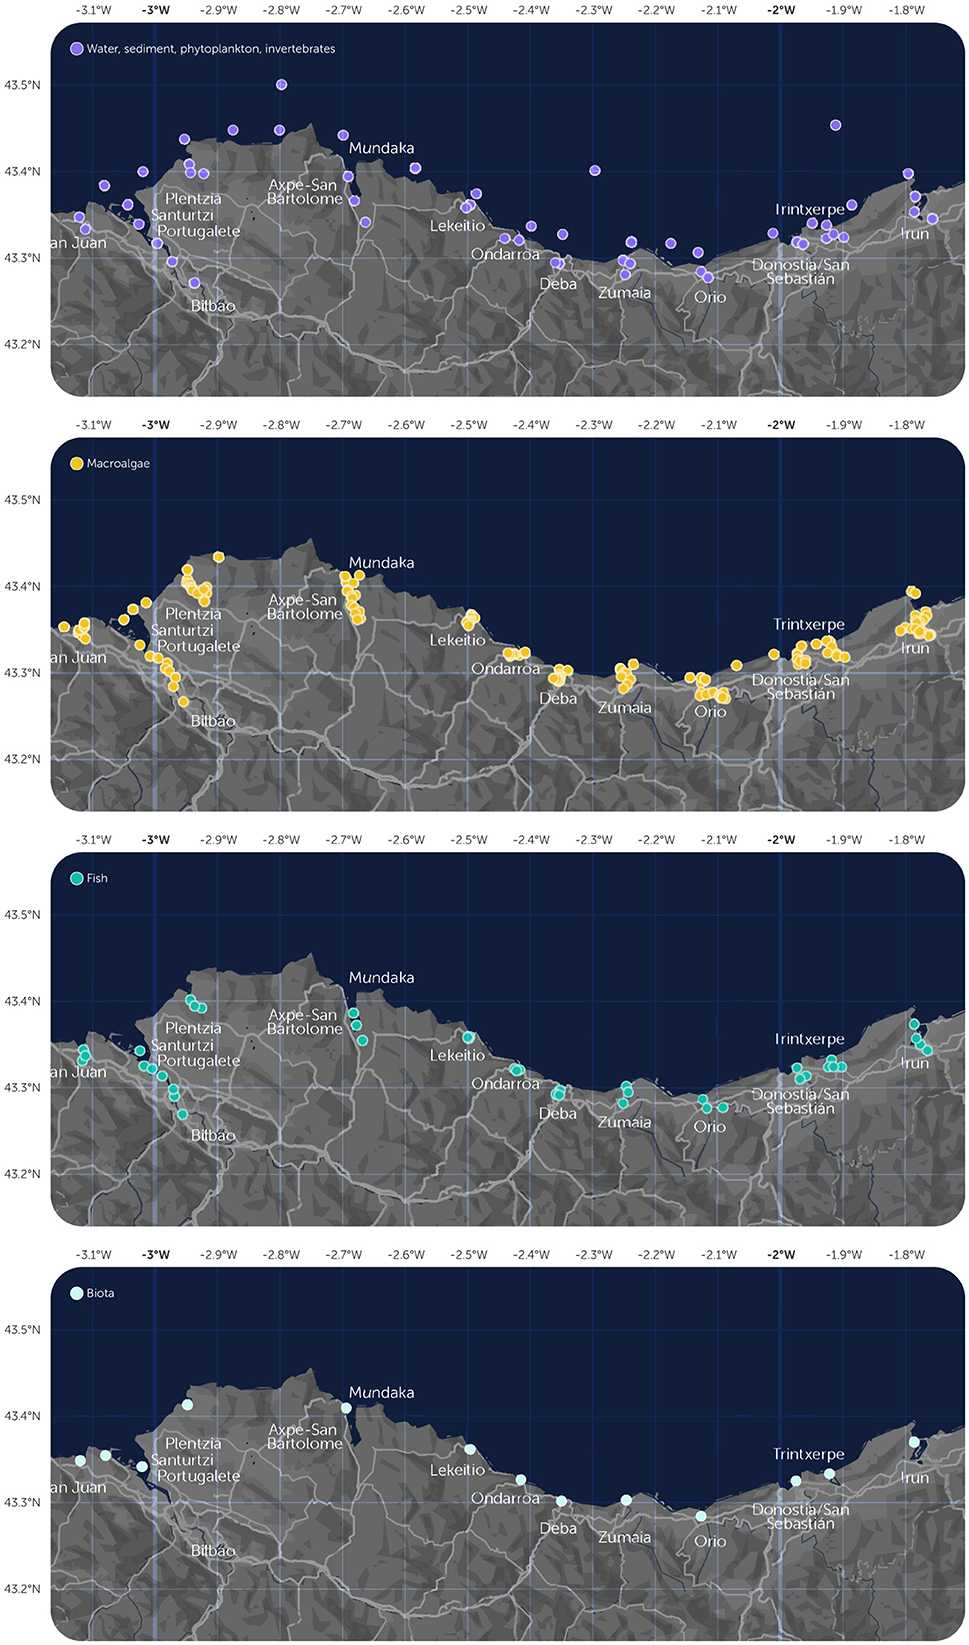
Figure 1. Geographical distribution of sampling points by matrix and biological element in the Basque Country coast and estuaries.
Figure 2 represents annual sampling trends for various ecosystem components from 1989 to 2023 within the Basque Country monitoring network. The categories include macroalgae, phytoplankton, fish, invertebrates, sediments, and water quality parameters. Each is distinctly color-coded, illustrating shifts in monitoring intensity and highlighting key periods of focus.
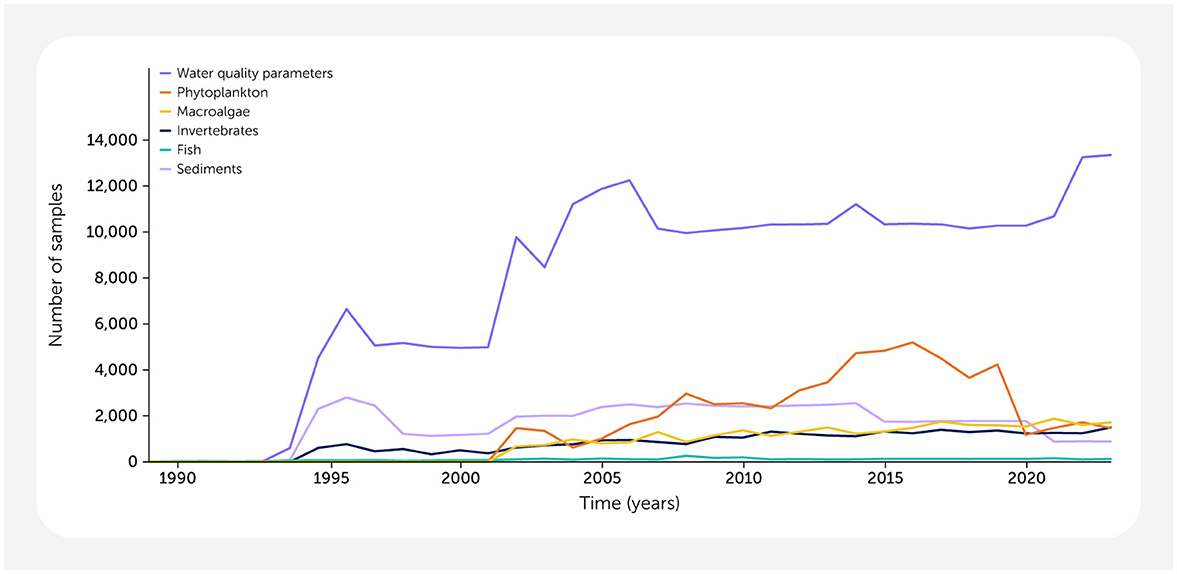
Figure 2. Temporal distribution of the number of samples collected over time (1989–2023) for macroalgae, phytoplankton, fish, invertebrates, sediments, and water quality parameters in the Basque Country.
1. Water quality parameters
Sampling frequency for water quality parameters is consistently high from the mid-1990s onward, indicating an ongoing focus on monitoring physicochemical factors. This consistent dataset likely aids in detecting seasonal and annual changes in water quality, which are key for tracking ecosystem health and responses to human activity.
2. Sediment samples
Sediment samples show an initial increase through the late 1990s, stabilizing in frequency after 2000. This trend suggests an early emphasis on understanding sediment composition and its role in ecosystem quality, which remains part of regular monitoring efforts. Sediment data is essential for identifying long-term trends in substrate composition and contaminant levels.
3. Phytoplankton and macroalgae
Sampling for phytoplankton counts and macroalgae begins in the early 2000s. Phytoplankton samples peak around 2005–2015, potentially reflecting interest in primary producers due to their sensitivity to nutrient and environmental shifts. Then, the number of samples decreased drastically in 2020 due to a reduction in the number of sampling sites, in order to limit them to some stations that represent the main source of variability along the coast. Macroalgae sampling remains more consistent year-over-year, providing stable data on intertidal and coastal zone health over time.
4. Invertebrates and fish
Invertebrate samples are collected regularly from the mid-1990s, offering data on benthic biodiversity and species composition. Fish sampling, comparatively lower in frequency, reflects a more targeted approach, possibly aligned with specific research objectives or seasonal studies.
5. Temporal patterns
The dataset highlights shifts in sampling focus over time, with increases in some categories likely influenced by environmental policies and evolving research priorities. The high sampling intensity for water quality, sediments, and certain biological categories suggests a strong focus on assessing ecosystem health, especially in response to regulatory requirements.
This temporal distribution of samples, spanning multiple decades, provides an extensive basis for analyzing ecosystem trends, contributing to an improved understanding of the natural variability and anthropogenic impacts in the Basque Country's coastal and estuarine environments.
Figure 3 shows the annual number of unique taxa recorded in each major taxonomic group—macroalgae, phytoplankton, fish, and invertebrates—within the Basque Country monitoring network. Trends in species richness over time reveal changes in biodiversity within these ecosystems, providing insights into potential environmental and ecological dynamics affecting marine life diversity.
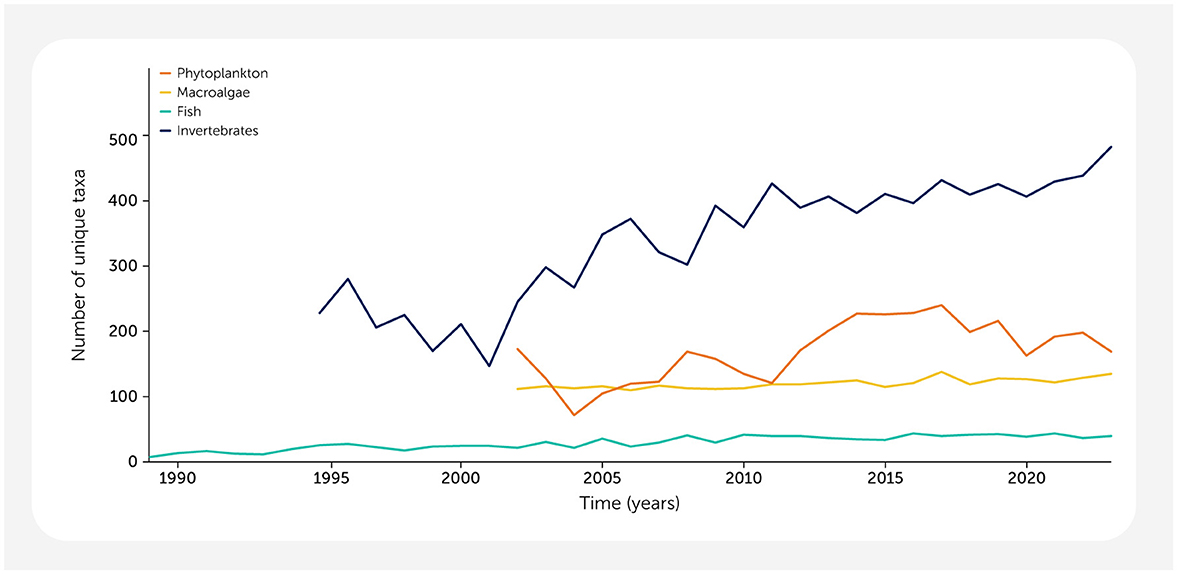
Figure 3. Temporal dynamics of species richness (Biodiversity) over time for macroalgae, phytoplankton, fish, and invertebrates (1989–2023) in the Basque Country.
Key observations:
1. Invertebrates: The invertebrate group displays the highest and most consistent growth in species richness over time, reaching nearly 500 unique taxa by 2023. This increase may reflect improved monitoring efforts, ecological resilience, or shifts in habitat conditions that support higher biodiversity within invertebrate communities.
2. Phytoplankton: Phytoplankton species richness shows an upward trend with fluctuations, peaking around 2015. The variations in this group could be associated with changes in water quality parameters, nutrient availability, or seasonal blooms that impact phytoplankton diversity in coastal waters. Although, the influence of sampling and laboratory changes between 2008 and 2012 cannot be ruled out. The late decrease is due to the reduction in the sampling stations number.
3. Macroalgae: Macroalgae exhibit moderate growth in species richness with relatively stable levels over the years. This stability suggests a balanced ecological state within intertidal and shallow water habitats, although slight increases may indicate responses to gradual environmental shifts.
4. Fish: Fish species richness remains relatively low and stable compared to other groups, with minor fluctuations over time. This stability might suggest specific habitat requirements or lower resilience to environmental change within the coastal fish populations monitored.
These trends underscore the value of long-term biodiversity monitoring to detect shifts in ecosystem health and resilience. Variations in species richness provide critical data for evaluating the impacts of anthropogenic pressures, management interventions, and natural environmental changes on marine biodiversity.
Figure 4 shows the temporal distribution of the top 10 species in each taxonomic group over time from 1995 to 2023 in the Basque Country monitoring network. Each plot represents changes in species composition within the macroalgae, phytoplankton, fish, and invertebrate groups, illustrating trends in the number of observations recorded annually for each species. The stack area plots highlight fluctuations in species abundance, reflecting potential ecological responses to environmental changes and anthropogenic pressures over the years.
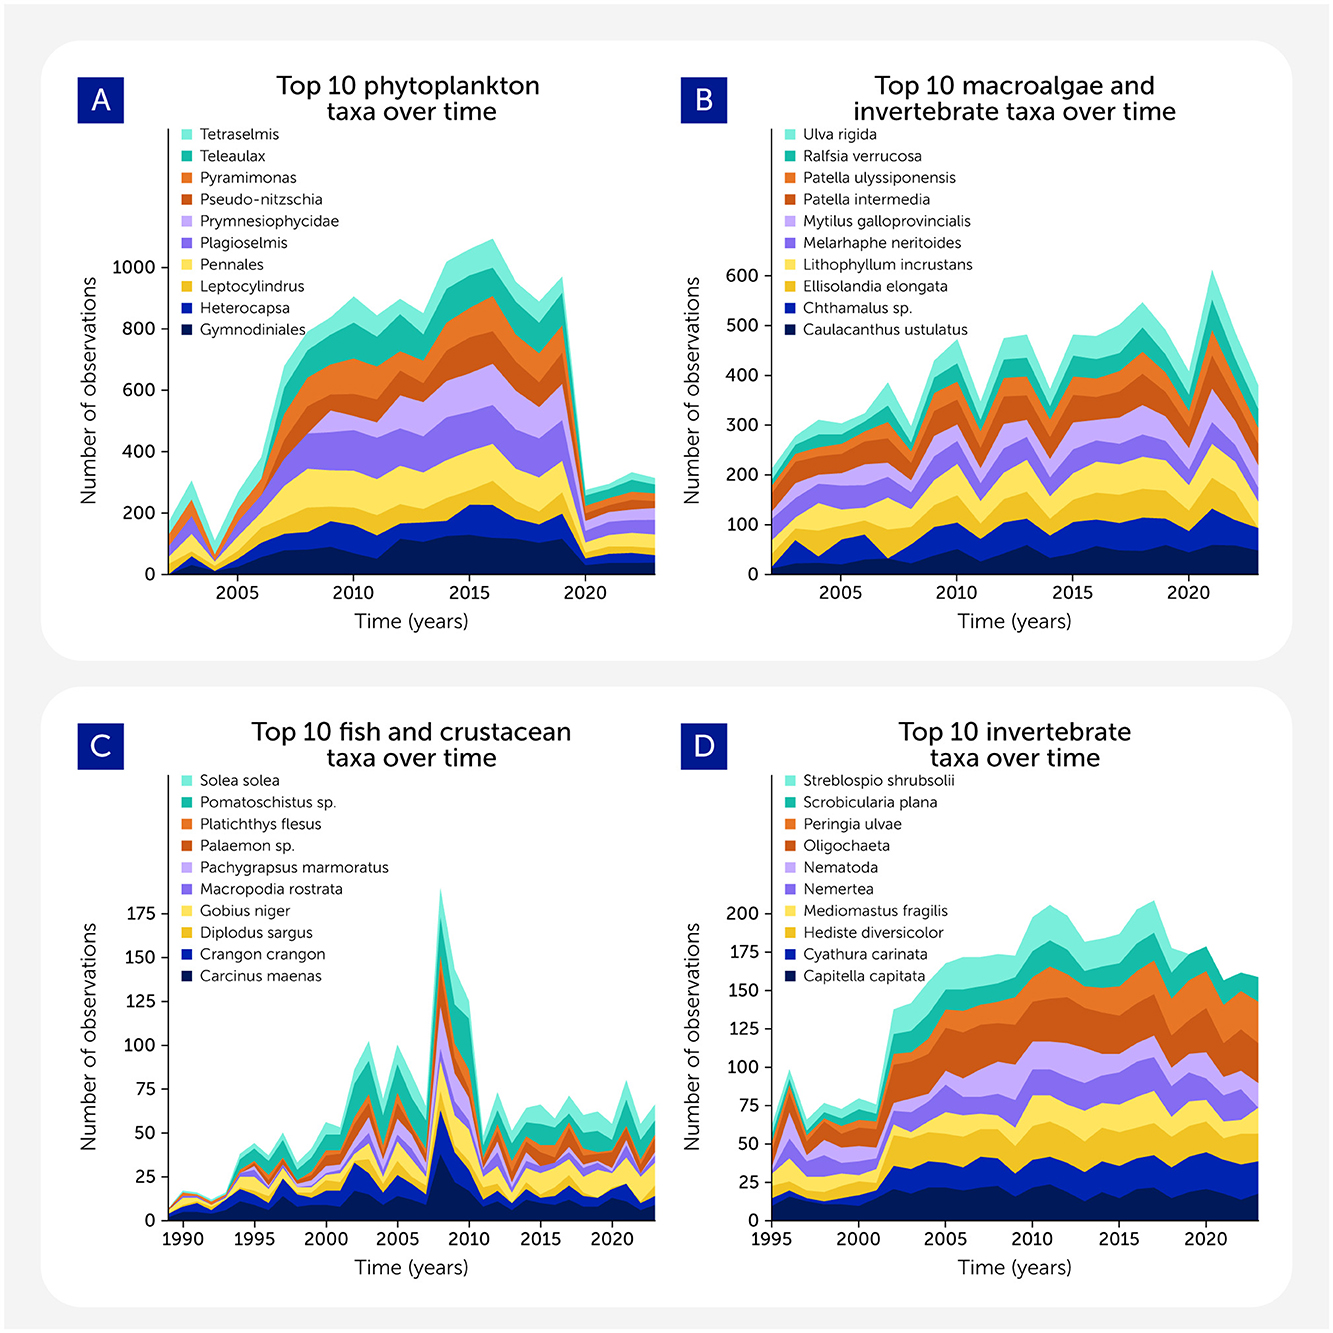
Figure 4. Temporal overview of species composition for macroalgae (including seagrass and intertidal macrofauna), phytoplankton, fish (including demersal crustaceans), and invertebrates in the Basque Country.
5 Discussion
5.1 The value of the dataset
The dataset provides valuable observations into the long-term monitoring of marine ecosystems, specifically within the Basque Country's estuarine and coastal systems. Spanning nearly three decades, from 1995 to 2023, it captures the responses of multiple ecosystem components to varying anthropogenic pressures and management actions, undertaken by URA. A key strength of the dataset is its inclusion of diverse biological components, such as phytoplankton, macroalgae, macroinvertebrates, and fish, alongside physical and chemical parameters. This multifaceted approach allows for a broad assessment of ecosystem health and management effectiveness, enhancing our understanding of marine ecosystem dynamics and the interplay between natural variability and human activities (Borja et al., 2024). While it is a valuable resource for assessing long-term human impacts on marine environments, it should be viewed as part of a wider effort in marine monitoring, complementing other datasets rather than serving as a stand-alone source.
The dataset opens several avenues for further research, particularly in understanding how various ecosystem components respond to specific pollutants or management interventions over time. Future studies could explore the differential responses of biological components to changes in water quality or pollution levels, evaluate the long-term effectiveness of management practices in improving ecological health, and examine the interaction between natural variability and anthropogenic pressures. The dataset could also support research into the resilience and recovery of marine ecosystems following reductions in pollutants or the implementation of conservation measures. Additionally, it offers opportunities to investigate relations between biological diversity and ecosystem stability, providing a foundation for developing strategies to enhance the sustainability of marine environments.
In comparison to other datasets, this one provides a valuable long perspective (near 30 years) that is essential for understanding temporal trends and changes in marine ecosystems. It is important to highlight that the analysis and taxonomic identification teams have been the same along these years, ensuring the consistency of the datasets and the results. While some datasets focus on short-term monitoring or specific geographic regions, the temporal and spatial coverage of this dataset allows for a broader context in evaluating ecological changes. The inclusion of both biotic and abiotic parameters facilitates a more integrated analysis of ecosystem dynamics. Although it shares similarities with other long-term monitoring efforts, such as those in the Chesapeake Bay or the Baltic Sea, its focus on the Basque Country and the response to specific regional management actions makes it distinct. At the same time, it complements these datasets by offering a regional point of comparison for global marine ecosystem studies.
5.2 The limitations of the dataset
The dataset has certain limitations that should be acknowledged to avoid potential biases in interpretation. Its geographic concentration in the Basque Country may limit its applicability to other marine ecosystems with different characteristics. Additionally, while it includes a wide range of variables, it does not encompass all factors influencing marine environments, such as emerging pollutants or certain unmeasured biological interactions. Variability in the temporal resolution and consistency of data collection methods over time could also impact trend analyses. Moreover, the reliance on specific analytical methods might limit the comparability of its findings with those derived using different techniques. Acknowledging these limitations is crucial for accurately interpreting the dataset's findings and applying them in broader ecological contexts.
Looking ahead, the dataset could be expanded or refined to enhance its utility for research and management applications. Incorporating additional variables, such as emerging contaminants or advanced biological indicators, could deepen insights into ecosystem health and resilience. Improving the temporal resolution of data collection and ensuring methodological consistency would also enhance the accuracy of trend analyses. Collaboration with other monitoring networks could facilitate data sharing and comparison, further enriching the dataset's value. Addressing these areas would help the dataset continue to play a key role in informing marine conservation and management strategies in the face of ongoing environmental challenges.
6 Conclusion
The dataset described in this article provides long-term monitoring of coastal and estuarine quality in the southeastern Bay of Biscay, incorporating both physico-chemical and biological components. Covering the period from 1995 to 2023, with additional stations included from 2002 and some data from 1989, the dataset encompasses 51 sampling stations, but with many others for specific biotic components. It captures water, sediment, and biota quality patterns influenced by salinity, rainfall, environmental variability, and human pressures across 18 water bodies (management units) in the Basque Country, offering insights into ecological changes and human impacts, particularly in relation to the Water Framework Directive (WFD).
The dataset's temporal and spatial coverage provides a foundation for identifying key trends and assessing human influences on aquatic ecosystems over time. It is a resource for evaluating ecological status and supporting management decisions aimed at mitigating anthropogenic impacts. Its alignment with European directives enhances its relevance for policy-making in environmental monitoring and management.
Applications include ecological modeling, environmental assessments, and evaluating management strategies. The dataset offers researchers and policymakers tools to monitor temporal changes, assess conservation efforts, and support evidence-based decision-making in environmental management.
While the dataset has strengths, including its temporal scope and diversity of variables, limitations remain. These include potential gaps in continuity and challenges in capturing complex ecological interactions. Future expansions could incorporate emerging pollutants and advanced modeling techniques to enhance predictive capabilities.
In summary, this dataset supports ecological research and management in the southeastern Bay of Biscay, providing insights into the interplay between natural variability and human activities. This information is crucial for ongoing efforts by local authorities, such as URA, to manage and restore aquatic ecosystems.
Data availability statement
The dataset supporting the findings of this study is available through a FAIR2 Data Portal, which ensures that the data adhere to the principles of Findability, Accessibility, Interoperability, and Reusability (FAIR), with additional emphasis on including detailed Contextual metadata and AI-Readiness and Responsible AI practices. All raw data, metadata, and supplementary materials, including detailed protocols and methods, are accessible via the FAIR2 Data Portal (https://doi.org/10.71728/r1rj-f947).
Ethics statement
Ethical approval was not required for the study involving animals in accordance with the local legislation and institutional requirements. The sampling of vertebrate animals follows international standards, such as UNE-EN 14962:2007 “Water quality. Guidance on the scope and selection of fish sampling methods”, which are in use for monitoring and assessment under “Directive 2000/60/EC of the European Parliament and of the Council of 23 October 2000 establishing a framework for community action in the field of water policy. Official Journal of the European Union, L327: 1–72”, and followed by all Member States in the European Union.
Author contributions
ÁB: Conceptualization, Data curation, Project administration, Supervision, Writing – original draft, Writing – review & editing. IA: Data curation, Formal analysis, Methodology, Writing – review & editing. JB: Data curation, Formal analysis, Investigation, Methodology, Visualization, Writing – review & editing. MB-S: Data curation, Formal analysis, Investigation, Writing – review & editing. IC: Data curation, Formal analysis, Methodology, Validation, Writing – review & editing. JF: Data curation, Formal analysis, Investigation, Methodology, Visualization, Writing – review & editing. JG: Data curation, Formal analysis, Investigation, Methodology, Writing – review & editing. JL: Data curation, Formal analysis, Investigation, Methodology, Validation, Visualization, Writing – review & editing. AL-M: Data curation, Formal analysis, Investigation, Methodology, Writing – review & editing. AM: Data curation, Project administration, Supervision, Validation, Writing – review & editing. MM: Data curation, Formal analysis, Investigation, Methodology, Validation, Writing – review & editing. IMa: Data curation, Software, Visualization, Writing – review & editing. JM: Data curation, Formal analysis, Investigation, Methodology, Validation, Visualization, Writing – review & editing. IMe: Data curation, Formal analysis, Investigation, Methodology, Validation, Visualization, Writing – review & editing. SP: Data curation, Formal analysis, Investigation, Methodology, Software, Writing – review & editing. MR: Data curation, Formal analysis, Investigation, Methodology, Validation, Writing – review & editing. JRo: Data curation, Formal analysis, Investigation, Methodology, Validation, Writing – review & editing. JRu: Data curation, Formal analysis, Investigation, Methodology, Writing – review & editing. YS: Data curation, Formal analysis, Investigation, Methodology, Writing – review & editing. OS: Data curation, Formal analysis, Investigation, Methodology, Validation, Writing – review & editing. AU: Data curation, Formal analysis, Investigation, Methodology, Software, Validation, Writing – review & editing. IZ: Data curation, Formal analysis, Investigation, Methodology, Writing – review & editing. IMu: Data curation, Formal analysis, Investigation, Methodology, Validation, Visualization, Writing – review & editing.
Funding
The author(s) declare financial support was received for the research, authorship, and/or publication of this article. This investigation was funded by the Basque Water Agency (URA) through a convention with AZTI. Some authors (Angel Borja, Iratxe Menchaca, Sarai Pouso, Yolanda Sagarmínaga, and Marta Revilla) have been funded in writing the paper by GES4SEAS (Achieving Good Environmental Status for maintaining ecosystem services, by assessing integrated impacts of cumulative pressures) project, funded by the European Union under the Horizon Europe program [(grant agreement no. 101059877), www.ges4seas.eu].
Acknowledgments
The Consorcio de Aguas Bilbao-Bizkaia provided part of fish series used in the study, the remainder data are owned by the Basque Water Agency (URA). The sampling and laboratory technician teams from AZTI have done an amazing work in these 30 years of sampling; having such dataset without their efforts would be impossible. This work is contribution number 1,242 from the Marine Research Division at AZTI.
Conflict of interest
The authors declare that the research was conducted in the absence of any commercial or financial relationships that could be construed as a potential conflict of interest.
The author(s) declared that they were an editorial board member of Frontiers, at the time of submission. This had no impact on the peer review process and the final decision.
Generative AI statement
The author(s) declare that Generative AI was used in the creation of this manuscript. This document and the accompanying data package were prepared by the author(s) with assistance from the SENSCIENCE FAIR2 Data Publishing platform (v0.11β), which uses generative AI technology.
Publisher's note
All claims expressed in this article are solely those of the authors and do not necessarily represent those of their affiliated organizations, or those of the publisher, the editors and the reviewers. Any product that may be evaluated in this article, or claim that may be made by its manufacturer, is not guaranteed or endorsed by the publisher.
References
Borja, A., Bald, J., Belzunce, M. J., Uyarra, M. C., Fontán, A., Franco, J., et al. (2024). Red de seguimiento del estado ecológico de las aguas de transición y costeras de la Comunidad Autónoma del País Vasco. Informe de resultados. Campaña 2023. Report from AZTI to the Basque Water Agency (URA), 395. Available at: https://www.euskadi.eus/documentacion/2024/red-de-seguimiento-del-estado-ecologico-de-las-aguas-de-transicion-y-costeras-informe-de-resultados-2023-/u81-000374/es/ (accessed November 5, 2024).
Borja, Á., Chust, G., Rodríguez, J. G., Bald, J., Belzunce-Segarra, M. J., Franco, J., et al. (2016). ‘The past is the future of the present': learning from long-time series of marine monitoring. Sci. Total Environ. 566–567, 698–711. doi: 10.1016/j.scitotenv.2016.05.111
Díez, I., Bustamante, M., Santolaria, A., Tajadura, J., Muguerza, N., Borja, A., et al. (2012). Development of a tool for assessing the ecological quality status of intertidal coastal rocky assemblages, within Atlantic Iberian coasts. Ecol. Indic. 12, 58–71. doi: 10.1016/j.ecolind.2011.05.014
European Commission (2000). Directive 2000/60/EC of the European Parliament and of the Council of 23 October 2000 establishing a framework for community action in the field of water policy. Off. J. Eur. Union L 327, 1–72.
Keywords: environmental monitoring, sediment, water, phytoplankton, macroalgae, macroinvertebrates, fish, Bay of Biscay
Citation: Borja Á, Adarraga I, Bald J, Belzunce-Segarra MJ, Cruz I, Franco J, Garmendia JM, Larreta J, Laza-Martínez A, Manzanos A, Marquiegui MA, Martín I, Martínez J, Menchaca I, Pouso S, Revilla M, Rodríguez JG, Ruiz JM, Sagarmínaga Y, Solaun O, Uriarte A, Zorita I and Muxika I (2025) Marine biodiversity and environmental data: an AI-ready, open dataset from the long term (1995–2023) Basque Country monitoring network. Front. Ocean Sustain. 2:1528837. doi: 10.3389/focsu.2024.1528837
Received: 18 November 2024; Accepted: 04 December 2024;
Published: 03 March 2025.
Edited by:
Melanie Bishop, Macquarie University, AustraliaReviewed by:
Stephanie Kraft Archer, Louisiana Universities Marine Consortium, United StatesVictoria Dominguez Almela, University of Southampton, United Kingdom
Copyright © 2025 Borja, Adarraga, Bald, Belzunce-Segarra, Cruz, Franco, Garmendia, Larreta, Laza-Martínez, Manzanos, Marquiegui, Martín, Martínez, Menchaca, Pouso, Revilla, Rodríguez, Ruiz, Sagarmínaga, Solaun, Uriarte, Zorita and Muxika. This is an open-access article distributed under the terms of the Creative Commons Attribution License (CC BY). The use, distribution or reproduction in other forums is permitted, provided the original author(s) and the copyright owner(s) are credited and that the original publication in this journal is cited, in accordance with accepted academic practice. No use, distribution or reproduction is permitted which does not comply with these terms.
*Correspondence: Ángel Borja, YWJvcmphQGF6dGkuZXM=