Corrigendum: A first ecological coherent assessment of eutrophication across the North-East Atlantic waters (2015-2020)
 Michelle J. Devlin1,2*
 Theo C. Prins3
 Lisette Enserink4Wera Leujak5Birgit Heyden6
 Philip G. Axe7Hans Ruiter4
 Anouk Blauw3
 Eileen Bresnan8
 Kate Collingridge1
 David Devreker9
 Liam Fernand1,10Francisco J. Gómez Jakobsen11
 Carolyn Graves1
 Alain Lefebvre9
 Hermann Lenhart5
 Stiig Markager12
 Marta Nogueira13Garvan O'Donnell14
 Hjalte Parner15
 Eva Skarbøvik16
 Morten D. Skogen17
 Lars Sonesten18
 Sonja M. Van Leeuwen19
 Robert Wilkes20Eleanor Dening21Alejandro Iglesias-Campos21
- 1Centre for Environment, Fisheries and Aquaculture Science (CEFAS), Lowestoft, United Kingdom
- 2Collaborative Centre for Sustainable Use of the Seas (CCSUS), University of East Anglia, Norwich, United Kingdom
- 3Department of Marine and Coastal Systems, Deltares, Delft, Netherlands
- 4Rijkswaterstaat, Utrecht, Netherlands
- 5Umweltbundesamt, Dessau-Roßlau, Germany
- 6AquaEcology (Institute for Aquatic Ecology), Oldenburg, Germany
- 7Swedish Agency for Marine and Water Management, Gothenburg, Sweden
- 8Marine Directorate of the Scottish Government, Science, Evidence, Digital and Data Portfolio, Aberdeen, United Kingdom
- 9Institut Français de Recherche pour l'Exploitation de la Mer (IFREMER), Boulogne sur mer, France
- 10The ERM International Group Limited, Norwich, United Kingdom
- 11Instituto Español de Oceanografía, Fuengirola, Spain
- 12Department of Ecoscience, Aarhus University, Roskilde, Denmark
- 13Portuguese Institute for Sea and Atmosphere (IPMA), Lisbon, Portugal
- 14Marine Institute, Galway, Ireland
- 15International Council for the Exploration of the Sea (ICES), Copenhagen, Denmark
- 16Norwegian Institute of Bioeconomy Research (NIBIO), Grimstad, Norway
- 17Institute of Marine Research, Bergen, Norway
- 18Swedish University of Agricultural Sciences, Uppsala, Sweden
- 19Department of Coastal Systems, Netherlands Institute for Sea Research (NIOZ), Texel, Netherlands
- 20Environmental Protection Agency, Castlebar, Ireland
- 21OSPAR Commission, London, United Kingdom
This paper presents the outcomes of the fourth application of the Common Procedure for the Identification of the Eutrophication Status of the OSPAR Maritime Area (the “Common Procedure”), conducted for the period 2015–2020 for the North East Atlantic. Previously, OSPAR has assessed eutrophication based on national assessment areas and disparate approaches lacking a transparent and comparable basis. A more harmonized approach has now been achieved through development of ecologically relevant assessment areas defined by oceanographic criteria rather than international boundaries, allowing for consistent assessments across exclusive economic zones and acknowledging that eutrophication is a transboundary problem. Thresholds that were specific for those harmonized assessment areas and eutrophication parameters have been derived primarily from an ensemble modeling approach to determine pre-eutrophic conditions. Common assessment areas and harmonized thresholds have enabled, for the first time, an objective and comparable assessment of the eutrophication status of the whole OSPAR Maritime Area. This establishes a level playing field for managing eutrophication and a solid basis for deriving OSPAR nutrient reduction targets as a prerequisite for targeted and successful regional eutrophication management. This assessment shows that eutrophication problem areas persist, in particular along the continental coasts from France to Denmark/Sweden and in the Greater North Sea and the Bay of Biscay and Iberian coast. The main areas affected by eutrophication are the plumes and adjacent coastal areas in the Greater North Sea and Bay of Biscay/Iberian Coast, with riverine nutrient inputs remaining the major source of nutrient pollution. Approximately 6% (152,904 km2) of the OSPAR Maritime Area is eutrophic, with the impacted area supporting many important ecosystem services. Fifty-eight percent of river plume areas (eight assessment areas out of 14), 22% (five of 27) of the coastal areas and 10% (three of 17) of the shelf areas were classified as problem areas. Application of the current assessment process to historical data from the previous three OSPAR assessment periods shows a gradual improvement since 2000. However, the OSPAR 2010 objective “to combat eutrophication, with the ultimate aim of achieving and maintaining a healthy marine environment where anthropogenic eutrophication does not occur” has not yet been fully achieved. Further measures to reduce nutrient loads are needed to ensure long-term sustainability of our coastal waters.
1 Introduction
Natural processes regulate the balance between nutrient availability and the growth of marine plants and animals in ecosystems. Excess nutrients introduced into the sea by human activities can disturb this balance, resulting in accelerated growth of phytoplankton (Devlin and Brodie, 2023). This leads to adverse effects on water quality and marine ecology such as extensive micro- and macro-algae blooms (e.g., green tides, with impact on human health), turbid water and eventually hypoxia, potentially causing mortality of fish, shellfish and seagrasses (Figure 1) in a process known as eutrophication (De Jong, 2007; Paerl and Piehler, 2008; Nixon, 2009; Devlin et al., 2011; Ferreira et al., 2011; Große et al., 2016; Desmit et al., 2018). Eutrophication impacts on water quality can also act as a stressor on other ecosystem components such as biodiversity, plankton community structure and food webs (Cloern, 2001; Heathwaite, 2010; Borja et al., 2016; Clark et al., 2017; Korpinen et al., 2021; Graves et al., 2023; Holland et al., 2023).
FIGURE 1
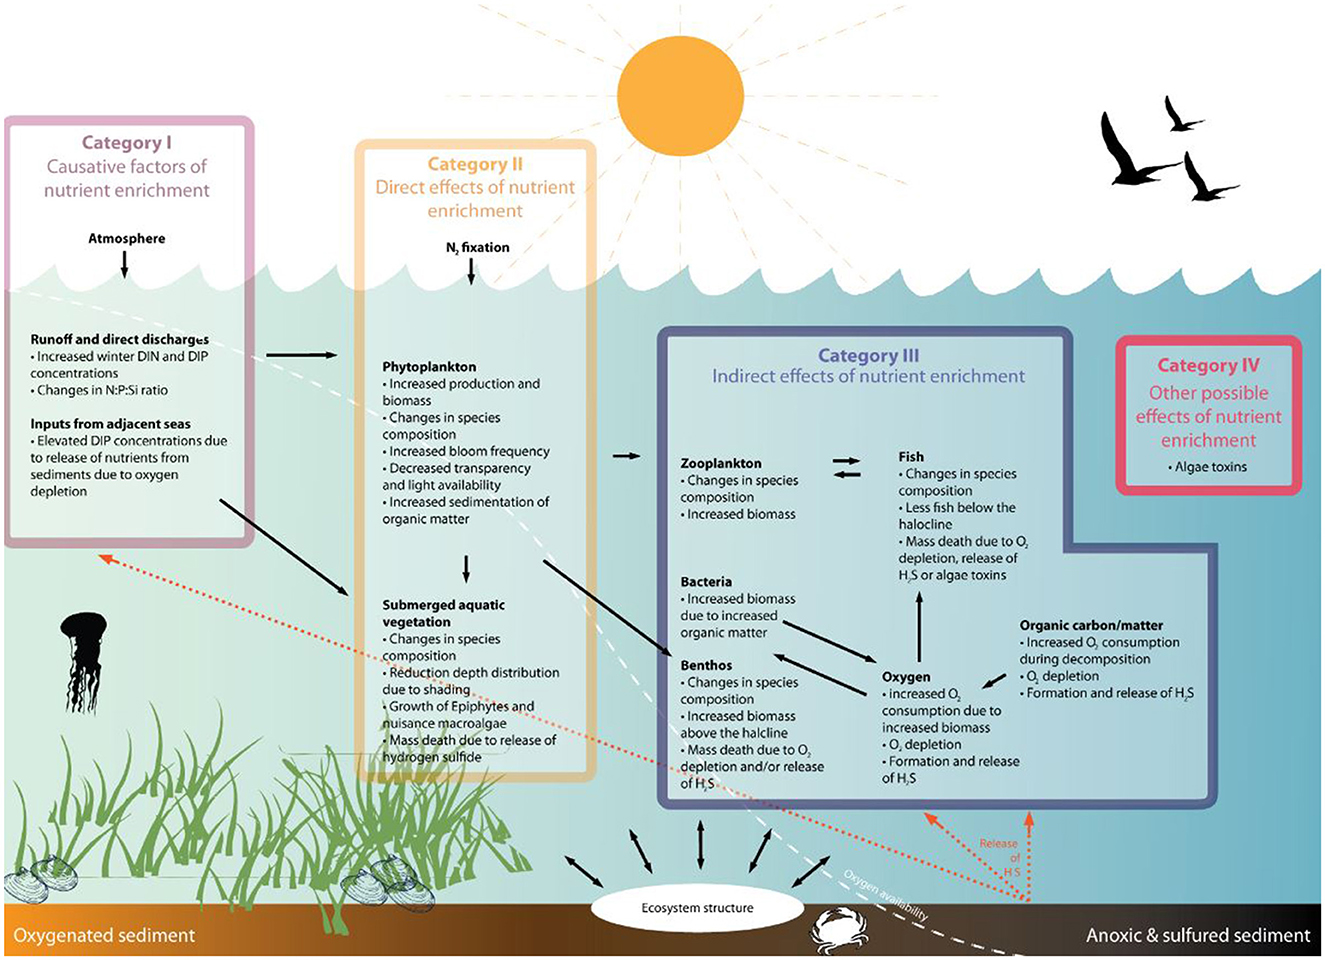
Figure 1. Schematic illustration of issues associated with eutrophication and definition of the different type of categories within the OSPAR assessment. Category 1 indicator are the causative factors of nutrient enrichment with categories II and III covering both direct and indirect effects and category IV including other possible effects of nutrient enrichment (reproduced from OSPAR, 2022).
Human activities have resulted in large quantities of nutrients entering the sea from sources that include agriculture, combustion processes (road traffic, shipping, power plants), municipal and industrial wastewater treatment, scattered dwellings and aquaculture across OSPAR countries (EEA, 2005; Grizzetti et al., 2008; Erisman et al., 2011). These excess nutrients have been a key cause of eutrophication issues that have persisted in OSPAR regions, particularly in estuaries, enclosed areas and coastal waters (Ulén et al., 2007; Van Beusekom et al., 2019). Sources of excess nutrients have changed throughout the 20th century, as urban sewage management improved and the post-war need for food security and economic growth resulted in agricultural intensification and the use of vast amounts of mineral fertilizer to support this growth in agricultural output. The resulting nutrient discharges to waterways and estuaries led to large-scale marine eutrophication (Brockmann et al., 1988; Riegman et al., 1992; Druon et al., 2004; Lenhart et al., 2010; Skogen et al., 2014).
Many social and economic drivers have the potential to influence the increase in anthropogenic nutrient delivery that can cause eutrophication. The rapidly increasing global population, and the infrastructure and resources needed to support it, stimulate many of the drivers that link to eutrophication, for example food, trade and movement of goods, materials and industrial processes; (Selman and Greenhalgh, 2010; Fulweiler et al., 2012; Khan and Mohammad, 2014; Jennings et al., 2016; Rees et al., 2022). Population growth leads to increased demand for food, which in turn can lead to changes affecting diet, global food chains, regulation, innovation, international trade, political stability, culture, international collaboration and food prices. Europe is the third most populous continent behind Asia and Africa. Its population in 2016 was estimated at 738 million, which accounts for 11% of the world's population. The continent is currently growing at a rate of 0.3% per annum (Wassmann, 2004). Agriculture and aquaculture help to meet the demand for food security, but are also the predominant source of the nitrogen discharges to the North East Atlantic waters over the last two decades (EEA, 2005, 2018; EC, 2018; Schoenmakere et al., 2018), leading to an increase in eutrophication effects. Increasing demands for nitrogenous fertilizers for use in agriculture (Erisman et al., 2011; Lu and Tian, 2017) and particularly urea in recent times, are largely responsible for the large discharges of nitrogen to the marine environment (Jickells and Weston, 2011). Agriculture remains the biggest user of nitrogen in the world (EUNEP, 2015).
However, recent trends point to a reduction in nitrogen consumption in agriculture in European countries from the early 1990's, although rates of change have varied significantly between countries—as a result of reducing applications of fertilizer through improving agricultural practices (Grizzetti et al., 2008, 2021; Erisman et al., 2011; Hukari et al., 2016). This resulted in a drop in fertilizer use during the 1980s, starting to plateau from 1990s (Grimvall et al., 2000; EU, 2023). The gross balance between nitrogen added to and removed from agricultural land in the EU showed an improving trend signifying that the gap between inputs and outputs was closing and the potential nitrogen surplus decreasing (Fertilizers_Europe, 2019). This is likely related to efficiency gains rather than to any reduction in agricultural effort, where efficiency gains have likely been achieved through adapted nitrogen management practices such as changes in fertilizer application techniques (Eurostat, 2019, 2021) and may have been driven by the implementation of other specific measures under the Common Agricultural Policy and European legislation, such as the Nitrates Directive and the Water Framework Directive (CEC, 2000). Unfortunately, more recent trends from 2010 indicate that the nitrogen balance has not improved, i.e., the surplus of nitrogen from agricultural land has not declined further since 2010. Assessments suggest that, for the EU, the average reference values for critical nitrogen loads were exceeded, underscoring that fertilizer applications in agriculture is still a major factor in driving eutrophication (Fanelli, 2019).
Recognizing the benefits of a regional approach was a cornerstone for OSPAR when the OSPAR process was initiated in 1972 with the Oslo Convention against dumping and was broadened to cover land-based sources of marine pollution and the offshore industry by the Paris Convention of 1974. OSPAR is named from these original Oslo and Paris Conventions. These two conventions were unified, updated and extended with the Convention for the Protection of the Marine Environment of the North-East Atlantic (the “OSPAR Convention”) opened at the Ministerial Meeting of the Oslo and Paris Commissions in Paris on 22 September 1992. The 15 Governments signed onto the OSPAR convention are Belgium, Denmark, Finland, France, Germany, Iceland, Ireland, Luxembourg, The Netherlands, Norway, Portugal, Spain, Sweden, Switzerland and United Kingdom. The European Union, represented by the European Commission, is also a signatory. OSPAR works under its Eutrophication Strategy to tackle eutrophication and to achieve a healthy marine environment (de La Fayette, 1999) and has recently renewed its commitments in a new North East Atlantic Environment Strategy (OSPAR, 2021) agreeing that the Convention will be implemented through OSPAR's North-East Atlantic Environment Strategy (NEAES) 2030. International engagement and cooperation are a key attribute within the OSPAR strategy supporting partnerships between its member countries, the European Union, and other Regional Seas conventions, the UN Environment Programme (UNEP), the International Maritime Organization (IMO), the International Seabed Authority (ISA), the Convention on Biological Diversity (CBD), the North-East Atlantic Fisheries Commission (NEAFC), the Arctic Council, the International Commission for the Conservation of Atlantic Tunas (ICCAT), and the International Council for the Exploration of the Sea (ICES). Through the NEAES 2030, OSPAR contributes specifically to SDG 13 on Climate Action, to SDG 14 on Life Below Water—with a particular focus on reducing pollution of all kinds (SDG 14.1), restoring degraded habitats (SDG 14.2), addressing the impacts of ocean acidification (SDG 14.3), and conserving and protecting biodiversity (SDG 14.5)—and to SDG 17 on Partnerships.
One of the main directions in the OSPAR Eutrophication Strategy is to set appropriate nutrient reduction targets for problem areas with regard to eutrophication (OSPAR, 2002, 2008b, 2017; Skjærseth, 2006; Foden et al., 2010). Quantifying nutrient inputs from the different sources is fundamental for understanding the causes of eutrophication and to evaluate the success of measures taken to reduce nutrient inputs and the impacts of eutrophication (Grizzetti et al., 2021). In 1988 OSPAR followed the source-orientated approach and adopted PARCOM recommendation 88/2 and commited to achieve a substantial reduction (of the order of 50%) in inputs of phosphorus and nitrogen between 1985 and 1995. In 2005, six of nine reporting Contracting Parties met the 50% reduction target for phosphorus, but only three Contracting Parties met the target for nitrogen (OSPAR, 2008a). Phosphorus reductions have been mainly due to the improvement of municipal treatment plants and the replacement of phosphorus in detergents (Emeis et al., 2015). However, reductions in nitrogen input have not been comparable, leading to imbalances between nitrogen and phosphorus ratios (OSPAR, 2003b, 2008b; Claussen et al., 2009; Burson et al., 2016, 2018; Grosse et al., 2017).
Since then, OSPAR recommited in its strategies to set appropriate nutrient reduction targets for eutrophication problem areas, but to date this has not been achieved due to a lack of a common eutrophication assessment based on harmonized thresholds. The lack of a coherent, regional assessment approach for eutrophication made it difficult to achieve consensus about the scale of the problem, or the measures required to address it for the whole of the OSPAR region.
Assessment of eutrophication typically uses measures of the drivers (nutrient inputs, nutrient concentrations) and impacts of increases in anthropogenic nutrients (Paerl, 2006; Paerl and Piehler, 2008). Nutrient inputs can lead to elevated nutrient concentrations in the marine environment, of which wintertime concentrations of dissolved inorganic nitrogen and phosphorus are a key parameter for describing the causative factors for eutrophication (Devlin et al., 2007; Smith and Schindler, 2009; van Beusekom, 2018; Greenwood et al., 2019). Nutrient concentrations are determined by water sample measurements taken in the field and typically analyzed in a laboratory via spectrophotometers. Elevated levels of phytoplankton biomass can be a direct effect of nutrient enrichment and closely linked to a number of other eutrophication effects such as reduced photic limits, toxic or nuisance algae blooms and oxygen deficiency near the seafloor (Bricker et al., 1999; Devlin et al., 2011; Andersen et al., 2019). Furthermore, chlorophyll concentrations, as a proxy for phytoplankton biomass, can be determined with high confidence by combining field measurements with satellite, numerical models and autonomous measurements such as ferry-box data (Petersen et al., 2008; Kratzer et al., 2011; Karlsson et al., 2016; Bean et al., 2017). Undesirable disturbance from eutrophication also includes depletion of oxygen caused by decomposition of accumulated organic material produced by phytoplankton during their growing seasons (Devlin and Brodie, 2023). Oxygen concentrations are typically determined by collecting samples at depth and subsequent laboratory analysis by Winkler method (Greenwood et al., 2010), though autonomous measurements can also be taken via well-calibrated oxygen optodes. Oxygen depletion at the seafloor as indicated by low oxygen concentrations is a key parameter of indirect eutrophication effects since it determines the conditions for benthic organisms and thereby benthic habitat quality (Best et al., 2007; Devlin et al., 2007; Seitz et al., 2009). For this assessment, the relevant OSPAR common indicators are nutrient inputs, concentrations, winter nutrients and chlorophyll-a and dissolved oxygen. They were selected as key parameters describing the cause-and-effect chain of eutrophication processes (Paerl, 2006; Foden et al., 2010; OSPAR, 2017) and correspond to primary criteria under the Marine Strategy Framework Directive (Long, 2011) and the UK Marine Strategy. These common indicators for eutrophication provide metrics which are common across OSPAR countries and eutrophication assessments.
This paper presents a summary of the fourth application of the OSPAR Common Procedure (hereafter COMP4) for the assessment of eutrophication, which was conducted for the period 2015–2020. The first application of the OSPAR Common Procedure (COMP1) was applied nationally in 2002 with a joint report published in 2003 (OSPAR, 2003a). Subsequent applications resulted in joint reports in 2008 and 2017 which contributed to the OSPAR Quality Status Report 2010 and the Intermediate Assessment 2017 (OSPAR, 2005, 2008b, 2017; Heslenfeld and Enserink, 2008; Foden et al., 2010). With the third application (COMP3), OSPAR's eutrophication assessments primarily covered the period from 2006 to 2014 alongside trend assessments based on data from 1990 to 2014. The fourth application extends this, incorporating data from 2015 to 2020 into the trend assessments. This application of the OSPAR Common Procedure differs from previous assessments in that ecologically coherent assessment units and assessment thresholds have been developed which reflect characteristics of the ecosystem rather than national boundaries. In addition, remote sensing, water samples and numerical models have been combined in an automated assessment tool, ensuring for the first time a “regionally harmonized” assessment. Areas with eutrophication problems and where remediation measures are needed are identified without the premise that eutrophication is constrained by geographical boundaries, acknowledging that programs of measures require co-operation across all countries.
2 Methods
2.1 Improving the previous assessments
Assessment units, thresholds and seasons have been revised prior to each application of the Common Procedure (hereafter COMP1, COMP2, COMP3, and COMP4) reflecting improvements in our understanding of eutrophication and its impacts on the ecosystem and allowing use of the best available scientific knowledge for each of the four assessment periods. After COMP3, it was recognized that the approach used in COMP3 and the previous two approaches did not go far enough in harmonizing the assessment across the OSPAR regions, with geographical boundaries still hindering our understanding of eutrophication state across coastal and marine waters. Improvements from the COMP3 to the COMP4 approach were developed through the Intercessional Group for Eutrophication, an OSPAR working group which has incorporated outputs from national approaches, modeling, advances in satellite data and technical discussions to agree on how to advance and harmonize eutrophication assessments. This work has resulted in the harmonizing of assessment areas, integration of common indicators for the assessment of eutrophication, agreement on harmonized area-specific assessment levels and integrated data assessment via an online data tool (COMPEAT; Figure 2).
FIGURE 2
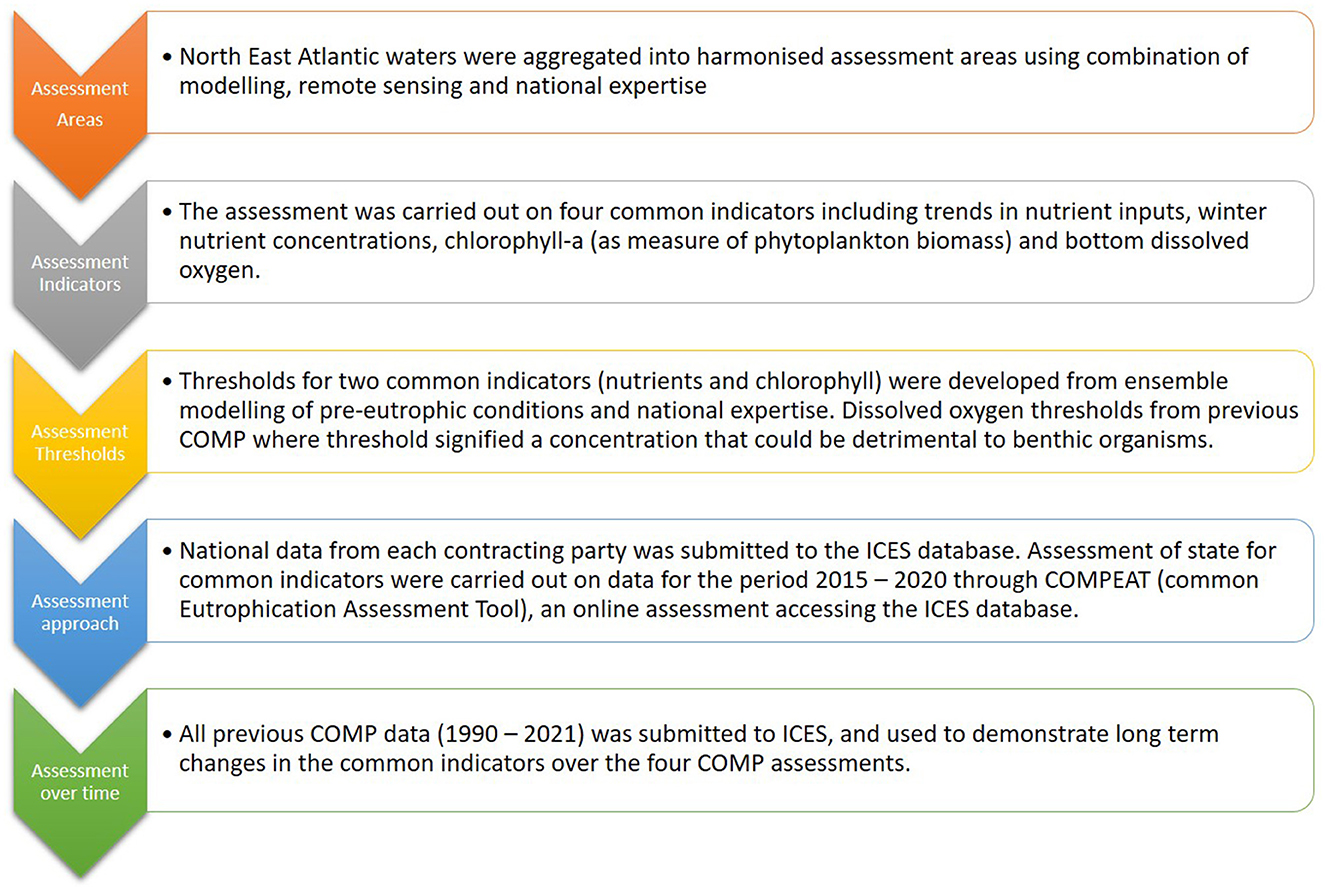
Figure 2. Description of the improvements between the COMP3 and COMP4 process concerning assessment areas, assessment indicators, assessment levels and assessment approach.
2.2 Harmonizing assessment areas
COMP4 addressed issues identified in COMP3 (OSPAR, 2017) where inconsistencies in threshold levels across national marine borders resulted in abrupt changes in assessment outcomes. The EU funded JMP-EUNOSAT project (Enserink et al., 2019) and the OSPAR Intercessional Group for Modeling (ICG-EMO) initiated a program of work that subdivided areas with similar ecological functioning to harmonize assessment areas. Environmental conditions used in defining assessment areas were physical (depth, salinity, and stratification), chemical (nutrients) and biological factors (phytoplankton dynamics: biomass and primary production). This process of characterization was undertaken to establish ecologically coherent assessment areas such that forcing an ecological response can be considered uniform across the assessment unit (Alvera-Azcárate et al., 2021; Lavigne et al., 2021). The full set of steps to develop harmonized assessment areas are provided in Supplementary Table 1. The assessment areas that were developed under this process were presented back to the OSPAR Contracting Parties, where a consultation process allowed each country to adjust boundaries based on national expertise and/or national modeling (Supplementary Table 2).
2.3 Integration of assessment indicators
Three categories of assessment criteria for application in the Common Procedure were agreed to cover the cause and effects of eutrophication. Category I relate to causative factors including nutrient loads and nutrient enrichment. Category II include the direct effects of nutrient enrichment and Category III includes the indirect effects of nutrient enrichment (see Figure 1). For each category, specified assessment criteria have been agreed. Based on this, a set of harmonized assessment parameters, known as common indicators, was selected relating to nutrient enrichment and the direct and indirect effects of nutrient enrichment. These parameters form the basis for the classification of maritime areas with regard to eutrophication and together provide the four common indicators for the assessment of eutrophication within the COMP4 approach.
2.4 Harmonizing assessment levels
In COMP3, OSPAR Contracting Parties evaluated the eutrophication status of their national marine waters using national assessment levels (thresholds) to assess nutrients and chlorophyll a. In general, assessment levels were based on reference conditions reflecting non-eutrophic conditions with boundary between good and moderate derived by adding a 50% deviation to the reference condition. However, Contracting Parties used different approaches in establishing reference conditions to derive these values, leading to variable assessment levels and different outcomes of the eutrophication assessment across national borders (OSPAR, 2003b, 2008b, 2017). OSPAR recognized these limitations and requested the ICG-EMO working group to develop a coherent assessment framework across Contracting Parties that share assessment areas (Blauw et al., 2019; Gohin et al., 2019; Stegert et al., 2021).
The coherence was the development of an ensemble model approach used to derive pre-eutrophic conditions (Lenhart et al., 2022; van Leeuwen et al., 2023). Nutrient loads into the NE Atlantic were estimated from rivers under reference conditions, using the European model E-HYPE and observations (Stegert et al., 2021; Lenhart et al., 2022). In the ensemble model approach, nutrient concentrations in the North-East Atlantic were then estimated under pre-eutrophic conditions simulating a period prior to the Haber Bosch process (i.e., no mineral fertilizers) and including a reasonably modern population density such as cities like London and Hamburg with sewage infrastructure and combining the nutrient loads from E-HYPE with ecosystem models (Stegert et al., 2021; Lenhart et al., 2022; van Leeuwen et al., 2023). The chlorophyll concentrations were estimated corresponding to the estimated nutrient concentrations under reference conditions. Coherent environmental thresholds based on the modeling were calculated for each assessment area (Figure 3). In order to allow for natural variability with a “slight disturbance,” and in the absence of more specific information, the assessment level was defined as the concentration 50% above the area-specific background concentration derived from the ensemble model approach (CEC, 2000; Malcolm et al., 2002; OSPAR, 2003a; Borja, 2005). The harmonized assessment areas (Supplementary Table 1) alongside these revised environmental thresholds provided the baseline to agree on common assessment levels and common definitions for the entire OSPAR region.
FIGURE 3
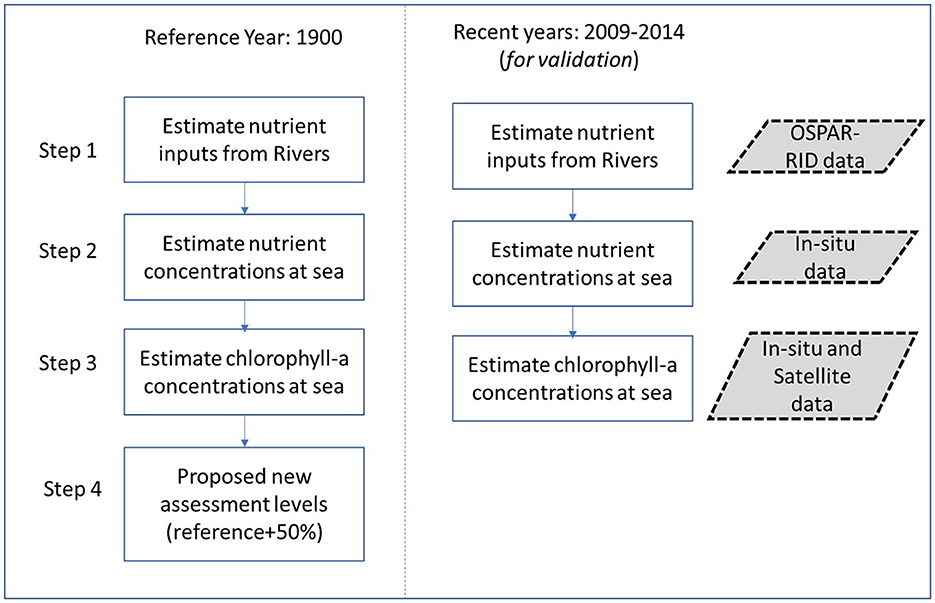
Figure 3. Schematised representation of the workflow used to estimate nutrient and chlorophyll (chl-a) concentrations under reference conditions and validate with present conditions. Gray boxes indicate validation data used. The full approach is outlined in the ICG-EMO report (Lenhart et al., 2022) and supporting papers (Van der Zande et al., 2019; Stegert et al., 2021; van Leeuwen et al., 2023).
This approach was applied to all OSPAR areas, with the exception of Spain and Portugal, as these waters were insufficiently covered by the marine ecosystem models. Assessment levels for nutrients and chlorophyll in the case of Spain were adopted directly from the levels used in the Marine Strategy Framework Directive and in the Water Framework Directive, both coordinated and consistent at country level in all the national assessment areas. For Portuguese assessment areas, the assessment levels were calculated as the deviation of area specific reference conditions and are the same used nationally in MSFD and WFD. Thresholds for oxygen depletion near the seafloor are the same in all assessment units and are related to a biological response threshold and have not been changed since COMP3.
2.5 Integrated eutrophication assessment
2.5.1 Long term trend in nutrient inputs
OSPAR's Joint Assessment and Monitoring Programme (JAMP) collates data on nutrient inputs from diffuse sources and direct discharges. Contracting Parties annually report their riverine and direct inputs from individual river mouths and discharge outfalls, from coastal sub-regions or basins (aggregated into direct and riverine sources) and at national level (also aggregated). Riverine sources are classified as river mouths—usually at the estuarine limit—or as unmonitored areas. Unmonitored areas are those between monitored river mouths, where water and nutrients enter the marine environment via small streams only. Direct discharges to the sea are also reported (Axe et al., 2022). Discharges from upstream of the riverine measurement point are captured through the riverine measurements (Figure 4). Atmospheric nitrogen inputs to the sea are reported by the Co-operative Programme for Monitoring and Evaluation of the Long-Range Transmission of Air Pollutants in Europe under the Convention on Long-range Transboundary Air Pollution (CLRTAP), (Klein et al., 2020; Gauss et al., 2021). Atmospheric phosphorus inputs are assumed to be of natural origin and are not assessed (Mahowald et al., 2008). Atmospheric and waterborne nutrient inputs are normalized according to the methods documented in HELCOM (Backer et al., 2010; Svendsen and Gustafsson, 2020).
FIGURE 4
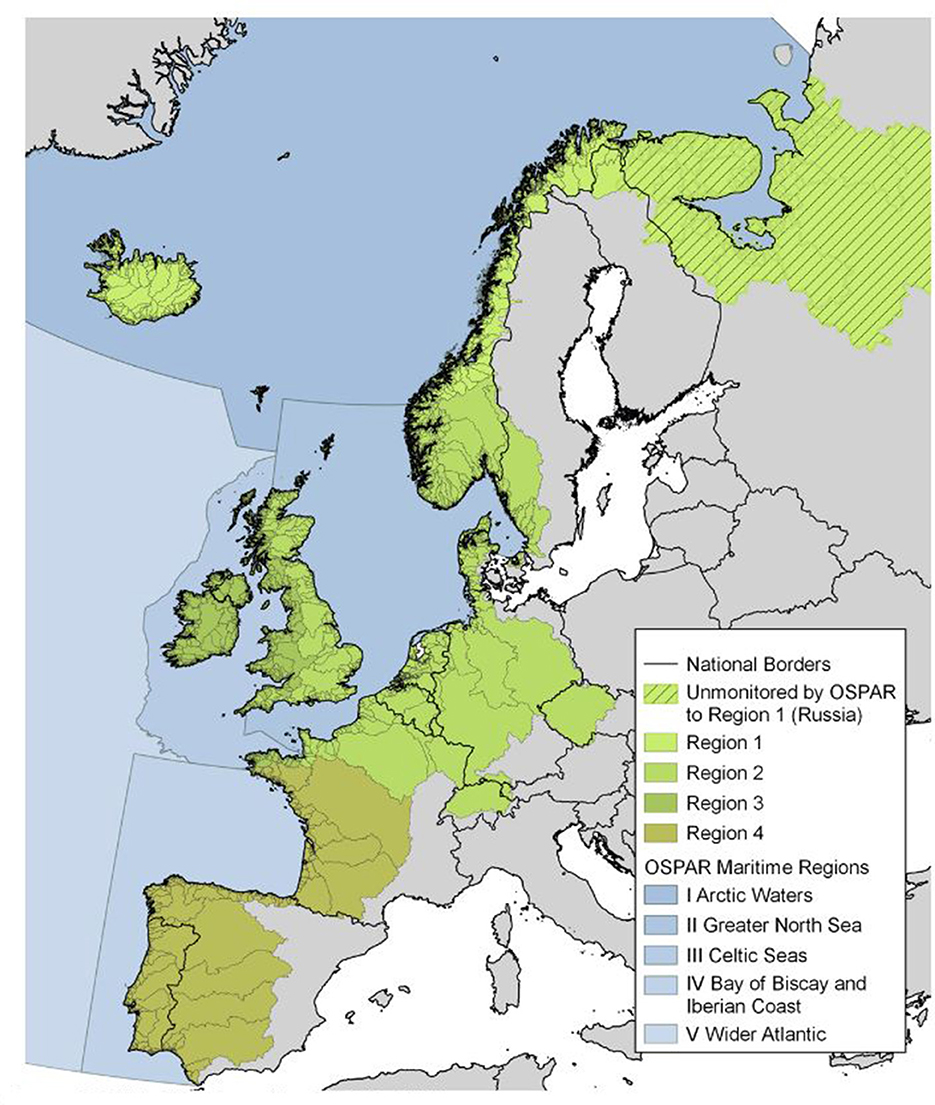
Figure 4. Catchments monitored by the OSPAR Riverine and Direct Discharges (RID) programme and the respective OSPAR regions. There are no data from the Russian catchment to Region I, or from Region V.
2.5.2 Assessment of common indicators
The assessment of eutrophication status is based on the degree of nutrient enrichment (Category I), the direct effects of nutrient enrichment (Category II) and the indirect effects of nutrient enrichment (Category III). For Category I, the nutrients common indicator is derived from winter mean concentrations of dissolved inorganic phosphorus (DIP) and dissolved inorganic nitrogen (DIN) (Heyden and Leujak, 2022). For Category II, the Chlorophyll common indicator is derived from growing-season mean concentrations of chlorophyll (Prins and Enserink, 2022) where chlorophyll EO and water sample data are combined, weighted as a function of in-situ confidence. For Category III, the Dissolved Oxygen common indicator assesses the concentrations of dissolved oxygen near the seafloor (Devlin et al., 2022). Assessment criteria and their corresponding area-specific assessment levels as set and agreed for COMP4 are applied for each given area. The results obtained are integrated to give the classification for the given area. The overall result of the assessment depends on the outcome of the direct and indirect effects (Categories II, III), following the one-out-all-out principle (OOAO). The OOAO principle originates from the WFD where the overall result is decided by the outcome with the worst status thus following the precautionary approach. However, the degree of nutrient enrichment is not considered in the overall eutrophication result, though it can identify areas of higher risk of future eutrophication issues (Figure 5). This allows an integrated eutrophication assessment of the entire Convention area as basis for the development of targeted measures (Figure 5).
FIGURE 5
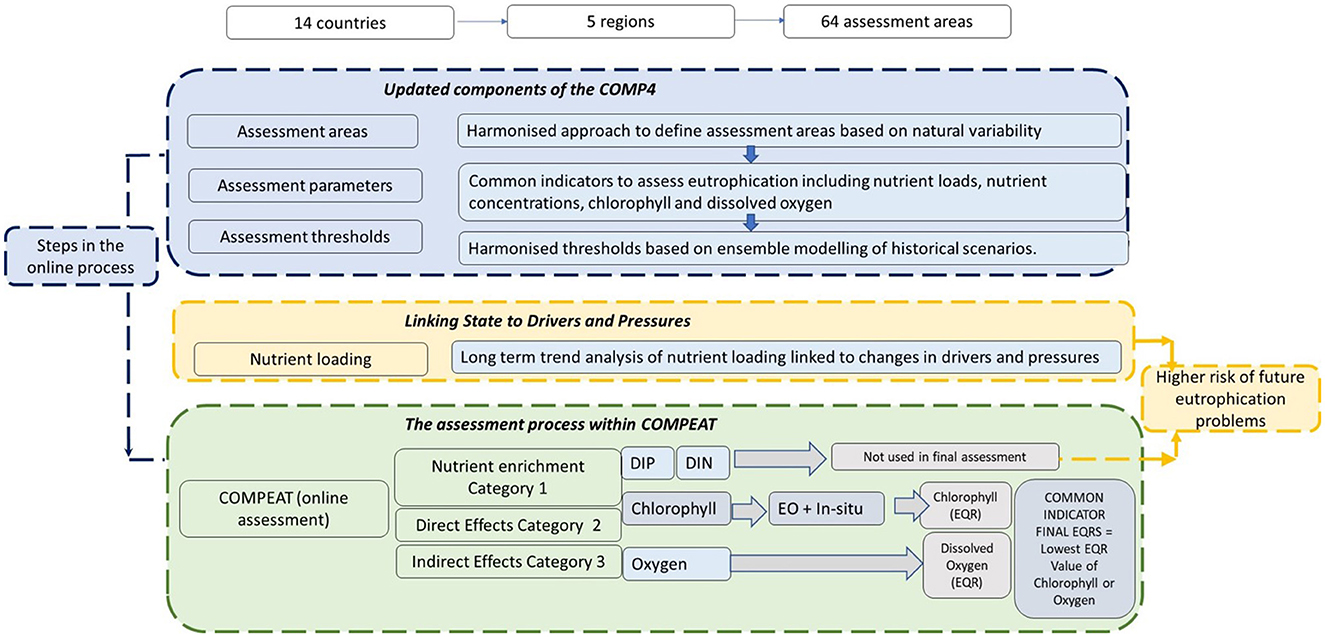
Figure 5. Conceptual flow of the OSPAR COMP 4 showing the interaction between the assessment, nutrient inputs and final outcomes.
COMP4 introduced the automated classification tool Common Procedure Eutrophication Assessment Tool (COMPEAT), developed by the International Council for the Exploration of the Sea (ICES). OSPAR eutrophication data are collected through the JAMP and reported annually to ICES, which is responsible for the management and storage of the data. The COMPEAT tool extracts relevant eutrophication data from the ICES databases and assesses eutrophication criteria against the agreed thresholds in ecologically relevant assessment units. The assessment results are reported in terms of an Ecological Quality Ratio (EQR), which allows the relative distance to non-problem status to be visualized on a uniform normalized scale for the different indicators as described in Supplementary Figure 1.
COMPEAT performs three steps in the analysis, (1) aggregation, (2), integration within indicators, and (3) integration across indicators (Supplementary Table 3). In the assessment procedure, elevated levels are determined by calculating parameter EQRs. The parameter assessment and all subsequent assessment steps, such as the integration of categorized assessment parameters and the overall area classification, is carried out on a five-level scale using EQRs in order to enable an estimate of the distance-to-target to identify improvements, in particular in those areas that have not yet achieved a non-problem area status. The five equidistant EQR ranges are aligned with five classification categories, with those above moderate (EQR = 0.6) being classified as a non-problem area and moderate and below (< 0.6) classified as a problem area (Table 1). The three common indicators were integrated into the overall eutrophication assessment result following the assessment rules described in Supplementary Table 4.
TABLE 1
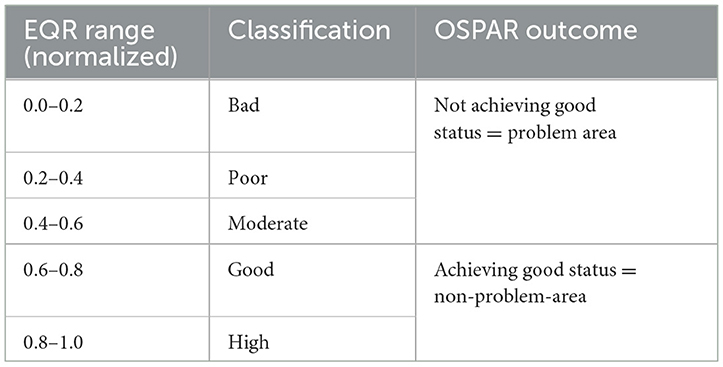
Table 1. EQR values for each of the five category classifications, the good/moderate boundary marks the separation between achieving good status and not achieving good status.
Data for the assessment was taken from the national programs of all Contracting Parties with in-situ samples being the primary data source for the first three COMP assessments and remains the main data source for COMP4. However, COMP4 is the first assessment where high-frequency information from remote sensing are now also included. A new quality controlled, multi mission and multi algorithm satellite chlorophyll-product was used to account for differences in optical properties of the water column across the OSPAR maritime area (Lavigne et al., 2021).
In a data-driven confidence assessment conducted with the COMPEAT tool, temporal and spatial confidence for each indicator is considered to take account of the frequency and spatial distribution of monitoring stations that form the data basis of the assessment. In addition, accuracy is calculated as an estimate of the probability of correct classification in relation to the respective thresholds. The confidence assessment is based on three classifications resulting from averaging across components of “confidence.” Detailed confidence class boundaries for temporal, spatial and accuracy confidence aspects as applied in the assessment procedure of COMPEAT are described in Supplementary material for temporal (Supplementary Figure 2), spatial (Supplementary Figure 3), accuracy (Supplementary Figure 4) and overall integration (Supplementary Figure 5). In general, the different confidence aspects are classified either high (100), moderate (50), or low (0).
2.6 Changes in assessments over time
2.6.1 Trends in common indicators
The Mann–Kendall test was applied to the annual mean time-series for each assessment area to test for significant monotonic upward or downward trend over time. This non-parametric method was selected because it is not affected by any transformation of the annual data values, and it is flexible for time-series with missing data points (Bedford et al., 2020; Desmit et al., 2020). Under this method, each value in the time-series is compared to each of the values preceding it, giving a total of n (n – 1)/2 pairs of data. If the later time point in each pairwise comparison is higher than the earlier time point, the comparison is given a score of 1, and if it is lower it is given a score of −1, with no difference given a score of 0. These scores are then summed to calculate Kendall's S statistic (S; i.e. the number of increases – the number of decreases). Next, the variance of S is calculated according to Millard (2013) and used to standardize S in to a “Z-score.” The Z-score test statistic has an approximate normal distribution and is used to assign a significance level to the presence of a trend. High Z-scores indicate clear increasing and decreasing monotonic trends, respectively, with statistically significant trends suggesting that the null hypothesis (no monotonic trend) can be rejected (see description of methodology in Bedford et al., 2020). Non-parametric trend tests require only that the data be independent and can tolerate outliers (e.g., resulting from a change in analytical detection limit) and missing values in the data. The Mann-Kendall test was applied to each common indicator's annual time series from 1990 to 2020, identifying areas where there was significant change (defined as p < 0.05) in the indicator value (as concentrations of: mean winter DIN, mean winter DIP, mean growing season chlorophyll and the 5th percentile for dissolved oxygen). The rank correlation and direction of change was also estimated using Kendall-τ (OSPAR, 2022).
2.6.2 Changes in OSPAR assessment outcomes
The OSPAR assessment demonstrates the current state of the assessment areas, but it is equally important to understand the direction of change for both common indicators and the overall assessment. Data used in previous COMP assessments were submitted into the ICES database and evaluated within COMPEAT allowing a hindcast analysis of the current COMP approach to previous COMP datasets. The COMP4 methodology was then applied to each earlier COMP period providing outcomes for the three common indicators (nutrients, chlorophyll and dissolved oxygen) over the four assessment periods. The outcomes of previous COMP data, including COMP1, COMP2, COMP3, and COMP4 were compared using the same approach as developed under the COMP4.
3 Results
3.1 Improving the previous COMP
Steps to improve the COMP assessment including harmonized assessment areas and assessment parameters, selection of common indicators and applied an integrated eutrophication assessment.
3.2 Delineation of assessment areas
The delineation of new assessments in COMP4 resulted in 64 assessment areas within the OSPAR region with 14 areas classified as plumes, covering 26,797 km2. Out of the remaining areas, 27 are classified as coastal areas (204,434 km2), 17 as shelf areas (922,589 km2) and six as oceanic/beyond-shelf covering 1,507,733 km2 (Figure 6). A detailed overview listing area ID, area names and surface area is found in Supplementary Table 5.
FIGURE 6
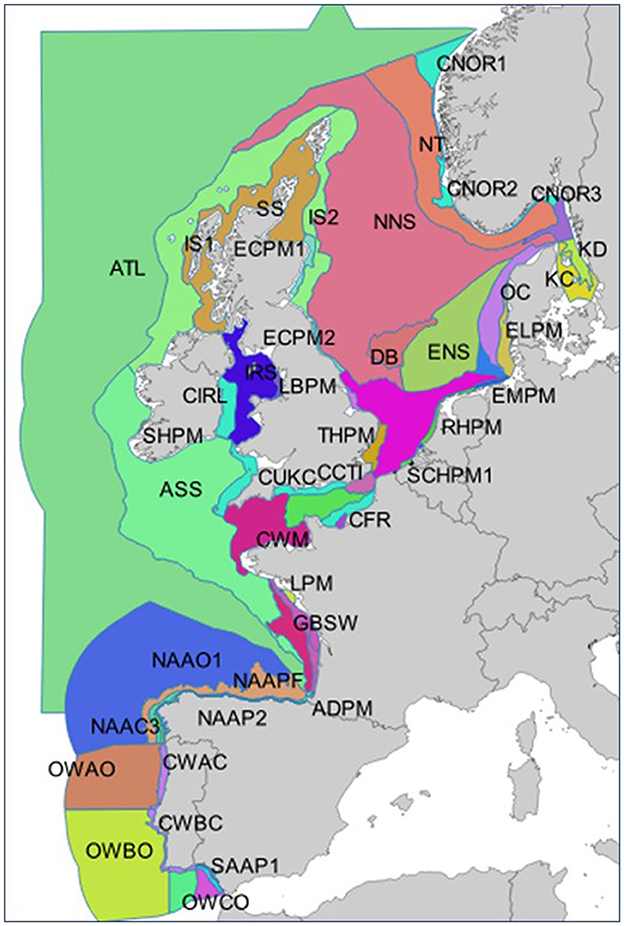
Figure 6. Overview of ecologically relevant assessment areas based on duration of stratification, mean surface salinity, depth, suspended particulate matter and primary production. See Table 3 for full area names.
3.3 Selection of assessment parameters
OSPAR common indicators were selected as key parameters that describe the cause-effect chain of eutrophication processes (Figure 1, Table 2). The OSPAR assessment parameters are the common indicators of nutrient inputs, nutrient concentrations, chlorophyll concentrations, and dissolved oxygen concentrations near the seafloor. Assessment seasons are specific for the different assessment parameters. Whilst OSPAR regions span a wide and climatically variable area, agreement was made on a common assessment season for COMP4 based on the modeling work to derive thresholds (van Leeuwen et al., 2023).
TABLE 2
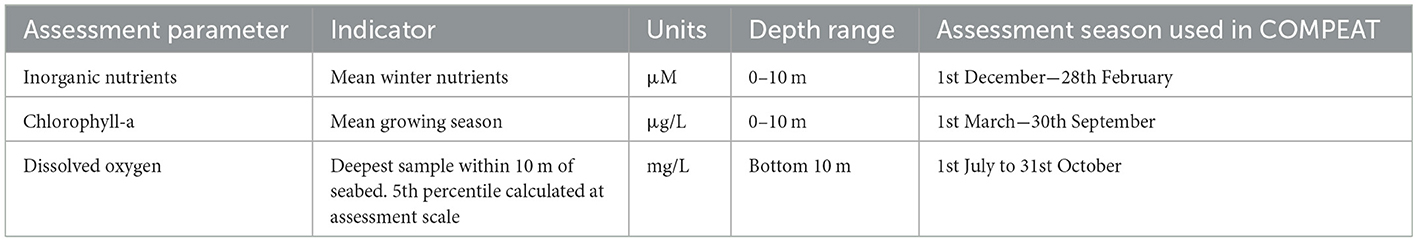
Table 2. Description of common indicators that have been applied in the OSPAR COMP4 eutrophication assessment.
3.4 Development of assessment levels (thresholds)
Outcomes of the ensemble model approach used to derive pre-eutrophic conditions provided the baseline to agree on common assessment levels that were harmonized across the OSPAR region. The area-specific assessment parameters agreed for COMP4 are presented in Supplementary Table 6 harmonizing thresholds for the 64 assessment areas.
3.5 Application of an integrated eutrophication assessment
3.5.1 Long term trends of nutrient inputs
Pressure from nutrient inputs has decreased significantly, both since 1990 but also in the last 10 years (decreasing trends with p values < 0.012 for both nitrogen and phosphorus) for regions of the North East Atlantic adjacent to the continental landmass including United Kingdom and Irish waters (Figure 7). This decrease in nitrogen inputs is predominately due to reductions in atmospheric nitrogen deposition, which decreased from about 2,000 kt/year in 1990 to < 1,500 kt/yearr in 2019. At the level of the four OSPAR regions together, there has been no significant decrease in waterborne nitrogen inputs over the last 10 years.
FIGURE 7
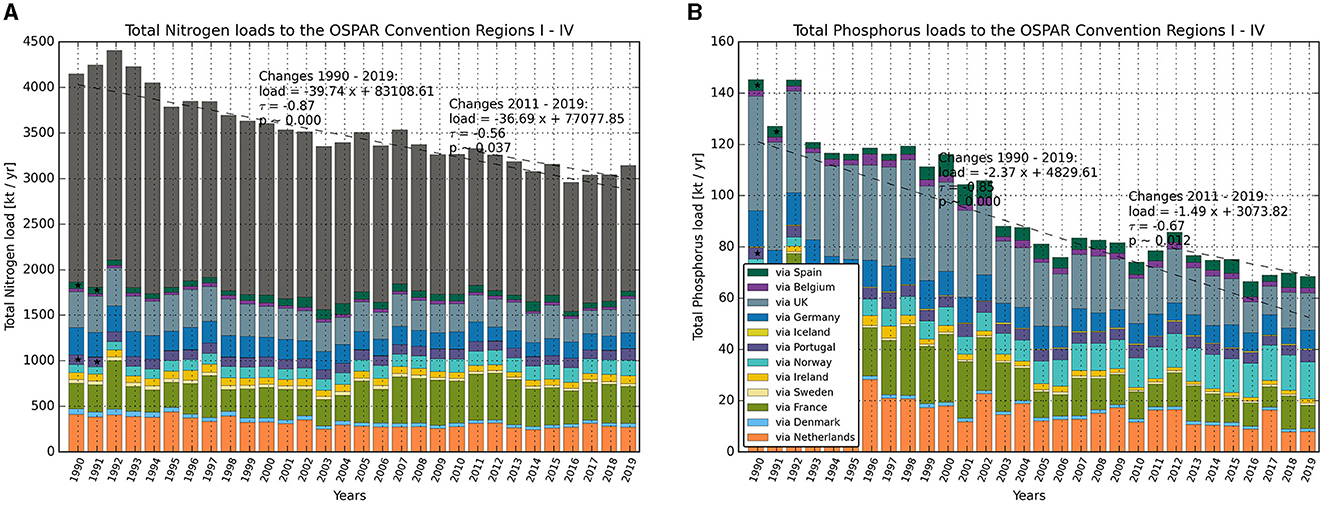
Figure 7. Combined normalized airborne and waterborne nitrogen inputs (A) and normalized waterborne phosphorus inputs (B) to the OSPAR Maritime Area showing countries of origin. Missing data are replaced by a mean value based on data reported from that country for the period 1990–2019. The dashed line indicates a statistically significant trend (p < 0.05; calculated with Scipy.Stats.Kendalltau (see methods in Gauss et al., 2021). Atmospheric deposition for nitrogen is presented as the brown bars above the country inputs. Atmospheric deposition for nitrogen for 1990–1994 represents actual, not normalized deposition. Deposition of phosphorus from air is not measured.
Waterborne phosphorus inputs to OSPAR Regions as a whole have more than halved since 1990 and continue to decrease with a statistically significant trend. Since 1990, phosphorus inputs to the Greater North Sea have decreased by almost two-thirds, from about 90 kt/year to just over 30 kt/year and a similar, 50% reduction is visible in the Celtic Seas data and in the total phosphorus loads to Regions I to IV combined.
Riverine inputs to the Bay of Biscay and Iberian Coast are strongly affected by regional flood events. Furthermore, the time series of available data is shorter than for the Greater North Sea and recent reporting is less complete. However, phosphorus inputs between 1997 and 1999 were typically about 20 kt/year, while phosphorus inputs of about 13 kt/year are found in present day. Analyses show a statistically significant downward trend in phosphorus inputs to the Bay of Biscay and Iberian Coast, but not for nitrogen. Waterborne nitrogen inputs have decreased from the United Kingdom, the Rhine, the Elbe and Denmark compared to 1990–1999, but concurrent increases have occurred via the Loire and the Seine and also in northern Norway.
The greater success in reducing phosphorus compared to nitrogen inputs however—particularly in the eastern Bay of Biscay where nitrogen loads increased while phosphorus loads decreased—can be expected to cause shifts in nitrogen to phosphorus ratios in coastal waters which have been associated with changes in phytoplankton species composition (Greenwood et al., 2019; Graves et al., 2023). The marked changes in phosphorus inputs compared to nitrogen are apparent in the ratio of total nitrogen (TN) to total phosphorus (TP) of the effective concentrations from individual rivers presented in Figure 8.
FIGURE 8
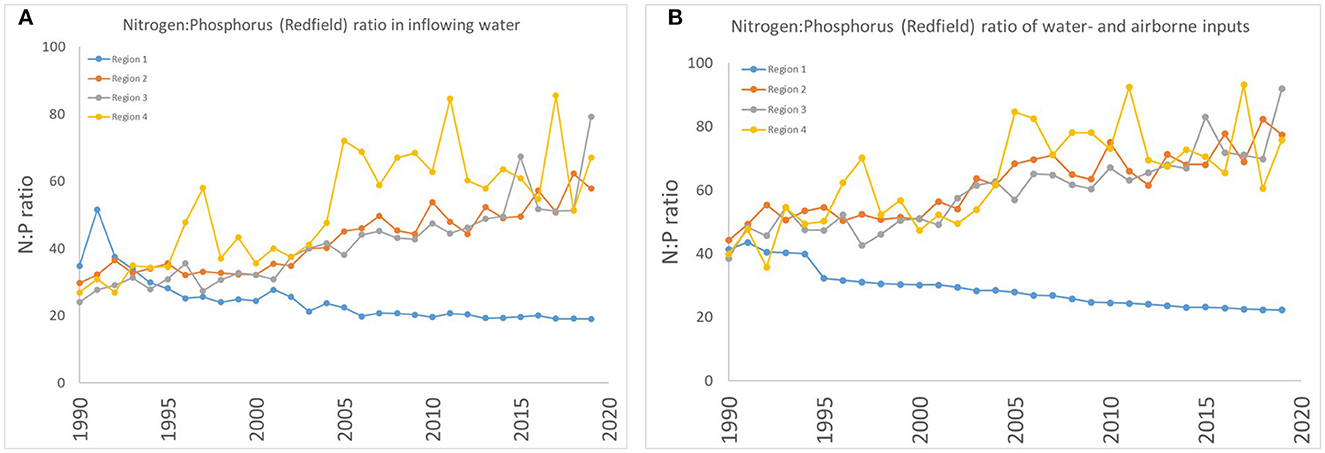
Figure 8. The ratio of total nitrogen to total phosphorus in (A) waterborne inputs and (B) water- and airborne inputs categorized by the input into OSPAR Regions I–IV.
3.5.2 Assessment of common indicators
Outcomes from COMP4 indicate that eutrophication problem areas persist along the continental coasts from France to Denmark/Sweden and the Greater North Sea (Region II). Mainly river plumes and coastal areas of the Greater North Sea and Bay of Biscay/Iberian Coast (Region IV) were affected by eutrophication, indicating that riverine nutrient inputs remain the major source of eutrophication issues (Figure 9).
FIGURE 9
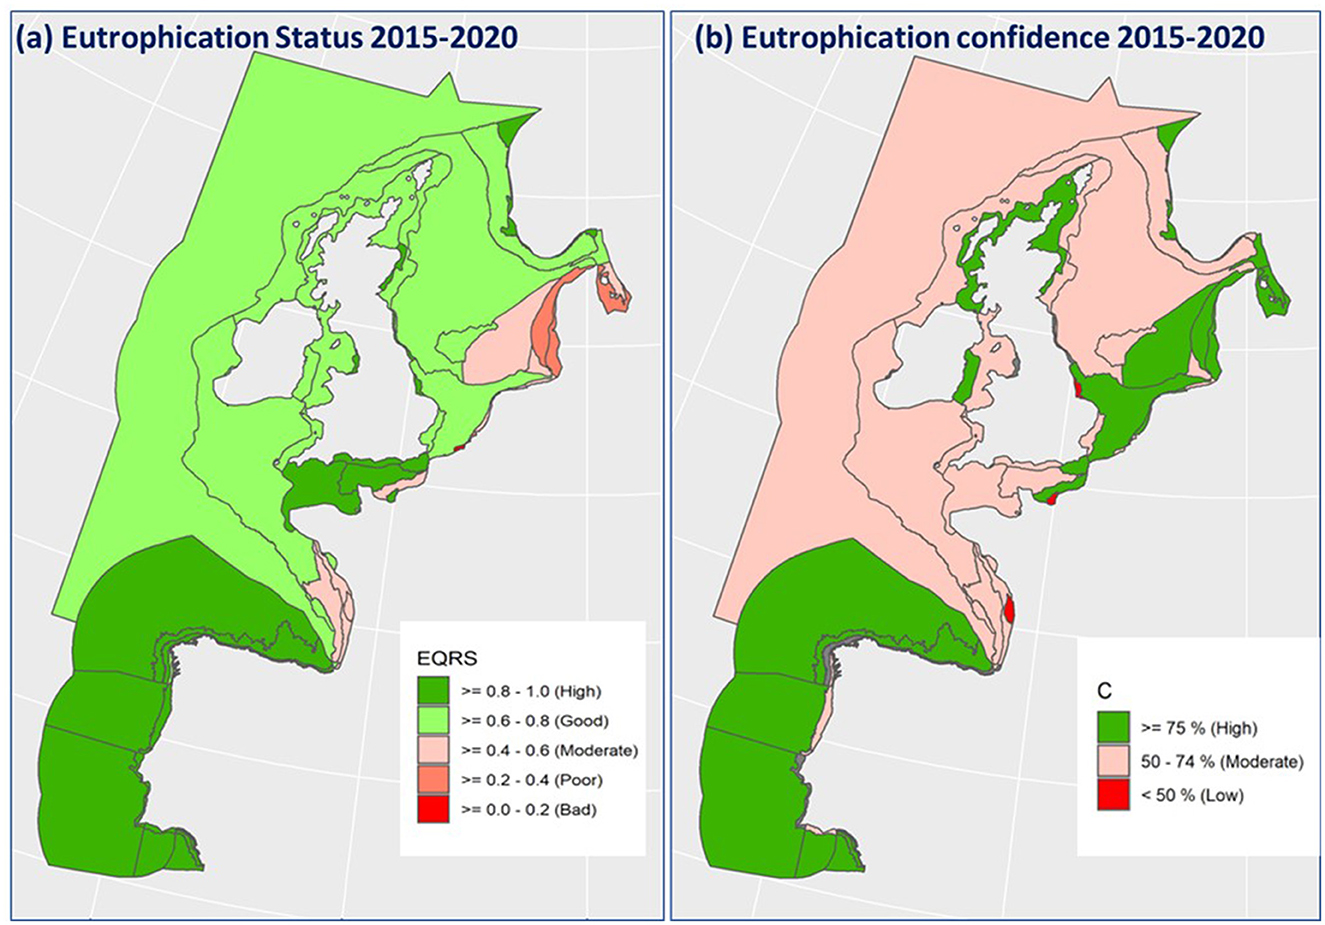
Figure 9. (a) Outcomes of the OSPAR COMP4 eutrophication assessment and (b) confidence in assessment for each assessment area. Final EQRS values for each of the assessment areas is presented in detail in Supplementary Table 3.
The areas that have been classified as problem areas are Coastal French Channel, Scheldt plume, Meuse plume, Rhine plume, Ems plume, Elbe plume, German Bight Central, Outer coastal DEDK, Eastern North Sea, and Kattegat Coastal and Kattegat Deep in the Greater North Sea as well as Adour plume, Gironde plume, Gulf of Biscay coastal and Gulf of Biscay shelf in the Bay of Biscay/Iberian Coast. Confidence in the assessments is generally higher for plumes and coastal areas and lower for shelf and offshore areas. Low confidence in the large shelf and offshore waters is driven primarily by the low frequency of nutrient and dissolved oxygen data, whereas confidence in the chlorophyll data in offshore waters has improved due to the use of satellite data in the assessment. However, eutrophication risk is lower offshore, away from terrestrial inputs.
Among the river plumes, 58% (15,555 km2) did not achieve non-problem area status, while 22% (44,861 km2) of the coastal areas and 10% (92,488 km2) of the shelf areas did not achieve this status. By contrast, oceanic areas were not affected by eutrophication. Altogether, ~6% (152,904 km2) of the OSPAR Maritime Area is eutrophic. Coastal waters subject to the EU Water Framework Directive (WFD) (Anon, 2000; CEC, 2000) and the UK Water Framework Regulation (WFR) were not assessed by OSPAR. Coastal waters assessed under the EU WFD and the UK WFR are an important part of the coastal systems and need to be considered alongside the OSPAR outcomes.
The individual common indicators were also assessed separately (Devlin et al., 2022; Heyden and Leujak, 2022; OSPAR, 2022; Prins and Enserink, 2022). Assessment results for winter DIN concentrations in the COMP4 period are shown in Figure 10a and for Winter DIP in Figure 10b based on the scaled ecological quality ratio (EQRS). Outcomes for the winter nutrient concentrations, considered the causative factor in eutrophication, showed DIN thresholds were more often exceeded, with 12 assessment areas not in good status (Figure 10a), compared to DIP thresholds with 4 assessment areas not in good status (Figure 10b). However, in the south-eastern North Sea (Coastal Waters AC, German Bight Central, Outer Coastal DEDK), Skagerrak, Kattegat and several river plumes including Elbe, Ems, Meuse, Rhine, Scheldt 1, and Shannon plume, DIN concentrations remain above thresholds, resulting in a moderate or poor status classification for DIN. In the vast majority of areas, the thresholds for winter DIP concentrations were not exceeded resulting in good, or high, status classifications for DIP. Only in the Kattegat (coastal and deep areas), the Elbe plume and the French coastal channel area, DIP concentrations were above thresholds contributing to the moderate status classifications for nutrients.
FIGURE 10
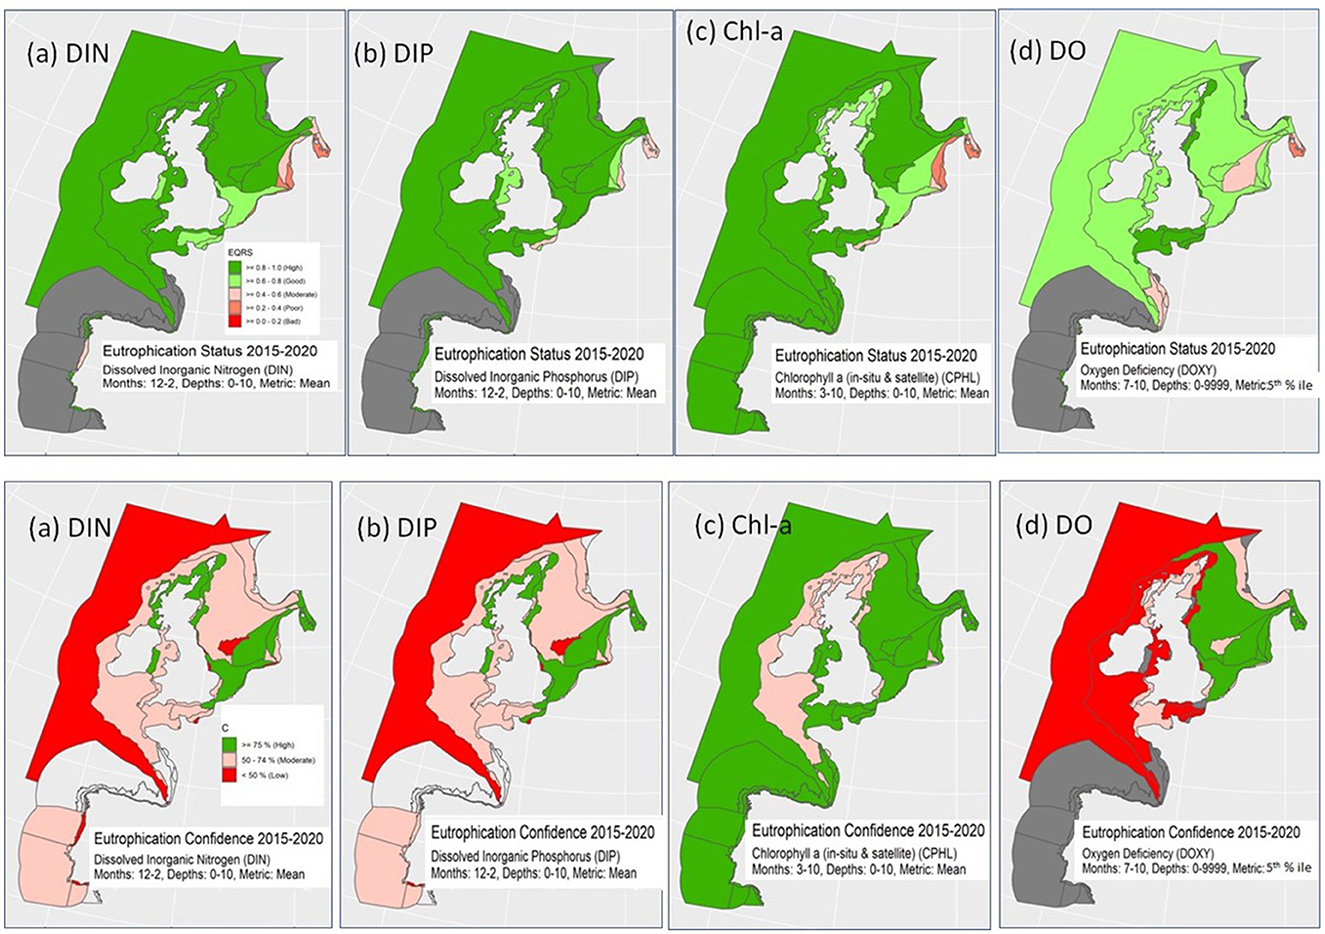
Figure 10. Top row: Outcome of the COMP4 eutrophication assessment for the OSPAR regions II to IV for the period 2015–2020 for (a) Winter DIN, (b) Winter DIP, (c) Chl-a, and (d) DO. Bottom panel illustrates confidence in the outcomes of the eutrophication assessment for (a) Winter DIN, (b) Winter DIP, (c) Chl-a, and (d) DO. Areas shown in dark gray were not assessed, predominantly due to lack of data.
The main eutrophication effects that lead to classification as a problem area are elevated chlorophyll-a concentrations as a proxy for phytoplankton biomass and/or reduced concentrations of dissolved oxygen (Prins and Enserink, 2022). For chlorophyll, 11 assessment areas, all in OSPAR Region II (Greater North Sea) were in Moderate, Poor, or Bad status (i.e., concentrations above the assessment level; Figure 10c). Those areas are river plumes and coastal waters along the continental coast from France to Denmark/Sweden (Coastal French Channel, Scheldt plume, Meuse plume, Rhine plume, Ems plume, Elbe plume, German Bight Central, Outer Coastal DEDK, and Kattegat Coastal and Kattegat Deep; Figure 10c).
The second effect indicator assessed for all areas was dissolved oxygen concentrations near the seafloor (Devlin et al., 2022). Oxygen depletion (concentrations < 6 mg/l) was observed in seven assessment areas: Adour plume, Gironde plume, Gulf of Biscay coastal, Gulf of Biscay shelf waters, the Eastern North Sea, and Kattegat Coastal and Kattegat Deep (Figure 10d).
The confidence of the assessment results is also shown in the lower panels of Figure 10 based on a classification of the accuracy and temporal and spatial confidence, including the class boundaries used for the confidence rating [described in more detail in the Common Procedure (OSPAR, 2022)]. Low confidence for all common indicators is shown for the oceanic and many of the shelf area. Coastal and plume areas have increased confidence reflecting the majority of sampling is carried out near the coast. Confidence for chlorophyll-a is higher in many of the areas, with satellite data providing a valuable source of high resolution spatial and temporal data. However, agreement is needed for a separate assessment of confidence in offshore areas, previously only assessed using a screening procedure, because the available data are not collected in the same way as in the more established eutrophication-sensitive areas, which are assessed according to the CEMP Guidelines for coordinated monitoring for eutrophication, CAMP and RID (OSPAR, 2021).
A summary of the assessment areas which failed at least one of the common indicators is shown in Table 3. Thirteen assessment areas were in moderate, poor or bad status for nutrients based on DIN, DIP or both. Out of these 13, four waterbodies did not achieve good status for nutrients only, but the remaining nine had a combination of nutrients, chlorophyll and DO which results in not achieving good status for the overall assessment.
TABLE 3
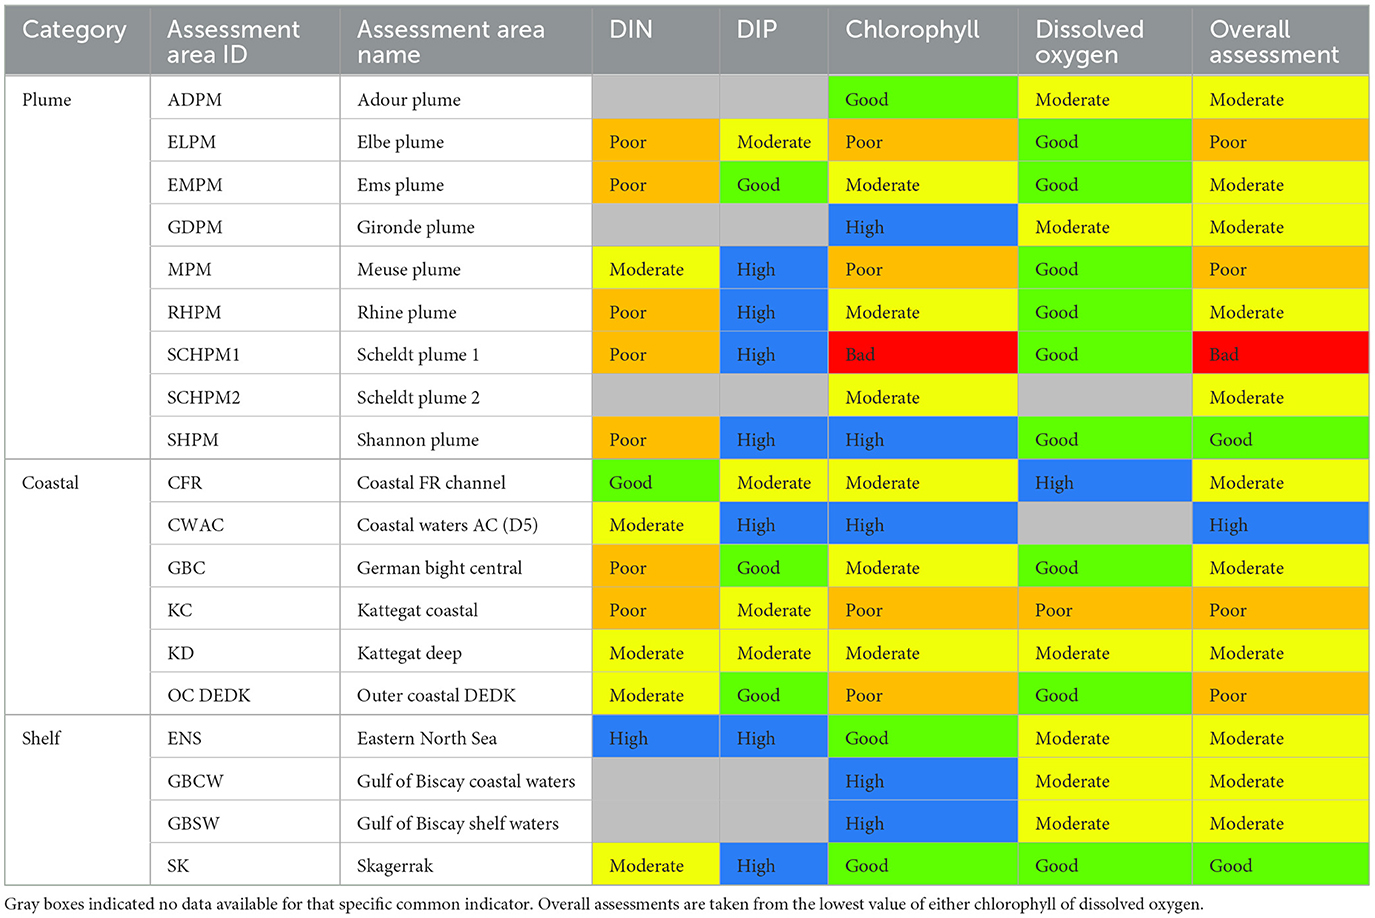
Table 3. Summary table of the eutrophication assessment for COMP4, showing only the assessment areas where at least one of the common indicators did not achieve good status.
3.6 Changes in the COMP4 assessment over time
Trend assessments for nutrient inputs have already been presented and are part of the common indicators in the eutrophication assessments. For the first time, with the long term historical data extracted from COMP1 to COMP4, the assessment can also explore changes over time for both the common indicator value and the changes in eutrophication status. The long-term data enabled a retrospective assessment to be made through the re-running of COMP1 (1990–2000), COMP2 (2001–2006) and COMP3 (2006–2014) data, thereby delineating the history of eutrophication from 1990 until today in OSPAR Regions II, III, and IV. The trend assessments are made for COMP4 common indicators and demonstrate changes in each of the common indicators.
3.6.1 Trends in common indicators
Linear regression and trend analysis were applied to the annual values of the common indicators, including mean winter DIN and DIP, mean growing season chlorophyll and 5th percentile DO (Table 4). While winter concentrations of DIN and DIP have continued to decrease, mainly in coastal and some shelf areas, this decrease has not resulted in a comparable decline in chlorophyll-a concentrations. Chlorophyll-a concentrations show significant decreasing trends in the Coastal French Channel, Outer Coastal DEDK, German Bight, and Kattegat Coastal and Kattegat Deep. Nevertheless, there are also some non-problem areas that show significantly increasing concentrations, including the Loire plume, the Liverpool Bay plume, and Gulf of Biscay coastal and shelf waters. The Atlantic region, Norwegian Trench, Scheldt plume, Meuse plume and Northern North Sea showed statistically significant decreasing trends and a deterioration of bottom dissolved oxygen. Dissolved oxygen concentrations in Kattegat Coastal and Kattegat Deep, while still lower than 6 mg/l, have increased over time, i.e., an improvement in the environmental status.
TABLE 4
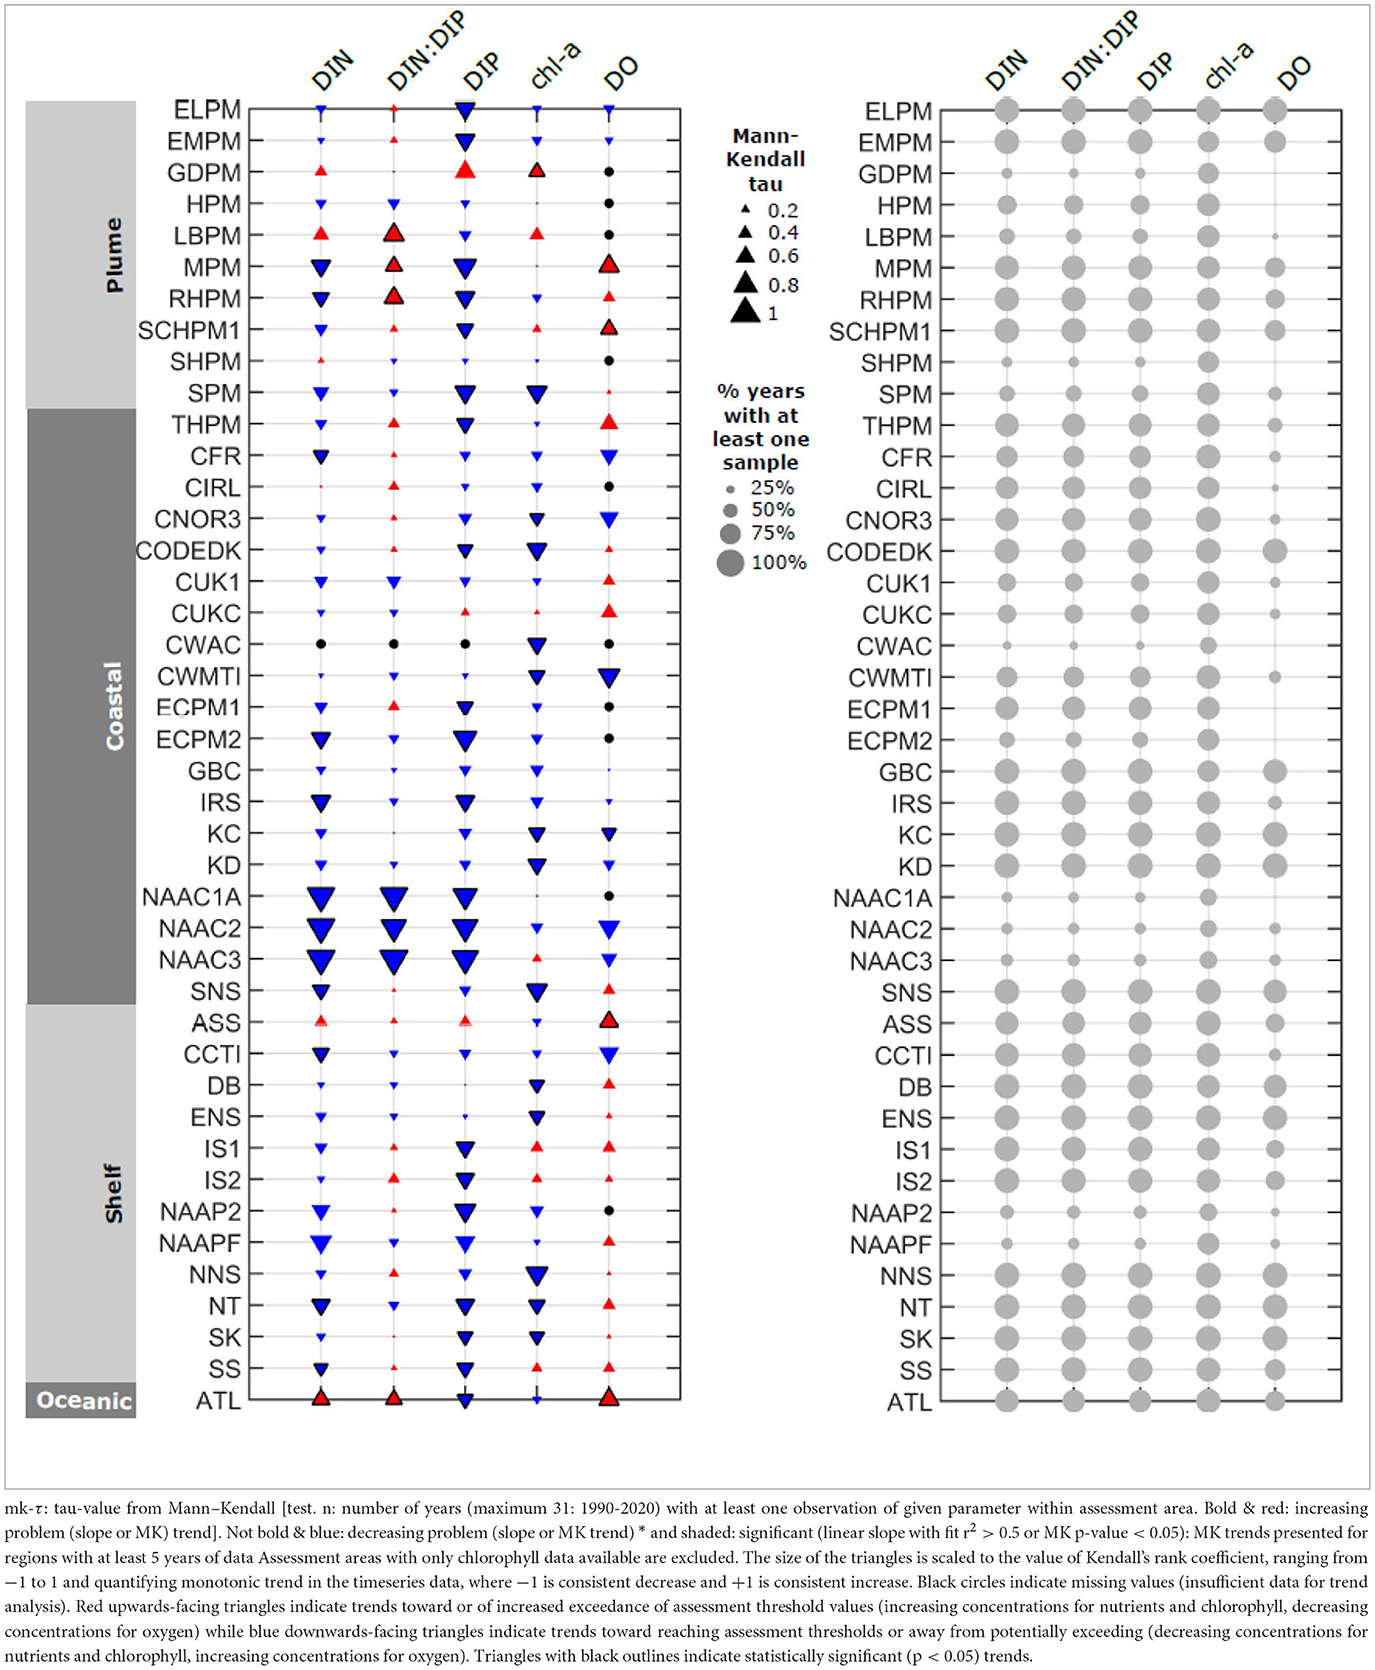
Table 4. Outcomes of trend analysis slope: slope from linear fit to timeseries.
3.6.2 Changes in eutrophication status of the OSPAR areas
Since the first COMP assessment in 2010, the eutrophication status of the OSPAR Maritime Area has improved. The four applications of the Common Procedure have revealed a steadily improving trend in the eutrophication status of OSPAR Regions II, III and IV (Figure 11). The first assessment covering the period 1990–2000 was characterized by poor conditions in much of the North Sea and bad conditions in the south-east and Kattegat. Later assessments show a contraction of eutrophication extending back toward the continental coasts. Eutrophication persists in the river plumes and in some coastal areas. Comparison of the four different COMP periods shows a gradual decrease in the number and total surface area of assessment areas that do not achieve good status using the current COMP4 common indicators. A change in status from problem to non-problem areas has been observed mainly offshore in the southern part of the North Sea (away from the coastal plumes), Belgian offshore waters, the former Dutch Southern Bight area and, partly, in Dutch coastal waters. These areas are now combined in the new transboundary area of Southern North Sea.
FIGURE 11
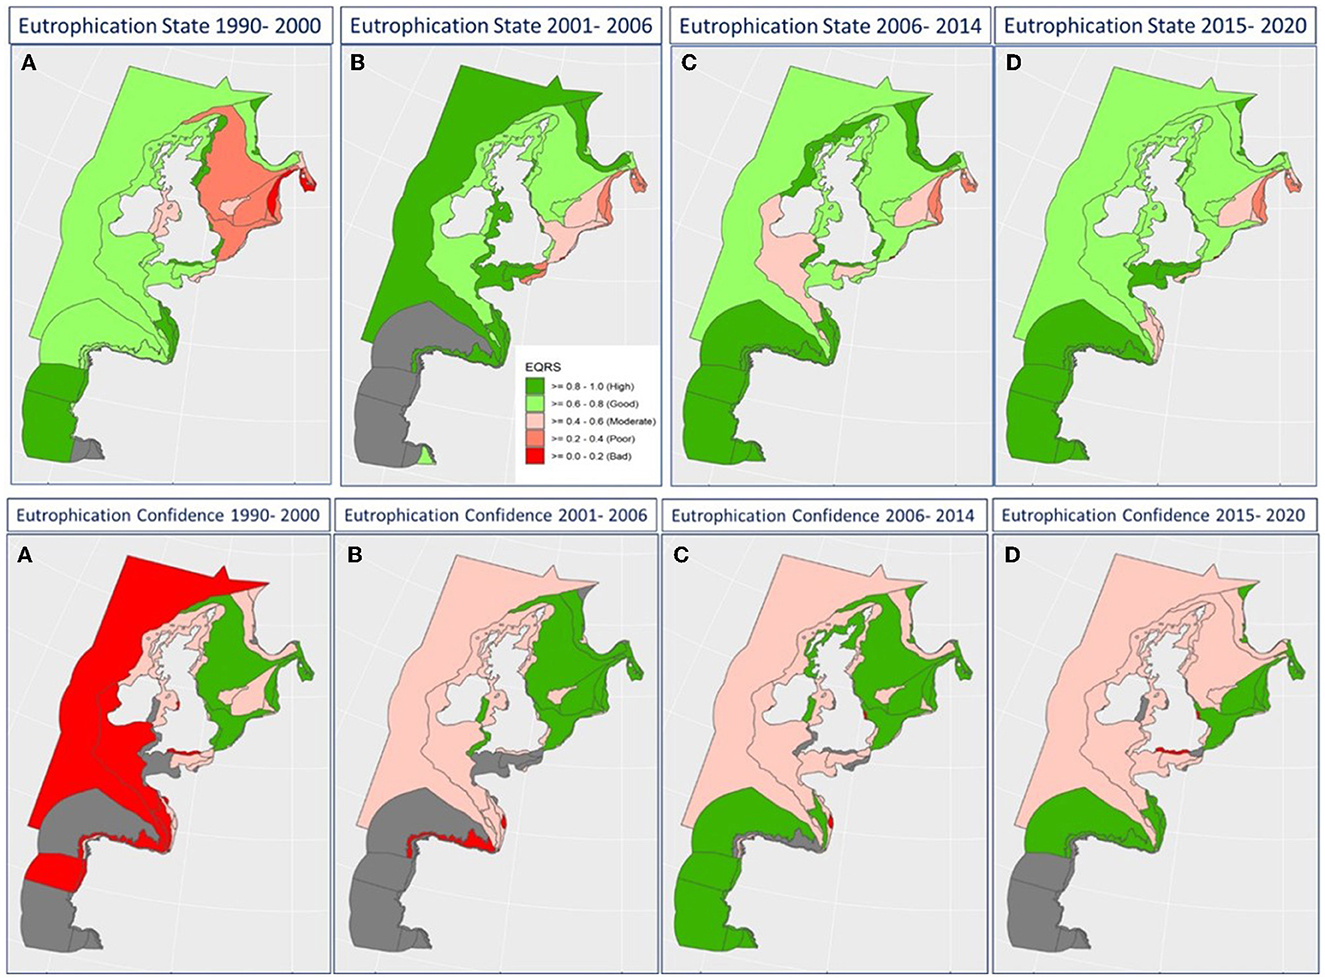
Figure 11. Outcomes for the four OSPAR assessment periods for overall assessment, Top row: outcomes for (A) COMP1, (B) COMP2 (C), COMP3, and (D) COMP4. Bottom row: Confidence for (A) COMP1, (B) COMP2 (C), COMP3, and (D) COMP4. Gray shaded areas were not analyzed due to limited data.
The number of areas that have been designated as moderate, poor or bad has decreased for DIN, DIP, and chl-a, but are increasing in overall area for dissolved oxygen from the COMP1 to the COMP4 period (Figure 12). When considering the surface area that did not achieve good status, there is a more continuous decrease for DIN, but the development was different for DIP, which experienced an increase during the COMP2 and COMP3 periods but a reduction to a much smaller surface area in not-good status in the recent COMP4 assessment. Since the first COMP assessment, the total surface area of assessment areas where chlorophyll concentrations exceed thresholds has decreased, notably in coastal and shelf assessment areas. However, no change has been observed since the period 2006–2014. It should be noted that the satellite data used for the Chlorophyll common indicator only became available from 1998 onwards. The chlorophyll assessment for the COMP1 period was therefore mainly determined by in situ sample data, which increases the uncertainty of the assessment, notably because of low spatial and temporal confidence in offshore areas such as the northern North Sea. Changes in the main data source for chlorophyll may, over time, have driven some of the changes observed in the overall eutrophication assessment, in particular from COMP1 to COMP2. The surface area of assessment areas that do not achieve good status for DO has increased, from COMP1 (16,657 km2) and COMP2 (98,318 km2) to a maximum in COMP3 of 337,696 km2, reducing to 110,261 km2 in the current COMP4 (Figure 12). Whilst the increase in shelf waters failing the dissolved oxygen threshold is concerning, it is also a factor of the limited DO data in large shelf areas where a small number of values taken at bottom depth at a few sites can give a low value for the 5th percentile. As the results of DO monitoring are aggregated to the entire assessment areas, failures at specific sites can be propagated up to large areas. For example, the bad status recorded in the Gulf of Biscay in COMP4 is related to 1 year of low DO values (2016), which was not seen in other years. Increased data collection and inclusion of bottom water dissolved oxygen values from biogeochemical models are expected to resolve these issues in the future.
FIGURE 12
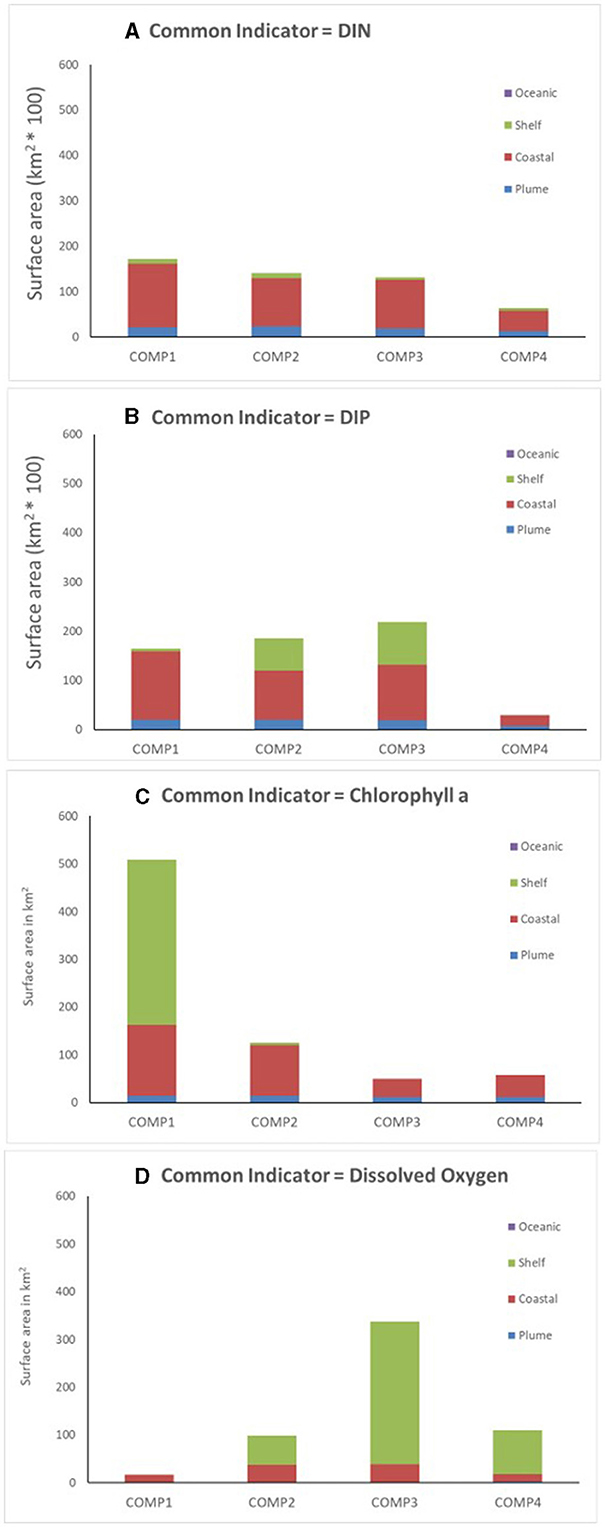
Figure 12. Surface areas of the OSPAR assessment area assessed as moderate, poor or bad (i.e., failing to achieve good status) was added together to show the area that did not achieve good status for each indicator including (A) DIN, (B) DIP, (C) Chl-a, and (D) Dissolved oxygen. Analysis was on previous COMP1, COMP2 and COMP3 period data but applying the COMP4 methodology. The areas are classified in categories of plume, coastal, shelf and oceanic areas. DIN, Winter Mean of Dissolved Inorganic Nitrogen; DIP, Winter Mean of Dissolved Inorganic Phosphorus; Chl-a, Mean Growing Season Chlorophyll-a; DOXY, Bottom 5th Percentile of Dissolved Oxygen.
4 Discussion
Eutrophication can have a substantial impact on the marine environment, limiting access to ecosystem services by acting as a pressure on multiple ecosystem components (Best et al., 2007; Duarte et al., 2008a,b; Paerl and Piehler, 2008; Paerl, 2009; Clark et al., 2017; Korpinen et al., 2021; Devlin and Brodie, 2023). Even at low concentrations, increased nutrient loads and changing proportions of nutrients can result in increasing phytoplankton biomass and species shifts which can affect trophic levels (Burson et al., 2016; Grosse et al., 2017; Piroddi et al., 2021; Graves et al., 2023). Eutrophication can have significant economic impacts, such as reducing the attractiveness and amenity value of coastal waters (Belin et al., 1995; Paerl, 2009; Gibson et al., 2012). More serious eutrophication involves hypoxic events which harm many organisms but are particularly damaging to sessile benthic fauna, whose loss again affects the food web and biotic water quality regulation (Borja, 2005; Borja et al., 2008).
This application of OSPAR Common Procedure identifies eutrophication problems in river plumes and coastal waters. The assessment shows that eutrophication is still a problem along the continental coast of Greater North Sea (Region II) with 67% of plume areas, 43% of coastal areas and 10% shelf areas in Region II now classified as problem areas. For the Bay of Biscay (Region IV), 67% of plume areas, 42% of coastal areas and 40% of shelf areas in Region IV were classified as problem areas and have not achieved good status for Eutrophication. These waters are under the most anthropogenic pressure, but also have the highest value to society in terms of recreation, visual amenity and artistic uses (Thrush et al., 2013; Martin et al., 2016; Reker et al., 2019). Coastal areas are relatively productive and therefore important for fish and shellfish (Duarte et al., 2008b, 2020). These are the shallower areas where seagrasses and seaweeds would be expected to maintain nursery areas for fish populations and habitat structure (Stål et al., 2008; Sheaves et al., 2015). They are also the recipients of land-based pollution, and the restoration of biotic and abiotic water quality regulation will be essential if eutrophication is to be addressed and the ecosystem services protected.
While winter concentrations of DIN and DIP have continued to decrease, mainly in coastal and some shelf areas, this decrease has not resulted in a comparable decline in chlorophyll-a concentrations. This is because phytoplankton biomass is controlled, not only by nutrients, but also by a complex interplay of different processes including light limitation and grazing (Skogen et al., 2007). Currently, eutrophication drivers and effects are primarily diagnosed by means of elevated dissolved nutrient concentrations, elevated levels of chlorophyll-a and oxygen depletion, and to fully substantiate the evidence it is important to spatially widen the application of additional indicators such as total nutrient concentration, nutrient ratios and photic limit in future COMPs (Paerl, 2009; Paerl et al., 2014).
The OSPAR Contracting Parties have made significant efforts to reduce nutrient losses to the marine environment. These measures to reduce inputs have since been implemented with varying degrees of success by environmental directives covering wastewater treatment, nitrates in agriculture, industrial emissions and water and marine management with wastewater treatment and industrial point sources reducing discharges of both nitrogen and phosphorus significantly. Riverine inputs of phosphorus have decreased significantly, as have atmospheric nitrogen inputs. Overall phosphorus inputs have been reduced substantially, due to better sewage treatment technology. The only major increases in phosphorus occur along the Norwegian coasts are due to increases in aquaculture though eutrophication pressures are still higher in the south than north. The area-specific nitrogen inputs to the Bay of Biscay and Iberian Coast are about 70% of those to the Greater North Sea, while the area-specific phosphorus inputs are about half of those in the Celtic and North Seas. The most dramatic improvements have come in the form of atmospheric nitrogen input reductions and a reduction in fertilizer use since 1990. Atmospheric nitrogen disperses far away from coasts, deposits directly onto productive surface waters and is completely bio-available being inorganic oxidized or reduced forms. It accounts for approximately a third to a half of the nitrogen input to Regions II–IV. In Region I the atmospheric component is ~75% of the total nitrogen input (Axe et al., 2022). It has been reduced as a result of applying and reviewing the CLRTAP Gothenburg Protocol and incorporating those targets into legally binding EU directives. The transition to less combustion for power generation, transport, heating and cooking has not only improved air quality in towns but also enabled emissions targets to be met and inputs to the sea to be reduced. Since 1990, phosphorus inputs to the Greater North Sea have decreased by almost two-thirds and a similar, 50% reduction is visible in the Celtic Seas data and in the total phosphorus loads to Regions I–IV combined, suggesting that collectively the 50% emission reduction agreed in PARCOM Recommendation 88/2 may have been achieved, at least for phosphorus.
However, nitrogen loading, after many years of reduction, now shows an increasing trend in several rivers reflecting a concerning issue around diffuse nitrogen (Axe et al., 2022). Success in the reduction of nutrient loading is also variable across the OSPAR areas, where waterborne nitrogen inputs have not decreased as significantly when looking at the OSPAR maritime area as a whole. This is important factor for the assessment of eutrophication in plumes and coastal areas where waterborne inputs dominate. Long term storage in sediments is also contributing to persistently high nutrient concentrations. Substantial decreases in inputs from wastewater treatment and industrial point sources around the Iberian, Celtic and North Sea coasts are almost balanced by the increase in waterborne inputs to the Arctic, which have increased substantially since the 1990s owing to the growing aquaculture industry. In the Greater North Sea, the proportionally greater reduction in phosphorus input compared to nitrogen input leads to an overall change in the relative amounts of molar nitrogen and phosphorus in the inflowing freshwater. Changes in the molar ratio can have ecosystem effects such as altering the phytoplankton community composition. Such changes in nutrient limitation have been observed in the North Sea (Burson et al., 2016). Program of measures in almost all OSPAR countries with the exception of the Kattegat have been successful in reduction of P. The particular problems measured in the Kattegat is mainly due to increased P-concentration in the Baltic Sea over the last two decades due to wide spread anoxia. The reduction in waterborne inputs have been less successful for diffuse nitrogen, indicating that stronger reductions of nitrogen inputs are necessary in the future. This would also be beneficial for a more balanced ratio of nitrogen and phosphorus.
The extent of the growth in aquaculture within the OSPAR Maritime Areas is striking. Artic Waters were alone in showing significant increases in waterborne nutrient inputs. Analysis of the changes in direct discharges to the OSPAR Convention area has shown that almost all the improvements in industrial discharges and wastewater treatment have been canceled out by the increases from marine aquaculture. Moreover, marine aquaculture is not covered by either the EU Industrial Emissions Directive or its associated BREF documents. A gap therefore exists concerning the agreement of minimum environmental standards for aquaculture across the OSPAR Convention area, but also—since the COMP analysis did not cover Arctic waters—there is a knowledge gap as to whether the substantial increase in nutrient inputs is causing eutrophication in OSPAR Arctic waters.
The COMP4 outcomes show improvements in eutrophication status, seen by the increase in total area that is now in good or high status. However, there are still concerning and persistent issues with high nutrients, particularly DIN in many of the plume and coastal areas with 9 of the assessment areas failing due to exceeding thresholds for chlorophyll and dissolved oxygen. Much is being done, but more is required to ensure that we continue to work toward a healthy marine system.
The North-East Atlantic Environment Strategy (NEAES) 2030 was adopted on 1 October 2021 (NEAES 2030). This strategy sets out a process for the implementation of the OSPAR Convention in the period 2020–2030 and to contribute to the United Nations Sustainable Development Goals (UN SDGs, in particular SDG14—to protect life under water). Specific strategic objectives for eutrophication under Agenda 2030 include “to determine the maximum inputs of nutrients for relevant assessment areas which prevent deterioration and enable the achievement of non-problem area status throughout the North-East Atlantic.” OSPAR's eutrophication modeling group (ICG EMO) is determining maximum nutrient inputs and paving the way for agreement on the nutrient reduction needs that enable each Contracting Party to stay at or below the maximum input levels. This needs to give adequate consideration to transboundary nutrient transports, both between Contracting Parties and from outside the OSPAR Maritime Area. While deriving nutrient reduction needs is scientifically challenging and time consuming it is important to concurrently undertake immediate measures in catchments where nutrient inputs are increasing, and/or eutrophication effects are increasing. This includes catchments in OSPAR Regions II and IV, as well as the overall waterborne nutrient inputs in Region I caused by intensive marine aquaculture.
One of the key successes of the COMP4 assessment is the development of a harmonized process, allowing all the OSPAR regions to identify common problems, which will eventually lead to action on common solutions. Outcomes of the COMP4 approach reflect the adaptive management of the ecosystem approach (Reker et al., 2019), incorporating a major revision in assessment areas and thresholds based on the best available scientific knowledge and presenting, for the first time, a harmonized assessment across all OSPAR areas. The automated COMPEAT tool has been successfully applied for the first time and will be further developed for COMP5, adding additional indicators and revising the status and confidence assessment methodology where needed. Using a common assessment tool also enables the data from previous applications of the Common Procedure to be re-analyzed with the new methodology, providing a more reliable indication of progress in reducing eutrophication than has been possible when comparing previous assessments with varying threshold levels and assessment units. The use of COMPEAT, harmonized assessment areas and assessment levels has led to an objective, transparent and reproducible status assessment, with a common scientific basis across the whole of the region. This common and agreed process can now serve as a basis for deriving nutrient reduction needs as a shared responsibility across all OSPAR regions.
Temporal trend assessments of individual indicators at national and regional level will supplement eutrophication status assessments within the Common Procedure. Trend assessment is of particular interest as detrimental environmental changes over the past few decades have had consequences on the environment in general, including impacts on the eutrophication process, on living resources, environmental resilience and fisheries management. Time-series are of importance for studies on the biological influence of anthropogenic effects and climatic changes, both in themselves and in providing a baseline and/or reference conditions for future investigations. They put (relatively) short assessment periods into a long-term perspective. As part of the Common Procedure, temporal trend assessment should allow tracking of whether key environmental parameters of a problem area regarding its eutrophication status are moving in the right direction, indicating that measures taken to combat eutrophication are taking effect.
Confidence in the eutrophication assessment will continue to be further strengthened by improving monitoring, particularly in those areas where the temporal and/or spatial coverage is currently inadequate (Borja et al., 2019; Fettweis et al., 2023). Whilst the use of satellite data for chlorophyll in eutrophication assessments is now embedded in the COMP, future assessments could benefit from continual improvement of the algorithms for chlorophyll estimation and exploring satellite and ecosystem model data at higher resolution in order to obtain better spatially resolved information on eutrophication problems. Concerning oxygen concentrations near the seafloor, in situ sample data alone will not adequately capture the high spatial and temporal variability of depletion events. The use of automated monitoring devices and biogeochemical modeling of the spatial extent of depletion events is already under development and will be used in COMP 5. As an example, this integration of modeling data was already applied for the French eutrophication assessment within the MSFD (Lefebvre and Devreker, 2020).
Whilst this assessment shows improvements across many of the OSPAR areas, it is clear that further efforts to reduce nutrient inputs are necessary in order to achieve the strategic objective of the North-East Atlantic Environment Strategy 2030 (Grizzetti et al., 2008, 2021; Erisman et al., 2011). As we look toward the future of eutrophication assessments, we recognize that there are many additional elements to consider. Climate change is leading to more frequent and intense floods and droughts which result in stronger variations in nutrient inputs (Porter et al., 2013; Wetz and Yoskowitz, 2013) and an overall increase in the loss of nutrient from agriculture as the uptake of nutrients by the crops will fail in some years.
This assessment addresses marine areas from 1nm offshore as estuaries and nearshore coastal areas are assessed and managed under the Water Framework Directive (WFD). However, as eutrophication problems are often more severe in these areas—following the trend seen in the study with decreasing issues moving away from land—most Contracting Parties are likely to be obliged to reduce nutrient input to their estuaries and coastal areas in order to comply with the WFD. This will have a positive effect on many plumes and coastal areas and the entire North Sea and Kattegat.
Increasing seawater temperature and changes in light conditions through coastal darkening affecting algal bloom patterns may require an adjustment of growing season specification (Devlin et al., 2022). Warming temperatures also impact on marine water's capacity to contain dissolved oxygen as higher temperature reduce solubility of oxygen (Greenwood et al., 2010). Understanding the ecological effects of these changes and how to adequately monitor and assess the increase of extreme events needs to be solved for future eutrophication assessments to allow follow-up of implemented measures and to further understand the response of the ecosystem to eutrophication pressures. For example, Große et al. (2016) defined a so-called Oxygen Deficiency Index (ODI) from modeling output in order to support the location of possible oxygen depletion areas in the North Sea for measurements. This approach was adopted by Piehl et al. (2023) for the Baltic Sea with their shallow sea oxygen deficiency assessment tool.
Despite large anthropogenic nutrient inputs and high nutrient concentrations, an area may exhibit few if any direct and/or indirect effects. However, the risk that nutrient inputs may be transferred to adjacent areas where they can cause detrimental environmental effects should be recognized and countries representing distant sources may contribute significantly to so-called “transboundary affected” problem areas with regard to eutrophication outside their national jurisdiction (OSPAR, 2005, 2022; Claussen et al., 2009; Bugge, 2015; Lenhart and Große, 2018). The common identification of eutrophication problem areas and the use of shared assessment areas in the COMP4 assessment are important steps toward collaborative solutions to transboundary issues. Thresholds developed under this approach for reference conditions were adjusted based on a 50% addition, which assumes a linearity between nutrient concentration and phytoplankton biomass which is not realistic in terms of the ecological lags between nutrient input and biological response (Painting et al., 2005; Duarte et al., 2008a; Raimonet and Cloern, 2017). Future work needs to reevaluate this long accepted 50% acceptable deviation, analyzing long term data to identify values for natural variability that are appropriate and specific to the different common indicators.
Long term sustainability of our coastal and marine systems depends on improving resilience, particularly in the face of climate change and extreme weather (Borja et al., 2020; Chou et al., 2021; Devlin et al., 2021). Knowledge and action on nutrients as a key pressure should be considered as part of adaptive resilience planning for different climate scenarios and over different timescales. The reduction of nutrient pressures can provide a more resilient marine environment, to benefit both the natural environment and those who are reliant upon it whilst supporting long term sustainability in the North-East Atlantic.
The North-East Atlantic Environment Strategy looks across the many indicators of ecological health, recognizing the complex interactions between drivers such as eutrophication and wider impacts. Future work must look to improve understanding of how eutrophication affects biodiversity, in particular the quality of pelagic habitats and food webs (Duarte et al., 2008a,b, 2020). The linkage between the eutrophication assessment and the OSPAR pelagic indicators (McQuatters-Gollop et al., 2009, 2019, 2022; Tett et al., 2013; Batten et al., 2019; Bedford et al., 2020; Graves et al., 2023; Holland et al., 2023) needs to be better understood and strengthened in order to achieve ecosystem-based management across multiple pressures. This can be achieved through the development of indicators that integrate eutrophication and pelagic habitats, food-webs and benthic habitats within the COMP4 assessment areas, starting with a thorough analysis of the feedback loops between eutrophication and biodiversity. As the world warms, it will become an essential component of any assessment to acknowledge and include the additive or cumulative impacts from climate change. For example, climate change leads to increases in floods and droughts which cause stronger variations in nutrient inputs. More investigation is needed in order to understand the ecological effects of this greater variability and how to adequately monitor and assess such increasingly prevalent events for the purposes of future eutrophication assessments. This coherent assessment has shown us that improvements are happening, but it is important to keep moving forward with our program of measures. Continuing to reduce and mitigate the impacts of eutrophication, alongside the critical issues of climate and biodiversity, will be a vital part of ensuring a sustainable future for our coastal and marine ecosystems.
Data availability statement
The original contributions presented in the study are included in the article/Supplementary material, further inquiries can be directed to the corresponding author.
Author contributions
MD: Conceptualization, Formal analysis, Investigation, Methodology, Resources, Supervision, Validation, Visualization, Writing—original draft, Writing—review & editing. TP: Conceptualization, Formal analysis, Investigation, Methodology, Supervision, Validation, Visualization, Writing—original draft, Writing—review & editing. LE: Conceptualization, Formal analysis, Investigation, Methodology, Validation, Visualization, Writing—original draft, Writing—review & editing. WL: Conceptualization, Formal analysis, Investigation, Methodology, Validation, Visualization, Writing—original draft, Writing—review & editing. BH: Conceptualization, Formal analysis, Investigation, Methodology, Validation, Visualization, Writing—original draft, Writing—review & editing. PA: Conceptualization, Formal analysis, Investigation, Methodology, Validation, Visualization, Writing—original draft, Writing—review & editing. HR: Writing—original draft, Writing—review & editing. AB: Formal analysis, Methodology, Validation, Writing—original draft, Writing—review & editing. EB: Formal analysis, Methodology, Validation, Writing—original draft, Writing—review & editing. KC: Conceptualization, Data curation, Formal analysis, Investigation, Methodology, Validation, Visualization, Writing—original draft. DD: Investigation, Methodology, Writing—original draft, Writing—review & editing. LF: Data curation, Formal analysis, Investigation, Methodology, Validation, Writing—original draft. FG: Data curation, Formal analysis, Investigation, Methodology, Validation, Writing—original draft. CG: Data curation, Investigation, Methodology, Validation, Visualization, Writing—original draft, Writing—review & editing. AL: Conceptualization, Validation, Visualization, Writing—original draft, Writing—review & editing. HL: Conceptualization, Data curation, Formal analysis, Investigation, Methodology, Validation, Visualization, Writing—original draft. SM: Conceptualization, Formal analysis, Methodology, Validation, Visualization, Writing—original draft, Writing—review & editing. MN: Investigation, Methodology, Validation, Writing—original draft. GO'D: Conceptualization, Methodology, Writing—original draft. HP: Conceptualization, Data curation, Formal analysis, Methodology, Software, Validation, Visualization, Writing—original draft. ES: Formal analysis, Methodology, Writing—original draft. MS: Conceptualization, Methodology, Validation, Writing—original draft, Writing—review & editing. LS: Conceptualization, Data curation, Formal analysis, Methodology, Validation, Visualization, Writing—review & editing. SV: Conceptualization, Formal analysis, Methodology, Validation, Visualization, Writing—original draft, Writing—review & editing. RW: Conceptualization, Formal analysis, Methodology, Validation, Visualization, Writing—original draft, Writing—review & editing. ED: Conceptualization, Formal analysis, Project administration, Software, Writing—original draft. AI-C: Conceptualization, Funding acquisition, Methodology, Project administration, Supervision, Writing—original draft.
Funding
Authors were all funded by individual countries with support from the OSPAR secretariat. Lead author time was funded under a Grant-in-Aid programme to Cefas from the UK's Department for the Environment, Food and Rural Affairs.
Conflict of interest
MD, KC, and CG were employed by Cefas. MD was employed by CCSUS. TP and AB were employed by Deltares. LE was employed by Rijkswaterstaat. WL was employed by Umweltbundesamt. VF was employed by The ERM International Group Limited. GO'D was employed by ICES. SV was employed by Environmental Protection Agency. RW was rmployed by OSPAR Commission.
The remaining authors declare that the research was conducted in the absence of any commercial or financial relationships that could be construed as a potential conflict of interest.
The author(s) MD, AL, MN declared that they were an editorial board member of Frontiers, at the time of submission. This had no impact on the peer review process and the final decision.
Publisher's note
All claims expressed in this article are solely those of the authors and do not necessarily represent those of their affiliated organizations, or those of the publisher, the editors and the reviewers. Any product that may be evaluated in this article, or claim that may be made by its manufacturer, is not guaranteed or endorsed by the publisher.
Supplementary material
The Supplementary Material for this article can be found online at: https://www.frontiersin.org/articles/10.3389/focsu.2023.1253923/full#supplementary-material
References
Alvera-Azcárate, A., Van der Zande, D., Barth, A., Troupin, C., Martin, S., and Beckers, J.-M. (2021). Analysis of 23 years of daily cloud-free chlorophyll and suspended particulate matter in the Greater North Sea. Front. Mar. Sci. 8, 707632. doi: 10.3389/fmars.2021.707632
Andersen, J. H., Carstensen, J., Holmer, M., Krause-Jensen, D., and Richardson, K. (2019). Research and management of eutrophication in coastal ecosystems. Front. Mar. Sci. 6, 768. doi: 10.3389/fmars.2019.00768
Anon (2000). Directive 2000/60/EC of the European Parliament and of the Council of 23 October 2000 Establishing a Framework for Community Action in the Field of WATER Policy. Available online at: https://eur-lex.europa.eu/eli/dir/2000/60/oj (accessed November 18, 2023).
Axe, P., Sonesten, L., Skarbovik, E., Leujak, W., and Nielsen, L. (2022). Inputs of Nutrients to the OSPAR Maritime Area. In OSPAR, 2023: The 2023 Quality Status Report for the North-East Atlantic. London: OSPAR Commission.
Backer, H., Leppänen, J.-M., Brusendorff, A. C., Forsius, K., Stankiewicz, M., Mehtonen, J., et al. (2010). HELCOM baltic sea action plan–a regional programme of measures for the marine environment based on the ecosystem approach. Mar. Pollut. Bull. 60 642–649. doi: 10.1016/j.marpolbul.2009.11.016
Batten, S. D., Abu-Alhaija, R., Chiba, S., Edwards, M., Graham, G., Jyothibabu, R., et al. (2019). A global plankton diversity monitoring program. Front. Mar. Sci. 6, 321. doi: 10.3389/fmars.2019.00321
Bean, T. P., Greenwood, N., Beckett, R., Biermann, L., Bignell, J. P., Brant, J. L., et al. (2017). A review of the tools used for marine monitoring in the UK: combining historic and contemporary methods with modeling and socioeconomics to fulfill legislative needs and scientific ambitions. Front. Mar. Sci. 4, 263. doi: 10.3389/fmars.2017.00263
Bedford, J., Ostle, C., Johns, D. G., Atkinson, A., Best, M., Bresnan, E., et al. (2020). Lifeform indicators reveal large-scale shifts in plankton across the North-West European shelf. Glob. Chang. Biol. 26, 3482–3497. doi: 10.1111/gcb.15066
Belin, C., Beliaeff, B., Raffin, B., Rabia, M., and Ibanez, F. (1995). “Phytoplankton time-series data of the French phytoplankton monitoring network: toxic and dominant species,” in Harmful Marine Algal Blooms. Technique et Documentation-Lavoisier (London: Intercept Ltd).
Best, M., Wither, A., and Coates, S. (2007). Dissolved oxygen as a physico-chemical supporting element in the water framework directive. Mar. Pollut. Bull. 55, 53–64. doi: 10.1016/j.marpolbul.2006.08.037
Blauw, A., Eleveld, M., Prins, T., Zijl, F., Groenenboom, J., Winter, G., et al. (2019). Coherence in Assessment Framework of Chlorophyll a and Nutrients as Part of the EU Project ‘Joint monitoring Programme of the Eutrophication of the North Sea with Satellite Data. Activity 1 Report (Ref: DG ENV/MSFD Second Cycle/2016). Deltares, Netherlands.
Borja, Á. (2005). The European water framework directive: a challenge for nearshore, coastal and continental shelf research. Cont. Shelf Res. 25, 1768–1783. doi: 10.1016/j.csr.2005.05.004
Borja, A., Bricker, S. B., Dauer, D. M., Demetriades, N. T., Ferreira, J. G., Forbes, A. T., et al. (2008). Overview of integrative tools and methods in assessing ecological integrity in estuarine and coastal systems worldwide. Mar. Pollut. Bull. 56, 1519–1537. doi: 10.1016/j.marpolbul.2008.07.005
Borja, A., Elliott, M., Andersen, J. H., Berg, T., Carstensen, J., Halpern, B. S., et al. (2016). Overview of integrative assessment of marine systems: the ecosystem approach in practice. Front. Mar. Sci. 3, 20. doi: 10.3389/fmars.2016.00020
Borja, A., Garmendia, J. M., Menchaca, I., Uriarte, A., and Sagarmínaga, Y. (2019). Yes, we can! Large-scale integrative assessment of European regional seas, using open access databases. Front. Mar. Sci. 6, 19. doi: 10.3389/fmars.2019.00019
Borja, A., White, M. P., Berdalet, E., Bock, N., Eatock, C., Kristensen, P., et al. (2020). Moving toward an agenda on ocean health and human health in Europe. Front. Mar. Sci. 7, 37. doi: 10.3389/fmars.2020.00037
Bricker, S., Clement, C., Pirhalla, D., Orland, S., and Farrow, D. (1999). National Estuarine Eutrophication Assessment: A Summary of Conditions, Historical Trends, and Future Outlook. Silver Springs, MD: National Ocean Service, National Oceanic and Atmospheric Administration.
Brockmann, U., Billen, G., and Gieskes, W. W. (1988). “North Sea nutrients and eutrophication,” in Pollution of the North Sea: An Assessment, eds. W. Salomons, B. L. Bayne, E. K. Duursma, and U. Förstner (Berlin: Springer), 348–389. doi: 10.1007/978-3-642-73709-1_20
Bugge, H. C. (2015). “The principle and duty to cooperate: the case of conventions on transboundary pollution in Europe,” in Transboundary Pollution, eds S. Jayakumar, T. Koh, R. Beckman, and H. D. Phan (London: Edward Elgar Publishing), 263–294. doi: 10.4337/9781784715793.00020
Burson, A., Stomp, M., Akil, L., Brussaard, C. P., and Huisman, J. (2016). Unbalanced reduction of nutrient loads has created an offshore gradient from phosphorus to nitrogen limitation in the N orth S ea. Limnol. Oceanogr. 61, 869–888. doi: 10.1002/lno.10257
Burson, A., Stomp, M., Greenwell, E., Grosse, J., and Huisman, J. (2018). Competition for nutrients and light: testing advances in resource competition with a natural phytoplankton community. Ecology 99, 1108–1118. doi: 10.1002/ecy.2187
CEC (2000). Council Directive 2000/60/EC of the European Parliament and of the Council of 23 October 2000 Establishing a Framework for Community Action in the Field of Water Policy. San Antonio, TX: CEC.
Chou, L.-M., Chua, T.-E., and Bonga, D. (2021). ““Integrated coastal management” enhances coastal resilience to climate change—The East Asia experience,” in Climate Change Science, eds D. S. K. Ting, and J. A. Stagner (Amsterdam: Elsevier), 59–79. doi: 10.1016/B978-0-12-823767-0.00004-5
Clark, C. M., Bell, M. D., Boyd, J. W., Compton, J. E., Davidson, E. A., Davis, C., et al. (2017). Nitrogen-induced terrestrial eutrophication: cascading effects and impacts on ecosystem services. Ecosphere 8, e01877. doi: 10.1002/ecs2.1877
Claussen, U., Zevenboom, W., Brockmann, U., Topcu, D., and Bot, P. (2009). “Assessment of the eutrophication status of transitional, coastal and marine waters within OSPAR,” in Eutrophication in Coastal Ecosystems: Towards Better Understanding and Management Strategies Selected Papers from the Second International Symposium on Research and Management of Eutrophication in Coastal Ecosystems, 20–23 June 2006, eds J. H. Andersen, and D. J. Conley (Nyborg: Springer), 49–58. doi: 10.1007/978-90-481-3385-7_5
Cloern, J. E. (2001). Our evolving conceptual model of the coastal eutrophication problem. Mar. Ecol. Prog. Ser. 210, 223–253. doi: 10.3354/meps210223
De Jong, F. (2007). Marine Eutrophication in Perspective: On the Relevance of Ecology for Environmental Policy. Berlin: Springer Science and Business Media. doi: 10.1007/3-540-33648-6
de La Fayette, L. (1999). The OSPAR convention comes into force: continuity and progress. Int. J. Mar. Coast. Law 14, 247–297. doi: 10.1163/157180899X00110
Desmit, X., Nohe, A., Borges, A. V., Prins, T., De Cauwer, K., Lagring, R., et al. (2020). Changes in chlorophyll concentration and phenology in the North Sea in relation to de-eutrophication and sea surface warming. Limnol. Oceanogr. 65, 828–847. doi: 10.1002/lno.11351
Desmit, X., Thieu, V., Billen, G., Campuzano, F., Dulière, V., Garnier, J., et al. (2018). Reducing marine eutrophication may require a paradigmatic change. Sci. Total Environ. 635, 1444–1466. doi: 10.1016/j.scitotenv.2018.04.181
Devlin, M., Bricker, S., and Painting, S. (2011). Comparison of five methods for assessing impacts of nutrient enrichment using estuarine case studies. Biogeochemistry 106, 177–205. doi: 10.1007/s10533-011-9588-9
Devlin, M., and Brodie, J. (2023). “Nutrients and eutrophication,” in Marine Pollution–Monitoring, Management and Mitigation, ed. A. Reichelt-Brushett (Berlin: Springer), 75–100. doi: 10.1007/978-3-031-10127-4_4
Devlin, M., Fernand, L., and Collingridge, K. (2022). “Concentrations of dissolved oxygen near the seafloor in the greater North Sea, Celtic Seas and Bay of Biscay and Iberian Coast,” in OSPAR, 2023: The 2023 Quality Status Report for the North-East Atlantic (London: OSPAR Commission). Available online at: https://oap.ospar.org/en/ospar-assessments/quality-status-reports/qsr-2023/indicator-assessments/seafloor-dissolved-oxygen/ (accessed November 18, 2023).
Devlin, M., Painting, S., and Best, M. (2007). Setting nutrient thresholds to support an ecological assessment based on nutrient enrichment, potential primary production and undesirable disturbance. Mar. Pollut. Bull. 55, 65–73. doi: 10.1016/j.marpolbul.2006.08.030
Devlin, M. J., Lyons, B. P., Johnson, J. E., and Hills, J. M. (2021). The tropical Pacific Oceanscape: current issues, solutions and future possibilities. Mar. Pollut. Bull. 166, 112181. doi: 10.1016/j.marpolbul.2021.112181
Druon, J.-N., Schrimpf, W., Dobricic, S., and Stips, A. (2004). Comparative assessment of large-scale marine eutrophication: North Sea area and Adriatic Sea as case studies. Mar. Ecol. Prog. Ser. 272, 1–23. doi: 10.3354/meps272001
Duarte, C. M., Agusti, S., Barbier, E., Britten, G. L., Castilla, J. C., Gattuso, J.-P., et al. (2020). Rebuilding marine life. Nature 580, 39–51. doi: 10.1038/s41586-020-2146-7
Duarte, C. M., Conley, D. J., Carstensen, J., and Sánchez-Camacho, M. (2008a). Return to neverland: shifting baselines affect eutrophication restoration targets. Estuaries Coast 32, 29–36. doi: 10.1007/s12237-008-9111-2
Duarte, C. M., Dennison, W. C., Orth, R. J., and Carruthers, T. J. (2008b). The charisma of coastal ecosystems: addressing the imbalance. Estuaries Coast 31, 233–238. doi: 10.1007/s12237-008-9038-7
EC (2018). CAP Specific Objectives… Explained – Ensuring Viable farm Income, Brief No 1. Available online at: https://agriculture.ec.europa.eu/system/files/2021-01/cap_specific_objectives_-_brief_1_-_ensuring_viable_farm_income_0.pdf (accessed November 10, 2022).
EEA (2005). Source Apportionment of Nitrogen and Phosphorus Inputs into the aqUATIC Environment. Maastricht: European Communities.
EEA (2018). The Circular Economy and the Bioeconomy—Partners in Sustainability. EEA Report No 8/2018. Luxembourg: European Environment Agency Office of the European Union Luxembourg.
Emeis, K.-C., van Beusekom, J., Callies, U., Ebinghaus, R., Kannen, A., Kraus, G., et al. (2015). The North Sea—a shelf sea in the anthropocene. J. Mar. Syst. 141, 18–33. doi: 10.1016/j.jmarsys.2014.03.012
Enserink, L., Blauw, A., van der Zande, D., and Markager, S. (2019). Summary Report of the EU Project ‘Joint Monitoring Programme of the Eutrophication of the North Sea With Satellite Data' (Ref: DG ENV/MSFD Second Cycle/2016), 21.
Erisman, J. W., van Grinsven, H., Grizzetti, B., Bouraoui, F., Powlson, D., Sutton, M. A., et al. (2011). The European Nitrogen Problem in a Global Perspective. Cambridge: Cambridge University Press. doi: 10.1017/CBO9780511976988.005
EU (2023). Fertilizer consumption (% of fertilizer production) - European Union. Available online at: https://data.worldbank.org/indicator/AG.CON.FERT.ZS?locations=EU (accessed November 18, 2023).
EUNEP (2015). EU Nitrogen Expert. Nitrogen Use Efficiency (NUE) an Indicator for the Utilization of Nitrogen in Food Systems. Alterra: Wageningen University. Available online at: http://eunep.com/wp-content/uploads/2017/03/N-ExpertPanel-NUE-Session-1.pdf~ed (accessed November 18, 2023).
Eurostat (2019). Gross Nutrient Balance on Agricultural land by Nutrient - Products Datasets – Eurostat. Available obline at: https://europa.eu (accessed November 10, 2022).
Eurostat (2021). Extra-EU trade in agricultural goods - Statistics Explained. Available online at: https://europa.eu (accessed November 10, 2022).
Fanelli, R. M. (2019). The (un) sustainability of the land use practices and agricultural production in EU countries. Int. J. Environ. Stud. 76, 273–294. doi: 10.1080/00207233.2018.1560761
Ferreira, J. G., Andersen, J. H., Borja, A., Bricker, S. B., Camp, J., Cardoso da Silva, M., et al. (2011). Overview of eutrophication indicators to assess environmental status within the European Marine Strategy Framework Directive. Estuar. Coast. Shelf Sci. 93, 117–131. doi: 10.1016/j.ecss.2011.03.014
Fertilizers_Europe (2019). Forecast of food, farming and fertilizer use in the European Union 2019 – 2029. Available online at: https://www.fertilizerseurope.com/wp-content/uploads/2019/12/Forecast-of-food-farming-and-fertilizer-use-in-the-European-Union.pdf (accessed September 16, 2022).
Fettweis, M., Riethmüller, R., Van der Zande, D., and Desmit, X. (2023). Sample based water quality monitoring of coastal seas: how significant is the information loss in patchy time series compared to continuous ones? Sci. Total Environ. 873, 162273. doi: 10.1016/j.scitotenv.2023.162273
Foden, J., Devlin, M. J., Mills, D. K., and Malcolm, S. J. (2010). Searching for undesirable disturbance: an application of the OSPAR eutrophication assessment method to marine waters of England and Wales. Biogeochemistry 106, 157–175. doi: 10.1007/s10533-010-9475-9
Fulweiler, R. W., Rabalais, N. N., and Heiskanen, A. S. (2012). The eutrophication commandments. Mar. Pollut. Bull. 64, 1997–1999. doi: 10.1016/j.marpolbul.2012.07.025
Gauss, M., Bartnicki, J., Jalkanen, J.-P., Nyiri, A., Klein, H., Fagerli, H., et al. (2021). Airborne nitrogen deposition to the Baltic Sea: past trends, source allocation and future projections. Atmos. Environ. 253, 118377. doi: 10.1016/j.atmosenv.2021.118377
Gibson, R., Atkinson, R., Gordon, J., Hughes, R., Hughes, D., and Smith, I. (2012). Anthropogenic nutrient enrichment and blooms of harmful phytoplankton. Oceanogr. Mar. Biol. 50, 65–126. doi: 10.1201/b12157-4
Gohin, F., Van der Zande, D., Tilstone, G., Eleveld, M. A., Lefebvre, A., Andrieux-Loyer, F., et al. (2019). Twenty years of satellite and in situ observations of surface chlorophyll-a from the northern Bay of Biscay to the eastern English Channel. Is the water quality improving? Remote Sens. Environ. 233, 111343. doi: 10.1016/j.rse.2019.111343
Graves, C., Best, M., Atkinson, A., Bear, B., Bresnan, E., Holland, M., et al. (2023). At what scale should we assess the health of pelagic habitats? Trade-offs between small-scale manageable pressures and the need for regional upscaling. Ecol. Indic. 154, 110571. doi: 10.1016/j.ecolind.2023.110571
Greenwood, N., Devlin, M. J., Best, M., Fronkova, L., Graves, C. A., Milligan, A., et al. (2019). Utilizing eutrophication assessment directives from transitional to marine systems in the Thames Estuary and Liverpool Bay, UK. Front. Mar. Sci. 6, 116. doi: 10.3389/fmars.2019.00116
Greenwood, N., Parker, E., Fernand, L., Sivyer, D., Weston, K., Painting, S., et al. (2010). Detection of low bottom water oxygen concentrations in the North Sea; implications for monitoring and assessment of ecosystem health. Biogeosciences 7, 1357–1373. doi: 10.5194/bg-7-1357-2010
Grimvall, A., Stålnacke, P., and Tonderski, A. (2000). Time scales of nutrient losses from land to sea—a European perspective. Ecol. Eng. 14, 363–371. doi: 10.1016/S0925-8574(99)00061-0
Grizzetti, B., Bouraoui, F., and De Marsily, G. (2008). Assessing nitrogen pressures on European surface water. Global Biogeochem. Cycles 22, GB4023. doi: 10.1029/2007GB003085
Grizzetti, B., Vigiak, O., Udias, A., Aloe, A., Zanni, M., Bouraoui, F., et al. (2021). How EU policies could reduce nutrient pollution in European inland and coastal waters. Glob. Environ. Change 69, 102281. doi: 10.1016/j.gloenvcha.2021.102281
Große, F., Greenwood, N., Kreus, M., Lenhart, H.-J., Machoczek, D., Pätsch, J., et al. (2016). Looking beyond stratification: a model-based analysis of the biological drivers of oxygen deficiency in the North Sea. Biogeosciences 13, 2511–2535. doi: 10.5194/bg-13-2511-2016
Grosse, J., Burson, A., Stomp, M., Huisman, J., and Boschker, H. T. (2017). From ecological stoichiometry to biochemical composition: variation in N and P supply alters key biosynthetic rates in marine phytoplankton. Front. Microbiol. 8, 1299. doi: 10.3389/fmicb.2017.01299
Heathwaite, A. (2010). Multiple stressors on water availability at global to catchment scales: understanding human impact on nutrient cycles to protect water quality and water availability in the long term. Freshw. Biol. 55, 241–257. doi: 10.1111/j.1365-2427.2009.02368.x
Heslenfeld, P., and Enserink, L. (2008). OSPAR ecological quality objectives: the utility of health indicators for the North Sea. ICES J. Mar. Sci. 65, 1392–1397. doi: 10.1093/icesjms/fsn159
Heyden, B., and Leujak, W. (2022). “Winter nutrient concentrations in the greater North Sea, Celtic Seas and Bay of Biscay and Iberian Coast,” in OSPAR, 2023: The 2023 Quality Status Report for the Northeast Atlantic. London: OSPAR Commission. Available online at: https://oap.ospar.org/en/ospar-assessments/quality-status-reports/qsr-2023/indicator-assessments/winter-nutrient-concentrations/ (accessed November 18, 2023).
Holland, M. M., Louchart, A., Artigas, L. F., Ostle, C., Atkinson, A., Rombouts, I., et al. (2023). Major declines in NE Atlantic plankton contrast with more stable populations in the rapidly warming North Sea. Sci. Total Environ. 898, 165505. doi: 10.1016/j.scitotenv.2023.165505
Hukari, S., Hermann, L., and Nättorp, A. (2016). From wastewater to fertilisers—technical overview and critical review of European legislation governing phosphorus recycling. Sci. Total Environ. 542, 1127–1135. doi: 10.1016/j.scitotenv.2015.09.064
Jennings, S., Stentiford, G. D., Leocadio, A. M., Jeffery, K. R., Metcalfe, J. D., Katsiadaki, I., et al. (2016). Aquatic food security: insights into challenges and solutions from an analysis of interactions between fisheries, aquaculture, food safety, human health, fish and human welfare, economy and environment. Fish Fish. 17, 893–938. doi: 10.1111/faf.12152
Jickells, T. D., and Weston, K. (2011). “Nitrogen cycle - external cycling: losses and gains,” in Treatise on Estuarine and Coastal Science, eds D. Mclusky, and E. Wolanski (Waltham: Academic Press). 261–278. doi: 10.1016/B978-0-12-374711-2.00509-X
Karlsson, M., Gilek, M., and Lundberg, C. (2016). “Eutrophication and the ecosystem approach to management: a case study of Baltic Sea environmental governance,” in Environmental Governance of the Baltic Sea, eds. M. Gilek, M. Karlsson, S. Linke, and K. Smolarz (Cham: Springer), 21–44. doi: 10.1007/978-3-319-27006-7_2
Khan, M. N., and Mohammad, F. (2014). “Eutrophication: challenges and solutions,” in Eutrophication: Causes, Consequences and Control: Volume 2, eds A. A. Ansari, and S. S. Gill. (Dordrecht: Springer Netherlands), 1–15. doi: 10.1007/978-94-007-7814-6_1
Klein, H., Gauss, M., Tsyro, S., Nyíri, A., Fagerli, H., and Wind, P. (2020). Transboundary Air Pollution by Sulphur, Nitrogen, Ozone and Particulate Matter in 2018. MSC-W Data Note 1/2020. The European Union. Available online at: https://emep.int/publ/reports/2020/Country_Reports/report_EU.pdf (accessed November 18, 2023).
Korpinen, S., Laamanen, L., Bergström, L., Nurmi, M., Andersen, J. H., Haapaniemi, J., et al. (2021). Combined effects of human pressures on Europe's marine ecosystems. Ambio 50, 1325–1336. doi: 10.1007/s13280-020-01482-x
Kratzer, S., Ebert, K., and Sørensen, K. (2011). “Monitoring the bio-optical state of the Baltic Sea ecosystem with remote sensing and autonomous in situ techniques,” in The Baltic Sea Basin, eds J. Harff, S. Björck, and P. Hoth (Berlin: Springer), 407–435. doi: 10.1007/978-3-642-17220-5_20
Lavigne, H., Van der Zande, D., Ruddick, K., Dos Santos, J. C., Gohin, F., Brotas, V., et al. (2021). Quality-control tests for OC4, OC5 and NIR-red satellite chlorophyll-a algorithms applied to coastal waters. Remote Sens. Environ. 255, 112237. doi: 10.1016/j.rse.2020.112237
Lefebvre, A., and Devreker, D. (2020). First comprehensive quantitative multi-parameter assessment of the eutrophication status from coastal to marine French waters in the English channel, the Celtic Sea, the Bay of Biscay, and the Mediterranean Sea. J. Mar. Sci. Eng. 8, 561. doi: 10.3390/jmse8080561
Lenhart, H., Blauw, A., Desmit, X., Fernand, L., Friedland, R., Heyden, O., et al. (2022). ICG-EMO Report on Model Comparison for Historical Scenarios as Basis to Derive New Threshold Values. London: OSPAR.
Lenhart, H.-J., and Große, F. (2018). Assessing the effects of WFD nutrient reductions within an OSPAR frame using trans-boundary nutrient modeling. Front. Mar. Sci. 5, 447. doi: 10.3389/fmars.2018.00447
Lenhart, H.-J., Mills, D. K., Baretta-Bekker, H., Van Leeuwen, S. M., Van Der Molen, J., Baretta, J. W., et al. (2010). Predicting the consequences of nutrient reduction on the eutrophication status of the North Sea. J. Mar. Syst. 81, 148–170. doi: 10.1016/j.jmarsys.2009.12.014
Long, R. (2011). The Marine Strategy Framework Directive: a new European approach to the regulation of the marine environment, marine natural resources and marine ecological services. J. Energy Nat. Resour. Law 29, 1–44. doi: 10.1080/02646811.2011.11435256
Lu, C., and Tian, H. (2017). Global nitrogen and phosphorus fertilizer use for agriculture production in the past half century: shifted hot spots and nutrient imbalance. Earth Syst. Sci. Data 9, 181–192. doi: 10.5194/essd-9-181-2017
Mahowald, N., Jickells, T. D., Baker, A. R., Artaxo, P., Benitez-Nelson, C. R., Bergametti, G., et al. (2008). Global distribution of atmospheric phosphorus sources, concentrations and deposition rates, and anthropogenic impacts. Global Biogeochem. Cycles 22. doi: 10.1029/2008GB003240
Malcolm, S., Nedwell, D., Devlin, M., Hanlon, A., Dare, S., Parker, R., et al. (2002). First Application of the OSPAR Comprehen-sive Procedure to Waters around England and Wales. Lowestoft: F.a.A. S. Centre for Environment.
Martin, C. L., Momtaz, S., Gaston, T., and Moltschaniwskyj, N. A. (2016). A systematic quantitative review of coastal and marine cultural ecosystem services: current status and future research. Mar. Policy 74, 25–32. doi: 10.1016/j.marpol.2016.09.004
McQuatters-Gollop, A., Gilbert, A. J., Mee, L. D., Vermaat, J. E., Artioli, Y., Humborg, C., et al. (2009). How well do ecosystem indicators communicate the effects of anthropogenic eutrophication? Estuar. Coast. Shelf Sci. 82, 583–596. doi: 10.1016/j.ecss.2009.02.017
McQuatters-Gollop, A., Guerin, L., Arroyo, N., Aubert, A., Artigas, L., Bedford, J., et al. (2022). Assessing the state of marine biodiversity in the Northeast Atlantic. Ecol. Indic. 141, 109148. doi: 10.1016/j.ecolind.2022.109148
McQuatters-Gollop, A., Mitchell, I., Vina-Herbon, C., Bedford, J., Addison, P. F., Lynam, C. P., et al. (2019). From science to evidence–how biodiversity indicators can be used for effective marine conservation policy and management. Front. Mar. Sci. 6, 109. doi: 10.3389/fmars.2019.00109
Millard, S. P. (2013). EnvStats: an R Package for Environmental Statistics. Springer Science & Business Media.
Nixon, S. W. (2009). Eutrophication and the macroscope. Hydrobiologia 629, 5–19. doi: 10.1007/s10750-009-9759-z
OSPAR (2002). Oslo Paris Convention for the Protection of the North Sea. Common Assessment Criteria their Assessment Levels and Area Classification within the Comprehensive Procedure of the Common Procedure. London: OSPAR Commission for the Protection of the Marine Environment of the North-East Atlantic.
OSPAR (2003a). “OSPAR integrated report 2003 on the eutrophication status of the OSPAR maritime area based upon the first application of the Comprehensive Procedure,” in OSPAR Eutrophication Series (London: OSPAR Commission).
OSPAR (2003b). OSPAR Integrated Report 2003 on the Eutrophication Status of the OSPAR Maritime Area Based Upon the First Application of the Comprehensive Procedure, No: 189. Available online at: https://www.ospar.org/documents?d=6962 (accessed November 18, 2023).
OSPAR (2005). Common Procedure for the Identification of the Eutrophication Status of the OSPAR Maritime Area. Agreement 2005-3. London: OSPAR Commission.
OSPAR (2008a). Towards the 50% reduction target for nutrients Assessment of Implementation of PARCOM Recommendations 88/2 and 89/4. ISBN 978-1-905859-49-8. London: OSPAR Commission.
OSPAR (2008b). Second OSPAR Integrated Report on the Eutrophication Status of the OSPAR Maritime Area, No: 372. Availble online at: https://www.ospar.org/documents?d=7107 (accessed November 18, 2023).
OSPAR (2017). Third Integrated Report on the Eutrophication Status of the OSPAR Maritime Area, No: 694. Availble online at: https://www.ospar.org/documents?d=37502 (accessed November 18, 2023).
OSPAR (2021). Strategy of the OSPAR Commission for the Protection of the Marine Environment of the North-East Atlantic 20301. Agreement 2021-01: North-East Atlantic Environment Strategy (replacing Agreement 2010-03). London: OSPAR Commission. Available online at: https://www.ospar.org/convention/strategy (accessed November 18, 2023).
OSPAR (2022). Revision of the Common Procedure for the Identification of the Eutrophication Status of the OSPAR Maritime Area. OSPAR Agreement 2022-07. London: OSPAR Commission. Available online at: https://www.ospar.org/documents?v=49366
Paerl, H. W. (2006). Assessing and managing nutrient-enhanced eutrophication in estuarine and coastal waters: interactive effects of human and climatic perturbations. Ecol. Eng. 26, 40–54. doi: 10.1016/j.ecoleng.2005.09.006
Paerl, H. W. (2009). Controlling eutrophication along the freshwater–marine continuum: dual nutrient (N and P) reductions are essential. Estuaries Coasts 32, 593–601. doi: 10.1007/s12237-009-9158-8
Paerl, H. W., Hall, N. S., Peierls, B. L., and Rossignol, K. L. (2014). Evolving paradigms and challenges in estuarine and coastal eutrophication dynamics in a culturally and climatically stressed world. Estuaries coasts 37, 243–258. doi: 10.1007/s12237-014-9773-x
Paerl, H. W., and Piehler, M. F. (2008). Nitrogen and marine eutrophication. Nitrogen Mar. Environ. 2, 529–567. doi: 10.1016/B978-0-12-372522-6.00011-6
Painting, S. J., Devlin, M. J., Rogers, S. I., Mills, D. K., Parker, E. R., and Rees, H. L. (2005). Assessing the suitability of OSPAR EcoQOs for eutrophication vs ICES criteria for England and Wales. Mar. Pollut. Bull. 50, 1569–1584. doi: 10.1016/j.marpolbul.2005.06.042
Petersen, W., Wehde, H., Krasemann, H., Colijn, F., and Schroeder, F. (2008). FerryBox and MERIS–assessment of coastal and shelf sea ecosystems by combining in situ and remotely sensed data. Estuar. Coast. Shelf Sci. 77, 296–307. doi: 10.1016/j.ecss.2007.09.023
Piehl, S., Friedland, R., Neumann, T., and Schernewski, G. (2023). Ocean models as shallow sea oxygen deficiency assessment tools: from research to practical application. Biogeosciences Discuss. 2023, 1–33. doi: 10.5194/bg-2023-152
Piroddi, C., Akoglu, E., Andonegi, E., Bentley, J. W., Celić, I., Coll, M., et al. (2021). Effects of nutrient management scenarios on marine food webs: a Pan-European Assessment in support of the Marine Strategy Framework Directive. Front. Mar. Sci. 8, 596797. doi: 10.3389/fmars.2021.596797
Porter, E. M., Bowman, W. D., Clark, C. M., Compton, J. E., Pardo, L. H., and Soong, J. L. (2013). Interactive effects of anthropogenic nitrogen enrichment and climate change on terrestrial and aquatic biodiversity. Biogeochemistry 114, 93–120. doi: 10.1007/s10533-012-9803-3
Prins, T., and Enserink, L. (2022). “Concentrations of Chlorophyll-a in the Greater North Sea, Celtic Seas and Bay of Biscay and Iberian Coast,” in OSPAR, 2023: The 2023 Quality Status Report for the North-East Atlantic. London: OSPAR Commission. Available online at: https://oap.ospar.org/en/ospar-assessments/quality-status-reports/qsr-2023/indicator-assessments/chl-a-concentrations/ (accessed November 18, 2023).
Raimonet, M., and Cloern, J. E. (2017). Estuary–ocean connectivity: fast physics, slow biology. Glob. Chang. Biol. 23, 2345–2357. doi: 10.1111/gcb.13546
Rees, S. E., Ashley, M., Cameron, A., Mullier, T., Ingle, C., Oates, J., et al. (2022). A marine natural capital asset and risk register—towards securing the benefits from marine systems and linked ecosystem services. J. Appl. Ecol. 59, 1098–1109. doi: 10.1111/1365-2664.14121
Reker, J., Murray, C., Gelabert, E. R., Abhold, K., Korpinen, S., Peterlin, M., et al. (2019). Marine Messages II: Navigating the Course towards Clean, Healthy and Productive Seas Through Implementation of an Ecosystem-Based Approach. EEA Topic Report. Luxembourg: European Environment Agency.
Riegman, R., Noordeloos, A. A., and Cadée, G. C. (1992). Phaeocystis blooms and eutrophication of the continental coastal zones of the North Sea. Mar. Biol. 112, 479–484. doi: 10.1007/BF00356293
Schoenmakere, M. D., Hoogeveen, Y., Gillabel, J., and Manshoven, S. (2018). The Circular Economy and the Bioeconomy: Partners in Sustainability. EEA Report (8/2018). Luxembourg: European Environment Agency.
Seitz, R. D., Dauer, D. M., Llansó, R. J., and Long, W. C. (2009). Broad-scale effects of hypoxia on benthic community structure in Chesapeake Bay, USA. J. Exp. Mar. Biol. Ecol. 381, S4–S12. doi: 10.1016/j.jembe.2009.07.004
Selman, M., and Greenhalgh, S. (2010). Eutrophication: sources and drivers of nutrient pollution. Renew. Resour. J. 26, 19–26. Available online at: http://www.rnrf.org
Sheaves, M., Baker, R., Nagelkerken, I., and Connolly, R. M. (2015). True value of estuarine and coastal nurseries for fish: incorporating complexity and dynamics. Estuaries Coasts 38, 401–414. doi: 10.1007/s12237-014-9846-x
Skjærseth, J. B. (2006). Protecting the North-East Atlantic: enhancing synergies by institutional interplay. Mar. Policy 30, 157–166. doi: 10.1016/j.marpol.2004.09.004
Skogen, M. D., Budgell, W. P., and Rey, F. (2007). Interannual variability in Nordic seas primary production. ICES J. Mar. Sci. 64, 889–898. doi: 10.1093/icesjms/fsm063
Skogen, M. D., Eilola, K., Hansen, J. L., Meier, H. M., Molchanov, M. S., and Ryabchenko, V. A. (2014). Eutrophication status of the North Sea, Skagerrak, Kattegat and the Baltic Sea in present and future climates: a model study. J. Mar. Syst. 132, 174–184. doi: 10.1016/j.jmarsys.2014.02.004
Smith, V. H., and Schindler, D. W. (2009). Eutrophication science: where do we go from here? Trends Ecol. Evol. 24, 201–207. doi: 10.1016/j.tree.2008.11.009
Stål, J., Paulsen, S., Pihl, L., Rönnbäck, P., Söderqvist, T., and Wennhage, H. (2008). Coastal habitat support to fish and fisheries in Sweden: integrating ecosystem functions into fisheries management. Ocean Coast. Manag. 51, 594–600. doi: 10.1016/j.ocecoaman.2008.06.006
Stegert, C., Lenhart, H.-J., Blauw, A., Friedland, R., Leujak, W., and Kerimoglu, O. (2021). Evaluating uncertainties in reconstructing the pre-eutrophic state of the North Sea. Front. Mar. Sci. 8, 637483. doi: 10.3389/fmars.2021.637483
Svendsen, L. M., and Gustafsson, B. (2020). “Waterborne nitrogen and phosphorus inputs and water flow to the Baltic Sea 1995-2018,” in HELCOM Baltic Sea Environmental Fact Sheet. Available online at: https://helcom.fi/media/documents/BSEFS-Waterborne-nitrogen-and-phosphorus-inputs-and-water-flow-to-the-Baltic-Sea.pdf (accessed November 5, 2020).
Tett, P., Gowen, R. J., Painting, S. J., Elliott, M., Forster, R., Mills, D. K., et al. (2013). Framework for understanding marine ecosystem health. Mar. Ecol. Prog. Ser. 494, 1–27. doi: 10.3354/meps10539
Thrush, S. F., Townsend, M., Hewitt, J. E., Davies, K., Lohrer, A. M., Lundquist, C., et al. (2013). “The many uses and values of estuarine ecosystems,” in Ecosystem services in New Zealand–Conditions and Trends, ed. J. R. Dymond (Lincoln: Manaaki Whenua Press), 226–237.
Ulén, B., Bechmann, M., Fölster, J., Jarvie, H., and Tunney, H. (2007). Agriculture as a phosphorus source for eutrophication in the north-west European countries, Norway, Sweden, United Kingdom and Ireland: a review. Soil Use Manag. 23, 5–15. doi: 10.1111/j.1475-2743.2007.00115.x
van Beusekom, J. E. (2018). “Eutrophication,” in Handbook on Marine Environment Protection: Science, Impacts and Sustainable Management, eds. M. Salomon, and T. Markus (Cham: Springer), 429–445. doi: 10.1007/978-3-319-60156-4_22
Van Beusekom, J. E., Carstensen, J., Dolch, T., Grage, A., Hofmeister, R., Lenhart, H., et al. (2019). Wadden Sea Eutrophication: long-term trends and regional differences. Front. Mar. Sci. 6, 370. doi: 10.3389/fmars.2019.00370
Van der Zande, D., Eleveld, M., Lavigne, H., Gohin, F., Pardo, S., Tilstone, G., et al. (2019). Joint Monitoring Programme of the EUtrophication of the NOrthSea with SATellite data user case. J. Oper. Oceanogr. 12, 56–61.
van Leeuwen, S. M., Lenhart, H., Prins, T., Blauw, A., Desmit, X., L, F., et al. (2023). Deriving pre-eutrophic conditions from an ensemble model approach for the North-West European seas. Front. Mar. Sci. 10, 1129951. doi: 10.3389/fmars.2023.1129951
Wassmann, P. (2004). Cultural Eutrophication: Perspectives and Prospects. Norway: University of Tromsø. Available online at: http://hdl.handle.net/10037/2389 (accessed November 18, 2023).
Keywords: OSPAR, eutrophication, assessment, North East Atlantic, nutrients
Citation: Devlin MJ, Prins TC, Enserink L, Leujak W, Heyden B, Axe PG, Ruiter H, Blauw A, Bresnan E, Collingridge K, Devreker D, Fernand L, Gómez Jakobsen FJ, Graves C, Lefebvre A, Lenhart H, Markager S, Nogueira M, O'Donnell G, Parner H, Skarbøvik E, Skogen MD, Sonesten L, Van Leeuwen SM, Wilkes R, Dening E and Iglesias-Campos A (2023) A first ecological coherent assessment of eutrophication across the North-East Atlantic waters (2015–2020). Front. Ocean Sustain. 1:1253923. doi: 10.3389/focsu.2023.1253923
Received: 06 July 2023; Accepted: 30 October 2023;
Published: 18 December 2023.
Edited by:
Enrico Saggioro, Fundação Oswaldo Cruz (Fiocruz), BrazilReviewed by:
Carlos German Massone, Pontifical Catholic University of Rio de Janeiro, BrazilKeith Weston, Independent Researcher, Norwich, United Kingdom
Copyright © 2023 Devlin, Prins, Enserink, Leujak, Heyden, Axe, Ruiter, Blauw, Bresnan, Collingridge, Devreker, Fernand, Gómez Jakobsen, Graves, Lefebvre, Lenhart, Markager, Nogueira, O'Donnell, Parner, Skarbøvik, Skogen, Sonesten, Van Leeuwen, Wilkes, Dening and Iglesias-Campos. This is an open-access article distributed under the terms of the Creative Commons Attribution License (CC BY). The use, distribution or reproduction in other forums is permitted, provided the original author(s) and the copyright owner(s) are credited and that the original publication in this journal is cited, in accordance with accepted academic practice. No use, distribution or reproduction is permitted which does not comply with these terms.
*Correspondence: Michelle J. Devlin, bWljaGVsbGUuZGV2bGluQGNlZmFzLmdvdi51aw==