 Long Chen1,2
 Qingtao Kong
- 1Key Laboratory of Adolescent Health Assessment and Exercise Intervention of Ministry of Education, East China Normal University, Shanghai, China
- 2School of Physical Education and Health, East China Normal University, Shanghai, China
- 3School of Physical Education and Sport Science, Fujian Normal University, Fuzhou, China
- 4Department of Physical Education, Shanghai Ocean University, Shanghai, China
Background: Adolescent psychosocial symptoms continue to rise, negatively affecting academic performance and future achievement, and have become an important public health issue of common concern worldwide. However, few studies have been conducted on the association between body roundness index (BRI) and sugar-sweetened beverage (SSB) consumption and psychological symptoms in Chinese adolescents. The present study may provide implications for the intervention and prevention of psychological symptoms in Chinese adolescents.
Methods: In this study, 47,520 adolescents aged 12–18 years from six geographic regions of China were assessed cross-sectionally for BRI, SSB consumption, and psychological symptoms in 2023. Independent samples t-tests, chi-square tests, logistic regression analyses, and ordered logistic regression analyses were used to compare and analyze the associations that existed between BRI and SSB consumption and psychological symptoms among Chinese adolescents.
Results: The BRI of Chinese adolescents aged 12–18 years was (2.03 ± 0.94). The proportions of adolescents with SSB consumption ≤1 times/week, 2–3 times/week, and ≥ 4 times/week were 33.2, 52.0, and 14.7%, respectively, and the differences were statistically significant in comparison (X2 value of 597.860, p < 0.001). The prevalence of psychological symptoms among Chinese adolescents was 19.2%. The prevalence rates of emotional problems, behavioral problems, and social adjustment difficulties were 26.1, 25.2, and 16.1%, respectively. After adjusting for relevant covariates, ordered logistic regression analysis showed that with BRI quartiles Q1 and SSB consumption ≤1 times/week as the reference group, the adolescents in the group with BRI quartiles of Q4 and SSB consumption ≥4 times/week (OR = 2.01, 95% CI: 1.77–2.30) had the highest risk of developing psychological symptoms (p < 0.001).
Conclusion: There is an association between BRI and SSB consumption with psychological symptoms in Chinese adolescents. Chinese adolescents with higher BRI and SSB consumption were at higher risk of developing psychological symptoms. In the future, the increase in BRI and SSB consumption should be effectively controlled to prevent or reduce the occurrence of psychological symptoms.
1 Introduction
In recent years, the prevalence of psychological symptoms among adolescents has continued to rise, with serious negative impacts on academic, social, and future achievements, and has become a common mental health problem in countries around the world (1). Studies show that the global prevalence of depressive symptoms among adolescents aged 10–19 years is 34% and that the prevalence of depressive symptoms among adolescents has risen from 24% in 2001 to 37% in 2020, and continues to show an increasing trend (2). It has also been observed that the prevalence of major depressive disorder among adolescents in the Americas increased from 8.7% in 2005 to 11.3% in 2014, and continues to show an increasing trend, posing a serious disease burden on American society (3). There are also studies confirming that the prevalence of psychological symptoms among Finnish adolescents is 31% and continues to increase, negatively affecting adolescent mental health development and academic performance, as well as posing a potential threat to adult mental health (4). Similarly, the problem of adolescent psychosomatic symptoms is spreading to developing countries. A survey of adolescents aged 14–17 years in Uganda, an African country, showed that 16.35% of adolescents reported major depressive symptoms, and almost one out of three girls interviewed (29.68%) reported moderate depressive symptoms, posing a serious threat to adolescent health development (5). China, also a developing country, is no exception. A survey of Chinese adolescents between the ages of 13–18 showed that 21.4% of Chinese adolescents had psychological symptoms, and called for targeted interventions against the influencing factors to reduce the incidence of psychological symptoms among adolescents (6). It was also found that the prevalence of major depressive symptoms among Chinese adolescents was 1.3%, which was equivalent to the world average, and called for the necessary measures to be taken to intervene and prevent it (7). The prevalence of adolescent psychological symptoms is increasing, posing a threat to adolescent health and future achievement. For this reason, it is important to investigate and study the various factors affecting adolescent psychosocial symptoms to prevent and intervene in a better way.
Adolescent psychological symptoms are influenced by a relatively large number of factors, but they are mainly closely associated with lifestyle and eating behavioral habits. With dramatic lifestyle changes, adolescents’ physical activity levels continue to decline, and static behavioral time and screen time continue to increase, posing a serious threat to adolescent mental health (8–10). Investigations have shown that obese adolescents have a higher risk of developing psychological symptoms compared to normal-weight individuals (11–13). In addition, there are some differences in the results for different indicators for evaluating adolescent obesity. Studies have shown that BRI, as an indicator different from conventional BMI or waist circumference, has high accuracy in identifying adolescent psychological symptoms and continues to gain attention from researchers (14). Studies have shown that the BRI better combines the effects of height and waist circumference to more accurately assess adolescents’ body composition and psychological symptoms compared to BMI and waist circumference metrics (15). However, a review of the literature shows that fewer studies have been conducted on the association between BRI and psychological symptoms in Chinese adolescents. Some of these studies focused on older adults, and the sample selection was limited, which could not fully confirm the association between BRI and psychological symptoms (16).
According to surveys, SSB consumption among adolescents is continuing to rise, with serious negative impacts on adolescent health (17). Studies have shown a strong association between increased SSB consumption and the development of various chronic diseases such as obesity, type 2 diabetes, cardiovascular disease, hypertension, and others (18–20). At the same time, increased SSB consumption can lead to a higher incidence of dental caries in adolescents (21). Some studies have also found an association between increased SSB consumption and the development of psychological symptoms in adolescents (10). A post-survey of Norwegian adolescents showed that increased SSB consumption in adolescents (OR = 1.49) had a significant influence on elevated psychological symptoms (22). A survey of Chinese adolescents also showed that adolescents with higher weekly SSB consumption (≥ 6 times/week) (OR = 3.06) had a significantly higher risk of psychological symptoms compared to those with lower SSB consumption (≤ 1 time/week) (23). This shows that it is necessary to intervene in the prevention of adolescent psychological symptoms by starting with the influencing factors, such as lowering SSB consumption and lowering body weight, to better prevent the occurrence of psychological symptoms.
Adolescence is the peak period of youthful development, a period of extreme psychological instability (24). Synthesizing previous relevant studies, it can be found that in the past, the effects of body composition, such as BMI and waist circumference, on psychological symptoms were mainly analyzed from a single perspective. BRI, as a new type of index for evaluating body composition, has been less studied about adolescents’ psychological symptoms (25). As a developing country, the prevalence of psychological symptoms among adolescents continues to increase, and there is a need to draw sufficient attention to this issue (26). In addition, to the best of our knowledge, no current studies have been found on the association between BRI and SSB consumption and psychological symptoms in Chinese adolescents. For this reason, the present study assessed BRI, SSB consumption, and psychological symptoms in 47,520 adolescents aged 12–18 years from six geographic regions in China. The associations between BRI and SSB consumption and psychological symptoms were analyzed. The aim is to provide reference and reference for the intervention and prevention of psychological symptoms in Chinese adolescents.
2 Methods
2.1 Participants
In this study, 47,520 adolescents aged 12–18 years were assessed cross-sectionally for BRI, SSB consumption, and psychological symptoms from March to July 2023 in one province and city selected from each of the six geographic regions of China. Participants in this study were extracted in four stages. In the first stage, the provinces and municipalities in the six geographic regions of China selected for this study were Shanxi in North China, Heilongjiang in Northeast China, Shanghai in East China, Hunan in South Central China, Chongqing in Southwest China, and Xinjiang in Northwest China. In the second stage, eight secondary schools were randomly selected in each of the identified provinces and cities, respectively. In the third stage, in each secondary school, four teaching classes were randomly selected in whole clusters per grade level. In the fourth stage, students in the classes who met the inclusion conditions of this study were assessed as participants. The inclusion criteria for participants in this study were: middle and high school students enrolled in school, between the ages of 12–18 years old, who gave informed consent and volunteered to be assessed in this study. In this study, 48,967 middle school students aged 12–18 years old in 1152 classes were finally assessed, and after excluding 1,447 invalid questionnaires after the assessment, 47,520 valid data were finally returned, with an effective return rate of 97.04%. The participant extraction process of this study is shown in Figure 1.
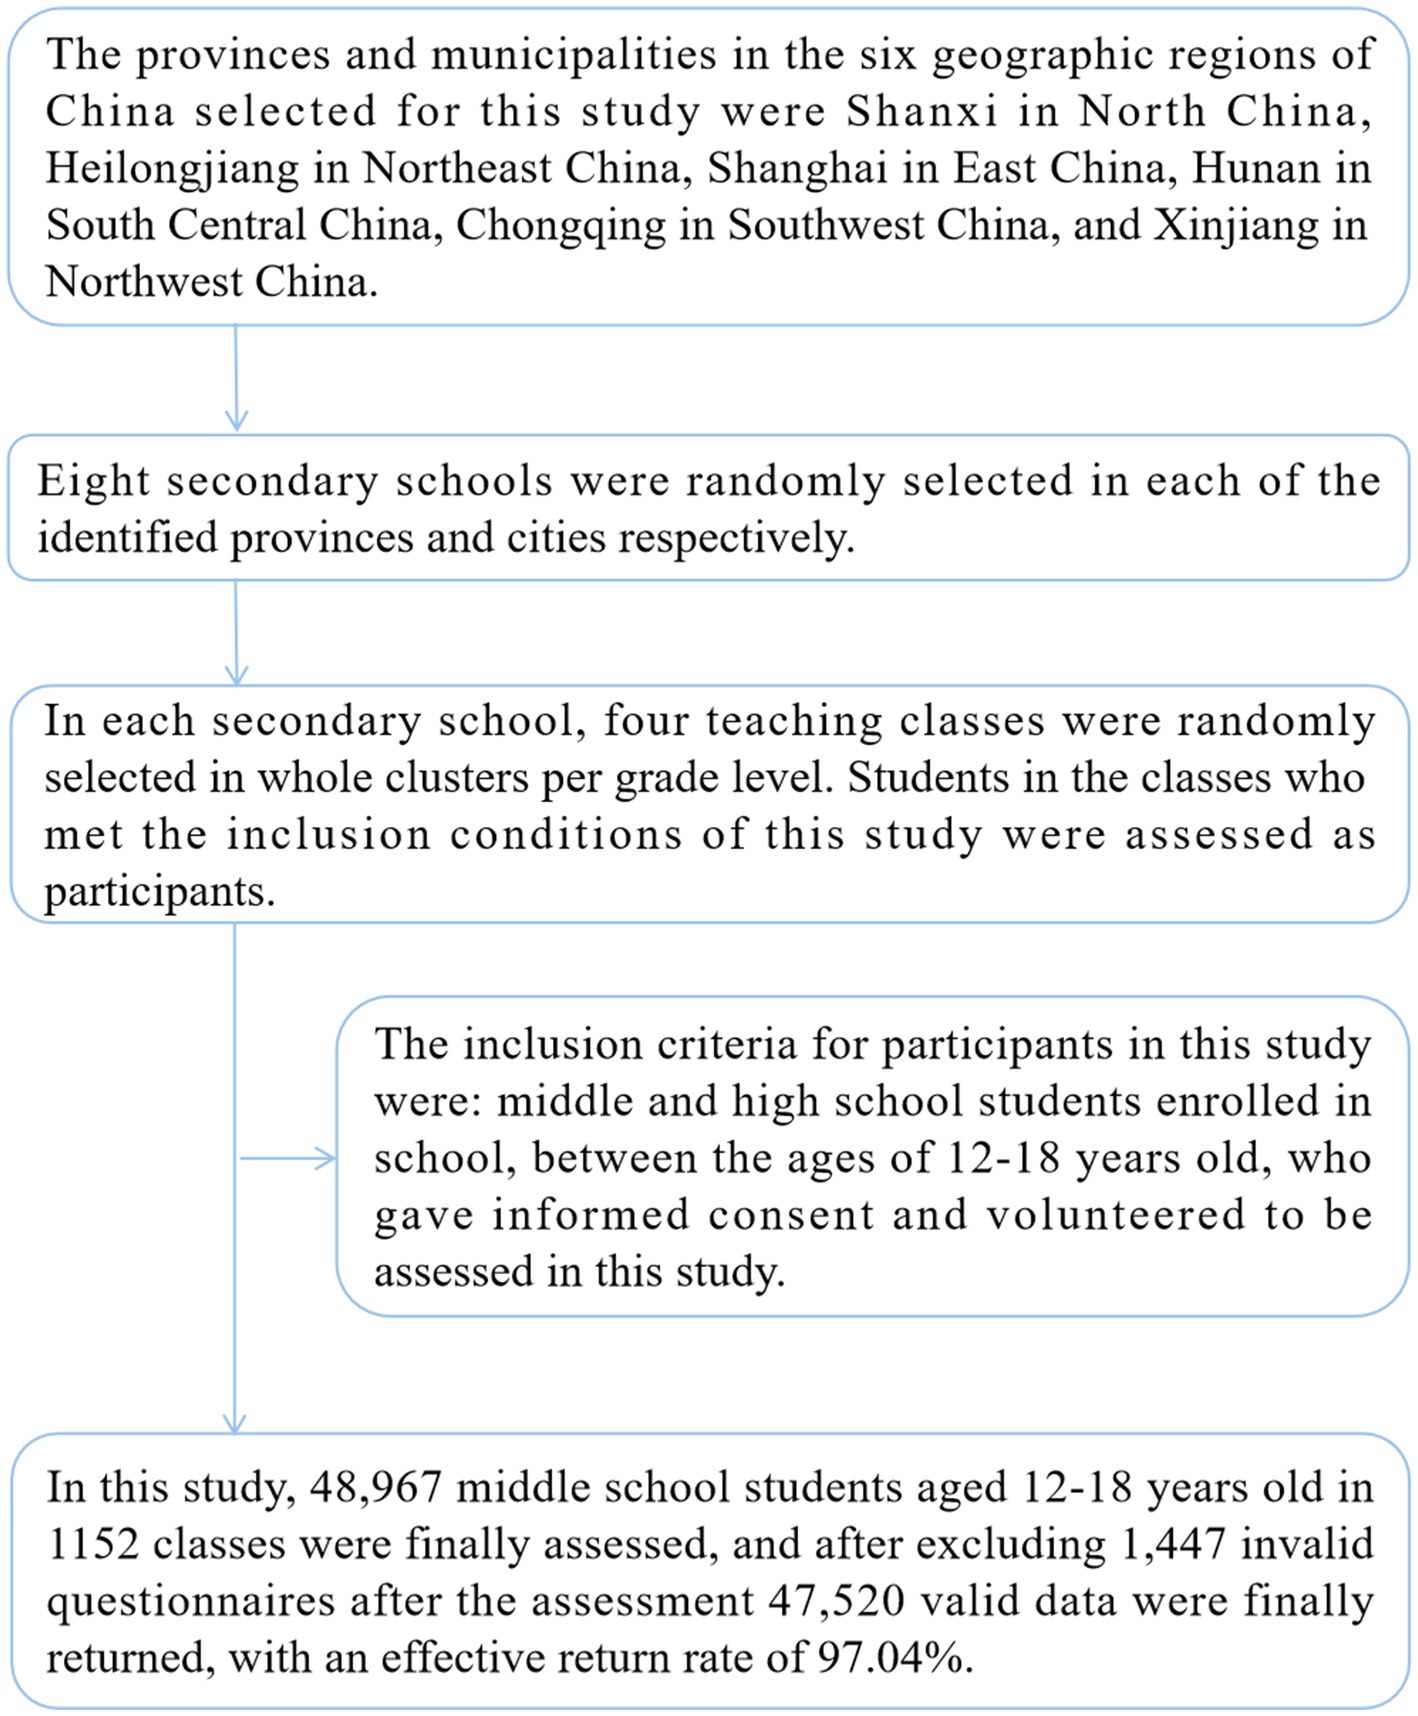
Figure 1. Sampling flow of Chinese adolescent participants.
This study was conducted by the Declaration of Helsinki. This study was approved by the Ethics Committee of Shanghai Ocean University (R8976436).
2.2 Psychological symptoms
In this study, psychological symptoms were assessed using the Brief Instrument on Psychological Health of Youths (BIOPHY) questionnaire (27). The BIOPHY consists of 15 entries categorized into 3 dimensions, namely, emotional problems, behavioral problems, and social adjustment difficulties. The scores for the three dimensions were summed to obtain a score for the psychological symptoms dimension. Each of the 15 entries was scored on a scale of 1–6 and recorded as a 1–6 score. The scores were “lasted 3 months and more,” “lasted 2 months,” “lasted 1 month,” “lasted 2 weeks,” “lasted 1 week,” and “lasted less than 1 week or none.” The higher the participant’s score the shorter the surface duration of the symptom, i.e., the shorter the duration of the psychological symptoms. Psychological symptoms were defined as present when participants’ symptoms lasted ≥1 month. Each of the 3-dimensional scores used P90 as a cutoff point for adolescent psychological symptoms problems, with <P90 defined as psychological symptoms and ≥ P90 defined as the absence of psychological symptoms. The BIOPHY has been used in several studies, and it can better evaluate the psychological symptoms of Chinese adolescents, with good reliability and validity. The Cronbach’s alpha coefficient for the total questionnaire of BIOPHY was 0.928, and the split-half coefficient was 0.909, indicating that the questionnaire had high internal consistency (28, 29).
2.3 Body roundness index (BRI)
The specific value of the BRI was based on the assessment of the participants’ waist circumference and height, which was then calculated by a formula. The specific BRI calculation formula is: BRI = 364.2–365.5*(1-[WC (m)/2π]2/[0.5*height (m)]2)½ (30). Participants’ waist circumference and height were assessed according to the testing instruments and methods required by the China National Survey on Students’ Constitution and Health (CNSSCH) (31). The results of both the waist circumference and height tests were accurate to 0.1 centimeters. Participants were asked to wear as light clothing as possible during the waist circumference assessment to minimize the error in the assessment. For height assessment, participants were asked to remove their shoes to ensure the accuracy of the test results (31).
2.4 Sugar-sweetened beverage (SSB)
Participants’ SSB consumption in this study was assessed using the frequency of weekly consumption as a criterion, categorized as ≤1 time/week, 2–3 times/week, and ≥ 4 times/week. SSB consumption was assessed using the beverage intake questionnaire (BEVQ-15) scale was used to assess SSB consumption (32). The BEVQ-15 scale consists of 15 entries, which mainly assesses participants’ SSB consumption in the past 30 days, including the frequency of SSB consumption, the number of milliliters, and the type of SSB. The BEVQ-15 scale has been widely used among Chinese adolescents, and it has good reliability and validity in assessing Chinese adolescents’ SSB consumption (28, 33). The types of SSBs in the BEVQ-15 scale include carbonated beverages, functional beverages, coffee, nut-based beverages, beverages with added sugar, unsweetened beverages, beer, wine, sweetened milk, all types of milk tea, and all types of beverages with added sugar that are not covered. Participants were asked to complete the questionnaire honestly based on their actual SSB consumption in the past 30 days. The frequency of SSB consumption was categorized as “<1 time per week” to “3 or more times per day” in the BEVQ-15 scale. The number of milliliters of SSB consumption was divided into five categories, ranging from “less than 6 ounces” to “20 ounces or more.” The SSB consumption was finally calculated based on the participants’ actual consumption by using the following formula (34). In this study, to facilitate the assessment of adolescent SSB consumption, the frequency of SSB consumption in the past 7 days was assessed using “8 ounces (1 cup)” as the assessment criterion, and participants were categorized as ≤1 times/week, 2–3 times/week, ≥4 times/week, and ≥ 3 times/week.
2.5 Covariates
Several past studies have shown that factors such as parental education, commuting to and from work, hours of sleep, physical activity, physical obesity, and muscle strength all have an impact on adolescent mental health (35–38). Based on previous studies, some covariates were included in the analysis in conjunction with this study. The covariates in this study include the father’s education、mother’s education, mode of commuting to and from school, sleep duration, MVPA, BMI, grip strength. Father’s education and mother’s education are divided into elementary school and below, middle school, high school, college and above. The mode of commuting to and from school is divided into active mode and negative mode. Active mode includes walking and bicycling; Negative mode includes taking the bus, taking the subway, private car transportation, and riding a battery-operated vehicle (31). Sleep duration is calculated based on the time of going to sleep and the time of waking up, and is classified as <7 h/day, 7–9 h/day, >9 h/day according to the relevant classification criteria (39). The MVPA is based on the assessment questionnaire in the CNSSCH (31). Calculations were primarily based on the duration and frequency of participants’ MVPA participation over the past 7 days, including Monday through Friday weekdays and Saturday and Sunday hours. In this study, MVPA was categorized as <30 min/day, 30–60 min/day, and > 60 min/day (31). The assessment of height, weight, waist circumference, and grip strength in this study was performed according to the methods and instruments required in the CNSSCH (31). BMI was calculated as weight (kg)/height (m)2.
2.6 Statistical analysis
Continuous variables in this study were expressed as mean and standard deviation (M ± SD). Categorical variables were expressed as percentages. Comparison of continuous type variables between boys and girls in this study was done using a t-test and categorical variables were compared using chi-square test. Different BRI types (Q1, Q2, Q3, Q4) and SSB consumption (≤1 times/week, 2–3 times/week, ≥4 times/week) psychological symptoms and dimensions (emotional problems, behavioral problems, and social adjustment difficulties) were compared using the chi-square test. In this study, Logistic regression analysis and ordered Logistic regression analysis were used to analyze the association between BRI and SSB consumption with psychological symptoms in adolescents. In Logistic regression analysis, the presence of psychological symptoms was used as the dependent variable, and BRI type and SSB consumption were used as the independent variables. Logistic regression analyses controlled for some of the covariates to account for covariance with BRI and SSB consumption. Model 1 is coarse. Model 2 adjusted age, father’s education, and mother’s education, based on Model 1. Model 3 adjusts the mode of commuting to and from school, sleep duration, and MVPA based on Model 2. In ordered Logistic regression analysis, the analytical model was adjusted age, father’s education, mother’s education, mode of commuting to and from school, sleep duration, and MVPA. Data analysis in this study was processed by SPSS25.0 software. p < 0.05 was used as the bilateral test level.
3 Results
This study assessed BRI and SSB consumption and psychological symptoms in 47,520 secondary school students aged 12–18 years in six geographic regions of China. The mean age of the participants was (15.12 ± 1.88) years.
Table 1 shows the basic situation of Chinese adolescents aged 12–18 years. The BRI of the participants was (2.03 ± 0.94). Boys’ (2.14 ± 1.02) BRI was higher than girls’ (1.93 ± 0.85), and the difference was statistically significant (t = 23.922, p < 0.001). The adolescents with SSB consumption ≤1 times/week, 2–3 times/week, and ≥ 4 times/week in this study were 33.2, 52.0, and 14.7%, respectively, and the difference was statistically significant compared to each other (χ2 value of 597.860, p < 0.001). The results of this study showed that the prevalence of psychological symptoms among Chinese adolescents was 19.2%. Among them, boys (19.8%) were higher than girls (18.5%), and the difference was statistically significant (χ2 value was 11.991, p < 0.01). The prevalence rates of emotional problems, behavioral problems, and social adjustment difficulties among Chinese adolescents were 26.1, 25.2, and 16.1%, respectively.
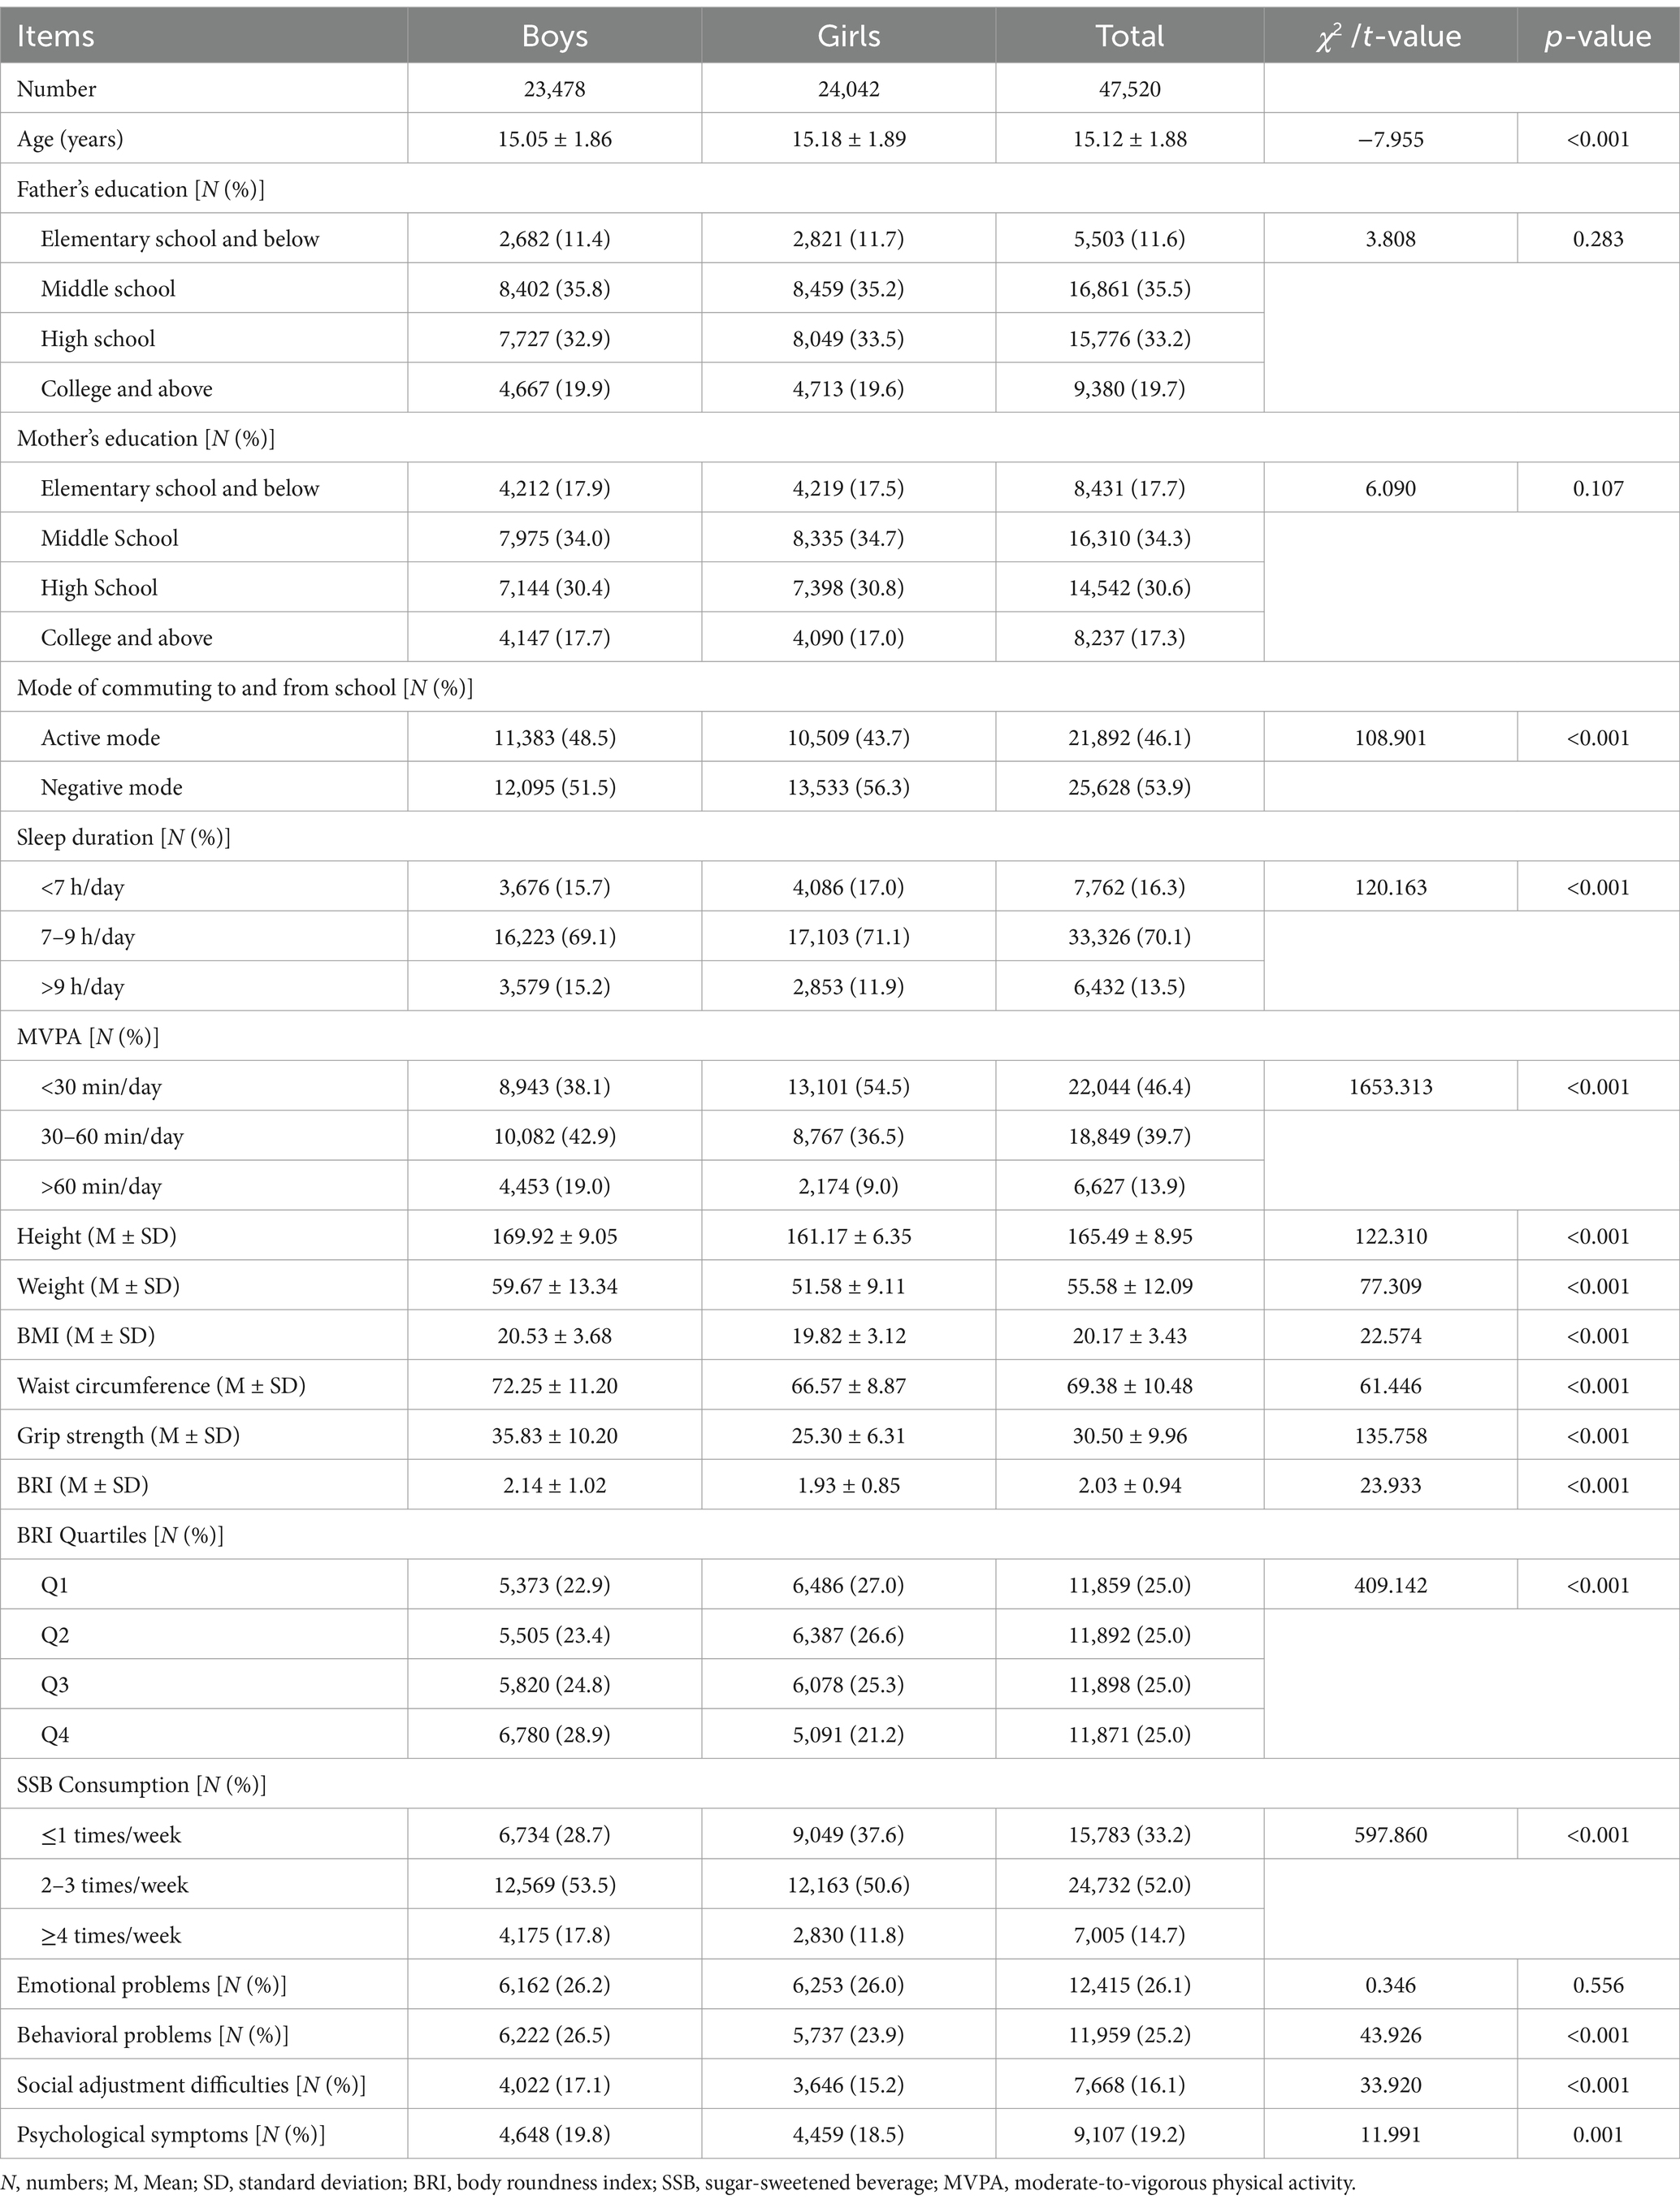
Table 1. Basic situation of adolescents aged 12–18 in China.
Table 2 shows the comparison of psychological symptoms among Chinese adolescents with different BRI and SSB consumption. Overall, when comparing the prevalence of emotional problems, behavioral problems, social adjustment difficulties, and psychological symptoms among Chinese adolescents with different BRI quartiles, all differences were statistically significant (χ2-value 52,416, 65,294, 38,008, respectively). Chinese adolescents with SSB consumption ≤1 times/week, 2–3 times/week, and ≥ 4 times/week had similar prevalence rates of emotional problems, behavioral problems, and social adjustment difficulties, psychological symptoms, the differences were all statistically significant (χ2-value 165.368, 168.343, 175.329, 183.676, p-value <0.001). Overall, it can be seen that BRI quartiles for adolescents in group Q4 had a higher prevalence of psychological symptoms and all three dimensions than adolescents in group Q1. The prevalence of psychological symptoms and the three dimensions was higher in the SSB consumption ≥4 times/week group than in the ≤1 times/week group. The same trend was found in both male and female Chinese adolescents.
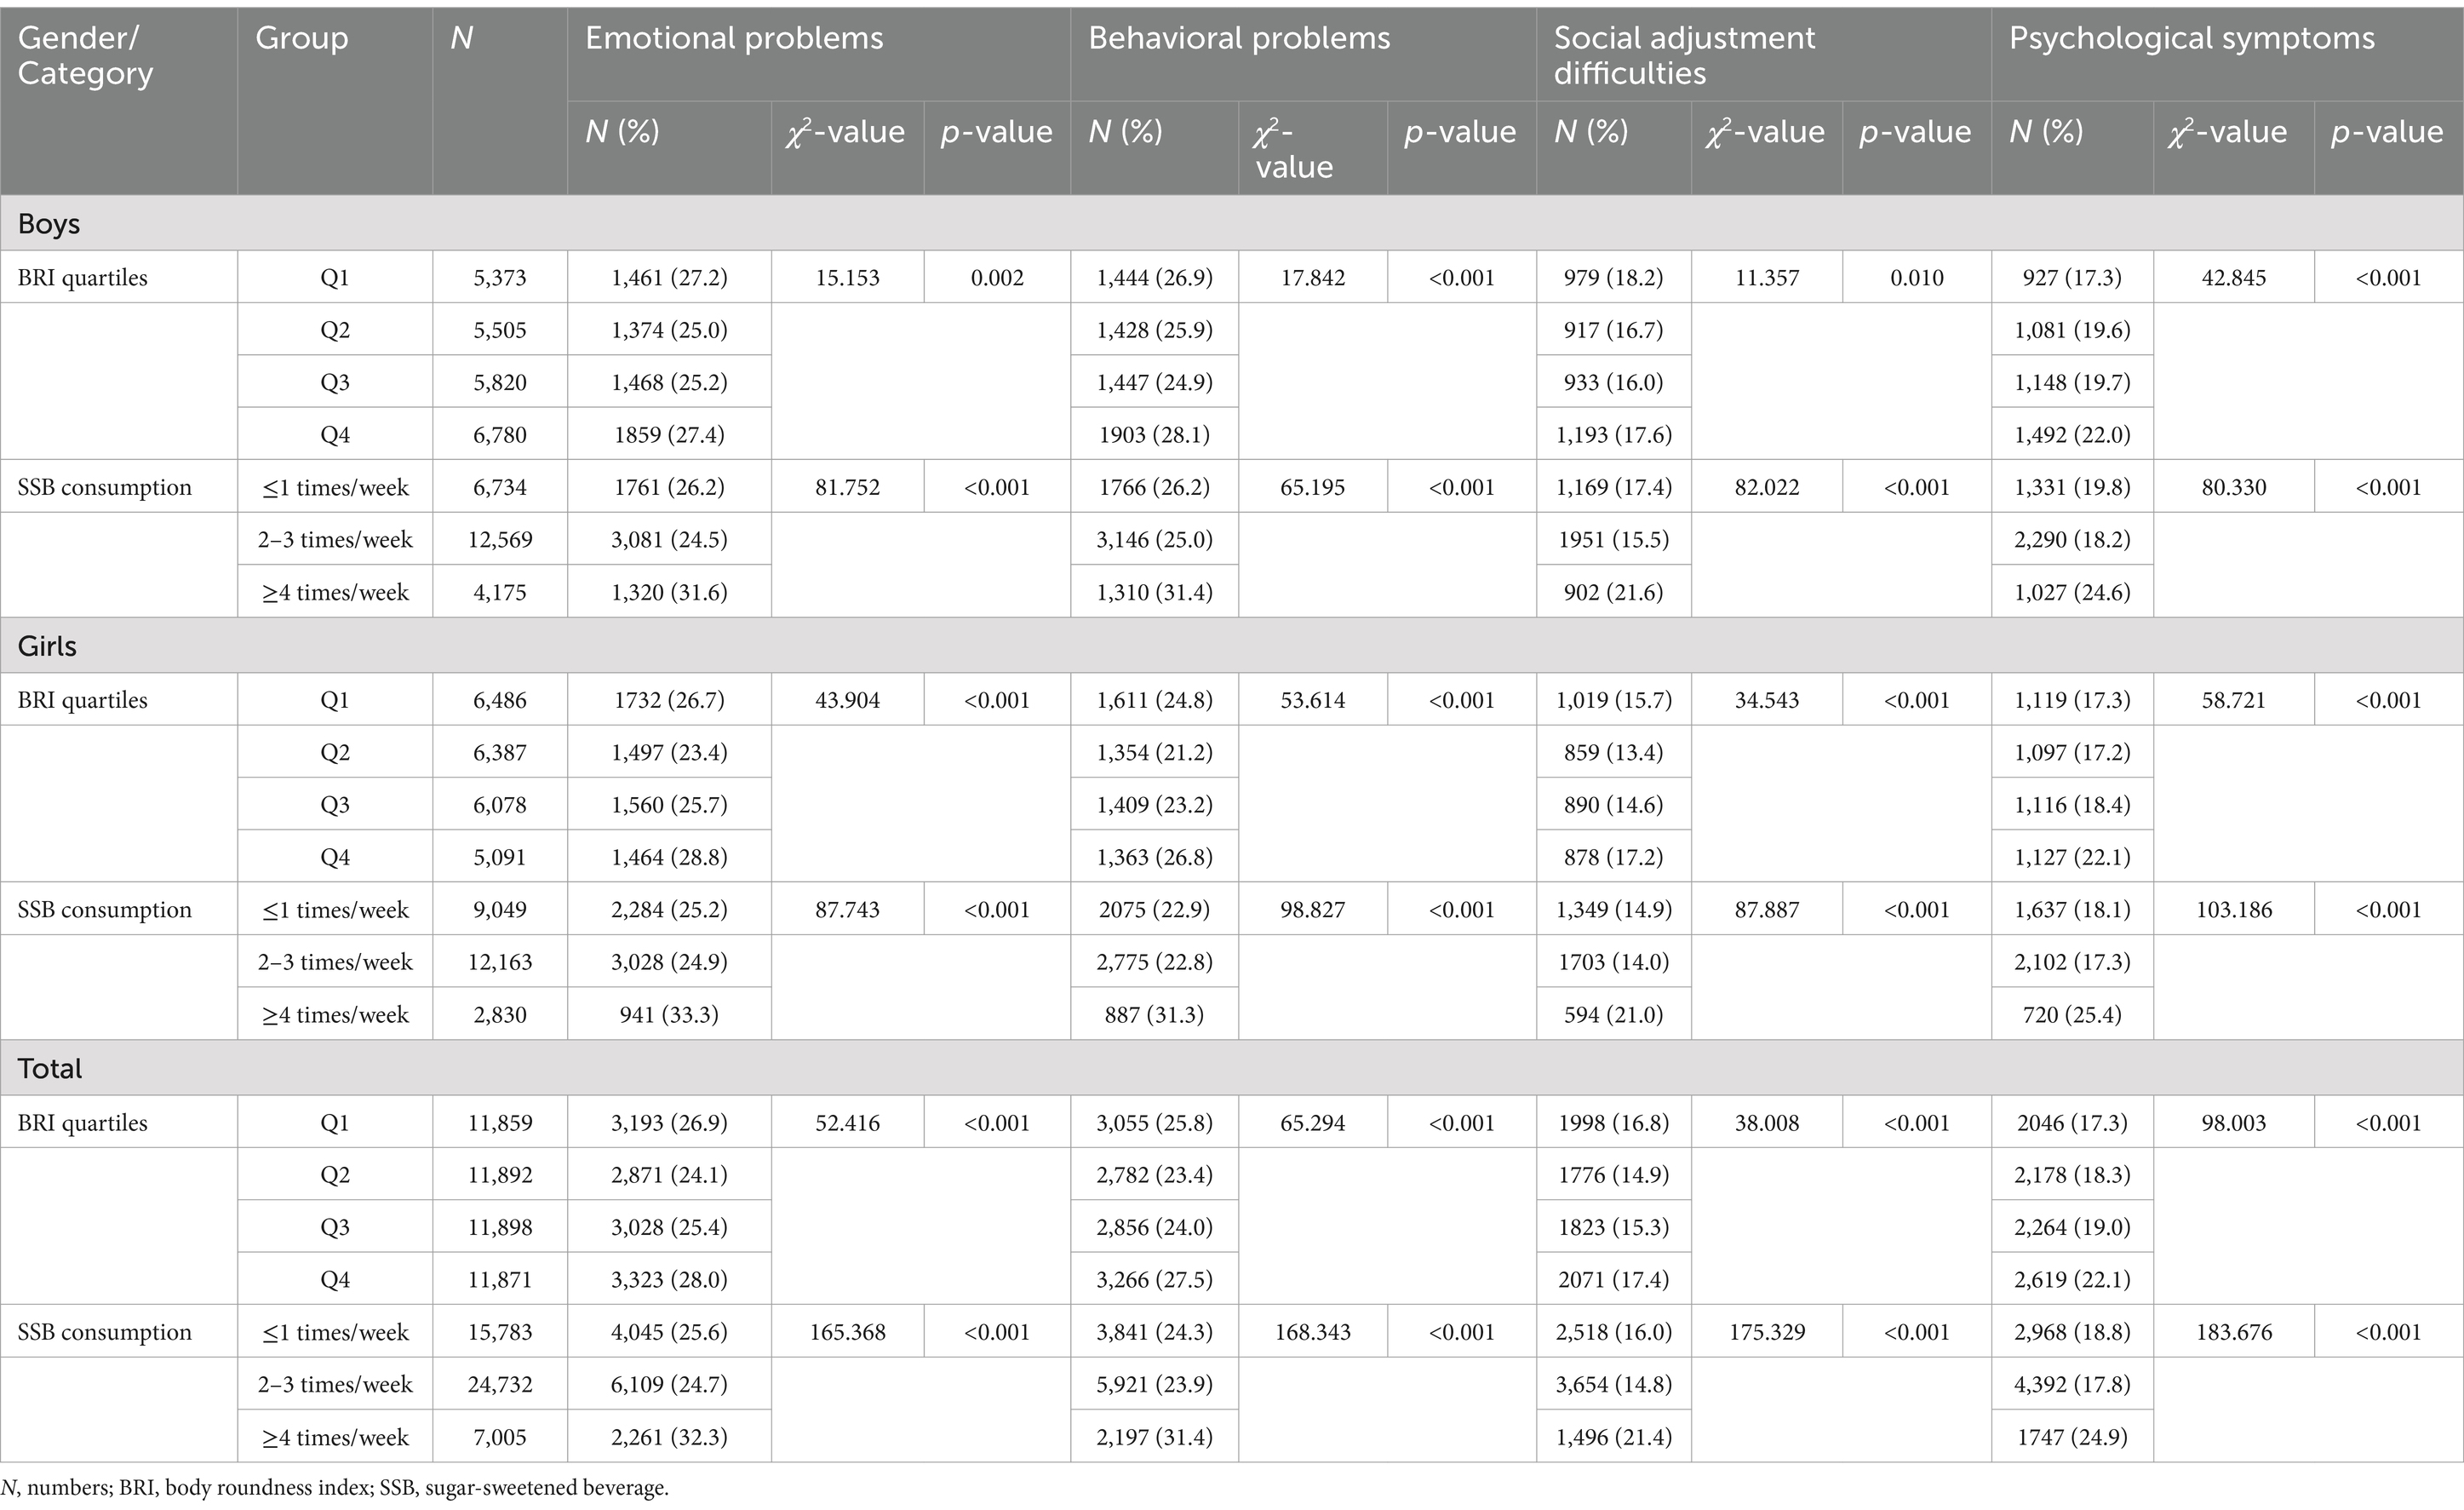
Table 2. Comparison of psychological symptoms among adolescents with different BRI and SSB consumption in China.
Table 3 shows the logistic regression analysis of adolescents’ psychological symptoms with different BRI and SSB consumption. Binary logistic regression analyses were conducted with the presence of psychological symptoms in Chinese adolescents as the dependent variable and BRI and SSB consumption as the independent variables. Model 1 is coarse. Model 2 adjusted age, father’s education, and mother’s education, based on Model 1. Model 3 adjusts the mode of commuting to and from school, sleep duration, and MVPA based on Model 2. The analysis showed that overall, after adjusting for relevant covariates, the risk of psychological symptoms was significantly higher in adolescents in Q3 (OR = 1.14, 95% CI: 1.06–1.22) and Q4 (OR = 1.36, 95% CI: 1.27–1.45) groups, using the Q1 group of BRI quartiles as the reference group (p < 0.001). Using the SSB consumption ≤1 times/week group as the reference group, adolescents in the ≥4 times/week group (OR = 1.32, 95% CI: 1.22 ~ 1.42) also had a significantly higher risk of developing psychological symptoms (p < 0.001). Notably, compared with the SSB consumption ≤1 times/week group, adolescents in the Chinese adolescents with SSB consumption 2–3 times/week group (OR = 0.91, 95%CI: 0.86 ~ 0.96) had a lower risk of developing psychological symptoms (p < 0.001).
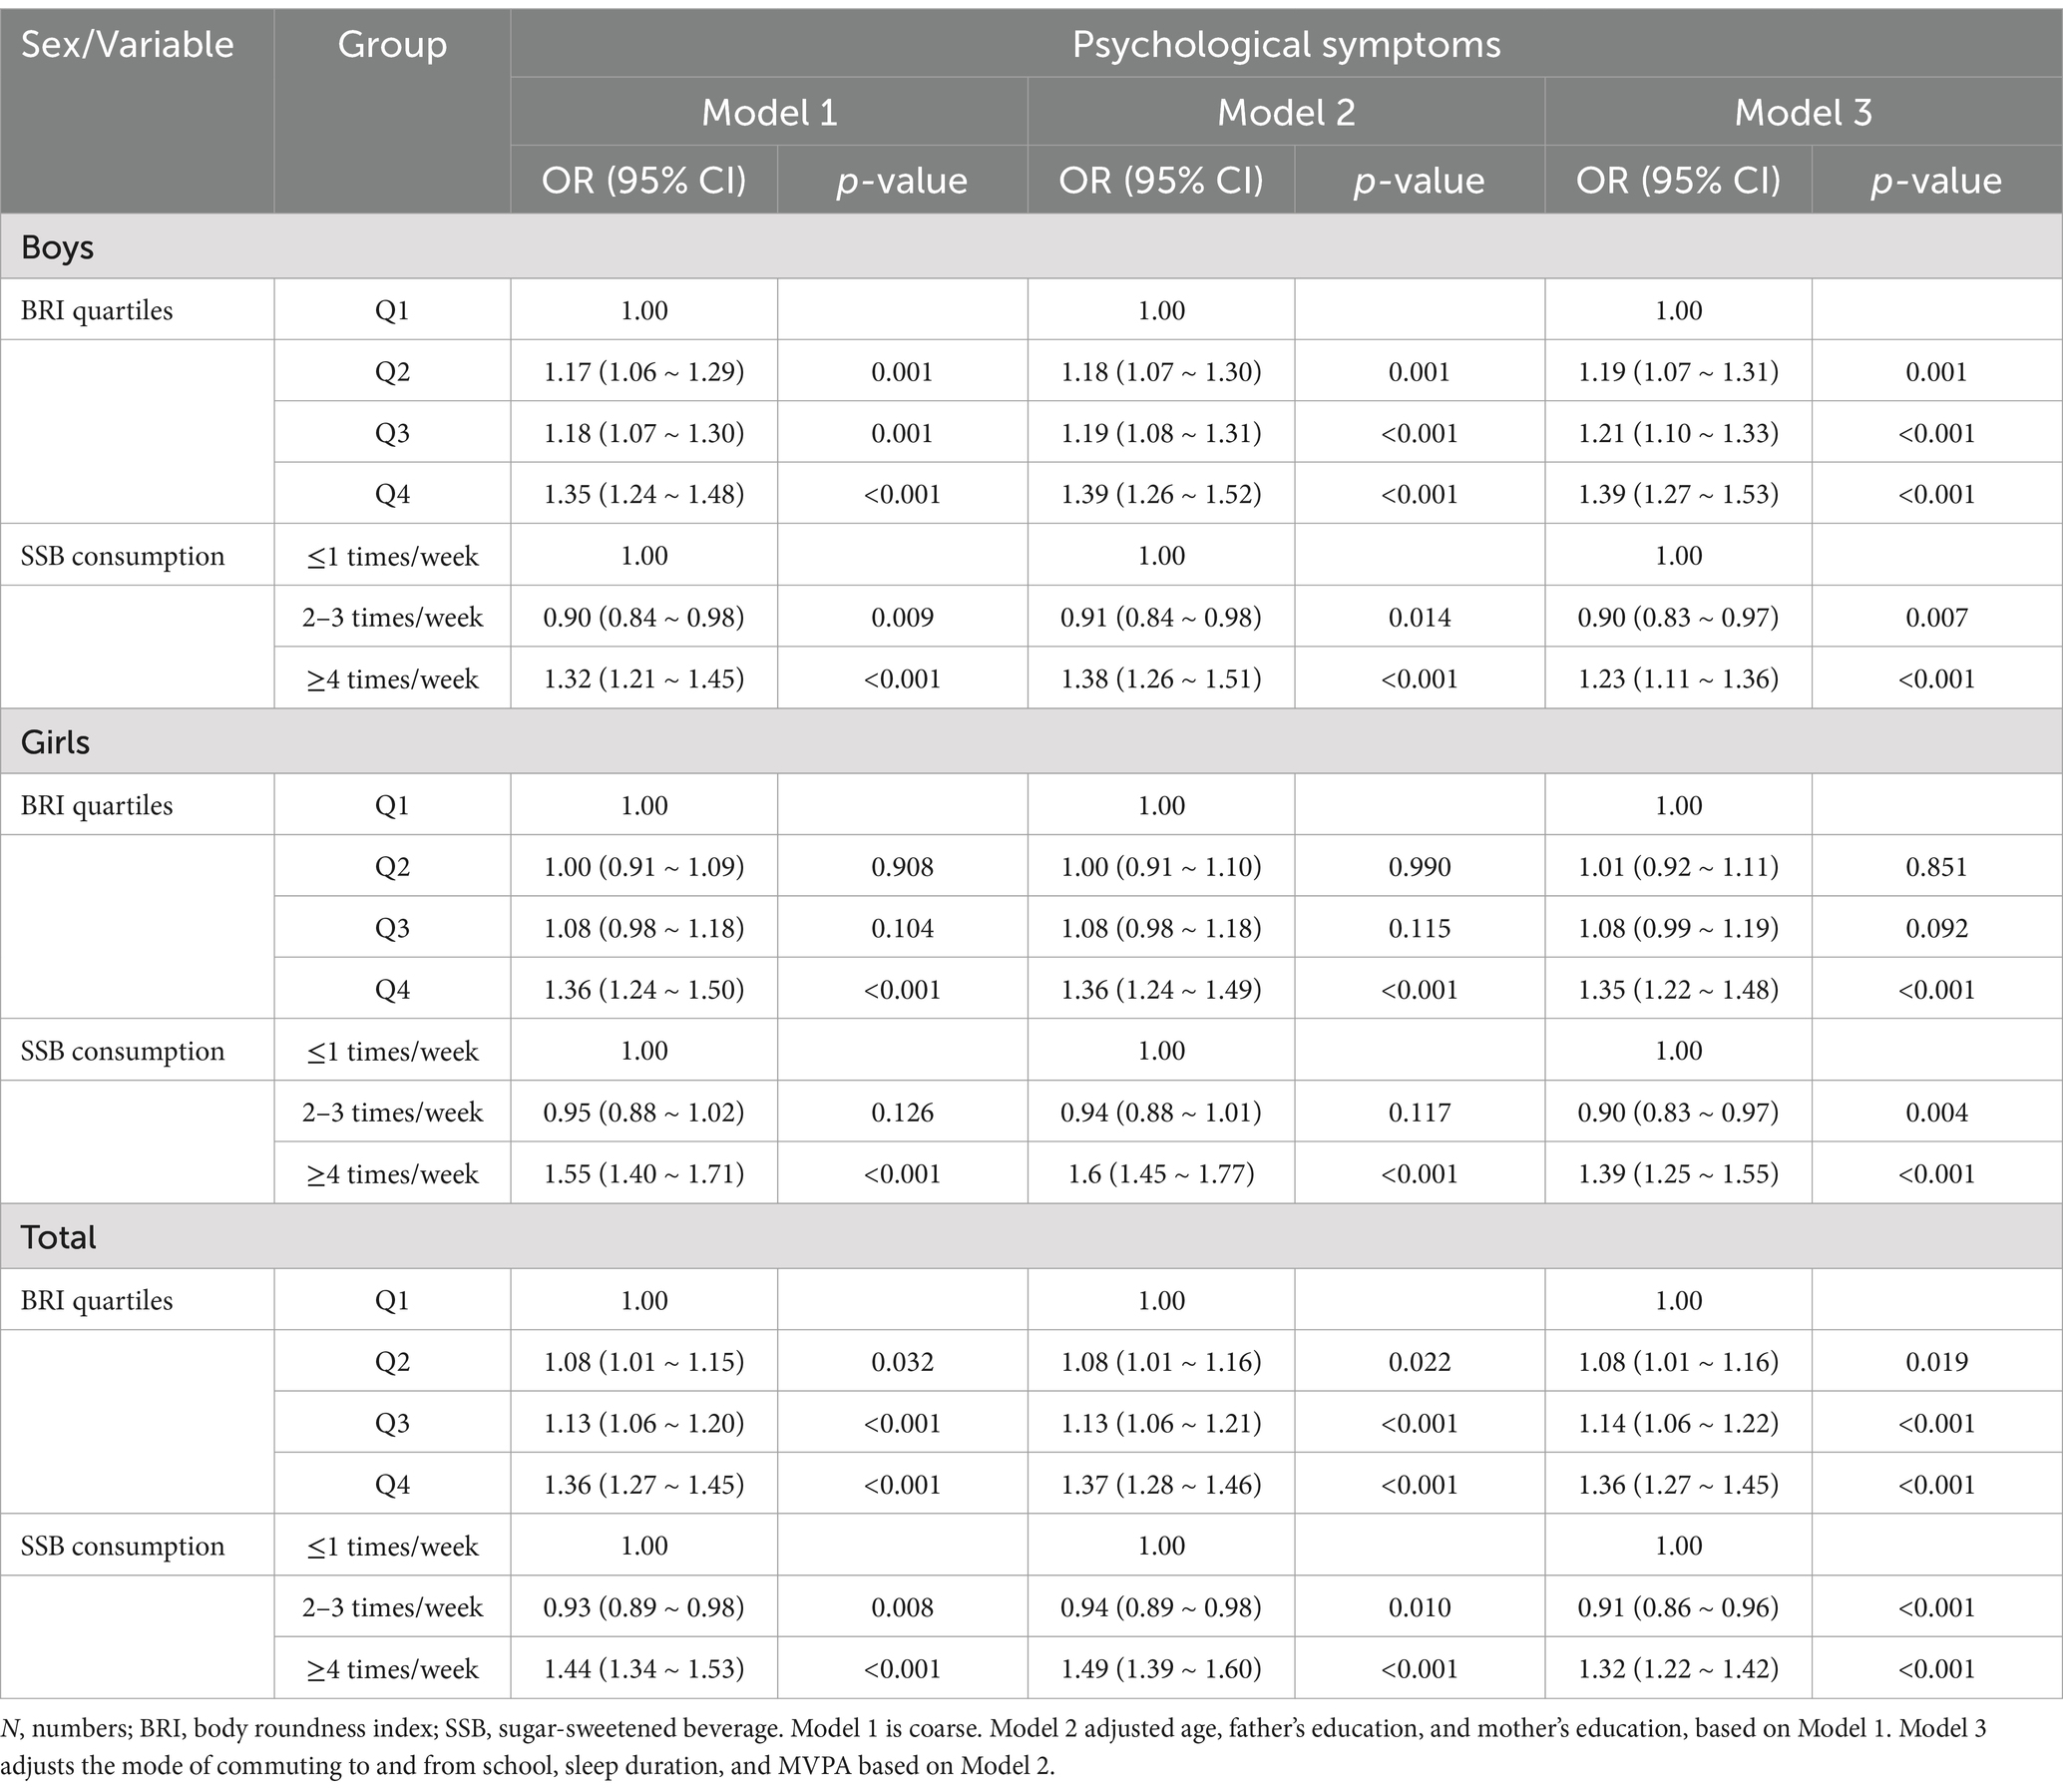
Table 3. Logistic regression analysis of psychological symptoms in Chinese adolescents with different BRI and SSB consumption.
Figure 2 shows the trend of OR values for logistic regression analysis of the prevalence of psychological symptoms in adolescents with different BRI and SSB consumption. Overall, it can be seen that the OR values of adolescents in the BRI quartiles for the Q4 group and BRI quartiles ≥4 times/week group were larger and shifted more to the right.
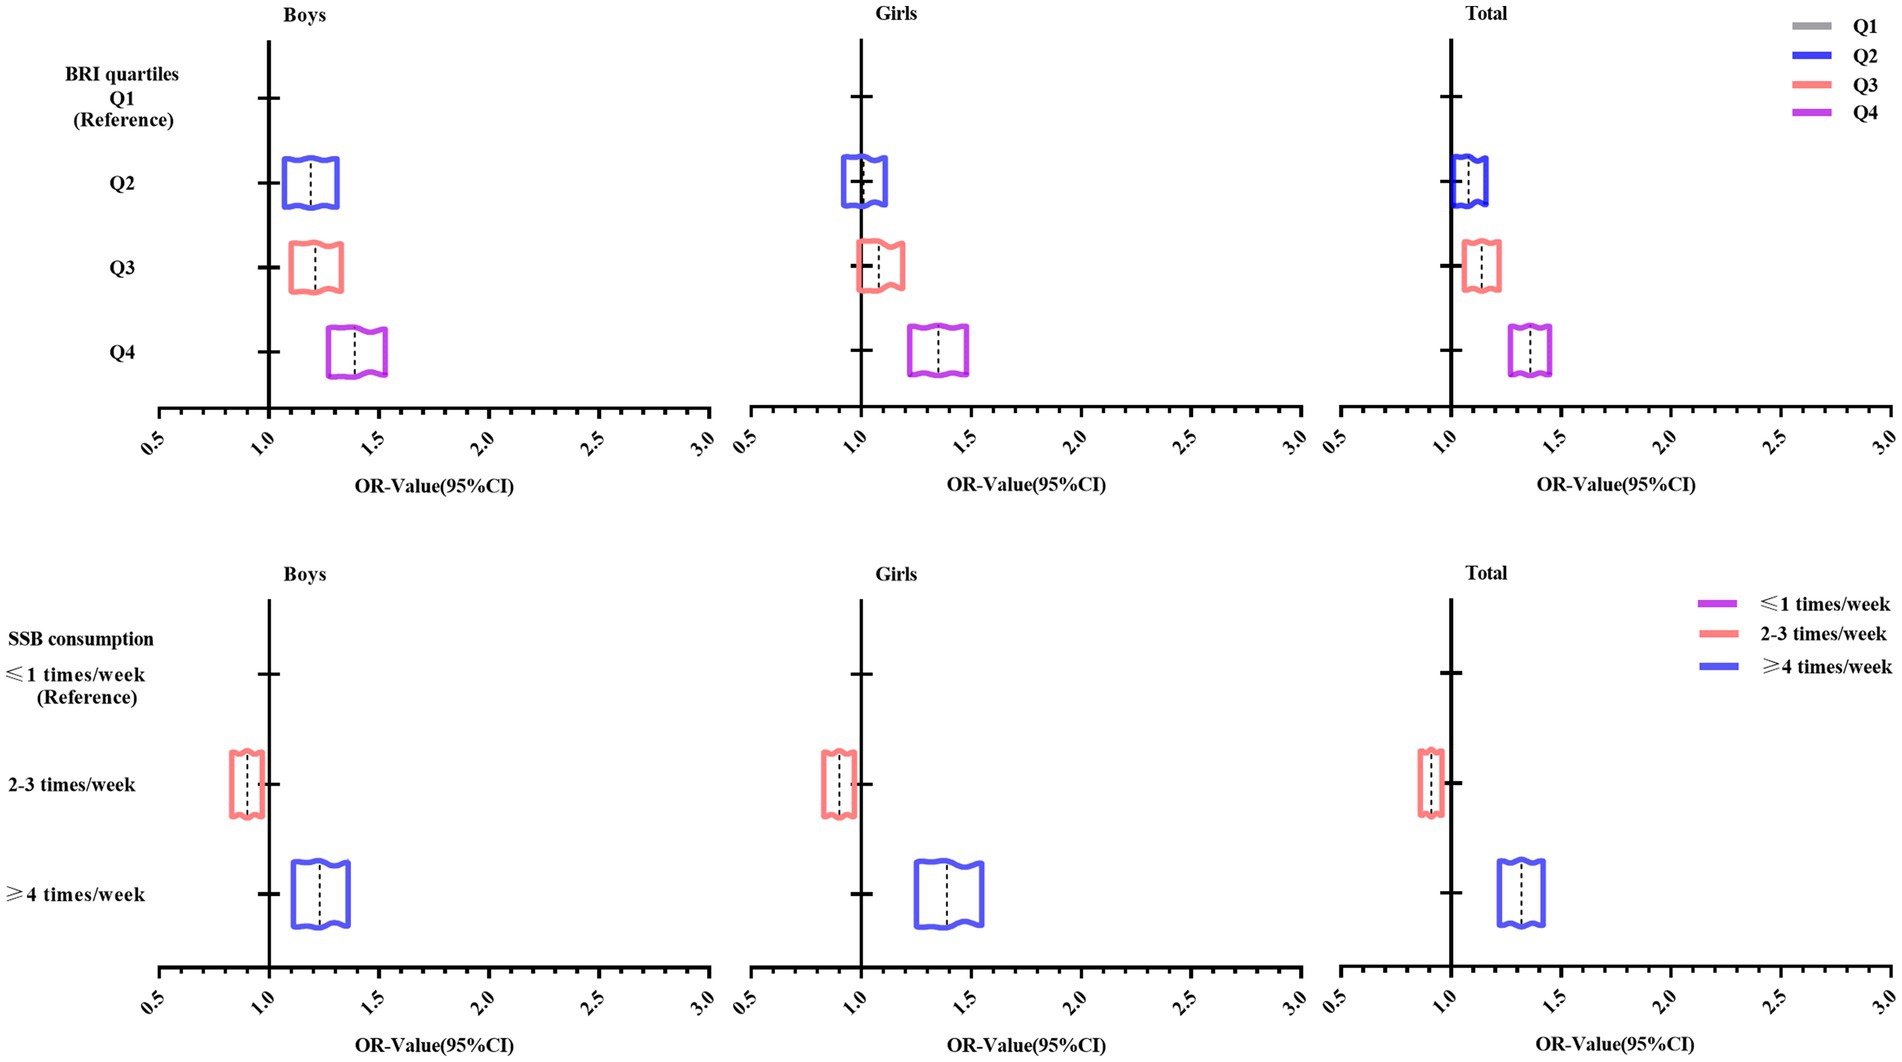
Figure 2. Trends in ORs of logistic regression analysis of psychological symptoms in adolescents with different BRI and SSB consumption.
Table 4 shows the ordered logistic regression analysis of different BRI and SSB consumption and psychological symptoms in adolescents. Ordered logistic regression analyses were conducted with the presence of psychological symptoms as the dependent variable and BRI and SSB consumption as the independent variables in Chinese adolescents. The analytical model was adjusted age, father’s education, mother’s education, mode of commuting to and from school, sleep duration, and MVPA. The results show that after adjusting for relevant covariates, ordered logistic regression analysis showed that with BRI quartiles Q1 and SSB consumption ≤1 times/week as the reference group, the adolescents in the group with BRI quartiles of Q4 and SSB consumption ≥4 times/week (OR = 2.01, 95% CI: 1.77–2.30) had the highest risk of developing psychological symptoms (p < 0.001). The same trend was observed in boys (OR = 1.77, 95% CI: 1.48 to 2.13) and girls (OR = 2.61, 95% CI: 2.13 to 3.20) (p < 0.001).
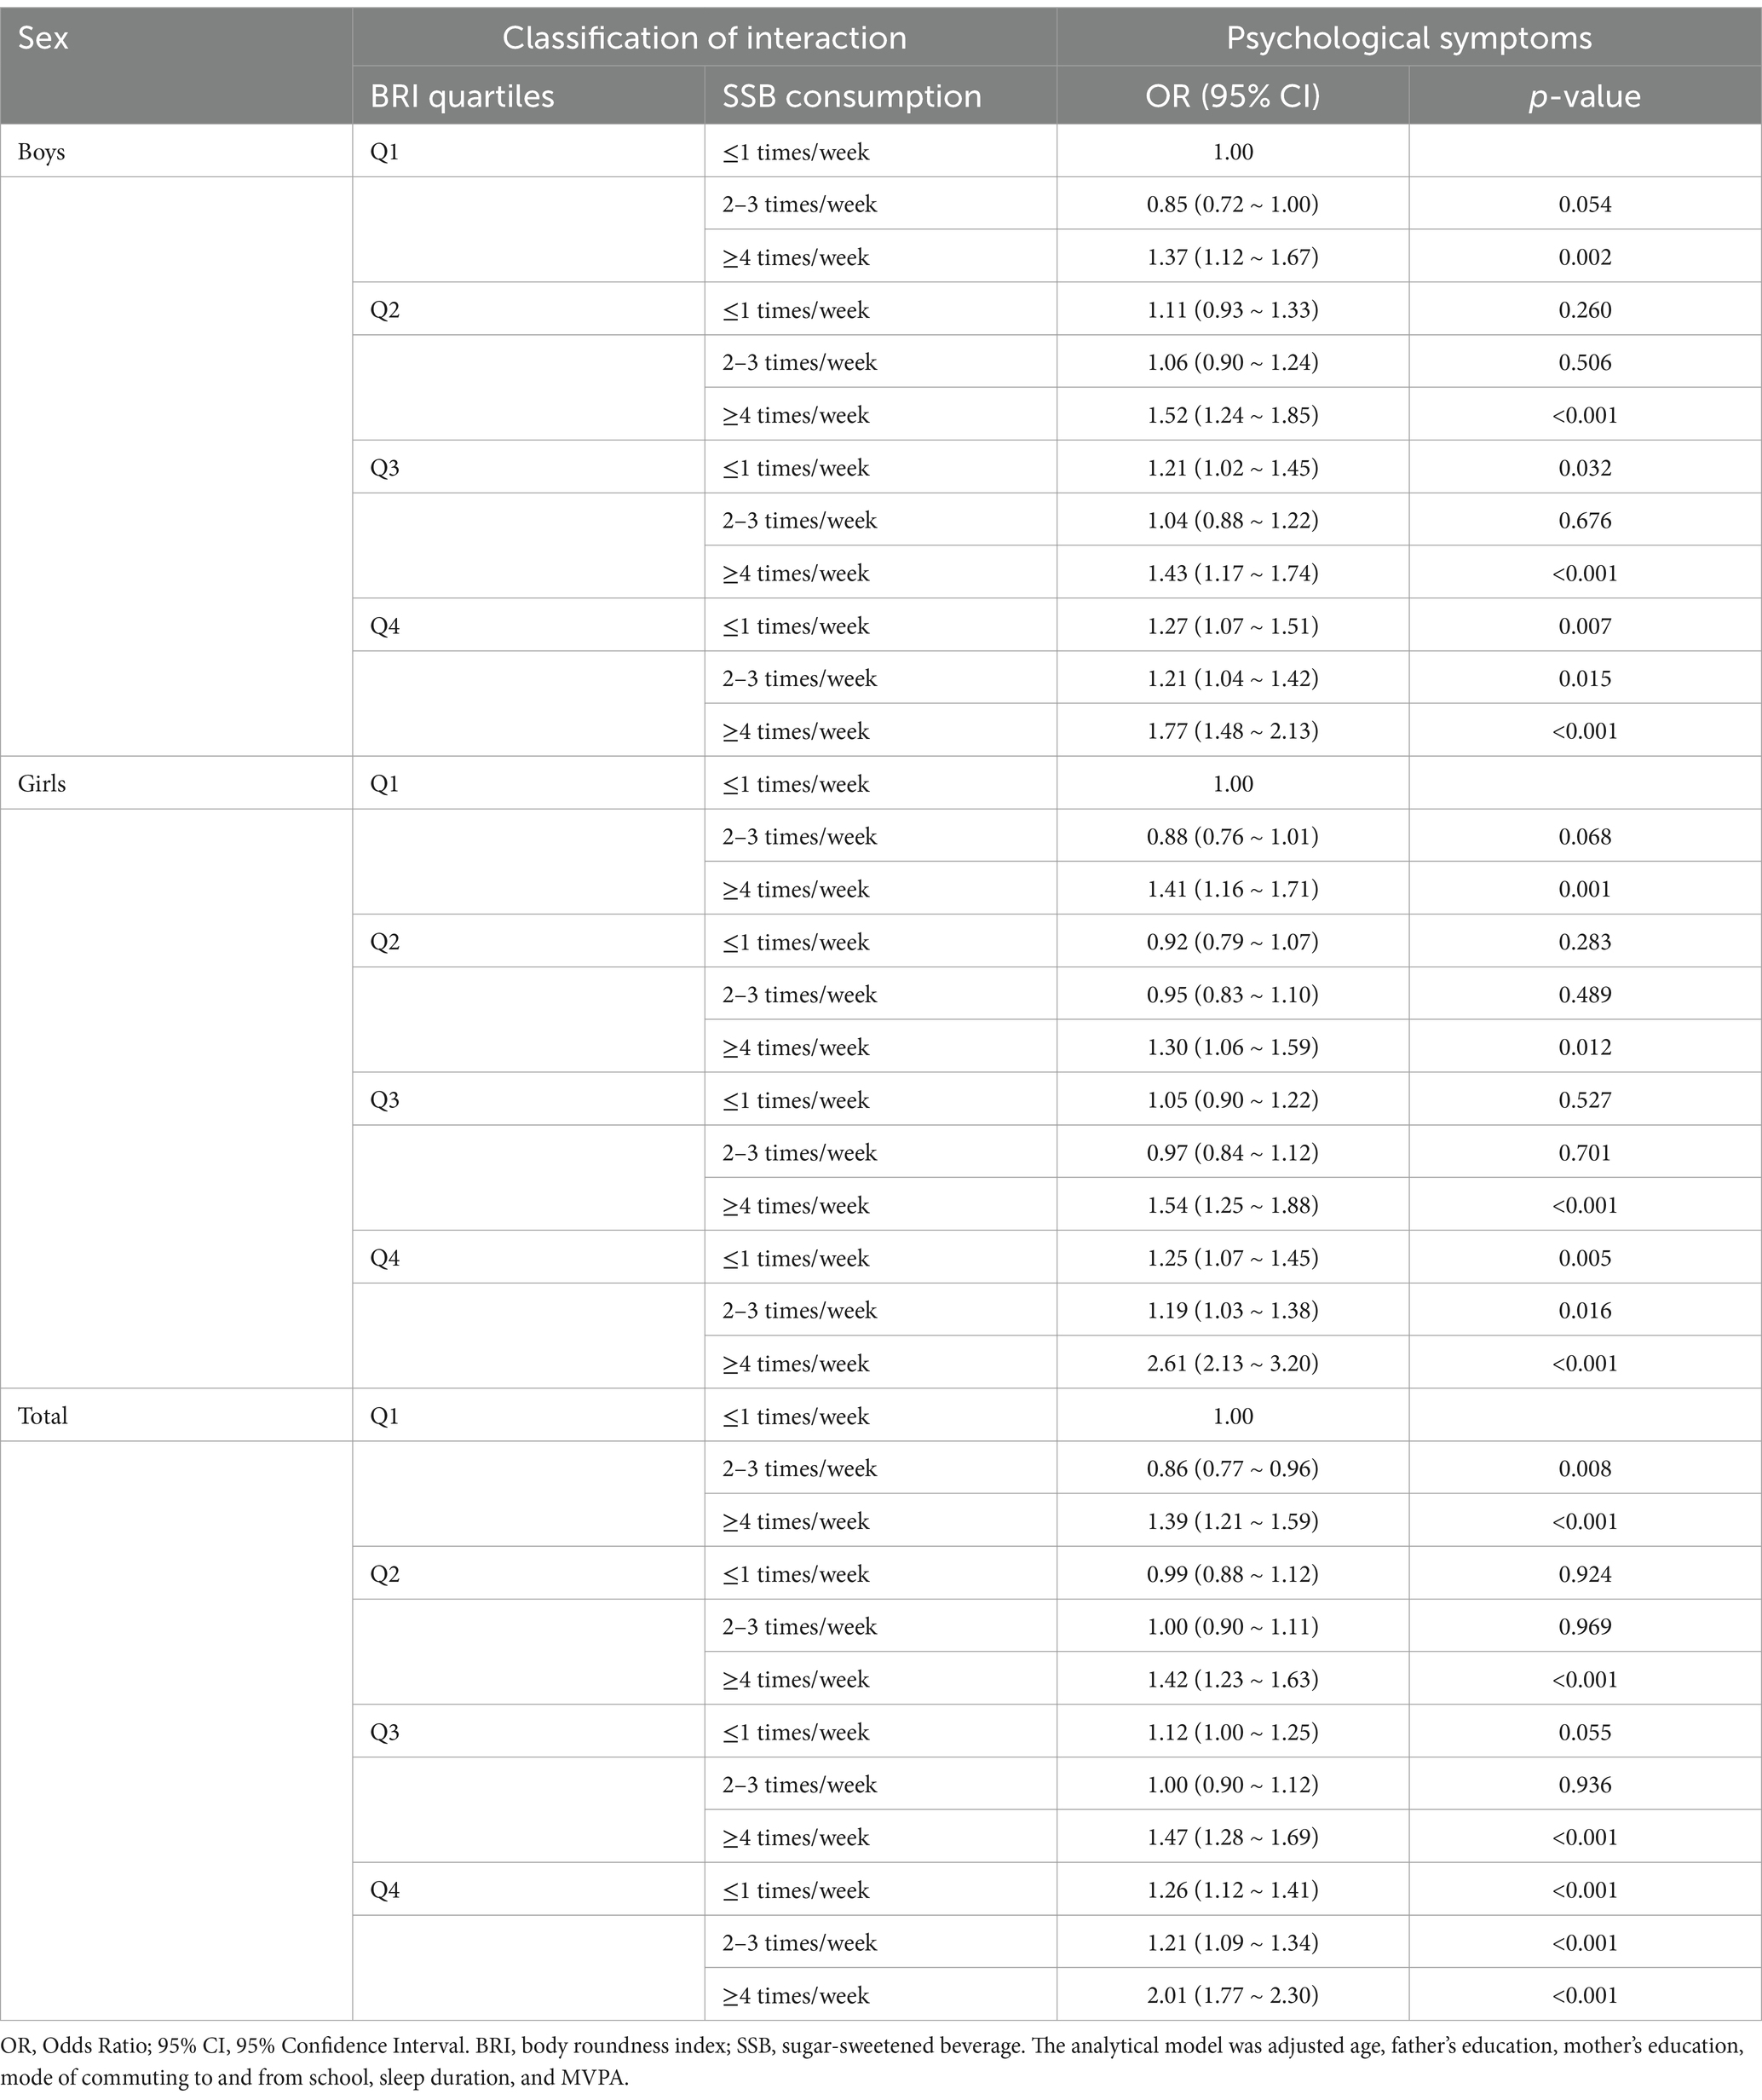
Table 4. Ordered logistic regression analysis of psychological symptoms in Chinese adolescents with different BRI and SSB consumption.
Figure 3 shows the trend of OR values for ordered logistic regression analysis of the prevalence of psychological symptoms in adolescents with different BRI and SSB consumption. Overall, it can be seen that adolescents in the group with BRI quartiles of Q4 and in the group with BRI quartiles ≥4 times/week had the largest ORs, and shifted more to the right. The same trend was observed for both boys and girls.
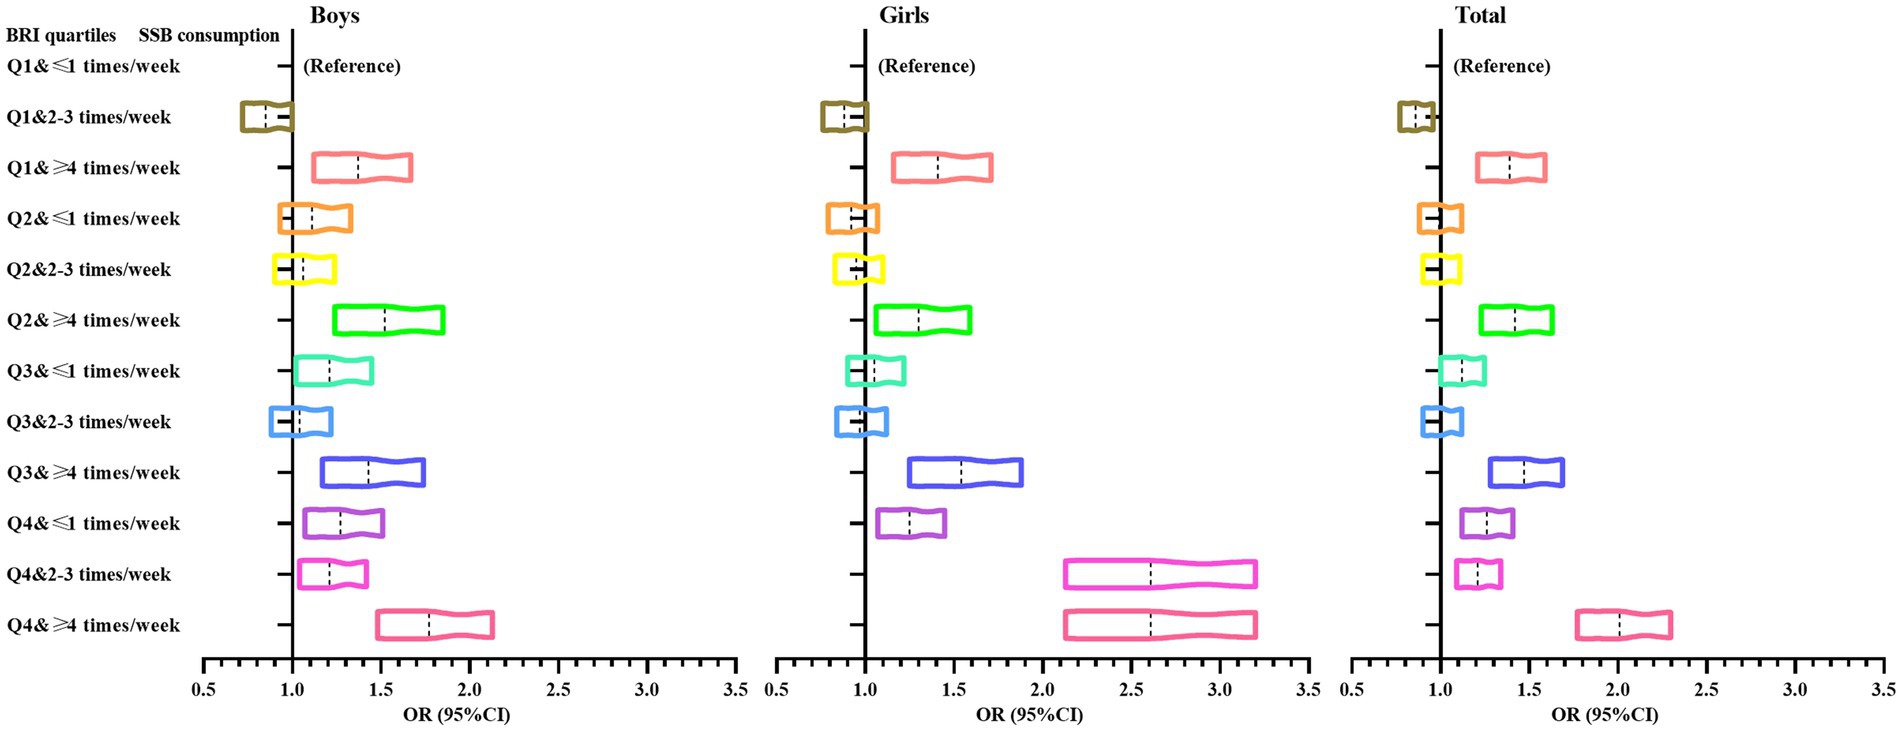
Figure 3. Trends in ORs of ordered logistic regression analysis of psychological symptoms in adolescents with different BRI and SSB consumption.
4 Discussion
The occurrence of psychological symptoms poses a serious threat to the health of adolescents and has become an important mental health issue of concern to countries around the world (40). The present study showed that the prevalence of psychological symptoms among Chinese adolescents was 19.2%, which was higher than the results of the survey (15%) (41), but also lower than the findings on adolescents in developing countries (32.4%) (42). China is a developing country, and with economic development, the lifestyles of Chinese adolescents have changed considerably, focusing on the decline in the level of physical activity, the prolongation of screen time, and static behaviors, which has led to a rapid rise in obesity rates and a series of negative impacts on adolescent physical and mental health (43). Coupled with the fact that the middle school stage is at the peak of adolescent development, the mental health of adolescents at this stage is extremely unstable, which leads to a higher prevalence of psychological symptoms. Surveys show that the prevalence of depressive symptoms among Chinese adolescents is 19.85%, with large differences between the central and western parts of the country, ranging from 14.75–24.96% overall (44). In addition, this, coupled with the effects of academic stress at the secondary school level, further increases the risk of adolescents with psychological symptoms (45). However, as people continue to pay more attention to mental health, the prevalence of psychological symptoms among Chinese adolescents is lower than that of other developing countries. According to a survey, the prevalence of psychological symptoms among adolescents in the African country of Tanzania is as high as 51.9%, which is significantly higher than that of Chinese adolescents (46). In conclusion, the prevalence of psychological symptoms among Chinese adolescents is still high, and relevant research should be conducted on the factors affecting them to minimize the continued rise of psychological symptoms.
The results of this study also showed that the BRI of Chinese adolescents was (2.03 ± 0.94), a result that was low compared to the results of related studies (3.229, 47). The reasons for this are associated with the different groups investigated in different studies and the different ages of the participants. The results of the present study also showed that the number of adolescents with SSB consumption ≥4 times/week was 14.7%, indicating that the level of SSB consumption among Chinese adolescents is relatively high, which should be given attention and concern. In terms of the association with psychological symptoms, the results of this study showed that the higher the BRI value, the higher the positive association with the occurrence of psychological symptoms among adolescents in the Q4 group. It indicates that as the BRI value increases, the prevalence of psychological symptoms among adolescents shows an increasing trend. The results of this study also showed that the prevalence of psychological symptoms was higher in adolescents in the higher SSB consumption group, with a positive correlation between the two. Past studies have confirmed that those with higher BRI have a higher risk of depression and anxiety (47). However, the results are not entirely consistent. Other studies have confirmed that there is no significant association between BRI and depression and anxiety (48). It has also been demonstrated that higher SSB consumption is positively associated with the development of obesity, which leads to an increased risk of psychological symptoms that can lead to the development of mental health problems (49). A study of adolescents showed that higher SSB consumption tended to lead to changes in the microbiology of the gut flora, which can cause hormonal disturbances in the brain, leading to emotional problems and negative effects on mental health (50). It has also been found that obese people are relatively less physically active, and that obesity-induced declines in self-confidence, which can lead to social disorders, can also hurt mental health development (51). Both the increase in BRI and the increase in SSB consumption in the present study led to a higher risk of obesity development, which in turn caused an increase in the prevalence of psychological symptoms.
It is noteworthy that Chinese adolescents with SSB consumption 2–3 times/week were negatively associated with the occurrence of psychological symptoms in the present study, a result that differs from that of previous studies (52, 53). Past studies have confirmed that SSB consumption in adolescents can prompt the brain to secrete dopamine, which brings about a transient feeling of euphoria, prompting a happy mood, and can alleviate negative psychological effects to a certain extent, thus playing a positive role in the development of mental health (54, 55). It can be inferred that appropriate SSB consumption may alleviate the occurrence of psychological symptoms in adolescents and have a positive impact on their mental health. The results of the ordered logistic regression analyses in this study showed that adolescents with higher BRI and higher SSB consumption were significantly and positively associated with the occurrence of psychological symptoms and the same trend was found in both boys and girls. Thus, in the process of psychosocial symptoms intervention in Chinese adolescents, special attention should be paid to the effective control of BRI, to keep it within a reasonable range. At the same time, the excessive consumption of SSB should be prevented.
There are certain strengths and limitations of this study. Strengths: First, to the best of our knowledge, this study analyzed for the first time the existence of associations between BRI and SSB consumption and psychological symptoms in Chinese adolescents. This study provides necessary references and lessons for Chinese adolescents’ psychological symptoms interventions. Second, as China is a vast country with large regional differences, this study selected adolescent participants from six geographical regions in China, which is a relatively large sample size and representative of the population. However, this study also has certain limitations. First, the present study was a cross-sectional survey, which was only able to understand the associations between BRI and SSB consumption and psychological symptoms among Chinese adolescents, but not the causal associations between them. Prospective cohort studies should be conducted in the future to better analyze the causal associations. Second, the limited number of covariates included in the analysis of this study may have affected the results. In the future, more covariates should be included, such as smoking, drinking, and exercise habits, to more accurately analyze the association between BRI and SSB consumption and psychological symptoms. Third, although the present study investigated participants from six geographic regions in China, because significant regional differences in lifestyle, dietary behaviors, or psychological symptoms may limit the applicability of this study’s findings to other populations, especially in other countries or non-urban environments, and more extensive research should be conducted in the future. Fourth, the survey of SSB consumption in this study was obtained by participants’ self-assessment using a questionnaire, which may have some potential bias from the actual SSB consumption. In the future, more objective assessment methods should be incorporated for assessment to improve the reliability of the study.
5 Conclusion
The results of this study found that there is an association between BRI and SSB consumption and psychological symptoms in Chinese adolescents. Both increased BRI and increased SSB consumption led to an increased prevalence of psychological symptoms in adolescents. In addition, it is worth noting that moderate SSB consumption may reduce the prevalence of psychological symptoms, which warrants more extensive investigation and research in the future. Based on the results of this study, we suggest that adolescent SSB consumption should be moderately controlled, while BRI should be effectively reduced to keep it in a reasonable range. The results of this study provide a necessary reference for the prevention and intervention of psychological symptoms in Chinese adolescents.
Data availability statement
The raw data supporting the conclusions of this article will be made available by the authors, without undue reservation.
Ethics statement
The studies involving humans were approved by the Ethics Committee of Shanghai Ocean University (R8976436). The studies were conducted in accordance with the local legislation and institutional requirements. Written informed consent for participation in this study was provided by the participants’ legal guardians/next of kin.
Author contributions
LC: Conceptualization, Formal analysis, Software, Supervision, Validation, Visualization, Writing – original draft, Writing – review & editing. WZ: Conceptualization, Investigation, Methodology, Supervision, Validation, Writing – original draft, Writing – review & editing. CW: Software, Validation, Visualization, Writing – original draft, Writing – review & editing. JL: Conceptualization, Formal analysis, Methodology, Validation, Visualization, Writing – original draft, Writing – review & editing. QK: Conceptualization, Data curation, Formal analysis, Methodology, Writing – original draft, Writing – review & editing.
Funding
The author(s) declare that no financial support was received for the research, authorship, and/or publication of this article.
Acknowledgments
Thanks to all participants for their support and assistance with our research.
Conflict of interest
The authors declare that the research was conducted in the absence of any commercial or financial relationships that could be construed as a potential conflict of interest.
Generative AI statement
The authors declare that no Gen AI was used in the creation of this manuscript.
Publisher’s note
All claims expressed in this article are solely those of the authors and do not necessarily represent those of their affiliated organizations, or those of the publisher, the editors and the reviewers. Any product that may be evaluated in this article, or claim that may be made by its manufacturer, is not guaranteed or endorsed by the publisher.
References
1. Lu, B, Lin, L, and Su, X. Global burden of depression or depressive symptoms in children and adolescents: a systematic review and meta-analysis. J Affect Disord. (2024) 354:553–62. doi: 10.1016/j.jad.2024.03.074
2. Shorey, S, Ng, ED, and Wong, C. Global prevalence of depression and elevated depressive symptoms among adolescents: a systematic review and meta-analysis. Br J Clin Psychol. (2022) 61:287–305. doi: 10.1111/bjc.12333
3. Mojtabai, R, Olfson, M, and Han, B. National trends in the prevalence and treatment of depression in adolescents and young adults. Pediatrics. (2016) 138:138. doi: 10.1542/peds.2016-1878
4. Puolakanaho, A, Muotka, JS, Lappalainen, R, Lappalainen, P, Hirvonen, R, and Kiuru, N. Adolescents' stress and depressive symptoms and their associations with psychological flexibility before educational transition. J Adolesc. (2023) 95:990–1004. doi: 10.1002/jad.12169
5. Nabunya, P, Damulira, C, Byansi, W, Muwanga, J, Bahar, OS, Namuwonge, F, et al. Prevalence and correlates of depressive symptoms among high school adolescent girls in southern Uganda. BMC Public Health. (2020) 20:1792. doi: 10.1186/s12889-020-09937-2
6. Zhang, F, Yin, X, Bi, C, Ji, L, Wu, H, Li, Y, et al. Psychological symptoms are associated with screen and exercise time: a cross-sectional study of chinese adolescents. BMC Public Health. (2020) 20:1695. doi: 10.1186/s12889-020-09819-7
7. Xu, DD, Rao, WW, Cao, XL, Wen, SY, Che, WI, Ng, CH, et al. Prevalence of major depressive disorder in children and adolescents in China: a systematic review and meta-analysis. J Affect Disord. (2018) 241:592–8. doi: 10.1016/j.jad.2018.07.083
8. Kandola, A, Lewis, G, Osborn, D, Stubbs, B, and Hayes, JF. Depressive symptoms and objectively measured physical activity and sedentary behaviour throughout adolescence: a prospective cohort study. Lancet Psychiatry. (2020) 7:262–71. doi: 10.1016/S2215-0366(20)30034-1
9. Cao, H, Qian, Q, Weng, T, Yuan, C, Sun, Y, Wang, H, et al. Screen time, physical activity and mental health among urban adolescents in China. Prev Med. (2011) 53:316–20. doi: 10.1016/j.ypmed.2011.09.002
10. Deng, GF, Wen, Y, Cheng, J, Huang, B, and Liu, N. Analysis of the associations between moderate-to-vigorous physical activity and screen time on psychological symptoms among university students: a cross-sectional survey based on six geographic regions in China. BMC Psychiatry. (2024) 24:504. doi: 10.1186/s12888-024-05945-3
11. Moradi, M, Mozaffari, H, Askari, M, and Azadbakht, L. Association between overweight/obesity with depression, anxiety, low self-esteem, and body dissatisfaction in children and adolescents: a systematic review and meta-analysis of observational studies. Crit Rev Food Sci Nutr. (2022) 62:555–70. doi: 10.1080/10408398.2020.1823813
12. Smith, JD, Fu, E, and Kobayashi, MA. Prevention and management of childhood obesity and its psychological and health comorbidities. Annu Rev Clin Psychol. (2020) 16:351–78. doi: 10.1146/annurev-clinpsy-100219-060201
13. Kansra, AR, Lakkunarajah, S, and Jay, MS. Childhood and adolescent obesity: a review. Front Pediatr. (2020) 8:581461. doi: 10.3389/fped.2020.581461
14. Zhou, D, Liu, X, Huang, Y, and Feng, Y. A nonlinear association between body roundness index and all-cause mortality and cardiovascular mortality in general population. Public Health Nutr. (2022) 25:3008–15. doi: 10.1017/S1368980022001768
15. Zhang, L, Yin, J, Sun, H, Dong, W, Liu, Z, Yang, J, et al. The relationship between body roundness index and depression: a cross-sectional study using data from the national health and nutrition examination survey (nhanes) 2011-2018. J Affect Disord. (2024) 361:17–23. doi: 10.1016/j.jad.2024.05.153
16. Wang, N, Liu, Y, Liu, B, Li, L, Zhang, P, Jiang, J, et al. Development of the physiological-psychological-social three-dimensional human ageing scale for older people. Public Health. (2021) 192:61–7. doi: 10.1016/j.puhe.2020.12.014
17. Calcaterra, V, Cena, H, Magenes, VC, Vincenti, A, Comola, G, Beretta, A, et al. Sugar-sweetened beverages and metabolic risk in children and adolescents with obesity: a narrative review. Nutrients. (2023) 15:15. doi: 10.3390/nu15030702
18. Miller, C, Ettridge, K, Wakefield, M, Pettigrew, S, Coveney, J, Roder, D, et al. Consumption of sugar-sweetened beverages, juice, artificially-sweetened soda and bottled water: an australian population study. Nutrients. (2020) 12:12. doi: 10.3390/nu12030817
19. Farsad-Naeimi, A, Asjodi, F, Omidian, M, Askari, M, Nouri, M, Pizarro, AB, et al. Sugar consumption, sugar sweetened beverages and attention deficit hyperactivity disorder: a systematic review and meta-analysis. Complement Ther Med. (2020) 53:102512. doi: 10.1016/j.ctim.2020.102512
20. von Philipsborn, P, Stratil, JM, Burns, J, Busert, LK, Pfadenhauer, LM, Polus, S, et al. Environmental interventions to reduce the consumption of sugar-sweetened beverages and their effects on health. Cochrane Database Syst Rev. (2019) 2019:CD012292. doi: 10.1002/14651858.CD012292.pub2
21. Chi, DL, and Scott, JM. Added sugar and dental caries in children: a scientific update and future steps. Dent Clin N Am. (2019) 63:17–33. doi: 10.1016/j.cden.2018.08.003
22. Kleppang, AL, de Ridder, K, Haugland, SH, and Stea, TH. Physical activity, sugar-sweetened beverages, whole grain bread and insomnia among adolescents and psychological distress in adulthood: prospective data from the population-based hunt study. Int J Behav Nutr Phys Act. (2021) 18:143. doi: 10.1186/s12966-021-01215-7
23. Song, W, Su, F, Li, S, Song, Y, and Chai, G. Association between sugar-sweetened beverages and duration of physical exercise with psychological symptoms among tibetan university students at high altitude. Front Psychol. (2024) 15:1380893. doi: 10.3389/fpsyg.2024.1380893
24. Bi, C, Cai, R, Zhao, Y, Lin, H, and Liu, H. Associations between cardiorespiratory fitness and executive function in chinese adolescents. Sci Rep. (2024) 14:21089. doi: 10.1038/s41598-024-62481-6
25. Zhang, X, Ma, N, Lin, Q, Chen, K, Zheng, F, Wu, J, et al. Body roundness index and all-cause mortality among us adults. JAMA Netw Open. (2024) 7:e2415051. doi: 10.1001/jamanetworkopen.2024.15051
26. Wang, Y, Bi, C, Liu, H, Lin, H, Cai, R, and Zhang, J. Association of sugar-sweetened beverage consumption with psychological symptoms among chinese university students during the covid-19 pandemic. Front Psychol. (2022) 13:1024946. doi: 10.3389/fpsyg.2022.1024946
27. Xu, H, Wu, X, Wan, Y, Zhang, S, Yang, R, Wang, W, et al. Interaction effects of co-consumption of fast food and sugar-sweetened beverages on psychological symptoms: evidence from a nationwide survey among chinese adolescents. J Affect Disord. (2020) 276:104–11. doi: 10.1016/j.jad.2020.07.030
28. Yang, Y, Liu, J, and Dai, D. Associations between sugar-sweetened beverages consumption, duration of physical exercise, and depressive symptoms among tibetan university students at high altitude. Front Psychol. (2024) 15:1439451. doi: 10.3389/fpsyg.2024.1439451
29. Fei-Fei, H, Xin, G, Yang, X, and Al, E. Neck, shoulder, low back pain and mental subhealth among adolescents. China school Health. (2024) 45:479–82. doi: 10.16835/j.cnki.1000-9817.2024122
30. Dm, T, Bredlau, C, Bosy-Westphal, A, Mueller, M, Shen, W, and Gallagher, D. Relationships between body roundness with body fat and visceral adipose tissue emerging from a new geometrical model. Obesity. (2013) 21:2264–71. doi: 10.1002/oby.20408
31. CNSSCH Association. Report on the 2019th national survey on students’constitution and health. Beijing: China College & University Press (2022). 25–41.
32. Fausnacht, AG, Myers, EA, Hess, EL, Davy, BM, and Hedrick, VE. Update of the bevq-15, a beverage intake questionnaire for habitual beverage intake for adults: determining comparative validity and reproducibility. J Hum Nutr Diet. (2020) 33:729–37. doi: 10.1111/jhn.12749
33. Zhuang, X, Liu, Y, Gittelsohn, J, Lewis, E, Song, S, Ma, Y, et al. Sugar-sweetened beverages consumption and associated factors among northeastern chinese children. Nutrients. (2021) 13:13. doi: 10.3390/nu13072233
34. Hedrick, VE, Savla, J, Comber, DL, Flack, KD, Estabrooks, PA, Nsiah-Kumi, PA, et al. Development of a brief questionnaire to assess habitual beverage intake (bevq-15): sugar-sweetened beverages and total beverage energy intake. J Acad Nutr Diet. (2012) 112:840–9. doi: 10.1016/j.jand.2012.01.023
35. Koivusilta, LK, Acacio-Claro, PJ, Mattila, VM, and Rimpela, AH. Health and health behaviours in adolescence as predictors of education and socioeconomic status in adulthood - a longitudinal study. BMC Public Health. (2024) 24:1178. doi: 10.1186/s12889-024-18668-7
36. Mikkonen, J, Remes, H, Moustgaard, H, and Martikainen, P. Evaluating the role of parental education and adolescent health problems in educational attainment. Demography. (2020) 57:2245–67. doi: 10.1007/s13524-020-00919-y
37. Biddle, SJ, Pearson, N, Ross, GM, and Braithwaite, R. Tracking of sedentary behaviours of young people: a systematic review. Prev Med. (2010) 51:345–51. doi: 10.1016/j.ypmed.2010.07.018
38. Craigie, AM, Lake, AA, Kelly, SA, Adamson, AJ, and Mathers, JC. Tracking of obesity-related behaviours from childhood to adulthood: a systematic review. Maturitas. (2011) 70:266–84. doi: 10.1016/j.maturitas.2011.08.005
39. Pomeroy, A, Pagan, LP, Kline, CE, Heffernan, KS, Meyer, ML, and Stoner, L. The relationship between sleep duration and arterial stiffness: a meta-analysis. Sleep Med Rev. (2023) 70:101794. doi: 10.1016/j.smrv.2023.101794
40. Santos, R, Mendes, CG, Sen, BG, de Alcantara, VS, de Almeida, NY, de Miranda, DM, et al. The associations between screen time and mental health in adolescents: a systematic review. BMC Psychol. (2023) 11:127. doi: 10.1186/s40359-023-01166-7
41. Dardas, LA, Silva, SG, Smoski, MJ, Noonan, D, and Simmons, LA. The prevalence of depressive symptoms among Arab adolescents: findings from Jordan. Public Health Nurs. (2018) 35:100–8. doi: 10.1111/phn.12363
42. Abbasi, LN, Hyasat, A, Alsha'Er, A, Al, WA, Jaser, G, Shelbayeh, M, et al. Adolescent depression prevalence and factors: a jordanian cross-sectional study. Cureus. (2024) 16:e52546. doi: 10.7759/cureus.52546
43. Li, D, Yang, R, Hu, J, Xue, Y, Huang, X, Wan, Y, et al. Patterns of six behaviors and psychosomatic symptoms in adolescents: a six-province study in China. J Affect Disord. (2022) 297:593–601. doi: 10.1016/j.jad.2021.10.118
44. Rao, WW, Xu, DD, Cao, XL, Wen, SY, Che, WI, Ng, CH, et al. Prevalence of depressive symptoms in children and adolescents in China: a meta-analysis of observational studies. Psychiatry Res. (2019) 272:790–6. doi: 10.1016/j.psychres.2018.12.133
45. Liu, X, Wang, Z, Zhou, Z, Yang, S, Yang, J, Wen, Y, et al. Prevalence, risk factors, psychological effects of children and adolescents with lower urinary tract symptoms: a large population-based study. Front Pediatr. (2024) 12:1455171. doi: 10.3389/fped.2024.1455171
46. Mwakanyamale, AA, and Yizhen, Y. Psychological maltreatment and its relationship with self-esteem and psychological stress among adolescents in tanzania: a community based, cross-sectional study. BMC Psychiatry. (2019) 19:176. doi: 10.1186/s12888-019-2139-y
47. Hadi, S, Momenan, M, Cheraghpour, K, Hafizi, N, Pourjavidi, N, Malekahmadi, M, et al. Abdominal volume index: a predictive measure in relationship between depression/anxiety and obesity. Afr Health Sci. (2020) 20:257–65. doi: 10.4314/ahs.v20i1.31
48. Lotfi, K, Hassanzadeh, KA, Saneei, P, Afshar, H, Esmaillzadeh, A, and Adibi, P. A body shape index and body roundness index in relation to anxiety, depression, and psychological distress in adults. Front Nutr. (2022) 9:843155. doi: 10.3389/fnut.2022.843155
49. Godin, KM, Chaurasia, A, Hammond, D, and Leatherdale, ST. Food purchasing behaviors and sugar-sweetened beverage consumption among Canadian secondary school students in the compass study. J Nutr Educ Behav. (2018) 50:803–812.e1. doi: 10.1016/j.jneb.2017.12.014
50. Yan, T, Shi, L, Xu, K, Bai, J, Wen, R, Liao, X, et al. Habitual intakes of sugar-sweetened beverages associated with gut microbiota-related metabolites and metabolic health outcomes in young chinese adults. Nutr Metab Cardiovasc Dis. (2023) 33:359–68. doi: 10.1016/j.numecd.2022.10.016
51. Zhou, J, Tang, R, Wang, X, Li, X, Heianza, Y, and Qi, L. Improvement of social isolation and loneliness and excess mortality risk in people with obesity. JAMA Netw Open. (2024) 7:e2352824. doi: 10.1001/jamanetworkopen.2023.52824
52. Bahrami, G, Mohammadifard, N, Haghighatdoost, F, Emamjomeh, A, Najafi, F, Farshidi, H, et al. The association between soft drinks consumption and risk of mental disorders among iranian adults: the lipokap study. J Affect Disord. (2024) 363:8–14. doi: 10.1016/j.jad.2024.07.033
53. Ra, JS. Combination of sugar-sweetened beverage consumption, screen-based sedentary time, and sleep duration and their association with south korean adolescents' mental health. Front Public Health. (2023) 11:1293505. doi: 10.3389/fpubh.2023.1293505
54. de Araujo, IE. Circuit organization of sugar reinforcement. Physiol Behav. (2016) 164:473–7. doi: 10.1016/j.physbeh.2016.04.041
Keywords: body roundness index, sugar-sweetened beverage consumption, psychological symptoms, adolescents, cross-sectional assessment
Citation: Chen L, Zheng W, Wei C, Ling J and Kong Q (2025) Associations of body roundness index and sugar-sweetened beverage consumption with psychological symptoms in adolescents: a multicenter cross-sectional survey based on Chinese adolescents aged 12–18 years old. Front. Nutr. 12:1505491. doi: 10.3389/fnut.2025.1505491
Edited by:
Wenhan Yang, Guangdong Pharmaceutical University, ChinaReviewed by:
Monica Tarcea, George Emil Palade University of Medicine, Pharmacy, Sciences and Technology of Târgu Mureş, RomaniaLuís Antônio Monteiro Campos, Universidade Católica de Petrópolis, Brazil
Reggie Surya, Binus University, Indonesia
Florentina Nechita, Transilvania University of Brașov, Romania
Copyright © 2025 Chen, Zheng, Wei, Ling and Kong. This is an open-access article distributed under the terms of the Creative Commons Attribution License (CC BY). The use, distribution or reproduction in other forums is permitted, provided the original author(s) and the copyright owner(s) are credited and that the original publication in this journal is cited, in accordance with accepted academic practice. No use, distribution or reproduction is permitted which does not comply with these terms.
*Correspondence: Qingtao Kong, a29uZ3Fpbmd0YW8yMDIzMDNAMTYzLmNvbQ==