 Chenguang Wu
 Zhenyan Xu
 Xin Chen
 Hualong Liu
 Yuliang Chen
 Jiaxing Huang
 Teng Lu
 Zixi Huang
95% of researchers rate our articles as excellent or good
Learn more about the work of our research integrity team to safeguard the quality of each article we publish.
Find out more
ORIGINAL RESEARCH article
Front. Nutr., 24 March 2025
Sec. Nutrition and Metabolism
Volume 12 - 2025 | https://doi.org/10.3389/fnut.2025.1504855
Background: The relationship between fasting blood glucose and urea in non-diabetic individuals is still unclear. This study aimed to evaluate the association between fasting blood glucose and urea in a non-diabetic population.
Methods: Data from a cohort of non-diabetic individuals were collected from the 2009 China Health and Nutrition Survey dataset. We performed smooth curve and two piecewise linear regression analyses to assess the association between fasting blood glucose and urea in this non-diabetic population.
Results: Data from a total of 7,596 adult participants without diabetes were included in this study; the mean age of the participants was 50.2 years, and 46.4% were male. There was an L-shaped relationship between fasting blood glucose and urea, and the inflection point of fasting blood glucose was 4.6 mmol/L. After adjusting for potential confounders, we found a negative correlation between fasting blood glucose and urea up to the inflection point (β = −0.3, 95% CI −0.5 to −0.2, P < 0.001), but beyond the inflection point, this relationship disappeared (β = 0.0, 95% CI −0.1 to 0.1 P = 0.848). In the group with lower fasting blood glucose (fasting blood glucose <4.6 mmol/L), smoking (interaction P = 0.037) and alcohol consumption (interaction P = 0.001) influenced the relationship between fasting blood glucose and urea.
Conclusions: The results suggest that lower fasting blood glucose was associated with higher urea in non-diabetic individuals with fasting blood glucose <4.6 mmol/L, revealing an L-shaped association between fasting blood glucose and urea.
Urea is the terminal product of protein catabolism; as a water-soluble substance, it can be excreted through the kidneys (1). The process of urea production and excretion is altered under several conditions, such as changes in protein metabolism and kidney disease (2). Increased protein consumption leads to an increased concentration of urea in the blood (3). In addition, as the kidneys play an essential role in the excretion of urea, prerenal, intrarenal and postrenal diseases can lead to a significant increase in urea (2). Therefore, urea levels are widely used in the clinical evaluation of renal function and can be a useful biomarker for predicting the progression of kidney diseases (4). Recent studies have demonstrated that the probabilities of diabetes mellitus and diabetic retinopathy increase by 7% and 12%, respectively, for every 1 mmol/L increase in urea (5, 6). Many studies have shown a significant association between high urea levels and an increased risk of mortality in patients with heart failure, chronic kidney disease, acute ischemic stroke, or acute pulmonary embolism (4, 7–9). Increased urea negatively affects the cardiovascular, endocrine, and urinary systems, suggesting the importance of urea (10, 11).
Carbohydrate and protein metabolism are closely associated and provide the necessary energy for the human body. In addition, glucose always participates in the process of renal injury, and high or low blood glucose levels can damage renal function through multiple pathways (12–14). At present, studies on the association between blood glucose and urea have focused mostly on patients with diabetes. It has been shown that urea levels are significantly positively associated with both short-term and long-term glycemic variability in patients with diabetes mellitus (15). Moreover, urea levels were significantly higher in patients with poor glycemic control during 12 years of follow-up (16). In non-diabetic individuals, one study reported that a decrease in blood glucose caused by fasting led to an increase in the urea concentration (17), whereas another study reported that a decrease in blood glucose led to a decrease in the urea concentration (18). Therefore, the relationship between blood glucose and urea in non-diabetic individuals is still unclear. Therefore, the aim of this study was to further evaluate the association between blood glucose and urea in a non-diabetic population to provide additional evidence.
The data that were analyzed were extracted from the 2009 China Health and Nutrition Survey (CHNS) dataset. The CHNS is a large-scale longitudinal survey designed to provide economic, sociological, demographic, dietary, health and physical activity data to measure key public health risk factors. Fasting blood samples were collected for the first time in 2009. Informed consent was obtained from the participants involved in the database. Details of the survey were published previously (19), and all the data are available to researchers for free on the following website: http://www.cpc.unc.edu/projects/china.
The 2009 CHNS dataset of 12,009 individuals was initially included in this study. The estimated glomerular filtration rate (eGFR) was calculated via the Modification of Diet in Renal Disease equation [eGFR = 175 × Scr−1.154 × age−0.203 × 1.212 (if black) × 0.742(if female)], where the eGFR is expressed in mL/min/1.73 m2 and the serum creatinine (Scr) concentration is expressed in mg/dL (20). The body mass index (BMI) was calculated as body weight (kilograms) divided by the square of height (meters). Individual dietary data were assessed by considering three consecutive days of 24-h dietary recall by trained nutritionists. The participants were asked to avoid fierce exercise or high mental pressure before the collection of plasma samples to measure fasting glucose levels (participant avoided eating for at least 8 h but not more than 16 h). Additional details were described elsewhere (19). The exclusion criteria were as follows: (1) aged < 18 years; (2) pregnant; (3) missing information about laboratory variables (urea or fasting blood glucose) and medical history (diabetes mellitus); (4) diagnosed with diabetes on the basis of the guidelines or had a history of diabetes (21); and (5) missing information about the covariates mentioned below.
A total of 7,596 non-diabetic participants were included in the analysis. To handle missing data, we exclude variables with more than 25% missing values. For normally distributed continuous variables, the missing values were replaced by the mean value, and for continuous variables with skewed distributions, the missing values were replaced by the median value (22). There were no missing dichotomous variables in this study.
Variables that may be related to fasting blood glucose and urea were adjusted to improve the reliability of the results. This study covered six dimensions of variables, including demographic characteristics, such as age, sex, and BMI; vital indices, such as systolic blood pressure and diastolic blood pressure; medical history of hypertension, stroke, and myocardial infarction; lifestyle factors, such as smoking, alcohol consumption, tea consumption, coffee consumption, soft/sugared fruit drink consumption; dietary factors, such as carbohydrate intake, fat intake, dietary protein intake, and total energy intake; and laboratory variables, such as uric acid, creatinine, alanine transaminase, high-density lipoprotein cholesterol, low-density lipoprotein cholesterol, triglyceride, total cholesterol, total protein, and albumin.
The data are presented as the mean [standard deviation (SD)] for normally distributed data, as the median [interquartile range (IQR)] for skewed data, and categorical variables are presented as numbers (percentages). For continuous variables, we used independent t tests (normal distribution) or Kruskal–Wallis rank–sum tests (skewed distribution) to compare the differences between groups. For categorical variables, chi-square tests were used to compare differences in proportions between groups.
First, we constructed a smooth curve to estimate the relationship between fasting blood glucose and urea after adjustment for the covariates listed above. We also constructed smooth curves for the relationships of fasting glucose with creatinine and the eGFR. Second, the threshold value was obtained on the basis of the fitting results of the smooth curve and the log likelihood ratio test. Then, according to the inflection point, a two-piecewise linear regression model was performed to evaluate the non-linear relationship between fasting blood glucose and urea. We constructed three models to increase the reliability of the results (Crude Model: no covariates were adjusted; Model 1: adjusted for only age and sex; and Model 2: adjusted for all covariates). Finally, stratified analysis and interaction analysis were performed to evaluate the potential modifiers of the association between fasting blood glucose and urea. Each stratification was adjusted for all covariates except the stratification factor itself.
All the analyses were performed with the statistical software Stata 17.0 (College Station, TX) and EmpowerStats (X&Y Solutions, Inc. Boston, MA). P < 0.05 was considered statistically significant in all analyses.
A total of 7,596 participants, including 3,521 men and 4,075 women, were enrolled in this study. We calculated the threshold value, as shown in Figure 1. All the participants were divided into two groups according to the inflection point of glucose (fasting blood glucose <4.6 mmol/L or fasting blood glucose ≥4.6 mmol/L). Table 1 lists the baseline characteristics of all the enrolled participants, including demographic characteristics, vital signs, medical history, lifestyle factors, dietary factors and laboratory variables. Table 1 also shows the differences between the two groups.
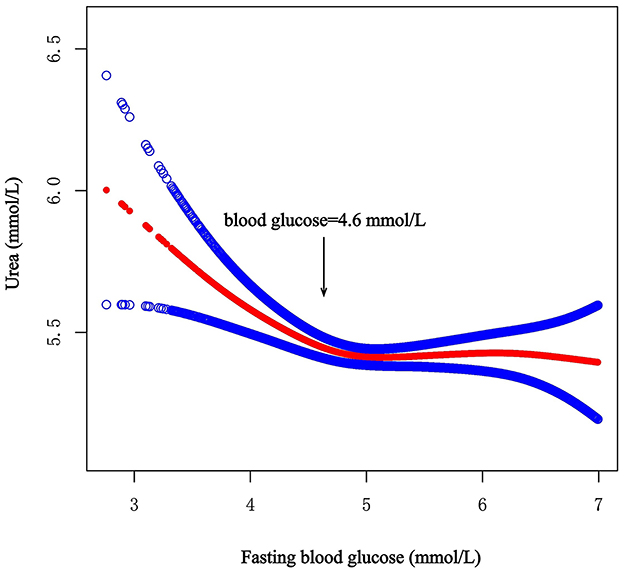
Figure 1. Smooth curve on association between fasting blood glucose and urea. The red curve represents the smooth curve fit between variables. The Blue curves represent the 95% confidence interval around the fitted trend.
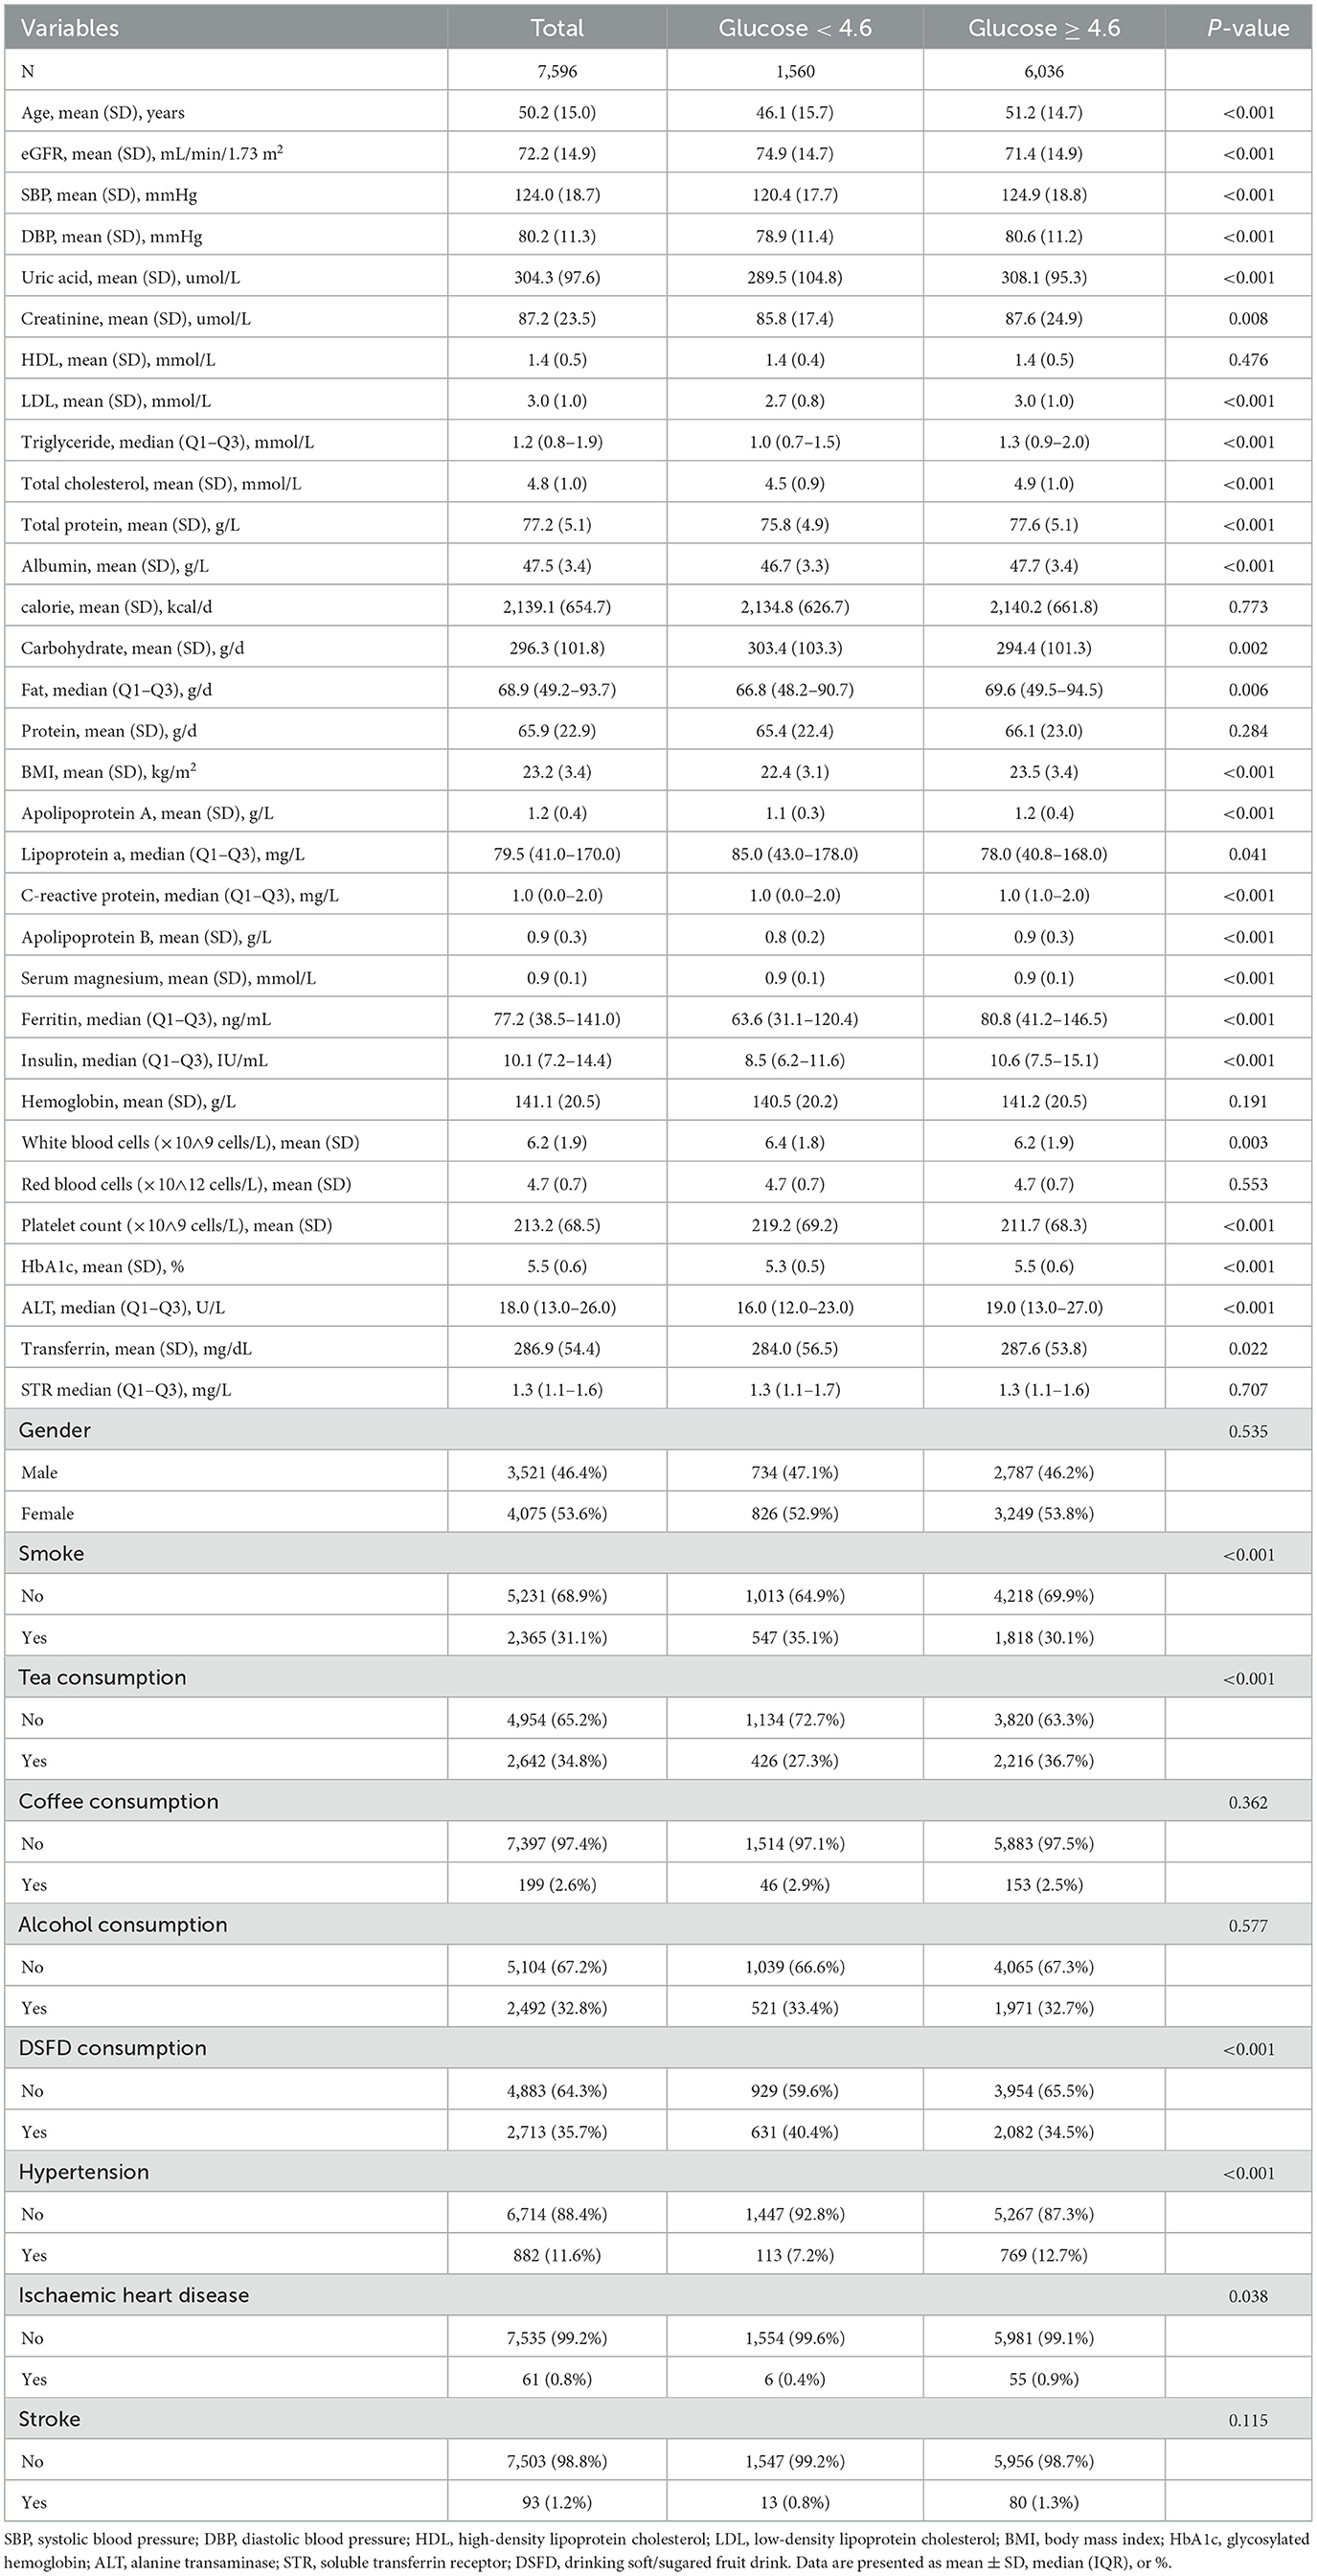
Table 1. Clinical characteristics of study participants.
To analyze the non-linear association between fasting blood glucose and urea, three models were constructed, and the results are shown in Table 2.
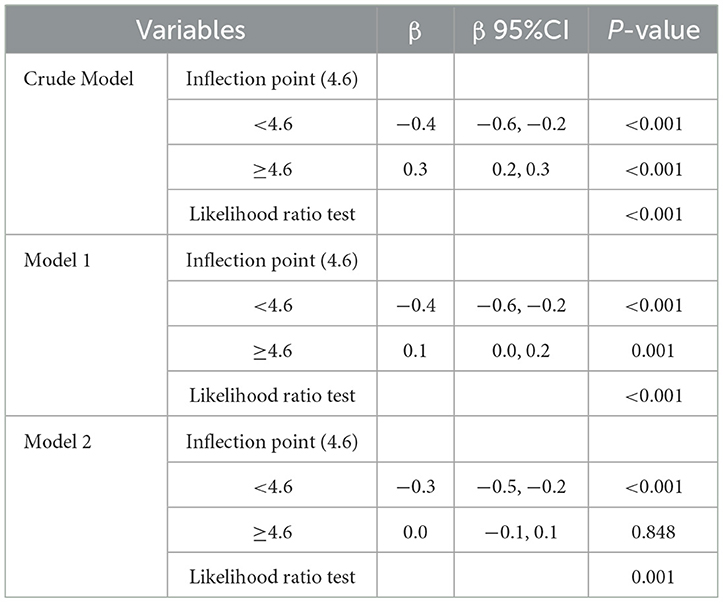
Table 2. Two-piecewise linear regression for relationship between fasting blood glucose and urea.
After full adjustment for covariates by Model 2, the smooth curve revealed an L-shaped relationship between fasting blood glucose and urea (P = 0.011) (Figure 1). In the threshold effect analysis using two piecewise regression models, we found evidence of non-linear associations between fasting blood glucose and urea (P for the log-likelihood ratio test = 0.001). After adjusting for the above covariates, the cut-off value for fasting blood glucose was 4.6 (Table 2). In participants with fasting blood glucose < 4.6 mmol/L, urea decreased with increasing fasting blood glucose (β = −0.3, 95% CI: −0.5 to −0.2, P < 0.001). However, when fasting blood glucose was ≥4.6 mmol/L, fasting blood glucose was not associated with urea (β = 0.0, 95% CI: −0.1 to 0.1, P = 0.848). Other model details are shown in Table 2. In addition, we also constructed smooth curves to estimate the relationships of fasting blood glucose with creatinine and the eGFR. The results revealed that creatinine and the eGFR were not significantly associated with blood glucose (P > 0.05) (Supplementary Figures S1, S2).
To further explore the relationship between glucose and urea, we performed a stratified analysis using different stratification variables, which were included in Model 2, except the stratification factor itself. The results are shown in Table 3. We found interactions for smoking (interaction P = 0.037) and alcohol consumption (interaction P = 0.001) in the group with low fasting blood glucose (fasting blood glucose < 4.6 mmol/L). In this group, the negative correlation between fasting blood glucose and urea disappeared in participants who did not smoke (P = 0.795) or consume alcohol (P = 0.747).
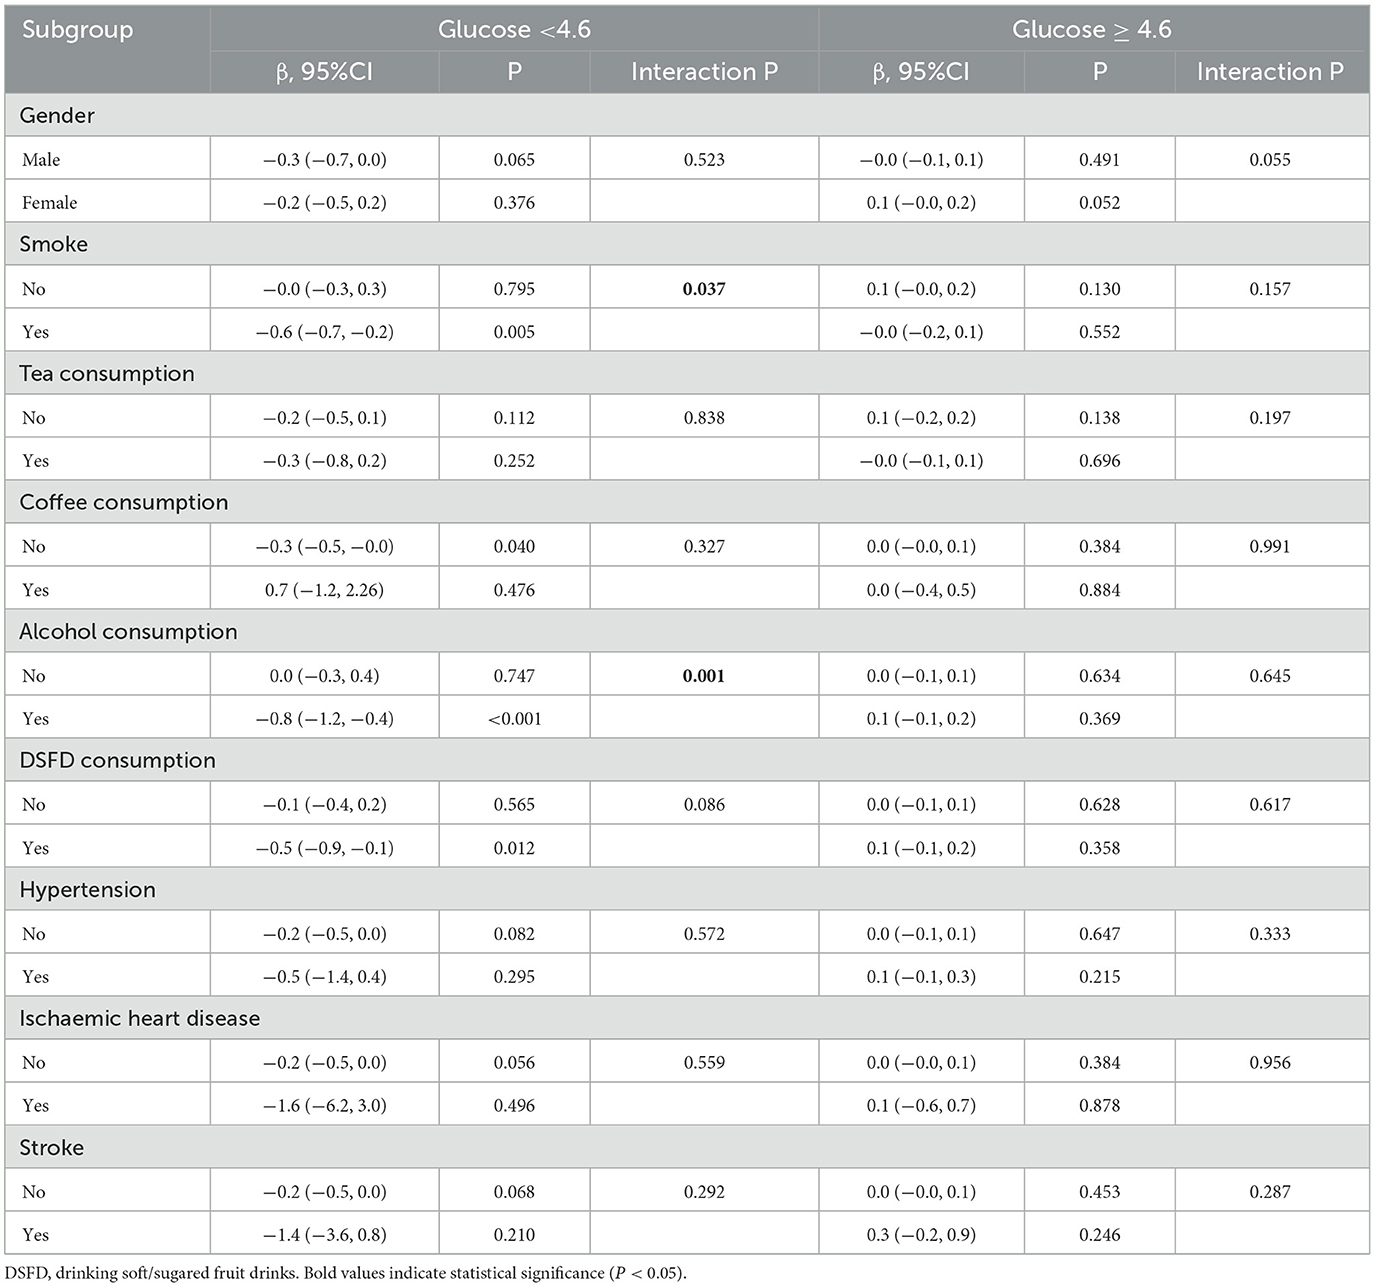
Table 3. Stratified analysis and interaction analysis.
We first found an L-shaped association between fasting blood glucose and urea in the non-diabetic population after adjusting for important identified confounders, and the cut-off for the curve was a fasting blood glucose level of 4.6 mmol/L, which is different from the previous definition of hypoglycemia (21). In addition, smoking and alcohol consumption were found to affect the association between fasting blood glucose and urea in individuals with fasting blood glucose levels lower than 4.6 mmol/L. Instead, the negative correlation between fasting blood glucose and urea disappeared in participants who did not smoke or consume alcohol.
Gluconeogenesis can be an important source of glucose when blood glucose levels decrease. This process plays a critical role in glucose homeostasis, allowing the body to synthesize glucose from non-carbohydrate substances, such as glucogenic amino acids (23). Amino acid catabolism produces a large amount of nitrogen, and gluconeogenic enzymes are expressed together with urea cycle enzymes in the liver, which means that amino acid gluconeogenesis is closely associated with ureagenesis (24). Alanine is converted to pyruvate and glutamate by alanine aminotransferase in the liver, and glutamate eliminates toxic ammonium and synthesizes excess urea through the urea cycle (23, 25). This may be one of the reasons why the urea concentration increases when blood glucose levels are low.
In addition, urea synthesis is regulated by hormones, such as glucagon (2). When the blood glucose concentration decreases, the secretion of glucagon, which plays an important role in nitrogen metabolism, can be stimulated (26). Glucagon affects urea synthesis in several ways. Glucagon stimulates gluconeogenesis to produce glucose, and during this process, the nitrogen of amino acids is excreted mainly in the form of urea (26). Additionally, glucagon increases the activity of ornithine cycle enzymes (27). Furthermore, glucagon stimulates an increase in the N-acetylglutamate concentration, which is an essential allosteric activator of the urea cycle (28, 29). Moreover, increased glucagon leads to the activation of AMP-activated protein kinase, which is involved in inhibiting protein synthesis and stimulating proteolysis and ureagenesis (30, 31). In various animal models, increased plasma glucagon concentrations increase amino acid catabolism and urea synthesis, whereas glucagon deficiency decreases amino acid clearance and urea production (30, 32). In a study of healthy male adults, hypoglycemia was associated with a doubling of glucagon levels and a significant increase in hepatic urea production (33). Another study reported increased hepatic urea synthesis during glucagon infusion in healthy adults (34).
Clearly, renal excretion of urea is an important determinant of urea concentration, and an elevated urea concentration is a marker of renal dysfunction and injury (4). Glucose levels are closely associated with renal injury, including hyperglycemia and hypoglycemia (14, 35). To investigate whether the L-shaped relationship between fasting blood glucose and urea in the non-diabetic population occurred due to renal dysfunction caused by glucose, we also implemented smooth curves to estimate the relationships of fasting blood glucose with creatinine and the eGFR. The results revealed that creatinine and the eGFR were not significantly associated with blood glucose. This finding indicates that in non-diabetic individuals, blood glucose primarily affects urea synthesis through protein metabolism rather than affecting urea excretion through renal injury. Further mechanistic studies, such as animal models or in vitro experiments are essential to elucidate underlying biological pathways.
Notably, the urea concentration may be a confounding effect of age and nutritional status, especially protein intake (4, 36). Therefore, we adjusted for multiple covariates, including protein intake, total serum protein, renal function, age and other laboratory variables, and we also performed interaction analysis to reduce the influence of confounding factors and improve the reliability of the conclusions.
Finally, we performed a stratified analysis on the basis of subgroups defined by different covariates to evaluate interactions of the independent associations between fasting blood glucose and urea. We found that in the group with high fasting blood glucose, smoking and alcohol consumption may be two significant modifiers of the relationship between fasting blood glucose and urea. A previous study of healthy Chinese adults revealed that urea levels are lower in smokers than in non-smokers, suggesting that smoking alters urea synthesis or excretion (37). For people who consume alcohol, patients with alcoholism have significantly greater urinary nitrogen and lower nitrogen balance during alcohol consumption (38). However, another study showed that alcohol downregulates urea synthesis in healthy men, which is beneficial for nitrogen preservation (39). The potential mechanisms of these controversies need further study.
This study has the following limitations. First, as a cross-sectional study, causal inferences cannot be made on the basis of the findings of this study. Future longitudinal studies are needed to validate the temporal relationship between fasting blood glucose and urea levels. Second, we only estimated the glomerular filtration rate with the formula rather than the 99mTc-DTPA renogram, which inevitably led to inaccurate results. In addition, while we maximized adjustments using all metabolism-related biomarkers available in the dataset, the absence of intervention data or supplementary biomarkers, such as physical activity levels, protein source and stress is a limitation. Finally, because the participants in the CHNS dataset were mainly from the Chinese population, the results may have certain limitations when applied to other populations. These limitations should be considered in future studies.
In conclusion, our study suggests an L-shaped association between fasting blood glucose and urea. In non-diabetic individuals, when fasting blood glucose was lower than 4.6 mmol/L, it had a strong negative correlation with urea. The relationship disappeared when the fasting glucose concentration was >4.6 mmol/L.
Publicly available datasets were analyzed in this study. This data can be found here: http://www.cpc.unc.edu/projects/china.
The CHNS was approved by the institutional review boards of the University of North Carolina at Chapel Hill and the National Institute for Nutrition and Health at the Chinese Center for Disease Control and Prevention. The studies were conducted in accordance with the local legislation and institutional requirements. The participants provided their written informed consent to participate in this study.
CW: Conceptualization, Data curation, Formal analysis, Methodology, Writing – original draft. ZX: Writing – original draft, Writing – review & editing, Conceptualization, Data curation, Methodology. XC: Writing – review & editing, Formal analysis. HL: Writing – review & editing. YC: Validation, Writing – review & editing. JH: Validation, Writing – review & editing. TL: Writing – review & editing. ZH: Funding acquisition, Project administration, Supervision, Validation, Writing – review & editing.
The author(s) declare financial support was received for the research and/or publication of this article. This research was funded by the National Natural Science Foundation of China (No. 82360171); the Science and Technology Project of Health Commission of Jiangxi Province (No. 202410254); and the Science and Technology Project of Jiangxi Provincial Administration of Traditional Chinese Medicine (No. 2023A0337).
This research uses data from CHNS. We thank the National Institute of Nutrition and Food Safety, China Center for Disease Control and Prevention, Carolina Population Center, the University of North Carolina at Chapel Hill, and the China-Japan Friendship Hospital for support for CHNS 2009 and future surveys.
The authors declare that the research was conducted in the absence of any commercial or financial relationships that could be construed as a potential conflict of interest.
The author(s) declare that no Gen AI was used in the creation of this manuscript.
All claims expressed in this article are solely those of the authors and do not necessarily represent those of their affiliated organizations, or those of the publisher, the editors and the reviewers. Any product that may be evaluated in this article, or claim that may be made by its manufacturer, is not guaranteed or endorsed by the publisher.
The Supplementary Material for this article can be found online at: https://www.frontiersin.org/articles/10.3389/fnut.2025.1504855/full#supplementary-material
1. Kim HJ, Kim TE, Han M, Yi Y, Jeong JC, Chin HJ, et al. Effects of blood urea nitrogen independent of the estimated glomerular filtration rate on the development of anemia in non-dialysis chronic kidney disease: the results of the know-Ckd study. PLoS ONE. (2021) 16:e0257305. doi: 10.1371/journal.pone.0257305
3. Adeyomoye OI, Akintayo CO, Omotuyi KP, Adewumi AN. The biological roles of urea: a review of preclinical studies. Indian J Nephrol. (2022) 32:539–45. doi: 10.4103/ijn.ijn_88_21
4. Seki M, Nakayama M, Sakoh T, Yoshitomi R, Fukui A, Katafuchi E, et al. Blood urea nitrogen is independently associated with renal outcomes in Japanese patients with stage 3-5 chronic kidney disease: a prospective observational study. BMC Nephrol. (2019) 20:115. doi: 10.1186/s12882-019-1306-1
5. Du J, Zhang W, Niu J, Wang S. Association between blood urea nitrogen levels and the risk of diabetes mellitus in Chinese adults: secondary analysis based on a multicenter, retrospective cohort study. Front Endocrinol. (2024) 15:1282015. doi: 10.3389/fendo.2024.1282015
6. Zhong JB, Yao YF, Zeng GQ, Zhang Y, Ye BK, Dou XY, et al. A closer association between blood urea nitrogen and the probability of diabetic retinopathy in patients with shorter type 2 diabetes duration. Sci Rep. (2023) 13:9881. doi: 10.1038/s41598-023-35653-z
7. Duan S, Li Y, Yang P. Predictive value of blood urea nitrogen in heart failure: a systematic review and meta-analysis. Front Cardiov Med. (2023) 10:1189884. doi: 10.3389/fcvm.2023.1189884
8. You S, Zheng D, Zhong C, Wang X, Tang W, Sheng L, et al. Prognostic significance of blood urea nitrogen in acute ischemic stroke. Circ J. (2018) 82:572–8. doi: 10.1253/circj.CJ-17-0485
9. Tatlisu MA, Kaya A, Keskin M, Avsar S, Bozbay M, Tatlisu K, et al. The association of blood urea nitrogen levels with mortality in acute pulmonary embolism. J Crit Care. (2017) 39:248–53. doi: 10.1016/j.jcrc.2016.12.019
10. Vanholder R, Gryp T, Glorieux G. Urea and chronic kidney disease: the comeback of the century? (in Uraemia Research). Nephrol Dial Transplant. (2018) 33:4–12. doi: 10.1093/ndt/gfx039
11. Lau WL, Vaziri ND. Urea, a true uremic toxin: the empire strikes back. Clin Sci (Lond). (2017) 131:3–12. doi: 10.1042/CS20160203
12. Lee YL, Chen BK, Lin KD, Su RW, Lee MY, Hsiao PJ, et al. The impact of severe hypoglycemia on renal impairment in type 2 diabetes. Diabetes Res Clin Pract. (2015) 108:448–55. doi: 10.1016/j.diabres.2015.02.028
13. Patrick AW, Hepburn DA, Swainson CP, Frier BM. Changes in renal function during acute insulin-induced hypoglycaemia in patients with type 1 diabetes. Diabet Med. (1992) 9:150–5. doi: 10.1111/j.1464-5491.1992.tb01752.x
14. Petrazzuolo A, Sabiu G, Assi E, Maestroni A, Pastore I, Lunati ME, et al. Broadening horizons in mechanisms, management, and treatment of diabetic kidney disease. Pharmacol Res. (2023) 190:106710. doi: 10.1016/j.phrs.2023.106710
15. Huang L, Wang Z, Pan Y, Zhou K, Zhong S. Correlation between blood urea nitrogen and short- and long-term glycemic variability in elderly patients with type 2 diabetes mellitus who were hospitalized: a retrospective study. Diabetes Metab Syndr Obes. (2024) 17:1973–86. doi: 10.2147/DMSO.S458084
16. Viswanathan V, Tilak P, Kumpatla S. Risk factors associated with the development of overt nephropathy in type 2 diabetes patients: a 12 years observational study. Indian J Med Res. (2012) 136:46–53.
17. Tang L, Li L, Bu L, Guo S, He Y, Liu L, et al. Bigu-style fasting affects metabolic health by modulating taurine, glucose, and cholesterol homeostasis in healthy young adults. J Nutr. (2021) 151:2175–87. doi: 10.1093/jn/nxab123
18. Maughan RJ, Leiper JB, Bartagi Z, Zrifi R, Zerguini Y, Dvorak J. Effect of ramadan fasting on some biochemical and haematological parameters in tunisian youth soccer players undertaking their usual training and competition schedule. J Sports Sci. (2008) 26 Suppl 3:S39–46. doi: 10.1080/02640410802491368
19. Popkin BM, Du S, Zhai F, Zhang B. Cohort Profile: The China health and nutrition survey–monitoring and understanding socio-economic and health change in China, 1989-2011. Int J Epidemiol. (2010) 39:1435–40. doi: 10.1093/ije/dyp322
20. Levey AS, Coresh J, Greene T, Stevens LA, Zhang YL, Hendriksen S, et al. Using standardized serum creatinine values in the modification of diet in renal disease study equation for estimating glomerular filtration rate. Ann Intern Med. (2006) 145:247–54. doi: 10.7326/0003-4819-145-4-200608150-00004
21. Chinese Diabetes Society National Office for Primary Diabetes Care. National Guidelines for the Prevention and Control of Diabetes in Primary Care. Zhonghua Nei Ke Za Zhi. (2018) 57:885–93. doi: 10.3760/cma.j.issn.0578-1426.2018.12.003
22. Zhang Z. Missing data imputation: focusing on single imputation. Ann Transl Med. (2016) 4:9. doi: 10.3978/j.issn.2305-5839.2015.12.38
23. Holeček M. Roles of malate and aspartate in gluconeogenesis in various physiological and pathological states. Metabolism. (2023) 145:155614. doi: 10.1016/j.metabol.2023.155614
24. Holeček M. Origin and roles of alanine and glutamine in gluconeogenesis in the liver, kidneys, and small intestine under physiological and pathological conditions. Int J Molec Sci. (2024) 25:7037. doi: 10.3390/ijms25137037
25. Karimi R, Cleven A, Elbarbry F, Hoang H. The impact of fasting on major metabolic pathways of macronutrients and pharmacokinetics steps of drugs. Eur J Drug Metab Pharmacokinet. (2021) 46:25–39. doi: 10.1007/s13318-020-00656-y
26. Bankir L, Bouby N, Speth RC, Velho G, Crambert G. Glucagon revisited: coordinated actions on the liver and kidney. Diabetes Res Clin Pract. (2018) 146:119–29. doi: 10.1016/j.diabres.2018.10.004
27. Galsgaard KD, Pedersen J, Kjeldsen SAS, Winther-Sørensen M, Stojanovska E, Vilstrup H, et al. Glucagon receptor signaling is not required for n-carbamoyl glutamate- and l-citrulline-induced ureagenesis in mice. Am J Physiol Gastroint Liver Physiol. (2020) 318:G912–27. doi: 10.1152/ajpgi.00294.2019
28. Hensgens HE, Verhoeven AJ, Meijer AJ. The relationship between intramitochondrial n-acetylglutamate and activity of carbamoyl-phosphate synthetase (ammonia). The Effect of Glucagon. Eur J Biochem. (1980) 107:197–205. doi: 10.1111/j.1432-1033.1980.tb04640.x
29. Nissim I, Yudkoff M, Brosnan JT. Regulation of [15n]Urea synthesis from [5-15n]Glutamine. Role of Ph, hormones, and pyruvate. J Biol Chem. (1996) 271:31234–42. doi: 10.1074/jbc.271.49.31234
30. Kraft G, Coate KC, Winnick JJ, Dardevet D, Donahue EP, Cherrington AD, et al. Glucagon's effect on liver protein metabolism in vivo. Am J Physiol Endocrinol Metabol. (2017) 313:E263–72. doi: 10.1152/ajpendo.00045.2017
31. Hasenour CM, Berglund ED, Wasserman DH. Emerging role of amp-activated protein kinase in endocrine control of metabolism in the liver. Mol Cell Endocrinol. (2013) 366:152–62. doi: 10.1016/j.mce.2012.06.018
32. Winther-Sørensen M, Galsgaard KD, Santos A, Trammell SAJ, Sulek K, Kuhre RE, et al. Glucagon acutely regulates hepatic amino acid catabolism and the effect may be disturbed by steatosis. Molec Metabol. (2020) 42:101080. doi: 10.1016/j.molmet.2020.101080
33. Grøfte T, Wolthers T, Jørgensen JO, Poulsen PL, Vilstrup H, Møller N. Hepatic amino- to urea-N clearance and forearm amino-n exchange during hypoglycemic and euglycemic hyperinsulinemia in normal man. J Hepatol. (1999) 30:819–25. doi: 10.1016/S0168-8278(99)80134-2
34. Hamberg O, Vilstrup H. Regulation of urea synthesis by glucose and glucagon in normal man. Clin Nutr. (1994) 13:183–91. doi: 10.1016/0261-5614(94)90099-X
35. Tsujimoto T, Yamamoto-Honda R, Kajio H, Kishimoto M, Noto H, Hachiya R, et al. Accelerated decline of renal function in type 2 diabetes following severe hypoglycemia. J Diab Complic. (2016) 30:681–5. doi: 10.1016/j.jdiacomp.2016.01.015
36. Schutz Y. Protein turnover, ureagenesis and gluconeogenesis. Int J Vitam Nutr Res. (2011) 81:101–7. doi: 10.1024/0300-9831/a000064
37. Huang X, Li S, Yang X, Peng Q, Wang J, Mo C, et al. Establishing reference values for blood urea nitrogen and serum creatinine in Chinese Han ethnic adult men. Clin Lab. (2014) 60:1123–8. doi: 10.7754/Clin.Lab.2013.130530
38. Bunout D, Petermann M, Ugarte G, Barrera G, Iturriaga H. Nitrogen economy in alcoholic patients without liver disease. Metabolism. (1987) 36:651–3. doi: 10.1016/0026-0495(87)90148-X
Keywords: urea, fasting blood glucose, non-diabetic population, protein, association
Citation: Wu C, Xu Z, Chen X, Liu H, Chen Y, Huang J, Lu T and Huang Z (2025) L-shaped association between fasting blood glucose and urea in a non-diabetic population. Front. Nutr. 12:1504855. doi: 10.3389/fnut.2025.1504855
Received: 01 October 2024; Accepted: 10 March 2025;
Published: 24 March 2025.
Edited by:
Sonia Q. Doi, Uniformed Services University of the Health Sciences, United StatesReviewed by:
Maroof Alam, University of Michigan, United StatesCopyright © 2025 Wu, Xu, Chen, Liu, Chen, Huang, Lu and Huang. This is an open-access article distributed under the terms of the Creative Commons Attribution License (CC BY). The use, distribution or reproduction in other forums is permitted, provided the original author(s) and the copyright owner(s) are credited and that the original publication in this journal is cited, in accordance with accepted academic practice. No use, distribution or reproduction is permitted which does not comply with these terms.
*Correspondence: Zixi Huang, aHp4a2Vua29mQDE2My5jb20=
†These authors have contributed equally to this work and share first authorship
Disclaimer: All claims expressed in this article are solely those of the authors and do not necessarily represent those of their affiliated organizations, or those of the publisher, the editors and the reviewers. Any product that may be evaluated in this article or claim that may be made by its manufacturer is not guaranteed or endorsed by the publisher.
Research integrity at Frontiers
Learn more about the work of our research integrity team to safeguard the quality of each article we publish.