 Xiangyong Li
 Zeyang Zhou
 Xiaoyang Zhang
 Chungen Xing
94% of researchers rate our articles as excellent or good
Learn more about the work of our research integrity team to safeguard the quality of each article we publish.
Find out more
ORIGINAL RESEARCH article
Front. Nutr. , 03 March 2025
Sec. Clinical Nutrition
Volume 12 - 2025 | https://doi.org/10.3389/fnut.2025.1473952
Objectives: The composition of abdominal adipose tissue and muscle mass has been strongly correlated with the prognosis of rectal cancer. This study aimed to develop and validate a machine learning (ML) predictive model for 3-year all-cause mortality after laparoscopic total mesorectal excision (LaTME).
Methods: Patients who underwent LaTME surgery between January 2018 and December 2020 were included and randomly divided into training and validation cohorts. Preoperative computed tomography (CT) image parameters and clinical characteristics were collected to establish seven ML models for predicting 3-year survival post-LaTME. The optimal model was determined based on the area under the receiver operating characteristic curve (AUROC). The SHAPley Additive exPlanations (SHAP) values were utilized to interpret the optimal model.
Results: A total of 186 patients were recruited and divided into a training cohort (70%, n = 131) and a validation cohort (30%, n = 55). In the training cohort, the AUROCs of the seven ML models ranged from 0.894 to 0.949. In the validation cohort, the AUROCs ranged from 0.727 to 0.911, with the XGBoost model demonstrating the best predictive performance: AUROC = 0.911. SHAP values revealed that subcutaneous adipose tissue index (SAI), visceral adipose tissue index (VAI), skeletal muscle density (SMD), visceral-to-subcutaneous adipose tissue ratio (VSR), and subcutaneous adipose tissue density (SAD) were the five most important variables influencing all-cause mortality post-LaTME.
Conclusion: By integrating body composition, multiple ML predictive models were developed and validated for predicting all-cause mortality after rectal cancer surgery, with the XGBoost model exhibiting the best performance.
According to statistics, colorectal cancer ranks third among malignancies in terms of incidence and is the second leading cause of cancer-related deaths, with rectal cancer specifically occupying the eighth position and accounting for one-third of all colorectal malignancy cases (1, 2). Importantly, survival rates for patients diagnosed at early to intermediate stages decline with advancing tumor stages (3), underscoring the critical need for accurate prognosis prediction in this patient population.
The classical Tumor-Node-Metastasis (TNM) staging system is the primary basis for evaluating prognosis and guiding treatment strategies in rectal cancer patients (4). However, this system’s precision and reliability remain insufficient to fully meet the comprehensive demands of clinical practice (5, 6). Consequently, there is a pressing need to explore and incorporate multidimensional biomarkers and clinical indicators to optimize further and refine the prognostic prediction framework for rectal cancer. Research has demonstrated that the content and proportions of visceral adipose tissue, subcutaneous adipose tissue, and skeletal muscle are correlated with clinical outcomes in colorectal cancer patients, exerting substantial influences on disease onset, progression, and prognosis (7–9). These tissue areas and densities can be conveniently and accurately obtained through preoperative CT/MR imaging modalities (10, 11).
In recent years, machine learning (ML), a novel form of artificial intelligence (AI), has gained increasing prominence in data mining and has been widely applied in medical data analysis due to its prowess in handling large datasets (12, 13). Prior studies have predominantly focused on the relationship between individual or multiple abdominal components and rectal cancer prognosis (9–11), as well as the development and validation of predictive models such as nomograms (14, 15). Nevertheless, there is a paucity of reports regarding the integration of abdominal adipose tissue and muscle with ML models to predict postoperative outcomes following LaTME.
Thus, we aim to develop a model that predicts 3-year all-cause mortality in patients after LaTME. This model has the potential to facilitate the early identification of patients with shorter survival prognoses, enabling timely interventions for optimal survival outcomes. Furthermore, we aspire for this model to guide the formulation of standardized nutritional protocols and the refinement of nutritional therapies.
This study enrolled 186 patients who underwent LaTME from January 2018 to December 2020 in the Gastrointestinal Surgery Department of the Second Affiliated Hospital of Soochow University. Inclusion criteria were: (1) preoperative pathological diagnosis confirming rectal cancer; (2) complete CT scans and clinical data within 2 weeks prior to surgery; and (3) surgical approach being LaTME.
Exclusion criteria were: (1) emergency surgery; (2) open surgery; (3) preoperative adjuvant therapies such as radiotherapy or chemotherapy; and (4) clinical stage IV or inoperable cases due to massive tumors (Figure 1). All procedures performed in this study adhered to the principles outlined in the Declaration of Helsinki of 1964. Studies involving human subjects were reviewed and approved by the Ethics Committee of the Second Affiliated Hospital of Soochow University (NO: JD-HG-2024-037).
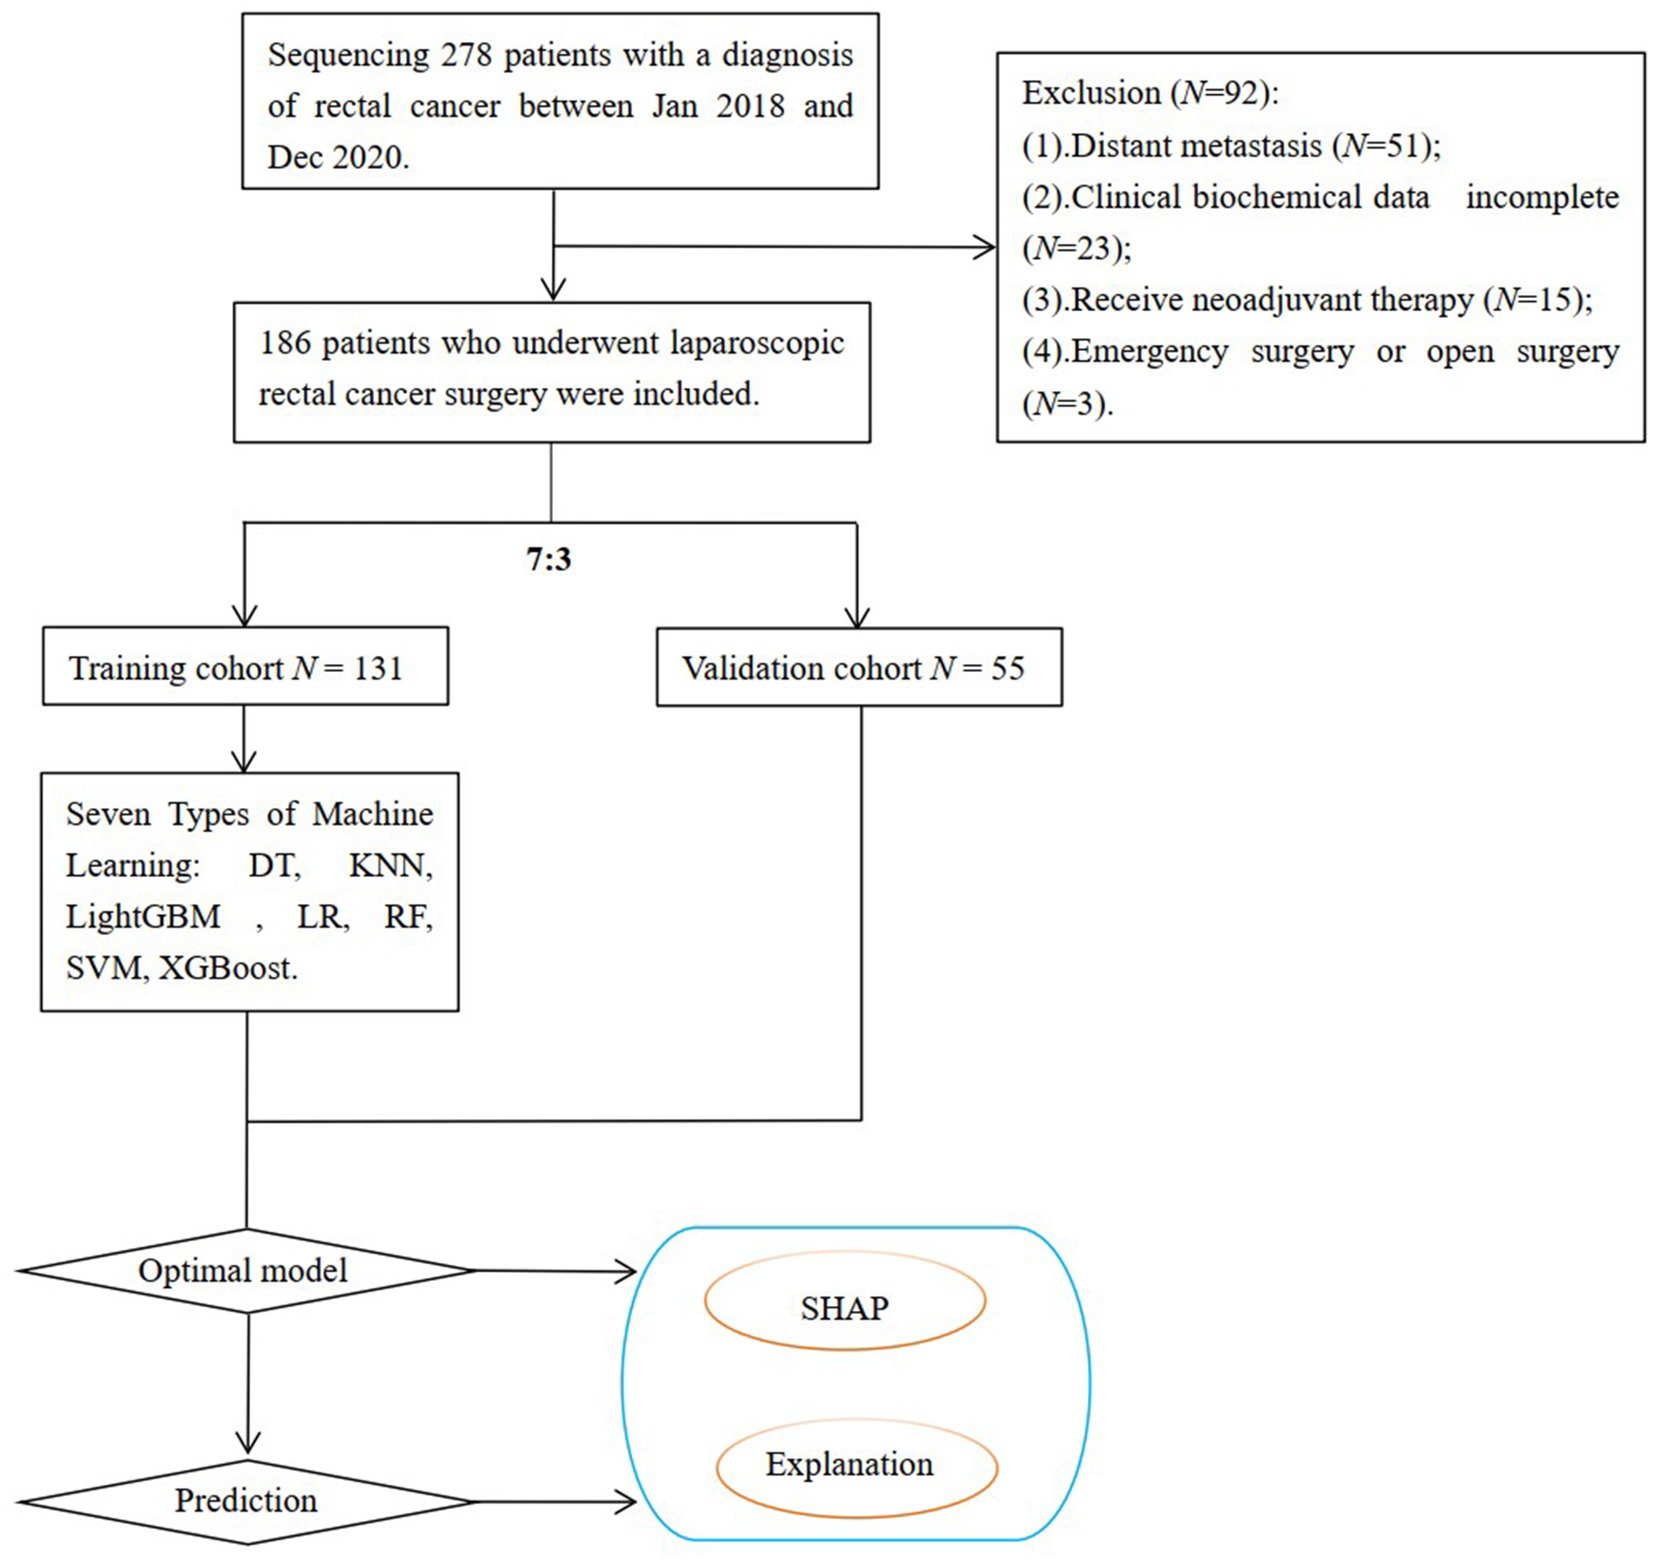
Figure 1. Flowchart of the study.
For the patients included in this study, the following indicators were retrospectively collected from our hospital’s electronic medical record system:
1. Baseline Characteristics of the Patients: Age, gender, comorbidities (hypertension, diabetes), postoperative adjuvant therapy, operative duration, and postoperative hospital stay.
2. CT Measurement Parameters: Skeletal muscle index (SMI), subcutaneous adipose tissue index (SAI), visceral adipose tissue index (VAI), skeletal muscle density (SMD), subcutaneous adipose tissue density (SAD), visceral adipose tissue density (VAD), and visceral-to-subcutaneous adipose tissue area ratio (VSR).
3. Blood Laboratory Indicators: Albumin-to-alkaline phosphatase ratio (AAPR) (16), inflammatory burden index (IBI) (17), prognostic nutritional index (PNI) (18), and carcinoembryonic antigen (CEA).
4. Pathological Characteristics: TNM staging, nerve invasion, vascular invasion, and lymph node positivity ratio (LNR). No significant correlations were observed among these variables (Figure 2).
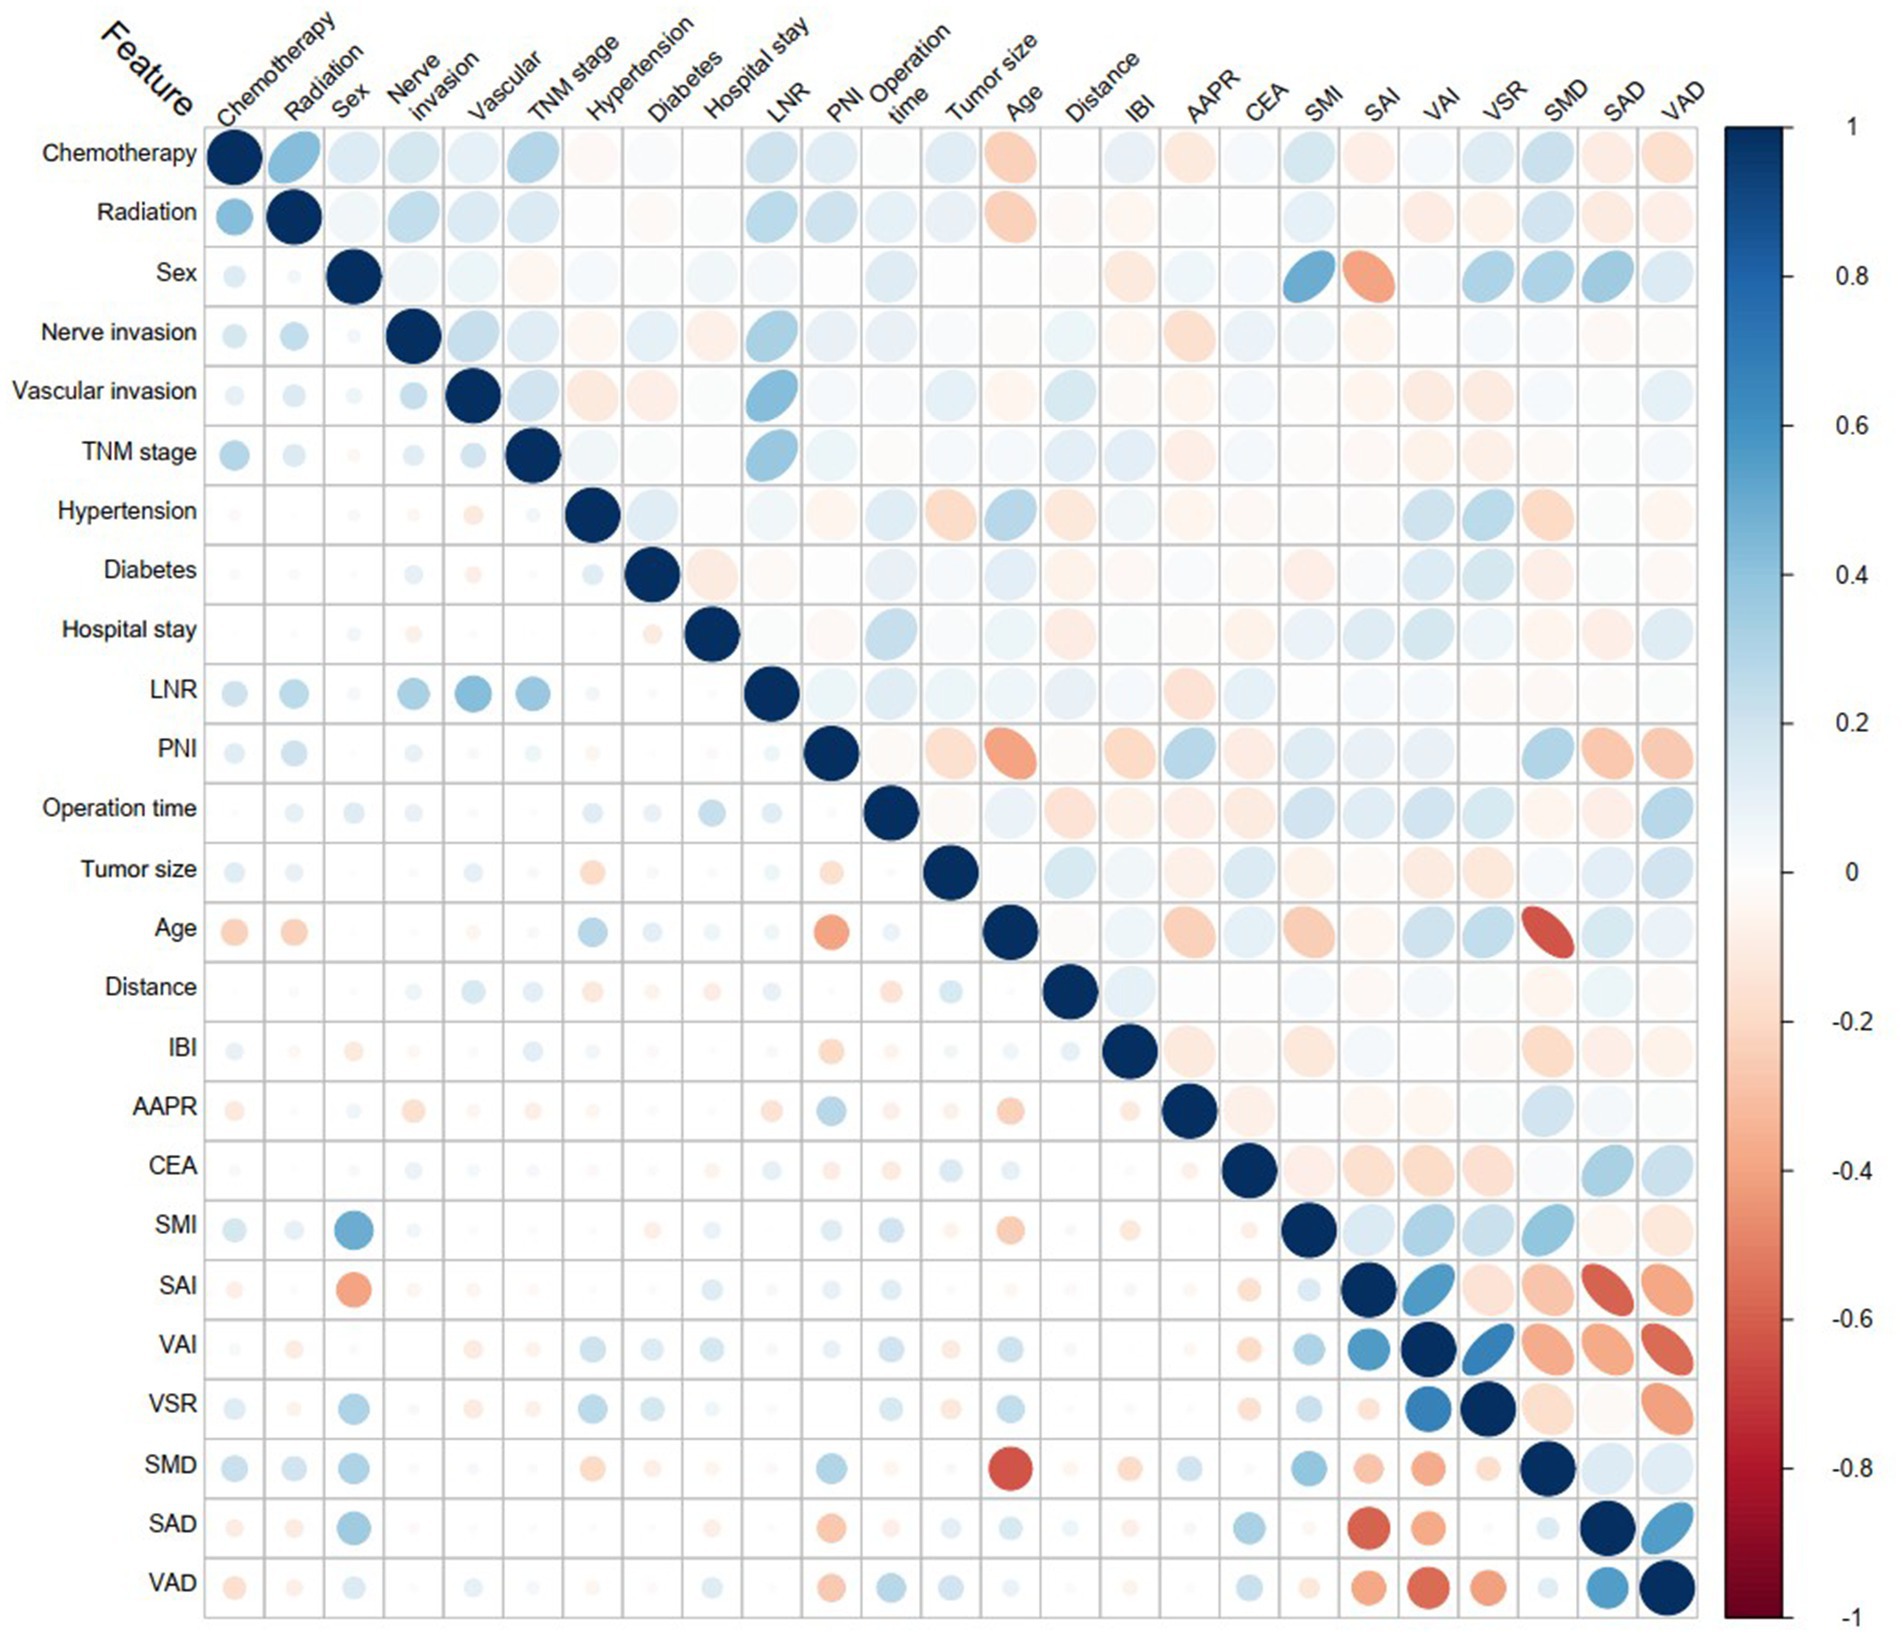
Figure 2. Variable correlation heatmap. The blue color represents positive correlation, while red indicates negative correlation. The intensity of the color signifies the strength of the correlation.
For the analysis of body composition, Slice-O-Matic software (V5.0; TomoVision) was employed to calculate visceral adipose tissue (VAT) and subcutaneous adipose tissue (SAT) parameters at the L4-L5 intervertebral disc level, using two consecutive CT transverse slices (5 mm apart) and averaging the results. Anatomical knowledge and tissue-specific Hounsfield unit (HU) ranges were applied to delineate cross-sectional areas, with skeletal muscle ranging from −29 to +150 HU, VAT from −150 to −50 HU, and SAT from −190 to −30 HU (10). Additionally, the mean radiodensity of each tissue was obtained. For each patient’s CT, two individuals (Li and Zhou), trained in the software’s usage, independently outlined the target regions, and the average of their measurements was taken. In cases of significant discrepancy, a third party verified the outlines (Supplementary Figure S1).
The SMI, SAI, and VAI were derived using normalized areas of skeletal muscle, SAT, and VAT, respectively. Skeletal muscle tissue density (SMD), subcutaneous adipose tissue density (SAD), and visceral adipose tissue density (VAD) were obtained by averaging the radiodensity across the total cross-sectional area based on preoperative CT scans. The visceral-to-subcutaneous fat area ratio (VSR) was calculated to assess visceral obesity (19).
This study employed a combined approach of outpatient revisit and telephone follow-up. The initial follow-up was conducted 1 month post-surgery, followed by visits every 1–3 months during the first postoperative year, transitioning to every 6 months in the second year. From the third year onwards, annual follow-ups were scheduled. The follow-up period concluded in December 2023 or upon the patient’s demise, with the primary outcome measure being survival outcome (alive or dead) at the 3-year post-operative mark.
Patients were randomly assigned in a 7:3 ratio to a training cohort (n = 131) and a validation cohort (n = 55). We leveraged ML models, including Decision Tree (DT), K-Nearest Neighbors (KNN), Light Gradient Boosting Machine (LightGBM), Logistic Regression (LR), Random Forest (RF), Support Vector Machine (SVM), and Extreme Gradient Boosting (XGBoost), to construct and validate our models. Grid search, coupled with 5-fold cross-validation, was employed to identify optimal parameters for each of the seven ML models, optimizing for the area under the receiver operating characteristic curve (AUROC). We calculated sensitivity, specificity, accuracy, positive predictive value (PPV), negative predictive value (NPV), recall, and F-score to comprehensively evaluate model performance.
In comparing the predictive performance of these ML models, we relied on AUROC as well as a composite assessment of multiple metrics to gauge the overall efficacy. Regarding model interpretability, we utilized Shapley Additive exPlanations (SHAP) values to elucidate the clarity and explainability of the best-performing model. Specifically, we generated SHAP beeswarm plots ranking the predictive variables based on the optimal model selected, thereby facilitating insight into their relative importance. In addition, we elucidate the effect of individual attributes on the predictive power of the optimal model, thus providing a localized explanation.
All statistical analyses and visualizations in this study were conducted using the R programming language (version 4.4.1). The normality of continuous variables was assessed using the Shapiro–Wilk test and Q-Q plots. Descriptive statistics for normally distributed variables are presented as mean ± standard deviation [mean (SD)], whereas median and interquartile range (median [IQR]) are reported for non-normally distributed variables. Categorical variables are expressed as absolute numbers and percentages [n (%)]. The Student’s t-test was employed for comparisons of continuous variables, and the chi-squared (χ2) test was used for categorical variables. Statistical significance was set at a two-sided p-value of <0.05.
A total of 186 patients were recruited for this study, comprising 112 males (60.22%) and 74 females (39.78%). The median age was 66 years. At the 3-year postoperative follow-up, 146 patients were alive, while 40 had deceased. Among the participants, 76 had comorbid hypertension, and 21 had diabetes. Supplementary Table S1 summarizes the baseline characteristics comparison between different survival outcomes. Notably, no significant differences were observed in clinical features and CT parameters between the training cohort and the validation cohort (p > 0.05) (Table 1).
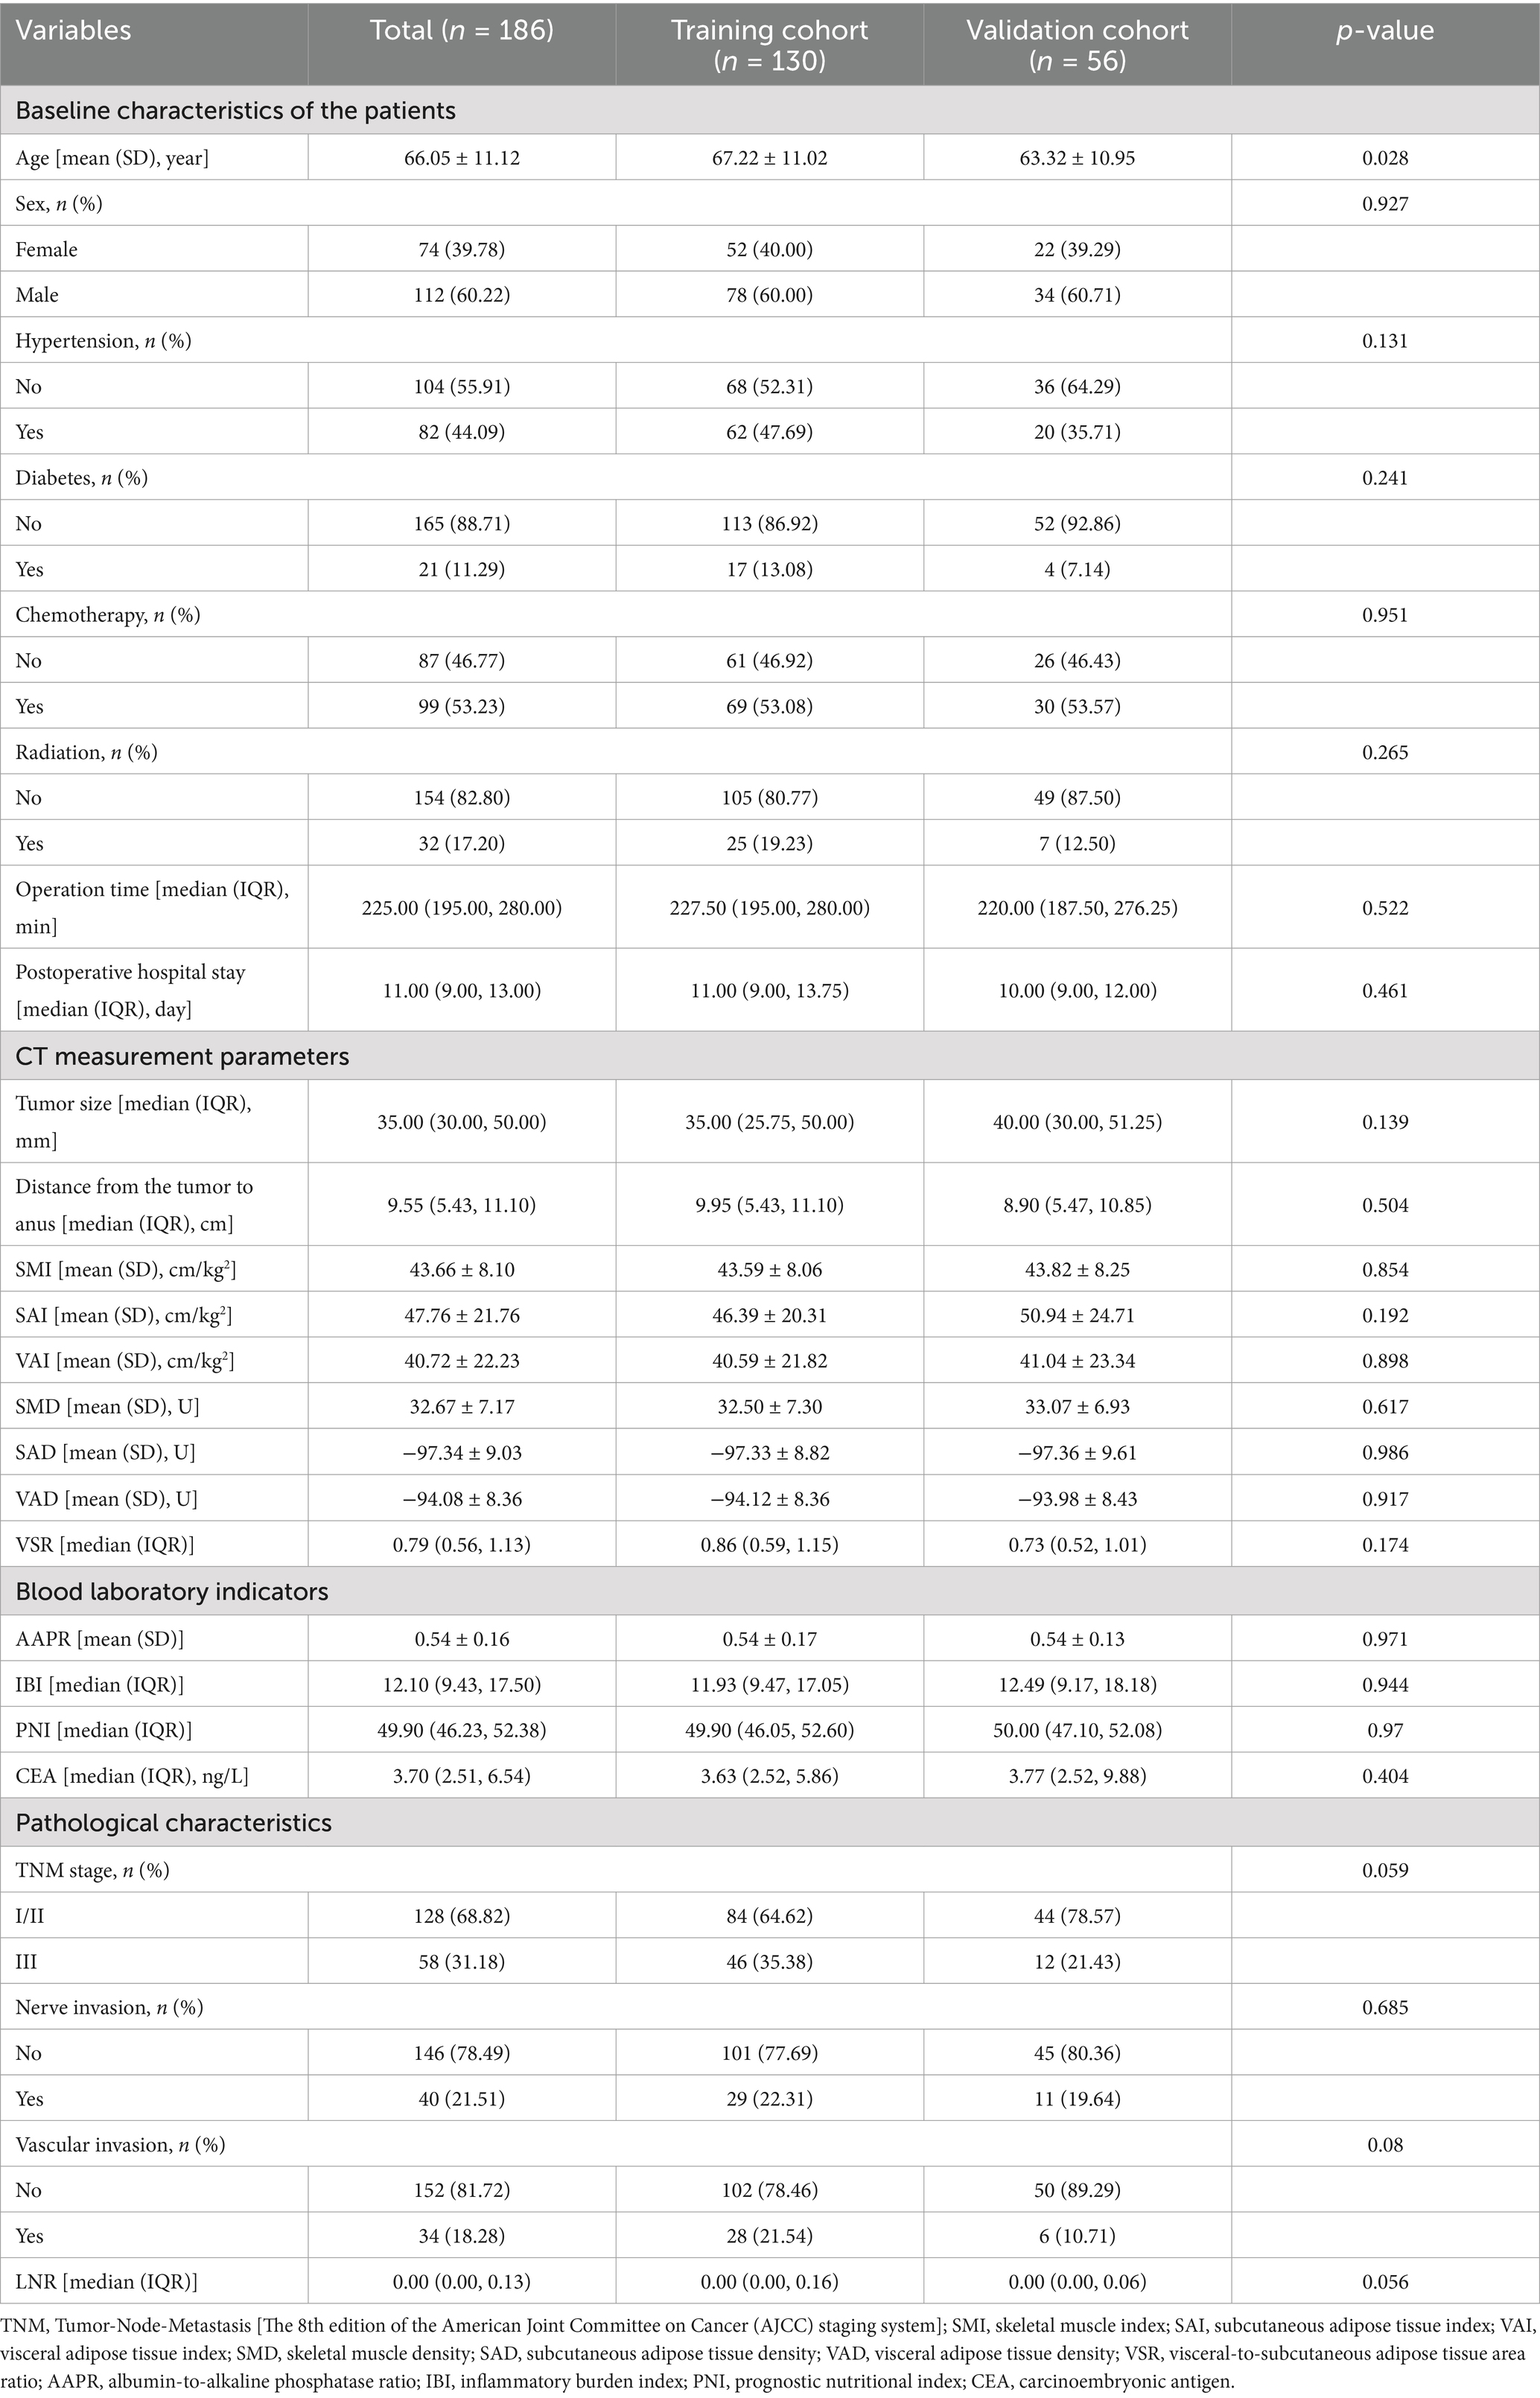
Table 1. Baseline patient characteristics.
A total of 186 patients were enrolled and randomly assigned to a training cohort (n = 131) and a validation cohort (n = 55) in a 7:3 ratio. Seven machine learning models were selected for this study: DT, KNN, LightGBM, LR, RF, SVM, and XGBoost. Among these, LR exhibited the optimal performance in the training cohort, with an AUROC of 0.949 (Supplementary Table S2). Conversely, in the validation cohort, XGBoost surpassed the others, achieving an AUROC of 0.911 (Figure 3).
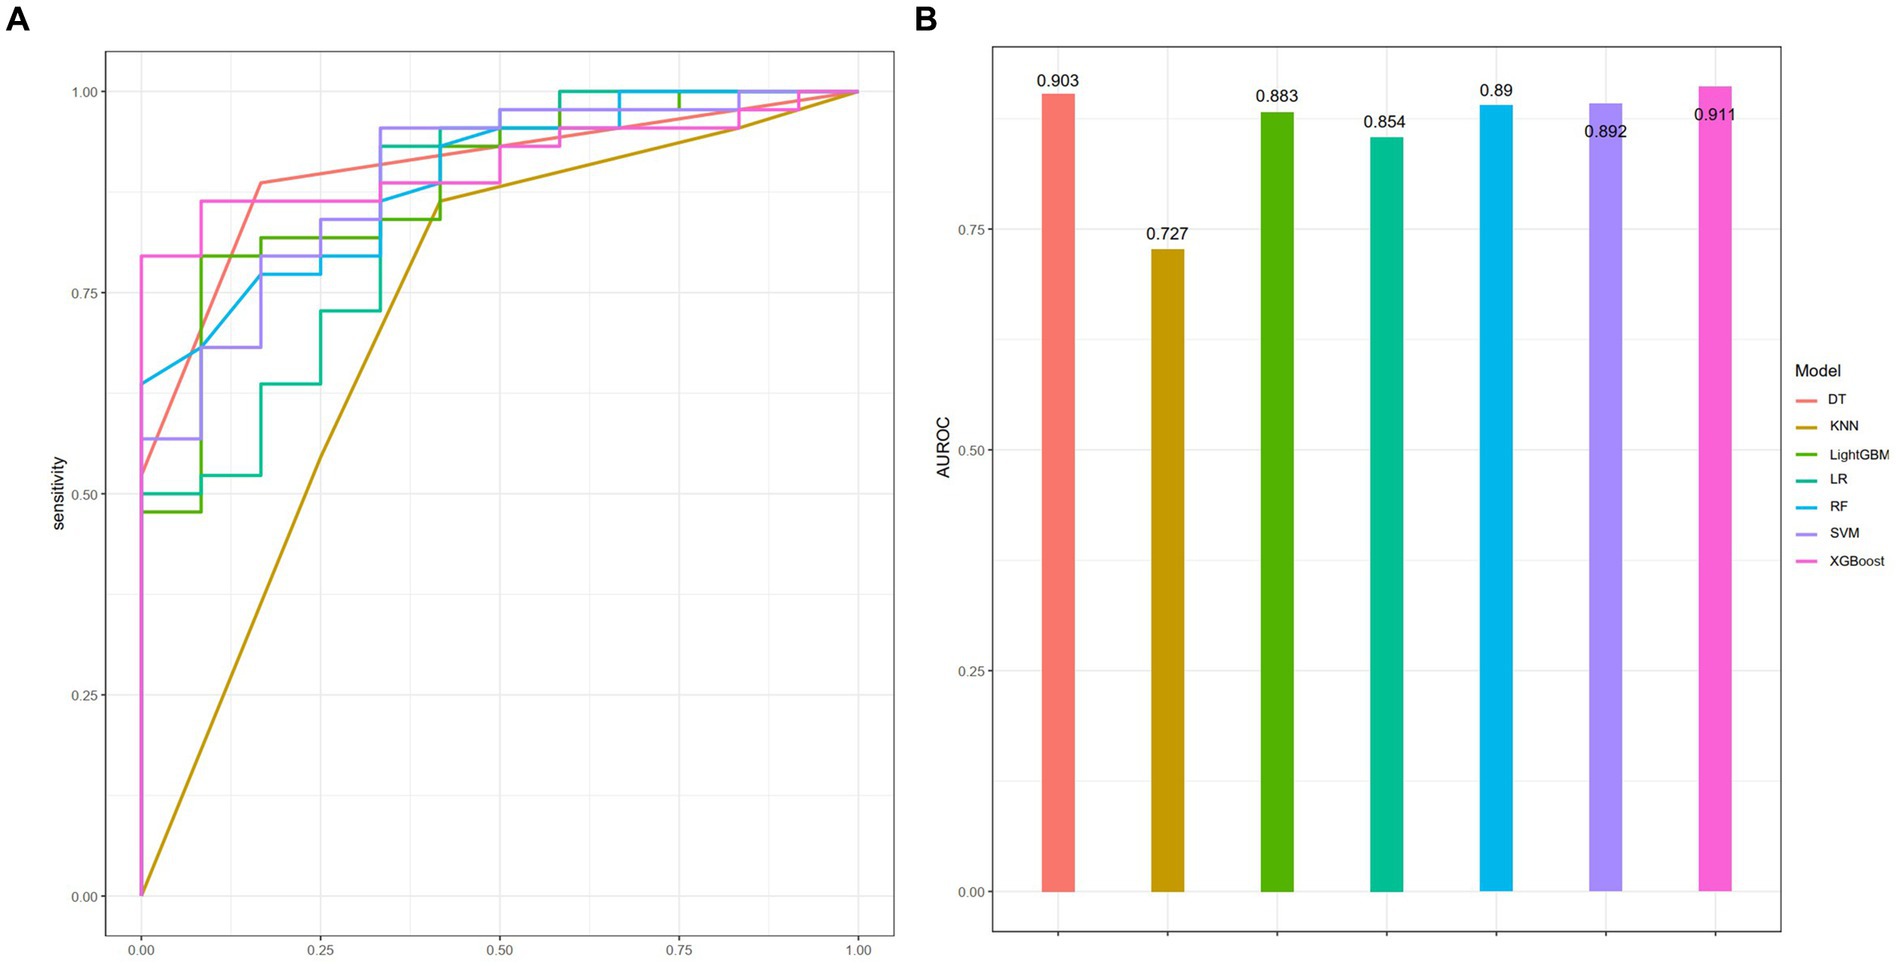
Figure 3. Performance of seven ML models in the training cohort as assessed by the AUROC (A), with corresponding visual representation in a bar chart (B).
To assess the predictive efficacies of these seven models, we employed the DeLong test, which revealed that only the KNN model displayed a statistically significant difference in predictive performance compared to the rest (p < 0.05). The calibration curve and DCA for each model are presented in Supplementary Figures S2, S3, respectively. All other models, without notable variations among themselves, demonstrated superior predictive capabilities (Supplementary Table S3). Considering the AUROC, sensitivity, and other pertinent metrics in the validation set (Table 2), XGBoost stood out as the most performant mode. Consequently, XGBoost was chosen for further predictive analysis and exploration.
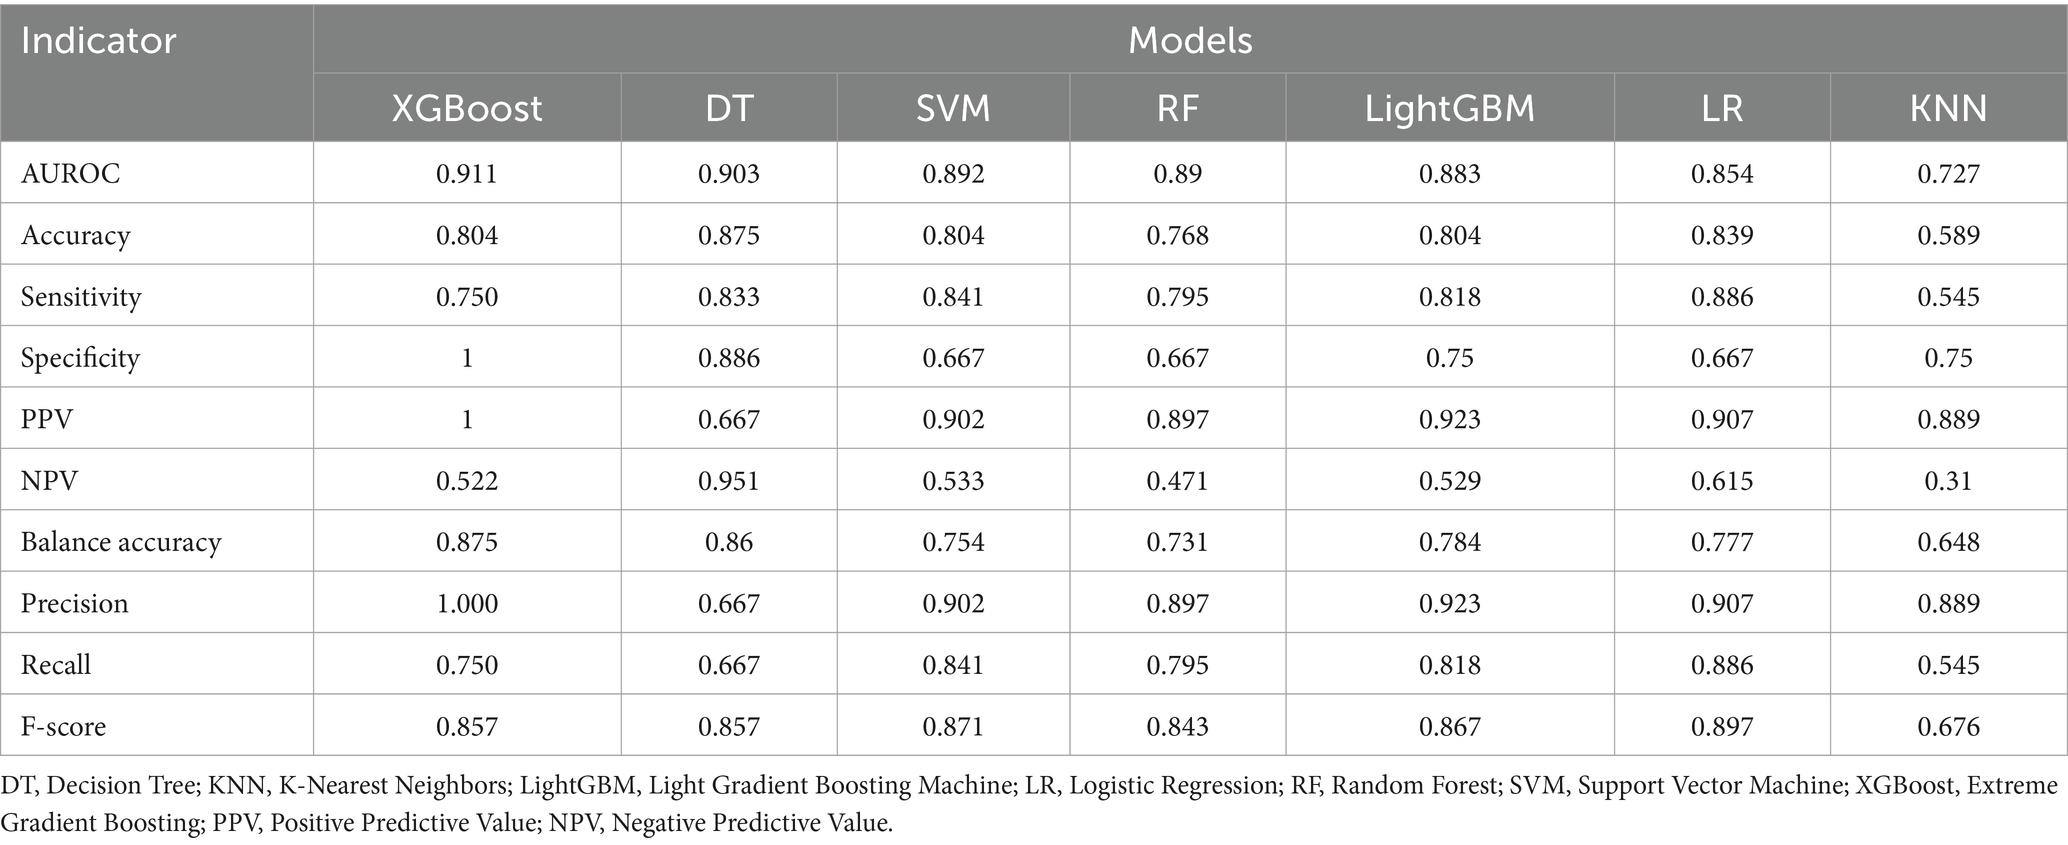
Table 2. Evaluate the predictive performance of seven ML models in the validation cohort.
As XGBoost emerged as the optimal model for predicting all-cause mortality in rectal cancer, Figure 4A presents the ranking of feature importance within the XGBoost model. The top five most influential features of the XGBoost model are SAI, VAI, SMD, VSR, and SAD. Furthermore, Figure 4B depicts how individual features contribute to the predictive effect on the dependent variable within the model, with each point representing the SHAP value of a specific feature for a sample. Figure 5 illustrates the trends in how these five features impact the model’s predictions.
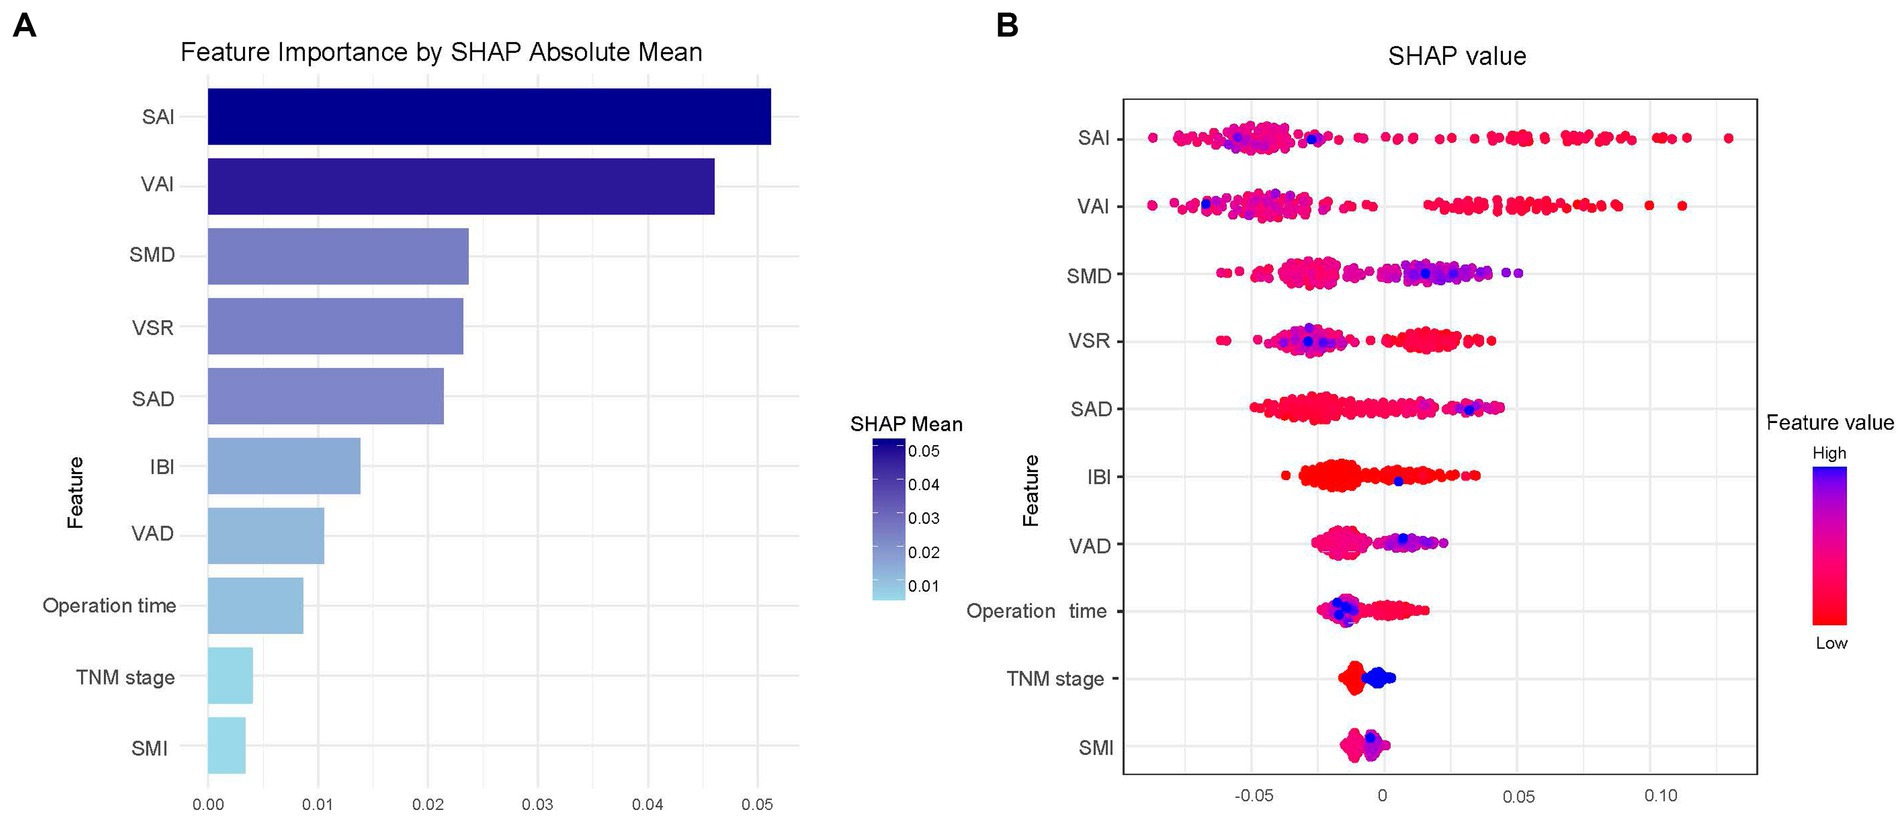
Figure 4. SHAP summary plot for the top 10 clinical features contributing to the XGBoost model. SHAP feature importance is measured as the mean absolute Shapley values (A) and the attributes of the features in the model (B).
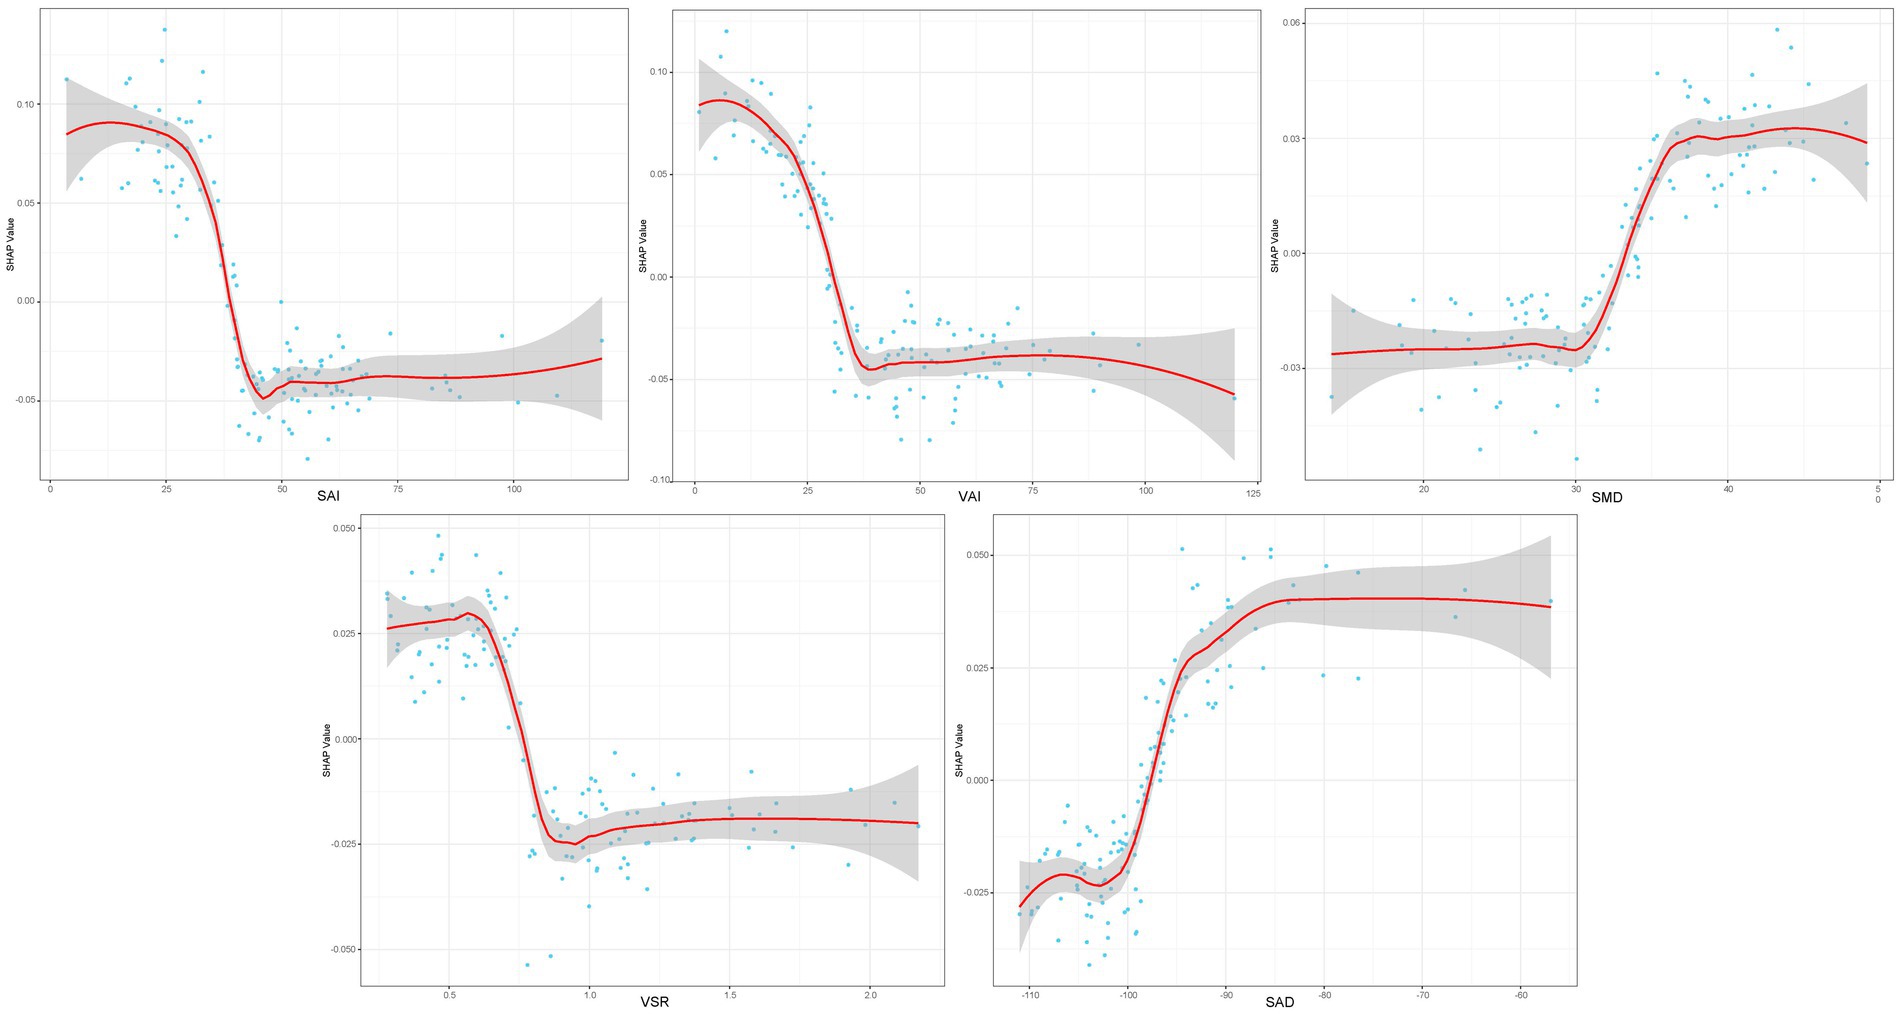
Figure 5. SHAP dependency plot for the top 5 clinical features contributing to the XGBoost model.
This study established and validated seven ML models to predict 3-year all-cause mortality following LaTME. Among the compared ML models, XGBoost demonstrated notable superiority. To our knowledge, this is the first study utilizing interpretable machine learning based on abdominal body composition to predict 3-year all-cause mortality after LaTME. While various nomogram models have been previously developed (20–22), our work distinguishes itself by introducing a high-performance ensemble machine learning model, which holds the potential to refine strategic resource allocation and inform more effective patient management strategies.
Obesity has been well-established as a risk factor for the development and progression of multiple cancer types, including lung (23), pancreatic (24), gastric (25), and colorectal cancers (26). However, some studies have suggested that obesity may paradoxically serve as a protective factor for certain diseases (27, 28). Nevertheless, the intricate relationship between obesity and prognosis in rectal cancer patients remains largely unelucidated, primarily due to the limitations of BMI, which fails to distinguish between adipose tissue and skeletal muscle or to delineate adipose tissue distribution. One study proposed that quantified fat-free mass index (FFMI) and fat mass-to-fat-free mass ratio (FM/FFM) may better predict functional outcomes in pre-frail elders than BMI (29). Previous research has shown that low skeletal muscle index (SMI) adversely impacts colorectal cancer prognosis (30, 31). Regarding subcutaneous adipose tissue (SAT) and visceral adipose tissue (VAT), most studies have focused on their cross-sectional areas in relation to colorectal cancer prognosis without considering confounding factors such as height. Therefore, quantifying body composition through indices like SAI and VAI can mitigate the influence of confounders, enhancing the accuracy of abdominal obesity assessment. Our study further highlights SMD and SAD as robust predictors of all-cause mortality in rectal cancer patients, consistent with prior findings (10, 32). Feliciano EMC et al. suggested that higher radiological density of VAT or SAT may indicate lower lipid content in adipocytes, potentially reflecting weight loss, a hallmark of disease progression. However, their analysis of patients maintaining stable weight between scans yielded similar results (10), suggesting that the underlying mechanisms may require further investigation.
It is noteworthy that in our study, the SAI emerged as the strongest predictor of three-year survival among rectal cancer patients, aligning with findings from several studies which indicate that a low SAI is independently associated with an increased mortality rate (33, 34). Intriguingly, these studies point out that a low VATI is not an independent risk factor for the prognosis of rectal cancer patients (33, 34). The finding that having a high VAI without concurrent high subcutaneous obesity increases the risk of mortality contrasts with conclusions drawn from multiple studies (35, 36). This discrepancy may be attributed to the influence of demographic factors such as different disease types, age, gender, and ethnicity (37), or it could be related to variations in TNM staging. However, no definitive conclusion has been reached, and further investigation is required.
Our study also highlights SMD and SAD as strong predictors of survival outcomes in rectal cancer patients, consistent with previous research (30, 31). Feliciano et al. suggest that higher VAT or SAT radiodensity may reflect lower lipid content in adipocytes, potentially due to weight loss, which is a hallmark of progressive disease. However, they found similar results when restricting their analysis to patients who maintained stable weight between imaging sessions (31). A clearer mechanism may require further research. In our study, VSR was also identified as a significant predictor, with findings similar to those reported in several other studies (38, 39). Furthermore, VSR is recognized as an effective indicator for assessing body fat distribution. By identifying key variables associated with increased risk, SHAP can facilitate early interventions and personalized treatment planning, enabling more informed and individualized clinical decision-making.
Numerous studies have highlighted the strong association between nutritional-inflammatory indices, such as PNI (40), IBI (41), and AAPR (42), and cancer prognosis. However, in our study, these variables were less influential in the model compared to abdominal muscle and adipose tissue composition. Given the relatively small patient cohort, the contribution of these indices to the model warrants further investigation.
Our study is not without limitations. Firstly, as a single-center retrospective study with a limited patient sample, it cannot fully rule out selection bias. A larger sample size from multiple centers is needed to validate our findings. Increasing the sample size to approximately 3,000 will provide a more robust dataset, enabling more reliable statistical analyses and potentially identifying stronger associations. Secondly, while the study included laboratory tests, clinicopathological features, and abdominal CT parameters, the CT measurements relied on average areas from two planes, which may not fully capture abdominal adipose tissue volume, thereby introducing potential errors. Lastly, due to the limitation of follow-up duration, our study focused solely on the 3-year all-cause mortality rate, without delving into the 5-year or longer-term rectal cancer-specific mortality rate. This, to a certain extent, constrained the accuracy of our model. Consequently, further research in this regard is imperative.
In summary, we have developed and validated seven machine learning models utilizing CT-derived body composition data to predict 3-year all-cause mortality following LaTME. Notably, the XGBoost model emerged as the most predictive, highlighting SAI, VAI, SMD, VSR, and SAD as the five most significant predictive variables influencing three-year survival post-LaTME. This underscores the potential clinical significance of integrating body composition metrics and advanced machine learning techniques in prognostic assessments for rectal cancer patients undergoing LaTME.
The original contributions presented in the study are included in the article/Supplementary material, further inquiries can be directed to the corresponding authors.
The studies involving humans were approved by Ethics Committee of the Second Affiliated Hospital of Soochow University. The studies were conducted in accordance with the local legislation and institutional requirements. Written informed consent for participation was not required from the participants or the participants’ legal guardians/next of kin in accordance with the national legislation and institutional requirements. Written informed consent was obtained from the individual(s) for the publication of any potentially identifiable images or data included in this article.
XL: Data curation, Software, Writing – original draft, Validation. ZZ: Writing – original draft, Data curation, Software. XZ: Data curation, Writing – original draft. XC: Data curation, Writing – original draft. CX: Supervision, Writing – review & editing. YW: Funding acquisition, Resources, Software, Supervision, Writing – review & editing.
The author(s) declare that financial support was received for the research, authorship, and/or publication of this article. The present study was supported by State Key Laboratory of Radiation Medicine and Protection (No. GZK1202243) and Suzhou Science and Technology Bureau (No. SKY2022156).
The authors declare that the research was conducted in the absence of any commercial or financial relationships that could be construed as a potential conflict of interest.
All claims expressed in this article are solely those of the authors and do not necessarily represent those of their affiliated organizations, or those of the publisher, the editors and the reviewers. Any product that may be evaluated in this article, or claim that may be made by its manufacturer, is not guaranteed or endorsed by the publisher.
The Supplementary material for this article can be found online at: https://www.frontiersin.org/articles/10.3389/fnut.2025.1473952/full#supplementary-material
SUPPLEMENTARY TABLE S1 | Comparison of baseline data between patients with different survival outcomes.
SUPPLEMENTARY TABLE S2 | Evaluate the predictive performance of seven ML models in the training cohort.
SUPPLEMENTARY TABLE S3 | Compare the AUROC differences of the seven models using the DeLong test in the training cohort.
SUPPLEMENTARY FIGURE S1 | Schematic diagram at the level of the L4/5 spine in the used patient using Slice-O-Matic software.
SUPPLEMENTARY FIGURE S2 | The calibration curves for the seven models.
SUPPLEMENTARY FIGURE S3 | The clinical impact curves for the seven models.
1. Sung, H, Ferlay, J, Siegel, RL, Laversanne, M, Soerjomataram, I, Jemal, A, et al. Global Cancer Statistics 2020: GLOBOCAN estimates of incidence and mortality worldwide for 36 cancers in 185 countries. CA Cancer J Clin. (2021) 71:209–49. doi: 10.3322/caac.21660
2. Siegel, RL, Miller, KD, Fuchs, HE, and Jemal, A. Cancer statistics, 2022. CA Cancer J Clin. 72:2022:7–33. doi: 10.3322/caac.21708
3. McPhail, S, Johnson, S, Greenberg, D, Peake, M, and Rous, B. Stage at diagnosis and early mortality from cancer in England. Br J Cancer. (2015) 112:S108–15. doi: 10.1038/bjc.2015.49
4. Amin, MB, Greene, FL, Edge, SB, Compton, CC, Gershenwald, JE, Brookland, RK, et al. The eighth edition AJCC Cancer staging manual: continuing to build a bridge from a population-based to a more "personalized" approach to cancer staging. CA Cancer J Clin. (2017) 67:93–9. doi: 10.3322/caac.21388
5. Quirke, P, Williams, GT, Ectors, N, Ensari, A, Piard, F, and Nagtegaal, I. The future of the TNM staging system in colorectal cancer: time for a debate? Lancet Oncol. (2007) 8:651–7. doi: 10.1016/S1470-2045(07)70205-X
6. Ueno, H, Mochizuki, H, Akagi, Y, Kusumi, T, Yamada, K, Ikegami, M, et al. Optimal colorectal cancer staging criteria in TNM classification. J Clin Oncol. (2012) 30:1519–26. doi: 10.1200/JCO.2011.39.4692
7. Nie, T, Wu, F, Heng, Y, Cai, W, Liu, Z, Qin, L, et al. Influence of skeletal muscle and intermuscular fat on postoperative complications and long-term survival in rectal cancer patients. J Cachexia Sarcopenia Muscle. (2024) 15:702–17. doi: 10.1002/jcsm.13424
8. Liu, J, Yu, X, Huang, X, Lai, Q, and Chen, J. Associations of muscle and adipose tissue parameters with long-term outcomes in middle and low rectal cancer: a retrospective cohort study. Cancer Imaging. (2023) 23:5. doi: 10.1186/s40644-022-00514-x
9. Yoon, J, Chung, YE, Lim, JS, and Kim, MJ. Quantitative assessment of mesorectal fat: new prognostic biomarker in patients with mid-to-lower rectal cancer. Eur Radiol. (2019) 29:1240–7. doi: 10.1007/s00330-018-5723-5
10. Feliciano, EMC, Winkels, RM, Meyerhardt, JA, Prado, CM, Afman, LA, and Caan, BJ. Abdominal adipose tissue radiodensity is associated with survival after colorectal cancer. Am J Clin Nutr. (2021) 114:1917–24. doi: 10.1093/ajcn/nqab285
11. Bradshaw, PT. Body composition and cancer survival: a narrative review. Br J Cancer. (2024) 130:176–83. doi: 10.1038/s41416-023-02470-0
12. Swanson, K, Wu, E, Zhang, A, Alizadeh, AA, and Zou, J. From patterns to patients: advances in clinical machine learning for cancer diagnosis, prognosis, and treatment. Cell. (2023) 186:1772–91. doi: 10.1016/j.cell.2023.01.035
13. Huang, S, Yang, J, Shen, N, Xu, Q, and Zhao, Q. Artificial intelligence in lung cancer diagnosis and prognosis: current application and future perspective. Semin Cancer Biol. (2023) 89:30–7. doi: 10.1016/j.semcancer.2023.01.006
14. Wang, Y, Wang, Y, Ai, L, Zhang, H, Li, G, Wang, Z, et al. Linear skeletal muscle index and muscle attenuation may be new prognostic factors in colorectal carcinoma treated by radical resection. Front Oncol. (2022) 12:839899. doi: 10.3389/fonc.2022.839899
15. Charette, N, Vandeputte, C, Ameye, L, Bogaert, CV, Krygier, J, Guiot, T, et al. Prognostic value of adipose tissue and muscle mass in advanced colorectal cancer: a post hoc analysis of two non-randomized phase II trials. BMC Cancer. (2019) 19:134. doi: 10.1186/s12885-019-5319-8
16. Zhang, X, Xin, Y, Chen, Y, and Zhou, X. Prognostic effect of albumin-to-alkaline phosphatase ratio on patients with hepatocellular carcinoma: a systematic review and meta-analysis. Sci Rep. (2023) 13:1808. doi: 10.1038/s41598-023-28889-2
17. Xie, H, Ruan, G, Ge, Y, Zhang, Q, Zhang, H, Lin, S, et al. Inflammatory burden as a prognostic biomarker for cancer. Clin Nutr. (2022) 41:1236–43. doi: 10.1016/j.clnu.2022.04.019
18. Xia, LJ, Li, W, Zhai, JC, Yan, CW, Chen, JB, and Yang, H. Significance of neutrophil-to-lymphocyte ratio, platelet-to-lymphocyte ratio, lymphocyte-to-monocyte ratio and prognostic nutritional index for predicting clinical outcomes in T1-2 rectal cancer. BMC Cancer. (2020) 20:208. doi: 10.1186/s12885-020-6698-6
19. Faron, A, Opheys, NS, Nowak, S, Sprinkart, AM, Isaak, A, Theis, M, et al. Deep learning-based body composition analysis predicts outcome in melanoma patients treated with immune checkpoint inhibitors. Diagnostics (Basel). (2021) 11. doi: 10.3390/diagnostics11122314
20. Shi, S, Zhao, YX, Fan, JL, Chang, LY, and Yu, DX. Development and external validation of a nomogram including body composition parameters for predicting early recurrence of hepatocellular carcinoma after hepatectomy. Acad Radiol. (2023) 30:2940–53. doi: 10.1016/j.acra.2023.05.022
21. Zheng, H, Zhu, W, Niu, Z, Li, H, Zheng, Y, Liu, Z, et al. A novel nutrition-based nomogram to predict prognosis after curative resection of gastric cancer. Front Nutr. (2021) 8:664620. doi: 10.3389/fnut.2021.664620
22. Wang, Y, Wang, Y, Li, G, Zhang, H, Yu, H, Xiang, J, et al. Associations of intermuscular adipose tissue and total muscle wasting score in PG-SGA with low muscle radiodensity and mass in nonmetastatic colorectal cancer: a two-center cohort study. Front Nutr. (2022) 9:967902. doi: 10.3389/fnut.2022.967902
23. Jeong, SM, Lee, DH, and Giovannucci, EL. Predicted lean body mass, fat mass and risk of lung cancer: prospective US cohort study. Eur J Epidemiol. (2019) 34:1151–60. doi: 10.1007/s10654-019-00587-2
24. Larsson, SC, Permert, J, Håkansson, N, Näslund, I, Bergkvist, L, and Wolk, A. Overall obesity, abdominal adiposity, diabetes and cigarette smoking in relation to the risk of pancreatic cancer in two Swedish population-based cohorts. Br J Cancer. (2005) 93:1310–5. doi: 10.1038/sj.bjc.6602868
25. Liu, AR, He, QS, Wu, WH, Du, JL, Kuo, ZC, Xia, B, et al. Body composition and risk of gastric cancer: a population-based prospective cohort study. Cancer Med. (2021) 10:2164–74. doi: 10.1002/cam4.3808
26. Bardou, M, Barkun, AN, and Martel, M. Obesity and colorectal cancer. Gut. (2013) 62:933–47. doi: 10.1136/gutjnl-2013-304701
27. Liu, C, Wong, PY, Chung, YL, Chow, SK, Cheung, WH, Law, SW, et al. Deciphering the "obesity paradox" in the elderly: a systematic review and meta-analysis of sarcopenic obesity. Obes Rev. (2023) 24:e13534. doi: 10.1111/obr.13534
28. Cullinane, C, Fullard, A, Croghan, SM, Elliott, JA, and Fleming, CA. Effect of obesity on perioperative outcomes following gastrointestinal surgery: meta-analysis. BJS Open. (2023) 7. doi: 10.1093/bjsopen/zrad026
29. Merchant, RA, Seetharaman, S, Au, L, Wong, MWK, Wong, BLL, Tan, LF, et al. Relationship of fat mass index and fat free mass index with body mass index and association with function, cognition and sarcopenia in pre-frail older adults. Front Endocrinol (Lausanne). (2021) 12:765415. doi: 10.3389/fendo.2021.765415
30. Kemper, M, Melling, N, Krause, L, Kühn, K, Graß, JK, Izbicki, JR, et al. Muscle quality, not quantity, is associated with outcome after colorectal cancer surgery. Eur J Surg Oncol. (2023) 49:107098. doi: 10.1016/j.ejso.2023.107098
31. He, J, Luo, W, Huang, Y, Song, L, and Mei, Y. Sarcopenia as a prognostic indicator in colorectal cancer: an updated meta-analysis. Front Oncol. (2023) 13:1247341. doi: 10.3389/fonc.2023.1247341
32. McGovern, J, Dolan, RD, Horgan, PG, Laird, BJ, and McMillan, DC. Computed tomography-defined low skeletal muscle index and density in cancer patients: observations from a systematic review. J Cachexia Sarcopenia Muscle. (2021) 12:1408–17. doi: 10.1002/jcsm.12831
33. Ebadi, M, Martin, L, Ghosh, S, Field, CJ, Lehner, R, Baracos, VE, et al. Subcutaneous adiposity is an independent predictor of mortality in cancer patients. Br J Cancer. (2017) 117:148–55. doi: 10.1038/bjc.2017.149
34. Han, J, Tang, M, Lu, C, Shen, L, and Wu, G. Subcutaneous, but not visceral, adipose tissue as a marker for prognosis in gastric cancer patients with cachexia. Clin Nutr. (2021) 40:5156–61. doi: 10.1016/j.clnu.2021.08.003
35. Li, L, Li, WQ, Xu, D, He, H, Yang, W, Guo, HF, et al. Association between visceral fat area and Cancer prognosis: a population-based multicenter prospective study. Am J Clin Nutr. (2023) 118:507–17. doi: 10.1016/j.ajcnut.2023.07.001
36. Park, J, Chang, S, Lim, J, Park, S, Park, J, Cheon, J, et al. Impact of visceral fat on survival and metastasis of stage III colorectal cancer. Gut Liver. (2021) 16:53–61. doi: 10.5009/gnl20266
37. Lee, J, Lin, J, Wu, M, Jan, YI, and Chen, YE. Muscle radiodensity loss during cancer therapy is predictive for poor survival in advanced endometrial cancer. J Cachexia Sarcopenia Muscle. (2019) 10:814–26. doi: 10.1002/jcsm.12440
38. Bocca, G, Mastoridis, S, Yeung, T, James, DRC, and Cunningham, C. Visceral-to-subcutaneous fat ratio exhibits strongest association with early post-operative outcomes in patients undergoing surgery for advanced rectal cancer. Int J Color Dis. (2022) 37:1893–900. doi: 10.1007/s00384-022-04221-8
39. Lee, BK, and Kyu, B. Higher visceral fat area/subcutaneous fat area ratio measured by computed tomography is associated with recurrence and poor survival in patients with mid and low rectal cancers. Int J Color Dis. (2018) 33:1303–7. doi: 10.1007/s00384-018-3065-z
40. Zhang, L, Ma, W, Qiu, Z, Kuang, T, Wang, K, Hu, B, et al. Prognostic nutritional index as a prognostic biomarker for gastrointestinal cancer patients treated with immune checkpoint inhibitors. Front Immunol. (2023) 14:1219929. doi: 10.3389/fimmu.2023.1219929
41. Song, Z, Lin, F, Chen, Y, Li, T, Li, R, Lu, J, et al. Inflammatory burden index: association between novel systemic inflammatory biomarkers and prognosis as well as in-hospital complications of patients with aneurysmal subarachnoid hemorrhage. J Inflamm Res. (2023) 16:3911–21. doi: 10.2147/JIR.S416295
42. Li, S, Lu, S, Liu, X, and Chen, X. Association between the pretreatment albumin-to-alkaline phosphatase ratio and clinical outcomes in patients with bladder Cancer treated with radical cystectomy: a retrospective cohort study. Front Oncol. (2021) 11:664392. doi: 10.3389/fonc.2021.664392
ML - machine learning
LaTME - laparoscopic total mesorectal excision
CT - computed tomography
AUROC - area under the receiver operating characteristic curve
SHAP - SHAPley Additive exPlanations
TNM - Tumor-Node-Metastasis
SMI - skeletal muscle index
SAI - subcutaneous adipose tissue index
VAI - visceral adipose tissue index
SMD - skeletal muscle density
SAD - subcutaneous adipose tissue density
VAD - visceral adipose tissue density
VSR - visceral-to-subcutaneous adipose tissue area ratio
AAPR - albumin-to-alkaline phosphatase ratio
IBI - inflammatory burden index
PNI - prognostic nutritional index Positive Predictive Value
NPV - Negative Predictive Value
CEA - carcinoembryonic antigen
DT - Decision Tree
KNN - K-Nearest Neighbors
LightGBM - Light Gradient Boosting Machine
LR - Logistic Regression
RF - Random Forest
SVM - Support Vector Machine
XGBoost - Extreme Gradient Boosting
Keywords: rectal cancer, nutrition, prognosis, machine learning, predictive model
Citation: Li X, Zhou Z, Zhang X, Cheng X, Xing C and Wu Y (2025) Predicting 3-year all-cause mortality in rectal cancer patients based on body composition and machine learning. Front. Nutr. 12:1473952. doi: 10.3389/fnut.2025.1473952
Edited by:
Marilia Seelaender, University of São Paulo, BrazilReviewed by:
Miljana Z. Jovandaric, University of Belgrade, SerbiaCopyright © 2025 Li, Zhou, Zhang, Cheng, Xing and Wu. This is an open-access article distributed under the terms of the Creative Commons Attribution License (CC BY). The use, distribution or reproduction in other forums is permitted, provided the original author(s) and the copyright owner(s) are credited and that the original publication in this journal is cited, in accordance with accepted academic practice. No use, distribution or reproduction is permitted which does not comply with these terms.
*Correspondence: Yong Wu, d3V5b25nNjMwMkAxNjMuY29t; Chungen Xing, eGluZ2NnQHN1ZGEuZWR1LmNu
Disclaimer: All claims expressed in this article are solely those of the authors and do not necessarily represent those of their affiliated organizations, or those of the publisher, the editors and the reviewers. Any product that may be evaluated in this article or claim that may be made by its manufacturer is not guaranteed or endorsed by the publisher.
Research integrity at Frontiers
Learn more about the work of our research integrity team to safeguard the quality of each article we publish.