 Yu-Ting Yu
 Yu-Hsiang Fu3†
 Yu-Wei Fang
 Ming-Hsien Tsai
94% of researchers rate our articles as excellent or good
Learn more about the work of our research integrity team to safeguard the quality of each article we publish.
Find out more
SYSTEMATIC REVIEW article
Front. Nutr. , 13 February 2025
Sec. Clinical Nutrition
Volume 12 - 2025 | https://doi.org/10.3389/fnut.2025.1458353
Low glycemic index (LoGI) diets are associated with decreased insulin resistance and are an effective strategy for patients with diabetes mellitus to control postprandial glucose levels. However, whether these effects on insulin resistance and glucose levels are also observable in those without diabetes mellitus is poorly understood. The present study examined the influence of LoGI diets compared with that of high glycemic index (HiGI) diets on insulin resistance in adults without diabetes mellitus. This meta-analysis included six randomized controlled trials involving 192 participants with a mean age of 52.5 years. A homeostasis model assessment of insulin resistance (HOMA-IR) score was calculated for each trial, and differences in HOMA-IR before and after each dietary intervention were calculated independently. The primary outcome was variations in insulin resistance, which was assessed by proxy as the difference between HOMA-IR scores at the beginning and end of the trials. The results suggested that LoGI diets decrease HOMA-IR scores to a greater extent than HiGI diets (estimate: 0.31; 95% confidence interval [CI], 0.01–0.61; p < 0.001) in individuals without diabetes mellitus. This association remained significant (estimate: 0.16; 95% CI, 0.01–0.31) after excluding one study with a short follow-up time (7 days). In conclusion, LoGI diets lower HOMA-IR scores to a greater extent than HiGI diets in adults without diabetes mellitus.
Systematic review registration: (https://www.crd.york.ac.uk/PROSPERO/).
Type 2 diabetes mellitus is a serious and increasingly prevalent health problem. In 2019, 463 million people worldwide (9.3% of the global population) had type 2 diabetes, an increase from 153 million in 1980. The estimated worldwide prevalence of impaired glucose intolerance is approximately 7.5% and is expected to increase to 8% by 2030 (1). More than one million deaths annually are attributable to type 2 diabetes mellitus, rendering it the ninth leading cause of mortality worldwide (2), and the World Health Organization anticipates that diabetes mellitus will become the seventh leading cause of death by 2030 (3). Numerous randomized controlled trials have demonstrated that adopting a healthy dietary pattern and making lifestyle modifications is effective in preventing type 2 diabetes mellitus. As indicated by a previous meta-analysis, lifestyle interventions aimed at weight reduction, increased physical activity, or dietary modification decreased the risk of developing type 2 diabetes mellitus by 47% (4).
In 1981, Jenkins and colleagues introduced the Glycemic Index to quantify the relative impact of carbohydrates on postprandial blood glucose levels, using glucose or white bread as the reference standard (5). The glycemic index is a ranking scale for foods that range from 0 to 100 on the basis of this influence and classifies them into three groups: foods with a low glycemic index (LoGI) score 55 of or less, those with a moderate glycemic index score between 56 and 69, and those with a high glycemic index (HiGI) score of 70 or greater. LoGI foods result in a low post-meal blood sugar spike, whereas HiGI foods cause a high blood sugar spike (6). LoGI diets are beneficial for people with diabetes because they regulate blood sugar levels and prevent blood sugar spikes. Wang and colleagues’ systematic review suggested that LoGI diets promote blood sugar control in individuals with diabetes (7). Similarly, Ojo and colleagues conducted a meta-analysis and discovered that LoGI diets improved levels of glycated hemoglobin (HbA1c) and fasting blood sugar compared with HiGI diets in patients with type 2 diabetes (8). In addition, a systematic review and dose–response meta-analysis found that a 5-unit increase in GI is associated with an 8% increased risk of developing type 2 diabetes mellitus (9). Furthermore, a meta-analysis of prospective cohort studies indicated that for every 10-unit increase in GI, the relative risk of type 2 diabetes mellitus rises by 27% (10).
The homeostasis model assessment of insulin resistance (HOMA-IR) was introduced in 1985 and is used to quantify insulin resistance (IR) and beta-cell function using basal glucose and insulin concentrations. The HOMA-IR measures the effects of the physiological feedback loop resulting from attenuated insulin suppression during hepatic glucose production (11). Results from the HOMA-IR model have been found to be strongly correlated with euglycemic clamp results (12, 13). Several studies have revealed the positive effects of LoGI diets on insulin sensitivity and other metabolic parameters (14–17). LoGI diets with carbohydrates and fiber help stabilize blood glucose levels, reduce insulin resistance, and lower risk factors for cardiovascular diseases. These diets enable rapid weight loss, reduce fasting glucose and insulin levels, lower circulating triglycerides, and improve blood pressure (16, 17). The benefits of LoGI diets in reducing hyperinsulinemia, dyslipidemia, and inflammatory markers to reduce cardiovascular risk have also been examined (16).
To date, observational studies based on single cohorts have provided contradictory results regarding whether a LoGI diet can lower IR in adults without diabetes mellitus with no comorbidities. Du et al. conducted a cross-sectional analysis of two population-based cohort studies (the CoDAM Study and the Hoorn Study), including 974 participants, and demonstrated that dietary GI levels had a substantial association with fasting insulin levels and HOMA-IR; every 10 units of insulin increase in GI was associated with a 23% increase in IR (18). Additionally, McClenaghan observed that dietary GI levels were significantly and positively associated with fasting insulin levels in the 2,941 participants in the Framingham Offspring study (19). However, another study obtained opposite results (20), and several studies have revealed no significant effects of a LoGI diet on IR (21, 22). These inconsistencies might be attributed to several factors, including variability in study designs, differences in participant populations (e.g., inclusion of individuals with diabetes or other comorbidities), and the use of diverse methods to assess IR.
We conducted the present systematic review to evaluate the effects of LoGI diets on IR. In contrast to other studies, our review focused on healthy adults without diabetes mellitus or other comorbidities and explored the associations between various GI diets and a reduction in IR, a critical factor in the pathogenesis of type 2 diabetes mellitus. Due to the high heterogeneity and various measurements of IR, we included RCTs that compared clearly defined LoGI diets with HiGI diets and used HOMA-IR as an indicator of IR because it is reliable, minimally invasive, and widely used in assessing patients with prediabetes.
This systematic review and meta-analysis followed the Preferred Reporting Items for Systematic Reviews and Meta-Analyses (PRISMA) guidelines (23), detailed in the Supplementary material, and is registered with PROSPERO under CRD42023478554 (https://www.crd.york.ac.uk/PROSPERO/).
This meta-analysis systematically searched the literature to identify RCTs comparing LoGI diets with HiGI diets in individuals without diabetes mellitus or other substantial comorbidities. LoGI and HiGI groups were determined from the design of the included studies. We comprehensively searched for all articles published between 2000 and 2025 on PubMed,1 Embase,2 Cochrane Library,3 and Clinical Trials registration.4 For example, PubMed was searched using the medical subheadings “Glycemic Index,” “Insulin Resistance,” and restricted article type “Randomized Controlled Trial” in humans. RCTs were included if they were written in English and met the following inclusion criteria: (1) using a LoGI diet as the main component of the intervention arm and a HiGI diet in the control arm only; (2) being noncrossover RCTs with clearly defined LoGI and HiGI diets in the study protocol; (3) having study participants >18 years old who had no severe systemic comorbidities such as diabetes mellitus, coronary artery disease, or end-stage renal disease, who were not undergoing major surgery in the 6 months preceding the trial, who had no other systemic diseases requiring hospital admission, and who did not receive oral hypoglycemic agents or insulin treatment; and (4) having recorded data on insulin sensitivity and HOMA-IR before and after the dietary interventions. The detailed research policy is provided in the Supplementary material.
The titles and abstracts of all articles were used to determine relevance. Full articles were screened if the titles and abstracts were relevant to the objectives of the present study. Two reviewers (YTY and YHF) conducted searches independently and combined their findings.
The following information was extracted from each article: the author’s name, publication year, study design, trial country, trial duration, dietary intervention, participant count, average age, and diet composition. Two independent reviewers (YTY and YHF) independently extracted data from and assessed methodological quality in the evaluated trials. Disagreements were settled through discussions between the researchers to achieve consensus.
The outcome measure of HOMA-IR quantifies insulin homeostasis using a simple equation in which the insulin–glucose product is divided by a constant. The equation, originally proposed by Andrade et al. (24), is as follows: IRHOMA = [insulin level (μU/mL) × glucose level (mmol/L)]/22.5. This index is particularly useful in large epidemiological studies when only fasting insulin and glucose values are available. The use of HOMA-IR to assess IR was also validated in a study of adolescents.
Key study variables were also extracted, and they included participant demographics (number, gender ratio, mean age), dietary interventions (glycemic index, macronutrient composition, fiber content), and dietary controls (diet provision method, recording approach). Intervention details covered diet type (iso- or hypocaloric) and exercise involvement. Study designs tracked intervention duration (7 days to 6 months), location, and year. These data were consistently measured across both LoGI and HiGI groups for comparative analysis.
The Risk of Bias (ROB) evaluation in this study was conducted using the Cochrane Risk of Bias Tool (25), which assesses methodological quality across domains such as randomization, allocation concealment, blinding, incomplete outcome data, and selective reporting. Two independent reviewers (YTY and YHF) evaluated all studies. Any discrepancies were resolved by discussions between the two investigators until a consensus was reached.
Data extraction and analysis were conducted using the techniques outlined in the Cochrane Handbook for Systematic Reviews of Interventions (Version 6.2, 2021) (25). The primary outcomes of our study were HOMA-IR values before and after the dietary interventions. Subgroup analysis was conducted to segment study populations according to follow-up durations and methods used to provide diets with specific GIs to the participants. Heterogeneity between studies was assessed by reviewing trial data, and statistical heterogeneity was analyzed using a chi-squared test. The I2 statistic was calculated to assess inconsistency between studies, and an I2 value >50% was considered to indicate substantial heterogeneity (26). A random effects model was employed in our analysis to accommodate this heterogeneity.
We treated the outcome of HOMA-IR as a continuous variable and calculated standardized mean differences (SMD) with 95% confidence intervals (CIs). Standard deviations were used directly if reported by the author or calculated from the observed mean differences and test statistics. In cases where the test statistics were unavailable, we estimated the corresponding p values using normal distribution tables based on the test statistics provided. Potential publication bias was assessed through the use of funnel plots, and this analysis was further supported by applying Egger’s test to evaluate asymmetry. Egger’s test quantitatively evaluates the asymmetry of the funnel plot by testing for a linear relationship between the effect size and the standard error. Sensitive analysis explored heterogeneity by excluding shorter follow-up studies, while subgroup analyses evaluated the robustness of results by examining dietary provision methods and supervised exercise.
Statistical analyses were conducted using Stata version 15 (StataCorp, College Station, TX, United States). Two-tailed p values < 0.05 were considered statistically significant.
The PRISMA flowchart for the review process and the selection of the RCTs included in our analysis is depicted in Figure 1. A total of 212 studies were returned using our search terms. Of these, 130 were identified as RCTs and were screened for relevance. Finally, six studies involving 192 participants met our selection criteria and were included in our meta-analysis (27–32). The characteristics of the studies included in the meta-analysis are presented in Table 1. The 192 participants were divided into two groups: 100 participants who received a LoGI diet and 92 participants who received a HiGI diet.

Figure 1. PRISMA flow diagram of the study selection. GI: glycemic index; HOMA-IR, homeostatic model assessment for insulin resistance.
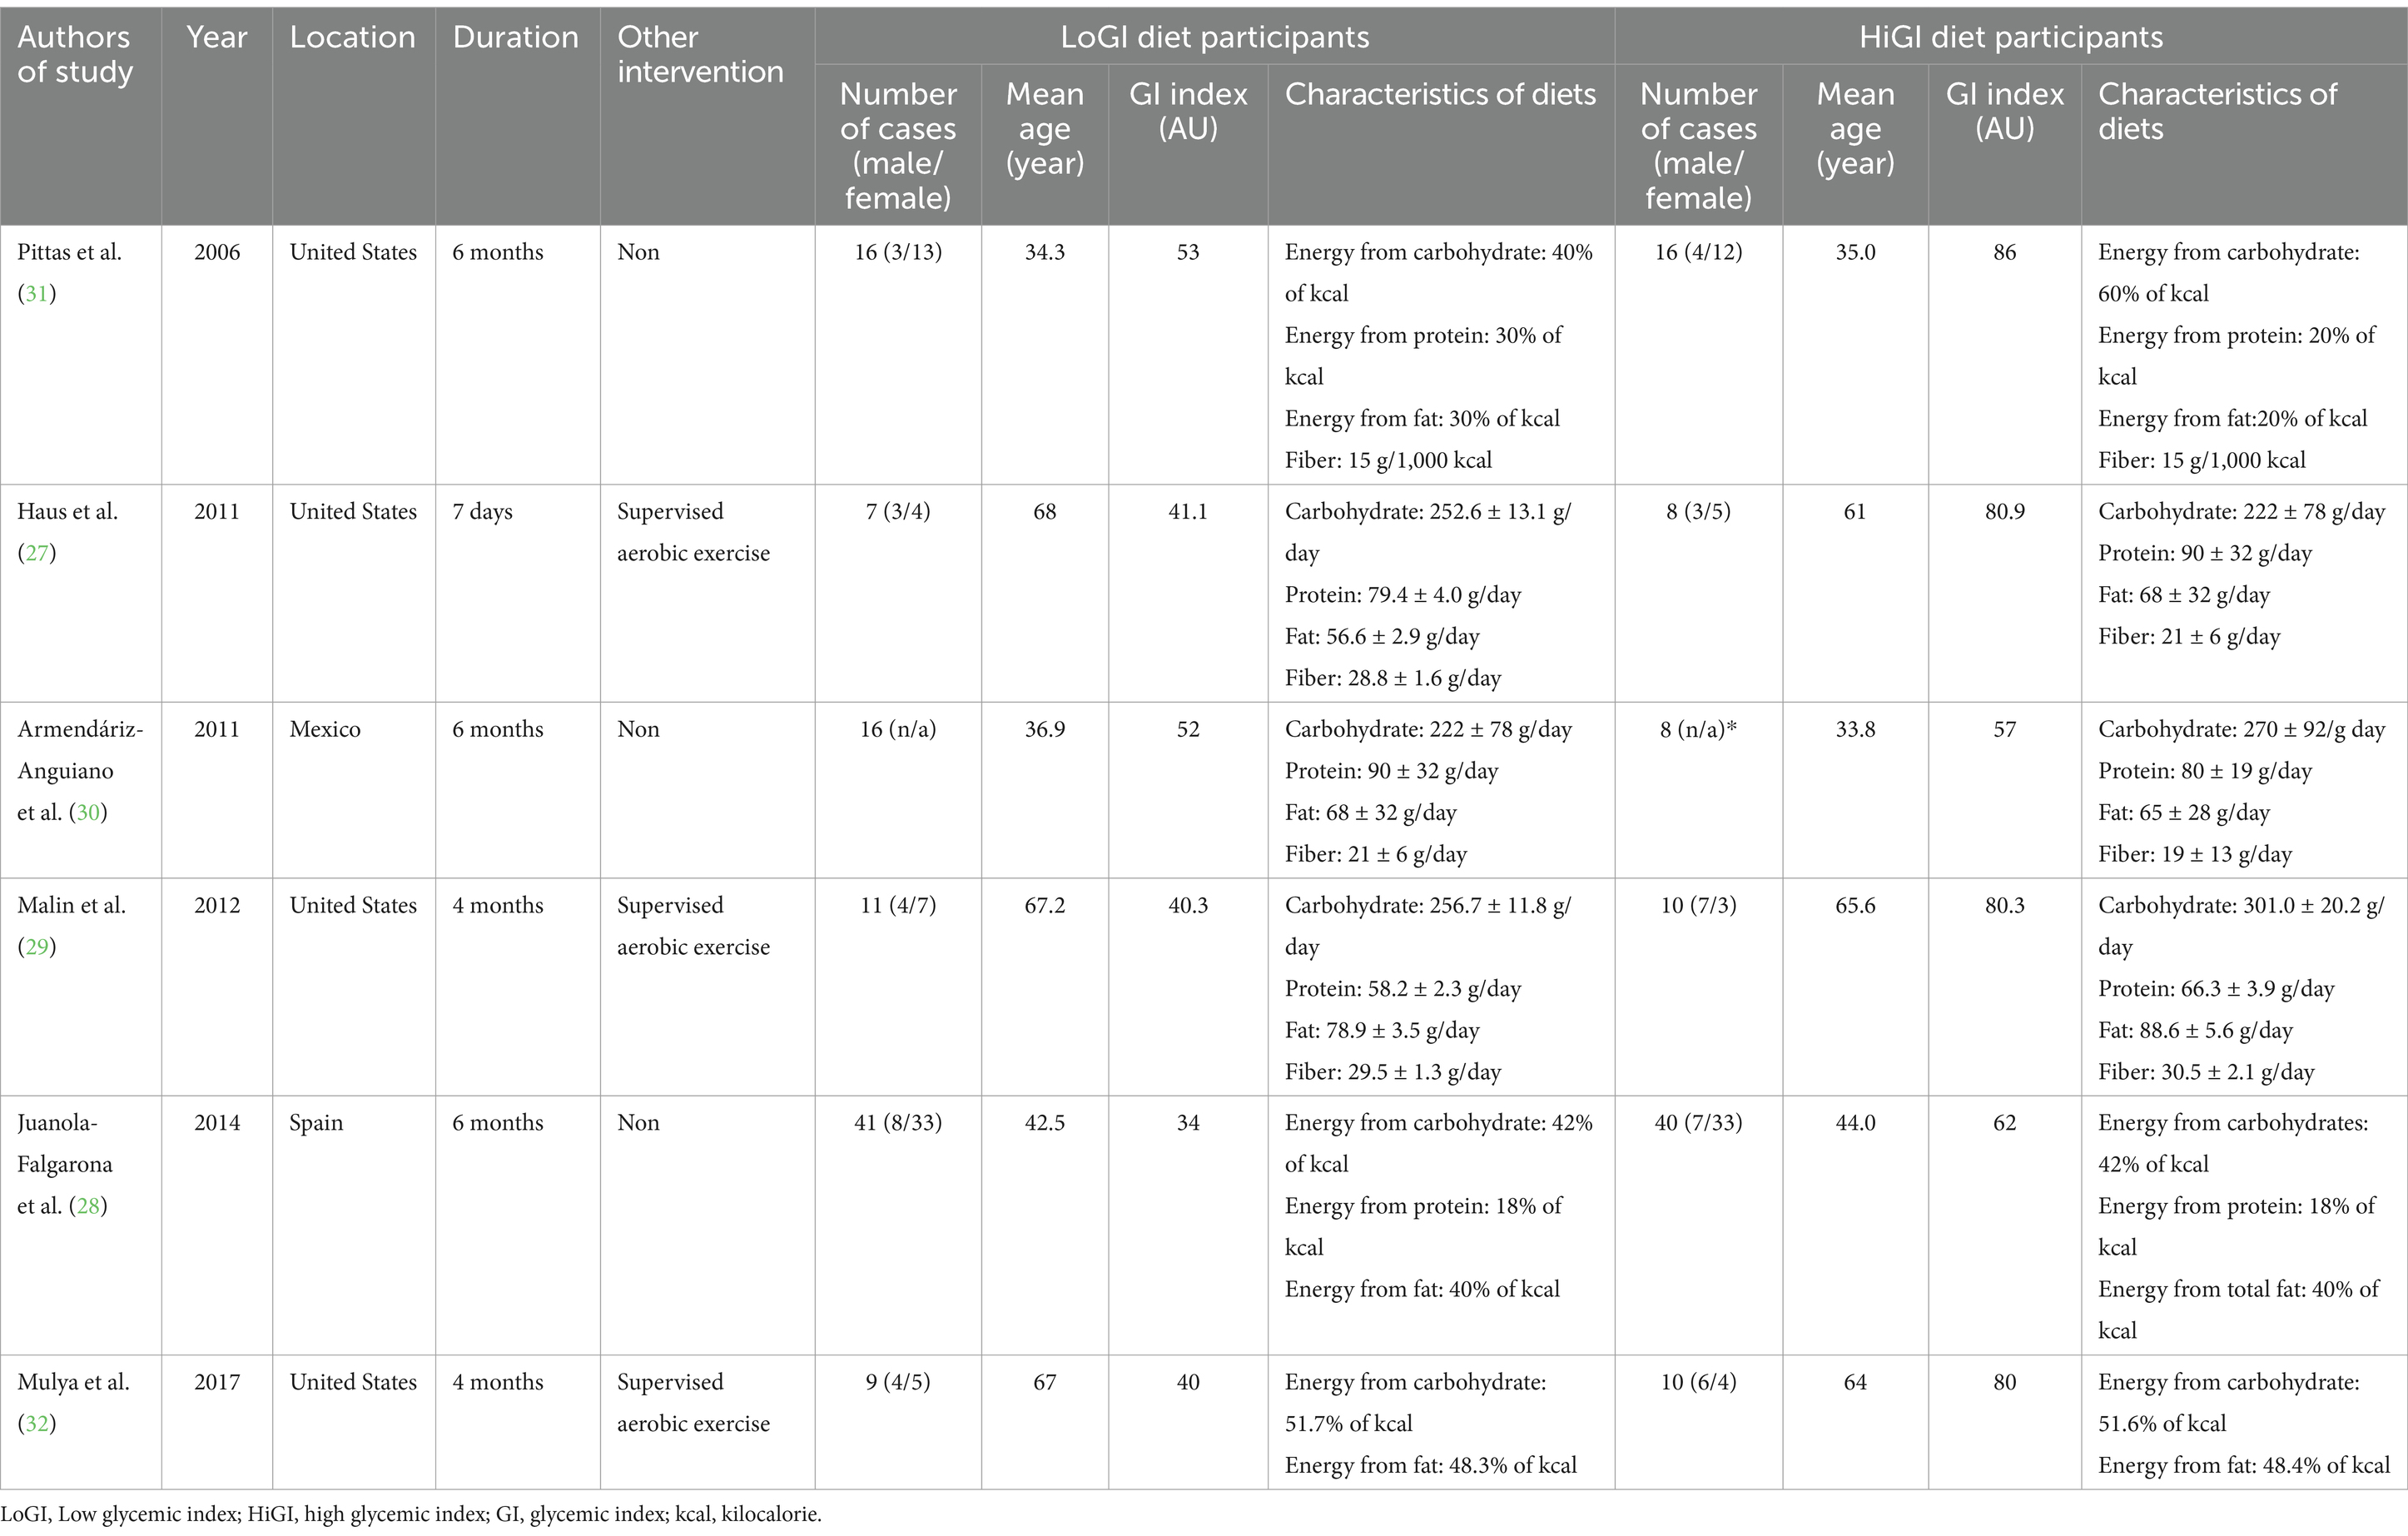
Table 1. Characteristics of included studies.
The duration of the included studies ranged from 1 week to 6 months. The mean age of the participants ranged from 34.3 to 68 years. The characteristics of the LoGI/HiGI dietary interventions included in the present meta-analysis are presented in Table 2. Of the included RCTs, four involved intervention diets prepared or recorded by the researchers, whereas two studies used diets suggested by a dietitian and prepared by the participants themselves (28, 30). Three trials involved supervised aerobic exercises such as treadmill walking (27, 29, 32). Moreover, two RCTs (28, 31) employed hypocaloric meals, and three employed isocaloric meals (27, 29, 32).
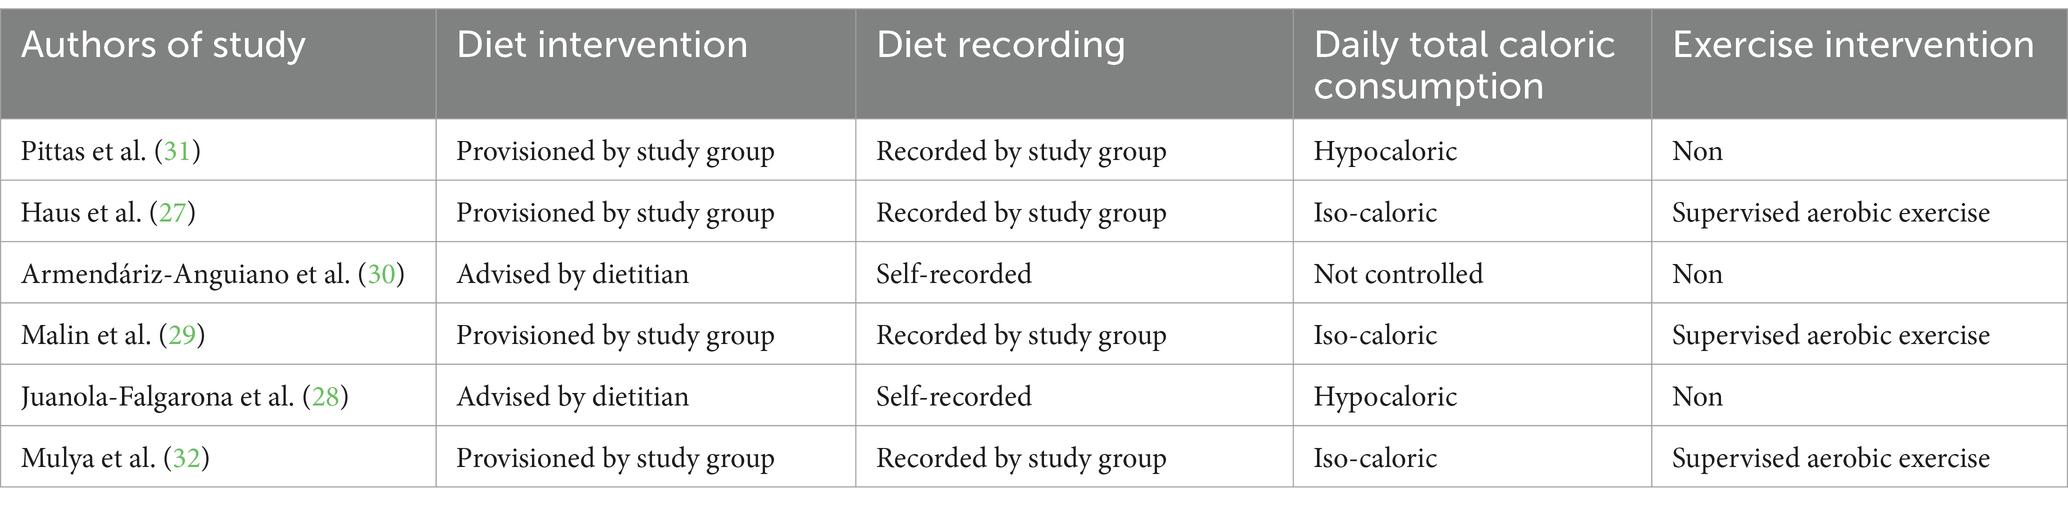
Table 2. Diet control design of the studies.
The studies included in our analysis were conducted in the United States, Mexico, or Spain.
The ROB assessment revealed varied methodological quality among studies (Figure 2). Because the intervention in the RCTs was the type of diet administered, establishing a double-blind protocol was not usually possible. Random sequence generation was explicitly reported in two studies (28, 31), while others lacked sufficient details, leading to an unclear risk of bias in this domain. Double-blinding was not feasible in most dietary intervention studies, with only one study (31) attempting blinding of outcomes, resulting in high performance and detection bias risks. The lack of outcome assessment blinding in the studies led to significant performance and detection bias, particularly for subjective outcomes like self-reported dietary adherence. Selective reporting is uniformly rated as low risk, showcasing consistency in this parameter.
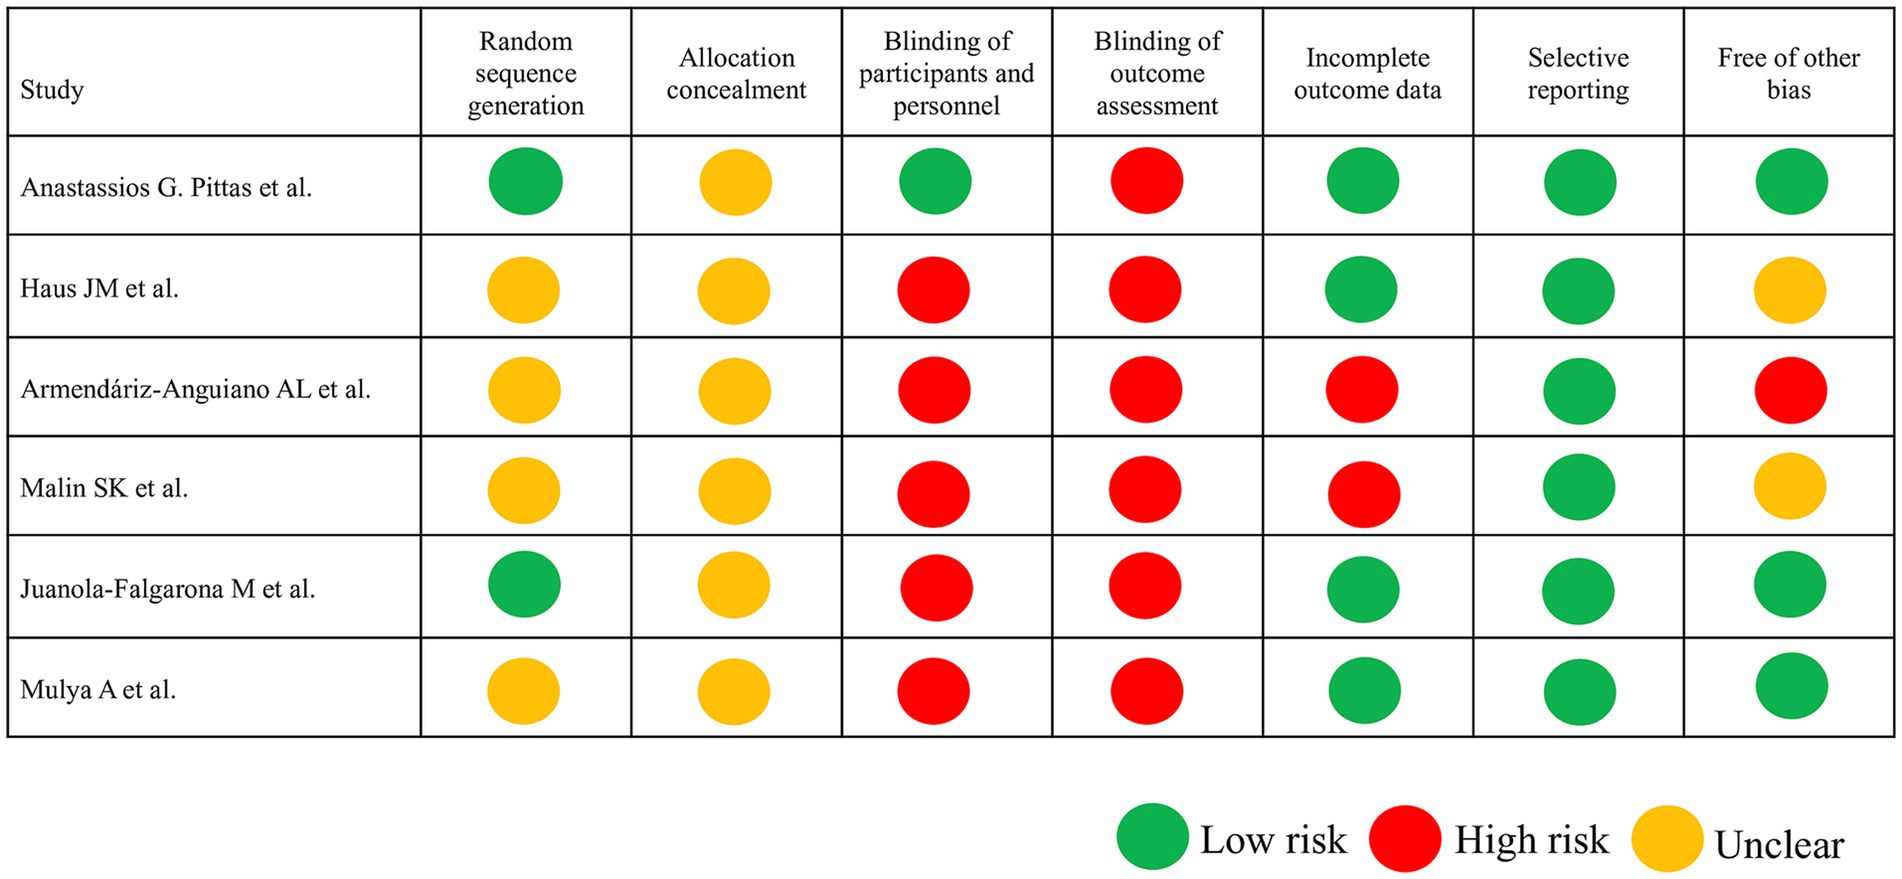
Figure 2. Risk of bias assessment according to the Cochrane guidelines. In the six included trials, low risk of bias is indicated by a green circle, unclear risk of bias is indicated by a yellow circle, and high risk of bias is indicated by a red circle.
A comparison of HOMA-IR values before and after dietary interventions revealed that two of the six RCTs demonstrated a substantial decrease in IR in response to the LoGI diet compared with the HiGI diet (27, 31). Four of the six RCTs observed no significant difference in HOMA-IR between the LoGI and HiGI arms (28–30, 32) (Figure 3). However, the results of the overall meta-analysis with a random effect suggested that the LoGI diet resulted in a substantially lower IR than the HiGI diet (SMD, 0.31; 95% CI, 0.01–0.61). Substantial heterogeneity was observed between the trials (I2 = 81.3%, p < 0.001), and the funnel plot (Egger’s test) indicated no significant evidence of small-study effects or publication bias (p = 0.092; Figure 4).
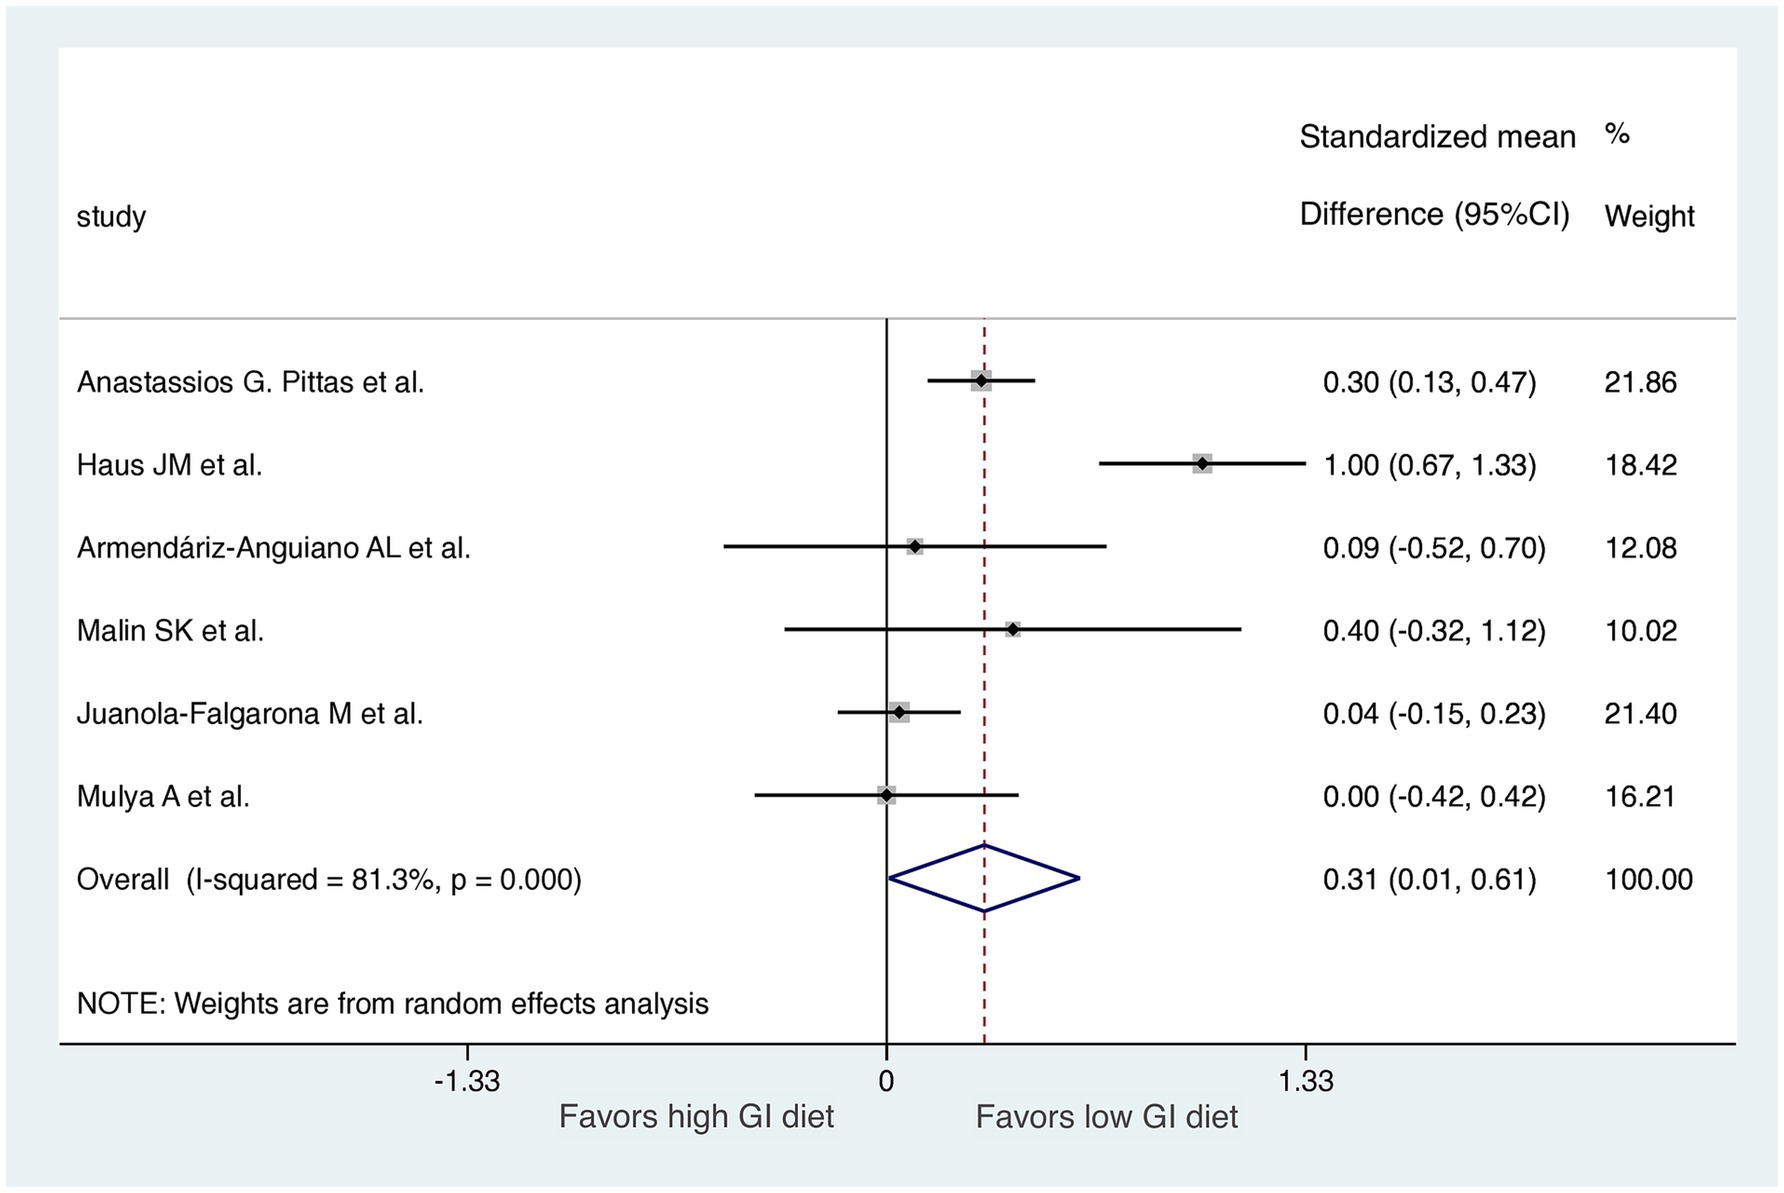
Figure 3. Forest plot of standardized mean differences in HOMA-IR scores between high GI and low-GI diets in the six included randomized controlled trials. For each study, the shaded square indicates the estimated effect of the intervention. A horizontal line connects the lowest and highest points of the 95% CIs for these effects. The size of the shaded square indicates the influence of the study in the overall meta-analysis. At the bottom of the graph, the diamond represents the combined weighted standardized mean difference of HOMA-IR and the 95% CI for the five included studies. CI, confidence interval; GI, glycemic index; HOMA-IR, homeostatic model assessment for insulin resistance.
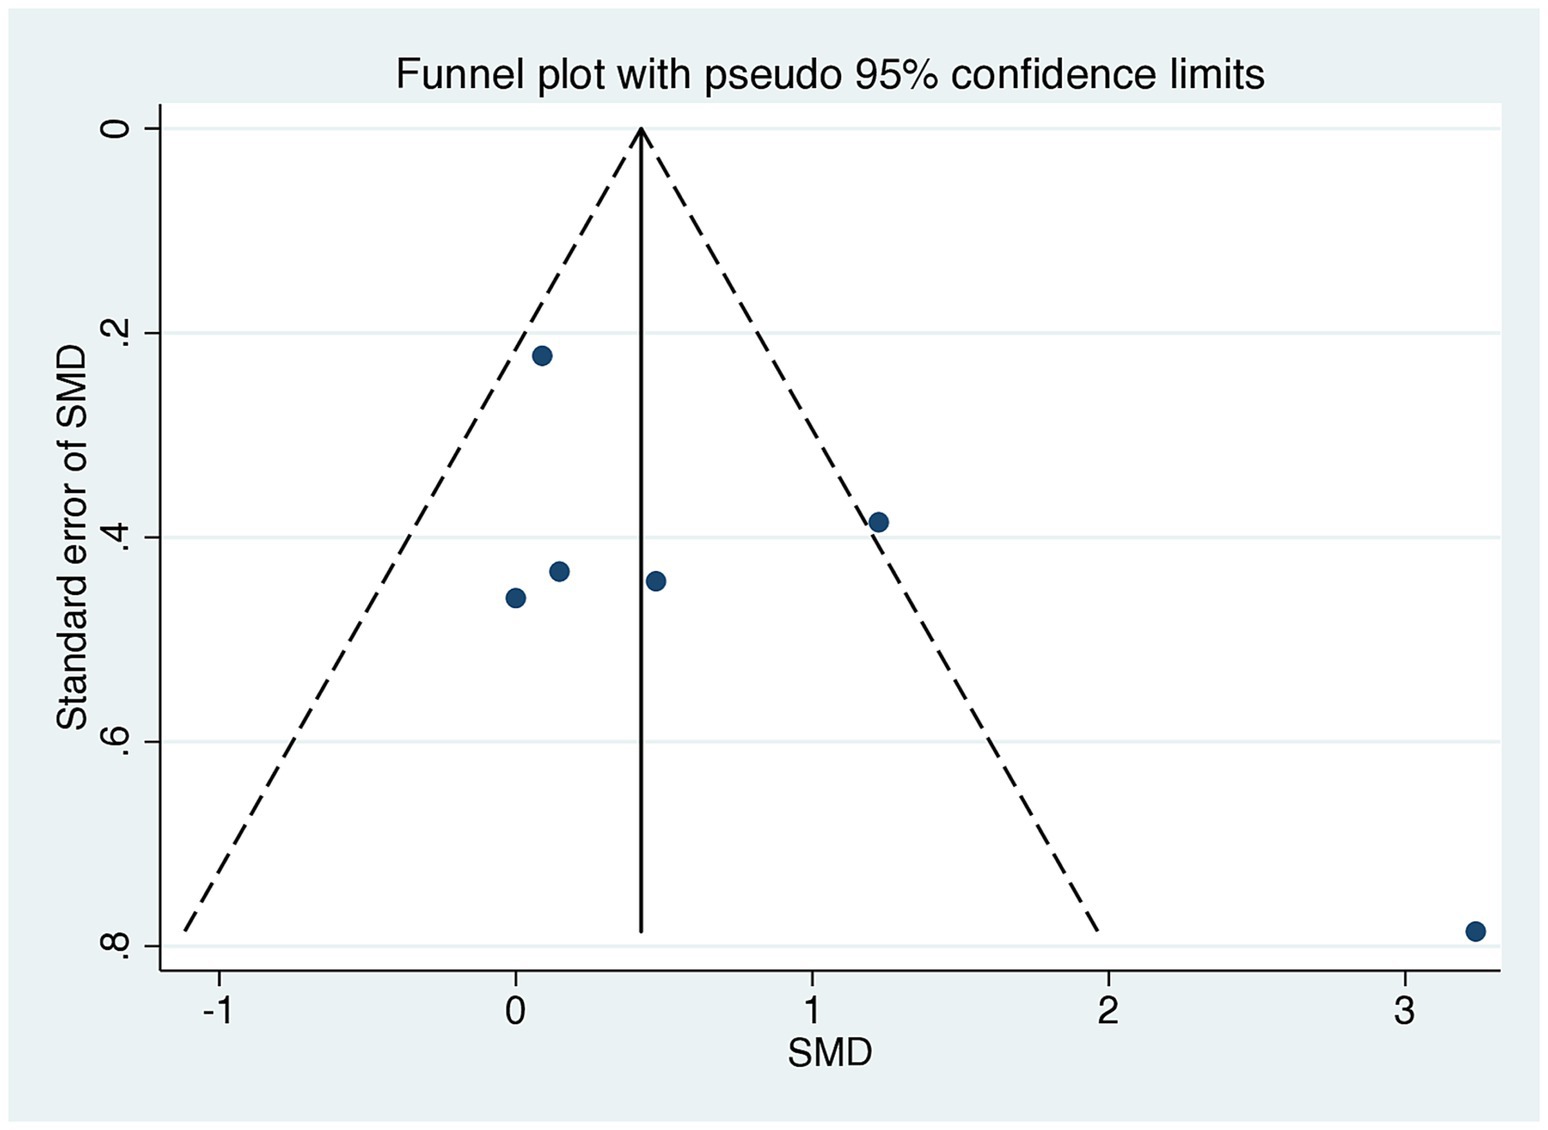
Figure 4. Funnel plots evaluating publication bias in studies comparing HOMA-IR levels in low GI and high GI diets. Egger’s test revealed no significant publication bias (p = 0.140). SMD, standardized mean difference; CI, confidence interval; GI, glycemic index; HOMA-IR, homeostatic model assessment for insulin resistance.
Studies were segmented by follow-up duration in a sensitive analysis. We excluded one study with only a 7-day follow-up (27). The results of the meta-analysis revealed a significant difference in HOMA-IR score improvement between the LoGI and HiGI diets (mean difference, 0.16; 95% CI, 0.01–0.31; Figure 5). Moreover, the sensitive analysis by excluding a 7-day follow up study reduced heterogeneity (I2 = 81.3 to 20.9%), indicating that this study was the primary contributor to the heterogeneity.
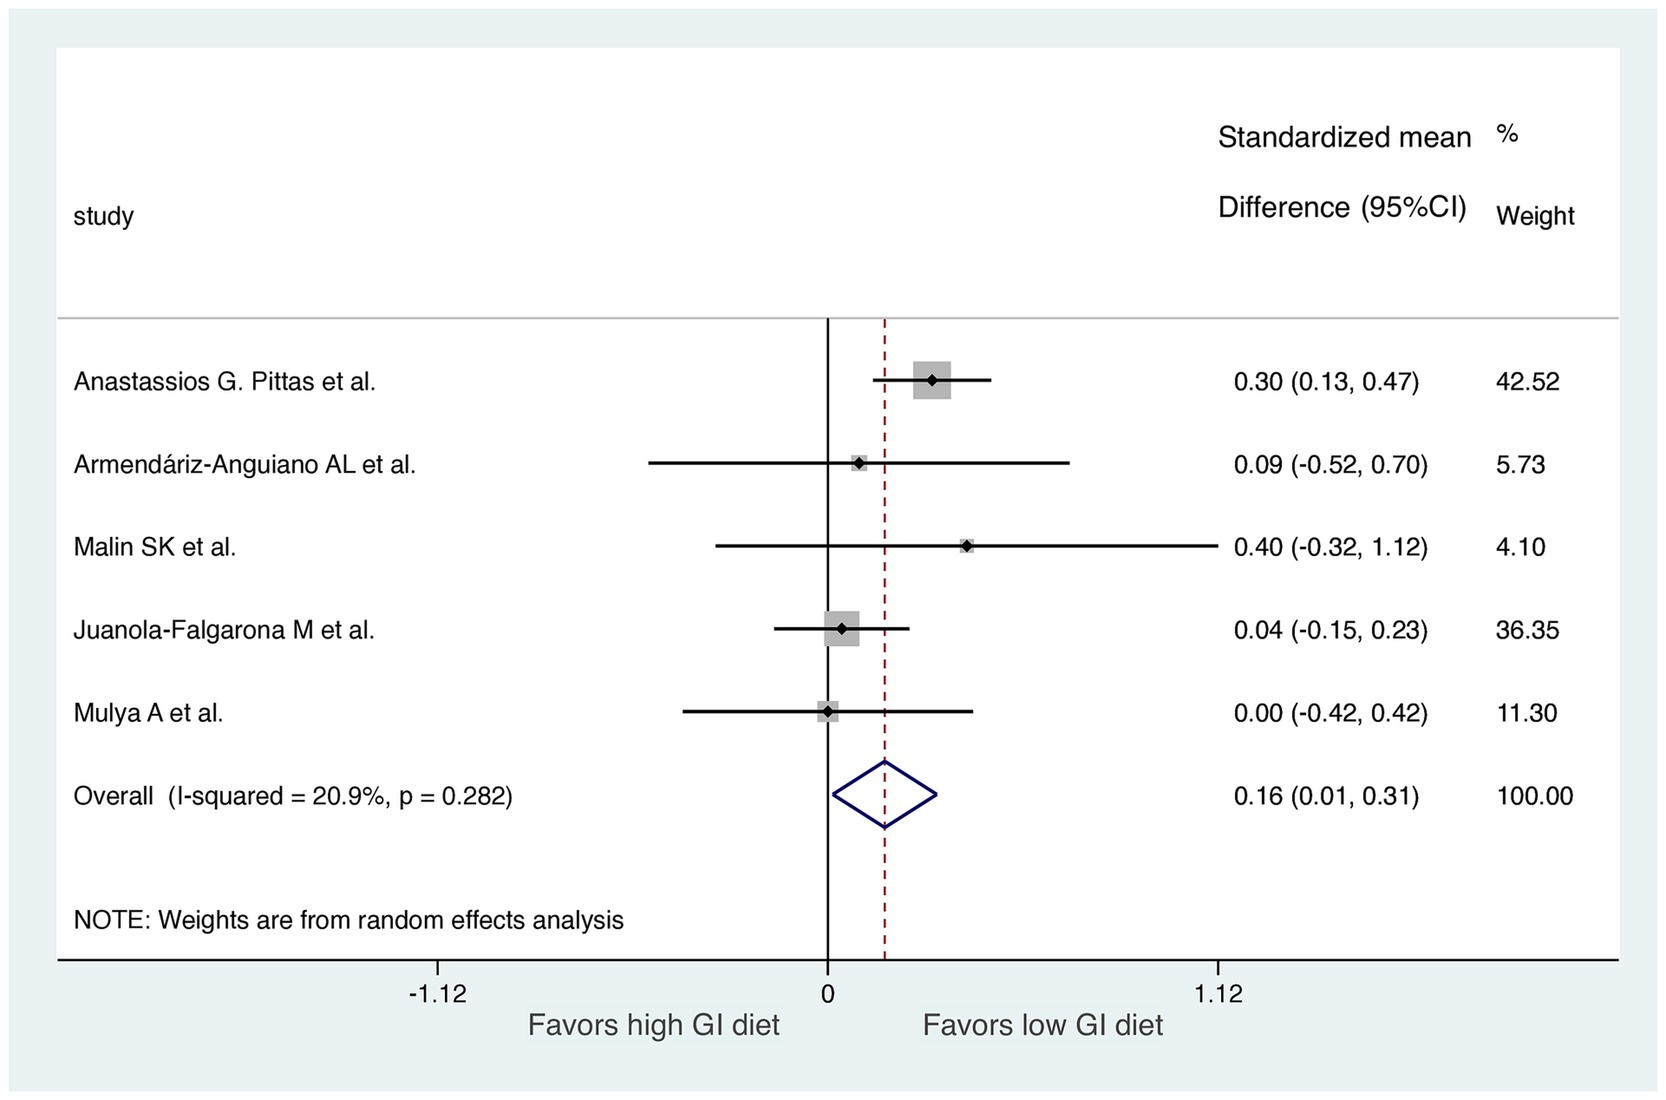
Figure 5. Sensitive analysis excluding the study with a follow-up time of 1 week. For each study, the shaded square indicates the estimated effect of the intervention. A horizontal line connects the lowest and highest points of the 95% CIs for these effects. The size of the shaded square indicates the influence of the study in the overall meta-analysis. At the bottom of the graph, the diamond represents the combined weighted standardized mean difference of HOMA-IR and the 95% CI for the five included studies. CI, confidence interval; GI, glycemic index; HOMA-IR, homeostatic model assessment for insulin resistance.
We performed two subgroup analyses to assess diet GI methods and exercise types in the RCTs, excluding the 7-day follow-up study (Figures 6, 7). RCTs that provided diets directly from a hospital (31) or the study group (29, 32) were classified into a “study control” group. RCTs that required participants to prepare their own diets according to individualized menus (30) or following the advice of a dietitian (28) were classified as a “self-report” group. The results revealed significant improvements in HOMA-IR (LoGI vs. HiGI diets) in the study control group (SMD, 0.26; 95% CI 0.11–0.42) but not in the self-report group (SMD, 0.04; 95% CI −0.14 to 0.23) (Figure 6). In the supervised aerobic exercise group (29, 32), the LoGI diet did not significantly improve in HOMA-IR (SMD, 0.10; 95% CI, −0.26 to 0.46). Similarly, studies without supervised exercise (28, 30, 31) also showed no significant improvement (SMD, 0.17; 95% CI, −0.04 to 0.37). However, there is a trend favoring the LOGI diet (Figure 7).
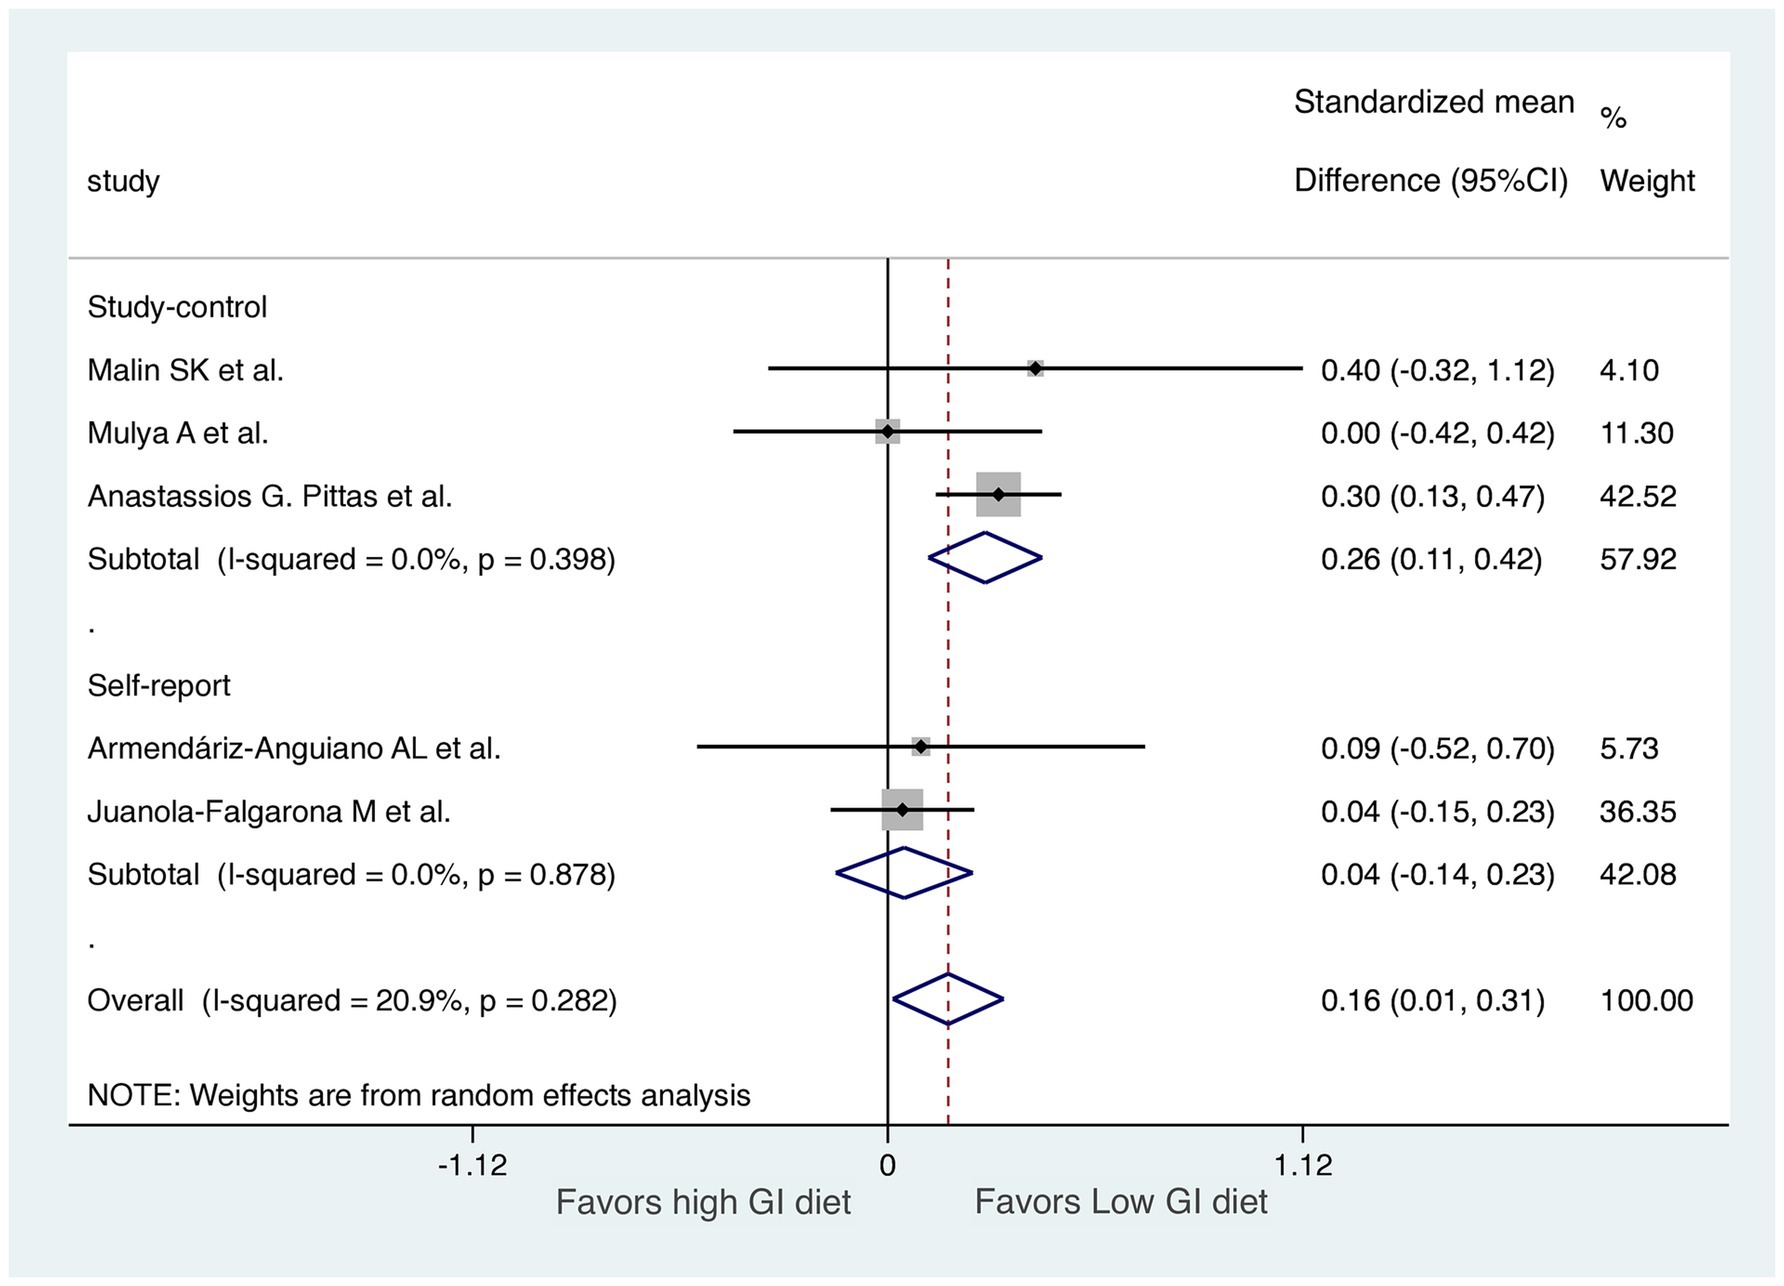
Figure 6. Subgroup analysis by method recording the diet (study control vs. self-report). For each study, the shaded square indicates the estimated effect of the intervention. A horizontal line connects the lowest and highest points of the 95% CIs for these effects. The size of the shaded square indicates the influence of the study in the overall meta-analysis. At the bottom of the graph, the diamond represents the combined weighted standardized mean difference of HOMA-IR and the 95% CI for the five included studies. CI, confidence interval; GI, glycemic index; HOMA-IR, homeostatic model assessment for insulin resistance.
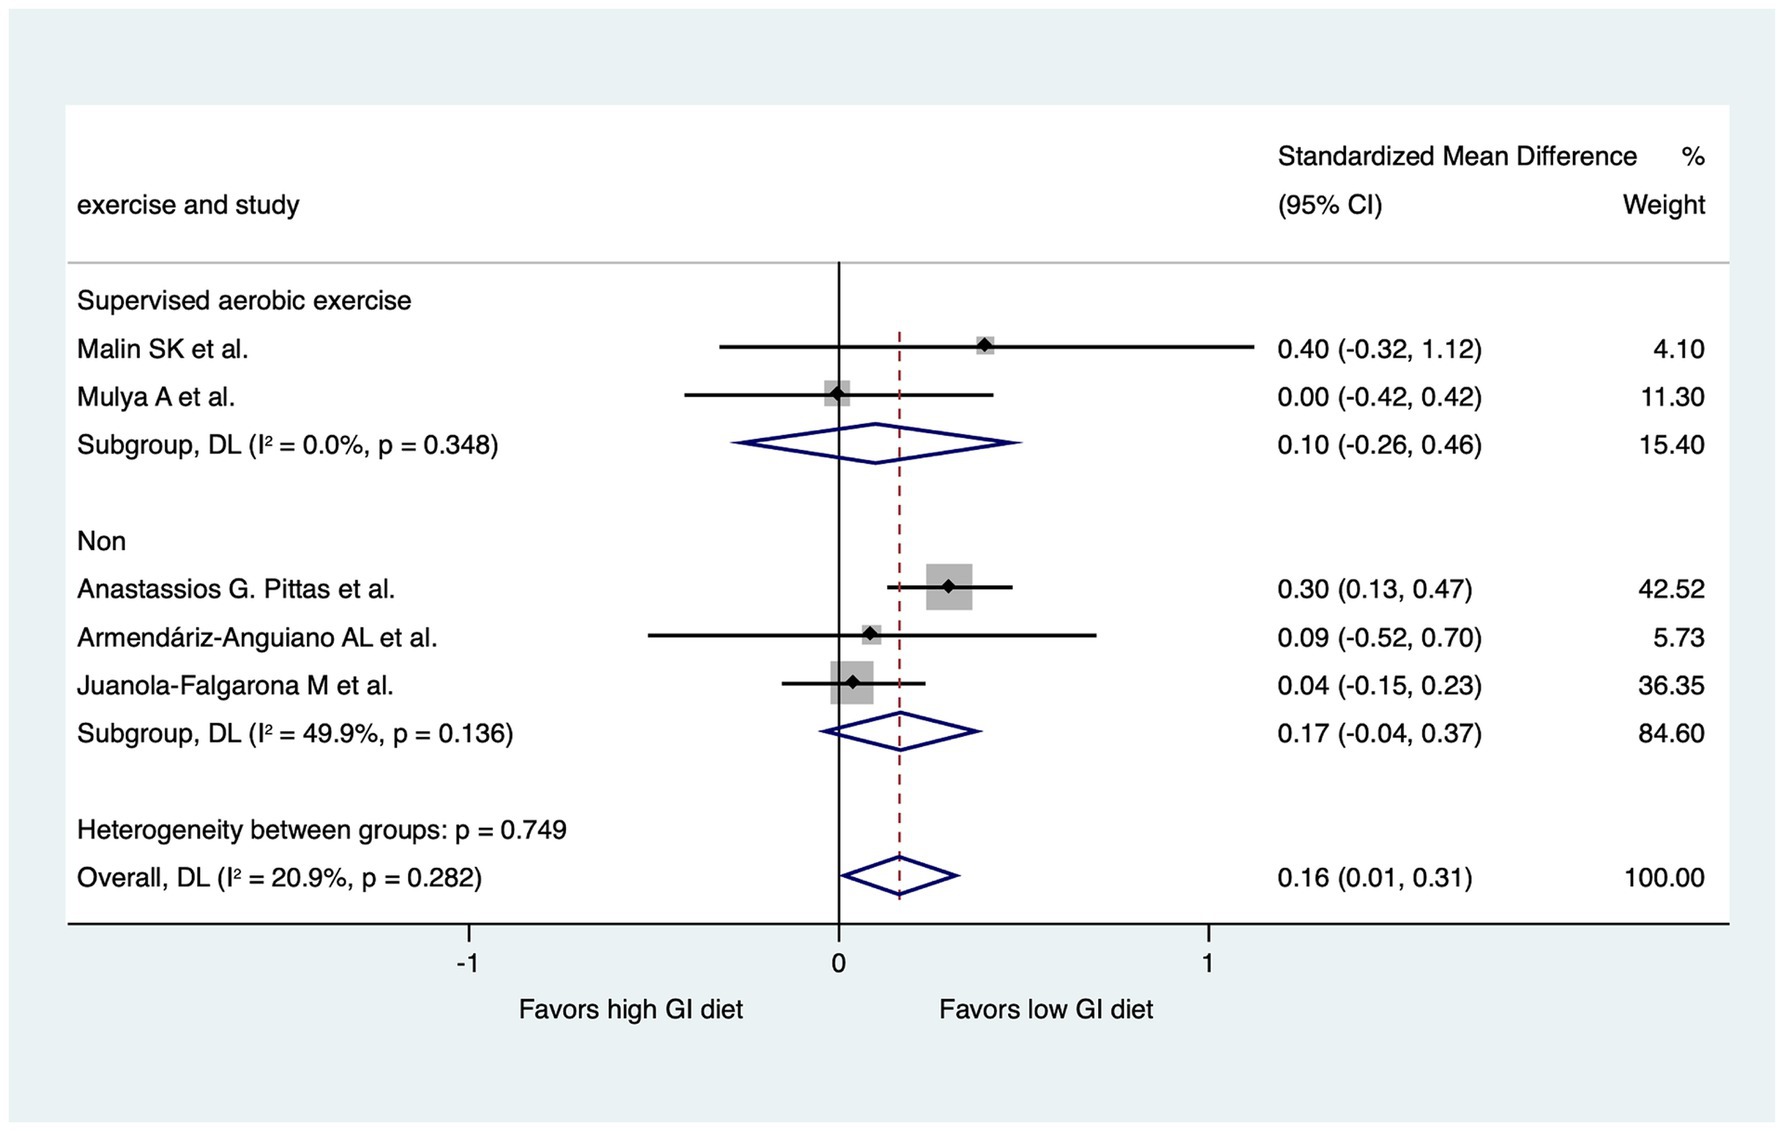
Figure 7. Subgroup analysis by the presence of supervised aerobic exercise. For each study, the shaded square indicates the estimated effect of the intervention. A horizontal line connects the lowest and highest points of the 95% CIs for these effects. The size of the shaded square indicates the influence of the study in the overall meta-analysis. At the bottom of the graph, the diamond represents the combined weighted standardized mean difference of HOMA-IR and the 95% CI for the five included studies. CI, confidence interval; GI, glycemic index; HOMA-IR, homeostatic model assessment for insulin resistance.
Our meta-analysis of noncrossover RCTs revealed that LoGI diet groups had substantially lower IR than HiGI diet groups in the population without diabetes mellitus. To our knowledge, this is the first meta-analysis to focus on the effects of LoGI diets and HiGI diets with clearly defined GIs on IR in adults without diabetes mellitus with comparable IR levels (assessed using HOMA-IR). Our findings indicate that LoGI diets may benefit individuals without diabetes mellitus. This study underscores the need to incorporate LoGI dietary recommendations into preventive healthcare practices and public health policies focused on diabetes prevention.
The clinical significance of the findings in this study lies in the demonstrated benefits of a LoGI diet in improving IR in adults without diabetes mellitus. While the SMD of 0.31 (95% CI: 0.01–0.61) suggests a small to moderate effect size (33), this improvement is clinically meaningful. Even modest reductions in HOMA-IR can contribute to better insulin sensitivity, potentially reducing the risk of developing type 2 diabetes mellitus over time (34, 35). Reducing the incidence of type 2 diabetes will lead to significant improvements in cardiovascular health by lowering the risks associated with heart disease and related complications (36).
A LoGI diet, which has proven benefits for individuals with type 2 diabetes mellitus, also benefits healthy individuals (37). LoGI diets enhance IR through several mechanisms. They help stabilize blood sugar and insulin levels by reducing spikes in blood glucose and insulin that typically occur after consuming meals (14). This stabilization persists throughout the day, providing a more consistent metabolic environment, which not only lowers the risk of heart disease but also improves the insulin sensitivity over time. In contrast, individuals who follow HiGI diets tend to experience elevated levels of circulating free fatty acids, which can interfere with proper insulin signaling. Consequently, these increased fatty acid levels contribute to the accumulation of fat in various tissues of liver and muscles. This buildup of fat further disrupts metabolic processes, ultimately leading to an increased risk of IR (38). In comparison, a LoGI diet lowers levels of these fatty acids, improving insulin resistance over time. Furthermore, one meta-analysis (39) uncovered an association of LoGI diets with weight loss. This association is significant because weight loss plays an important role in improving overall health and reducing factors that contribute to cardiovascular diseases (40). By promoting healthier weight management, LoGI diets can help lower the risk of heart-related conditions and improve metabolic outcomes. Finally, Finally, LoGI diets may have an impact on gut hormones, including glucose-dependent insulinotropic polypeptides, which play a role in regulating important metabolic processes. These hormones are involved in promoting insulin secretion in response to food intake, helping the body effectively manage blood glucose levels. By influencing the activity of these gut hormones, LoGI diets can support better glucose regulation and contribute to improved insulin dynamics over time, enhancing overall metabolic control (41).
Shikany et al. conducted a crossover RCT involving 24 obese patients without diabetes mellitus and demonstrated that fasting glucose and insulin decreased in the LoGI diet group compared with the HiGI diet group, although this decrease was not statistically significant (42). However, Gao et al. revealed a substantial decrease in IR in a single-center crossover study that compared a LoGI diet with a normal GI hospital diet (43). These results suggest that in diets with a high carbohydrate content, those with a LoGI decreased insulin sensitivity significantly (−20%, p = 0.002) compared with HiGI diets, a benefit not observed in diets with a low carbohydrate content. Crossover study design has frequently been used in nutritional intervention trials; however, to avoid a “carryover effect” due to a lack of uniformity in the duration of the LoGI/HiGI follow-up time, we selected RCTs without crossover designs (44).
Although a previous study demonstrated that IR is dynamic and can be altered in as few as 3 days after dietary and lifestyle changes (45), we excluded one study that had a short observation period (7 days) to avoid the bias of insufficient follow-up time (27). After excluding this study, relative to HiGI diets, LoGI diets became more beneficial in terms of changes in HOMA-IR in adults without diabetes mellitus. Our results also revealed that the RCTs with diets prepared by the researchers or the study group exhibited a substantial difference in HOMA-IR between LoGI and HiGI diets not observed in studies with diets prepared and reported by the participants themselves. This variation in HOMA-IR between food preparation methods may be due to a recall bias induced by the self-prepared and self-reported methodologies.
Regular supervised aerobic exercise, often combined with resistance training, shows consistent improvements in glucose metabolism, reducing HOMA-IR in those with metabolic syndrome (46). However, in our subgroup analysis, we did not observe the significant improvement in HOMA-IR within the supervised aerobic exercise group. This lack of improvement is likely attributable to several factors, including a small sample size and the considerable variability in the exercise protocols employed across the studies. Therefore, further study is needed to clarified it.
The substantial heterogeneity observed in the initial meta-analysis (I2 = 81.3%,) was significantly reduced to 20.9% after excluding a study with short follow-up durations, specifically the study with a 7-day follow-up (as shown in Figures 3, 5). This indicates that the short follow-up period was a major contributor to the heterogeneity in this meta-analysis. Short follow-up durations may not allow sufficient time for dietary interventions to produce measurable changes in insulin resistance, leading to variability in the results. In our analysis, the significant association continued to hold even after the exclusion of the study with a 7-day follow-up period. This exclusion resulted in a notable reduction in heterogeneity, suggesting that the findings became more consistent and less influenced by variability between studies.
Our study has several strengths. First, we only included RCTs with clearly defined LoGI/HiGI dietary interventions, which can be more easily interpreted than observational cohort studies. Second, we conducted a subgroup analysis to determine whether dietary source had a significant effect on the results of the meta-analysis in the event that the self-reported design introduced a recall bias. Third, we used the random-effects model to obtain accurate results despite substantial heterogeneity among studies (I2 = 81.3%). This model accounts for variations in true effect sizes across studies, considering both within-study and between-study differences, making it suitable for diverse study characteristics. In contrast, a fixed-effects model assumes a single true effect size, ignoring between-study variability, which could narrow confidence intervals, underestimate uncertainty, and overstate precision. Thus, the random-effects model ensured more reliable conclusions.
Despite these strengths, our study has some limitations. First, our study included studies employing diets with various caloric intakes; therefore, the effects of dietary glucose loading independent of caloric restriction could not be assessed. Various studies have revealed that caloric and other macronutrient components are individually associated with metabolic parameters (47, 48). However, because we only included RCTs, this limitation is unlikely to have prejudiced our results. Second, excluding crossover RCTs to avoid the carryover effect may have led to the omission of relevant data that could contribute to understanding the short-term dynamics of IR changes in response to dietary interventions. Finally, The small sample sizes in the included RCTs may reduce the power and reliability of the meta-analysis, increasing the risk of Type II errors, imprecise effect size estimates, wider confidence intervals, and greater susceptibility to heterogeneity and publication bias. Larger, well-designed studies across diverse regions are needed to clarify the effects of varying GI diets on insulin resistance in healthy individuals. Finally, the sample sizes of the included RCTs were small, and additional large-scale studies in diverse regions are required to elucidate the effects of varying GI diets on the IR of healthy individuals.
This meta-analysis based on Cochrane methodology revealed that a LoGI diet was associated with a significantly lower HOMA-IR than a HiGI diet in adults without diabetes mellitus. This finding indicates that early intervention with a LoGI diet can reduce the risk of developing diabetes mellitus by decreasing IR.
The original contributions presented in the study are included in the article/Supplementary material, further inquiries can be directed to the corresponding author.
Y-TY: Writing – original draft, Writing – review & editing, Data curation, Formal analysis, Investigation, Methodology. Y-HF: Writing – original draft, Writing – review & editing, Conceptualization, Data curation, Formal analysis, Investigation, Methodology. Y-HC: Writing – original draft. Y-WF: Supervision, Writing – review & editing. M-HT: Conceptualization, Data curation, Formal analysis, Investigation, Methodology, Project administration, Software, Supervision, Writing – original draft, Writing – review & editing, Resources.
The author(s) declare that financial support was received for the research, authorship, and/or publication of this article. Shin Kong Wu Ho-Su Memorial Hospital (2022SKHADR005) sponsored this study.
We thank the statistical division of the artificial intelligence center of Shin Kong Wu Ho-Su Memorial Hospital for their assistance with the statistical analysis. This manuscript was edited by Wallace Academic Editing.
The authors declare that the research was conducted in the absence of any commercial or financial relationships that could be construed as a potential conflict of interest.
All claims expressed in this article are solely those of the authors and do not necessarily represent those of their affiliated organizations, or those of the publisher, the editors and the reviewers. Any product that may be evaluated in this article, or claim that may be made by its manufacturer, is not guaranteed or endorsed by the publisher.
The Supplementary material for this article can be found online at: https://www.frontiersin.org/articles/10.3389/fnut.2025.1458353/full#supplementary-material
1. ^https://pubmed.ncbi.nlm.nih.gov/; accessed 01 February 2025.
2. ^https://www.embase.com; accessed 01 February 2025.
3. ^https://www.cochranelibrary.com; accessed 01 February 2025.
4. ^https://clinicaltrials.gov/; accessed 01 February 2025.
1. Saeedi, P, Petersohn, I, Salpea, P, Malanda, B, Karuranga, S, Unwin, N, et al. Global and regional diabetes prevalence estimates for 2019 and projections for 2030 and 2045: results from the international diabetes federation diabetes atlas, 9(th) edition. Diabetes Res Clin Pract. (2019) 157:107843. doi: 10.1016/j.diabres.2019.107843
2. Khan, MAB, Hashim, MJ, King, JK, Govender, RD, Mustafa, H, and al Kaabi, J. Epidemiology of type 2 diabetes-global burden of disease and forecasted trends. J Epidemiol Glob Health. (2020) 10:107–11. doi: 10.2991/jegh.k.191028.001
3. WHO. Global status report on noncommunicable diseases 2014 WHO (2014). Available at: https://fctc.who.int/resources/publications/i/item/9789241564854
4. Uusitupa, M, Khan, TA, Viguiliouk, E, Kahleova, H, Rivellese, AA, Hermansen, K, et al. Prevention of type 2 diabetes by lifestyle changes: a systematic review and meta-analysis. Nutrients. (2019) 11:2611. doi: 10.3390/nu11112611
5. Jenkins, DJ, Wolever, TM, Taylor, RH, Barker, H, Fielden, H, Baldwin, JM, et al. Glycemic index of foods: a physiological basis for carbohydrate exchange. Am J Clin Nutr. (1981) 34:362–6. doi: 10.1093/ajcn/34.3.362
6. Barclay, AW, Augustin, LSA, Brighenti, F, Delport, E, Henry, CJ, Sievenpiper, JL, et al. Dietary Glycaemic index labelling: a global perspective. Nutrients. (2021) 13:3244. doi: 10.3390/nu13093244
7. Wang, Q, Xia, W, Zhao, Z, and Zhang, H. Effects comparison between low glycemic index diets and high glycemic index diets on HbA1c and fructosamine for patients with diabetes: a systematic review and meta-analysis. Prim Care Diabetes. (2015) 9:362–9. doi: 10.1016/j.pcd.2014.10.008
8. Ojo, O, Ojo, O, Adebowale, F, and Wang, XH. The effect of dietary Glycaemic index on glycaemia in patients with type 2 diabetes: a systematic review and Meta-analysis of randomized controlled trials. Nutrients. (2018) 10:373. doi: 10.3390/nu10030373
9. Greenwood, DC, Threapleton, DE, Evans, CEL, Cleghorn, CL, Nykjaer, C, Woodhead, C, et al. Glycemic index, glycemic load, carbohydrates, and type 2 diabetes. Diabetes Care. (2013) 36:4166–71. doi: 10.2337/dc13-0325
10. Livesey, G, Taylor, R, Livesey, HF, Buyken, AE, Jenkins, DJA, Augustin, LSA, et al. Dietary glycemic index and load and the risk of type 2 diabetes: a systematic review and updated Meta-analyses of prospective cohort studies. Nutrients. (2019) 11:1280. doi: 10.3390/nu11061280
11. Matthews, DR, Hosker, JP, Rudenski, AS, Naylor, BA, Treacher, DF, and Turner, RC. Homeostasis model assessment: insulin resistance and beta-cell function from fasting plasma glucose and insulin concentrations in man. Diabetologia. (1985) 28:412–9. doi: 10.1007/BF00280883
12. Bonora, E, Targher, G, Alberiche, M, Bonadonna, RC, Saggiani, F, Zenere, MB, et al. Homeostasis model assessment closely mirrors the glucose clamp technique in the assessment of insulin sensitivity: studies in subjects with various degrees of glucose tolerance and insulin sensitivity. Diabetes Care. (2000) 23:57–63. doi: 10.2337/diacare.23.1.57
13. Wallace, TM, Levy, JC, and Matthews, DR. Use and abuse of HOMA modeling. Diabetes Care. (2004) 27:1487–95. doi: 10.2337/diacare.27.6.1487
14. Radulian, G, Rusu, E, Dragomir, A, and Posea, M. Metabolic effects of low glycaemic index diets. Nutr J. (2009) 8:5. doi: 10.1186/1475-2891-8-5
15. Solomon, TP, Haus, JM, Kelly, KR, Cook, MD, Filion, J, Rocco, M, et al. A low-glycemic index diet combined with exercise reduces insulin resistance, postprandial hyperinsulinemia, and glucose-dependent insulinotropic polypeptide responses in obese, prediabetic humans. Am J Clin Nutr. (2010) 92:1359–68. doi: 10.3945/ajcn.2010.29771
16. Zafar, MI, Mills, KE, Zheng, J, Regmi, A, Hu, SQ, Gou, L, et al. Low-glycemic index diets as an intervention for diabetes: a systematic review and meta-analysis. Am J Clin Nutr. (2019) 110:891–902. doi: 10.1093/ajcn/nqz149
17. Peres, M, Costa, HS, Silva, MA, and Albuquerque, TG. The health effects of low glycemic index and low glycemic load interventions on prediabetes and type 2 diabetes mellitus: a literature review of RCTs. Nutrients. (2023) 15:5060. doi: 10.3390/nu15245060
18. Du, H, Van der, DL, van Bakel, MME, van der Kallen, CJH, Blaak, EE, van Greevenbroek, MMJ, et al. Glycemic index and glycemic load in relation to food and nutrient intake and metabolic risk factors in a Dutch population. Am J Clin Nutr. (2008) 87:655–61. doi: 10.1093/ajcn/87.3.655
19. McClenaghan, NH. Determining the relationship between dietary carbohydrate intake and insulin resistance. Nutr Res Rev. (2005) 18:222–40. doi: 10.1079/NRR2005109
20. Kiens, B, and Richter, EA. Types of carbohydrate in an ordinary diet affect insulin action and muscle substrates in humans. Am J Clin Nutr. (1996) 63:47–53. doi: 10.1093/ajcn/63.1.47
21. Wolever, TM. Carbohydrate and the regulation of blood glucose and metabolism. Nutr Rev. (2003) 61:S40–8. doi: 10.1301/nr.2003.may.S40-S48
22. Frost, GS, Brynes, AE, Bovill-Taylor, C, and Dornhorst, A. A prospective randomised trial to determine the efficacy of a low glycaemic index diet given in addition to healthy eating and weight loss advice in patients with coronary heart disease. Eur J Clin Nutr. (2004) 58:121–7. doi: 10.1038/sj.ejcn.1601758
23. Page, MJ, McKenzie, JE, Bossuyt, PM, Boutron, I, Hoffmann, TC, Mulrow, CD, et al. The PRISMA 2020 statement: an updated guideline for reporting systematic reviews. BMJ. (2021) 372:n71. doi: 10.1136/bmj.n71
24. Andrade, MI, Oliveira, JS, Leal, VS, Lima, NMS, Costa, EC, Aquino, NB, et al. Identification of cutoff points for homeostatic model assessment for insulin resistance index in adolescents: systematic review. Rev Paul Pediatr. (2016) 34:234–42. doi: 10.1016/j.rpped.2015.08.006
25. Cumpston, MS, McKenzie, JE, Welch, VA, and Brennan, SE. Strengthening systematic reviews in public health: guidance in the Cochrane handbook for systematic reviews of interventions, 2nd edition. J Public Health (Oxf). (2022) 44:e588–92. doi: 10.1093/pubmed/fdac036
26. Higgins, JP, Thompson, SG, Deeks, JJ, and Altman, DG. Measuring inconsistency in meta-analyses. BMJ. (2003) 327:557–60. doi: 10.1136/bmj.327.7414.557
27. Haus, JM, Solomon, TPJ, Lu, L, Jesberger, JA, Barkoukis, H, Flask, CA, et al. Intramyocellular lipid content and insulin sensitivity are increased following a short-term low-glycemic index diet and exercise intervention. Am J Physiol Endocrinol Metab. (2011) 301:E511–6. doi: 10.1152/ajpendo.00221.2011
28. Juanola-Falgarona, M, Salas-Salvadó, J, Ibarrola-Jurado, N, Rabassa-Soler, A, Díaz-López, A, Guasch-Ferré, M, et al. Effect of the glycemic index of the diet on weight loss, modulation of satiety, inflammation, and other metabolic risk factors: a randomized controlled trial. Am J Clin Nutr. (2014) 100:27–35. doi: 10.3945/ajcn.113.081216
29. Malin, SK, Niemi, N, Solomon, TPJ, Haus, JM, Kelly, KR, Filion, J, et al. Exercise training with weight loss and either a high-or low-glycemic index diet reduces metabolic syndrome severity in older adults. Ann Nutr Metab. (2012) 61:135–41. doi: 10.1159/000342084
30. Armendariz-Anguiano, AL, Jiménez-Cruz, A, Bacardí-Gascón, M, and Hurtado-Ayala, L. Effect of a low glycemic load on body composition and homeostasis model assessment (HOMA) in overweight and obese subjects. Nutr Hosp. (2011) 26:170–5. doi: 10.3305/nh.2011.26.1.4620
31. Pittas, AG, Roberts, SB, das, SK, Gilhooly, CH, Saltzman, E, Golden, J, et al. The effects of the dietary glycemic load on type 2 diabetes risk factors during weight loss. Obesity (Silver Spring). (2006) 14:2200–9. doi: 10.1038/oby.2006.258
32. Mulya, A, Haus, JM, Solomon, TPJ, Kelly, KR, Malin, SK, Rocco, M, et al. Exercise training-induced improvement in skeletal muscle PGC-1alpha-mediated fat metabolism is independent of dietary glycemic index. Obesity (Silver Spring). (2017) 25:721–9. doi: 10.1002/oby.21799
33. Cherubini, JM, and MacDonald, MJ. Statistical inferences using effect sizes in human endothelial function research. Artery Res. (2021) 27:176–85. doi: 10.1007/s44200-021-00006-6
34. Lee, J, Kim, MH, Jang, JY, and Oh, CM. Assessment HOMA as a predictor for new onset diabetes mellitus and diabetic complications in non-diabetic adults: a KoGES prospective cohort study. Clin Diabetes Endocrinol. (2023) 9:7. doi: 10.1186/s40842-023-00156-3
35. Morimoto, A, Tatsumi, Y, Soyano, F, Miyamatsu, N, Sonoda, N, Godai, K, et al. Increase in homeostasis model assessment of insulin resistance (HOMA-IR) had a strong impact on the development of type 2 diabetes in Japanese individuals with impaired insulin secretion: the Saku study. PLoS One. (2014) 9:e105827. doi: 10.1371/journal.pone.0105827
36. Martín-Timón, I, Sevillano-Collantes, C, Segura-Galindo, A, and del Cañizo-Gómez, F. Type 2 diabetes and cardiovascular disease: have all risk factors the same strength? World J Diabetes. (2014) 5:444–70. doi: 10.4239/wjd.v5.i4.444
37. Rizkalla, SW, Taghrid, L, Laromiguiere, M, Huet, D́, Boillot, J, Rigoir, A, et al. Improved plasma glucose control, whole-body glucose utilization, and lipid profile on a low-glycemic index diet in type 2 diabetic men: a randomized controlled trial. Diabetes Care. (2004) 27:1866–72. doi: 10.2337/diacare.27.8.1866
38. Lara-Castro, C, and Garvey, WT. Intracellular lipid accumulation in liver and muscle and the insulin resistance syndrome. Endocrinol Metab Clin N Am. (2008) 37:841–56. doi: 10.1016/j.ecl.2008.09.002
39. Ni, C, Jia, Q, Ding, G, Wu, X, and Yang, M. Low-glycemic index diets as an intervention in metabolic diseases: a systematic review and Meta-analysis. Nutrients. (2022) 14:307. doi: 10.3390/nu14020307
40. Clarke, R. Long-term weight loss and prevention of cardiovascular disease. Circulation. (2011) 124:2801–2. doi: 10.1161/CIRCULATIONAHA.111.071852
41. Gribble, FM, and Reimann, F. Function and mechanisms of enteroendocrine cells and gut hormones in metabolism. Nat Rev Endocrinol. (2019) 15:226–37. doi: 10.1038/s41574-019-0168-8
42. Shikany, JM, Phadke, RP, Redden, DT, and Gower, BA. Effects of low-and high-glycemic index/glycemic load diets on coronary heart disease risk factors in overweight/obese men. Metabolism. (2009) 58:1793–801. doi: 10.1016/j.metabol.2009.06.006
43. Gao, R, Duff, W, Chizen, D, Zello, GA, and Chilibeck, PD. The effect of a low glycemic index pulse-based diet on insulin sensitivity, insulin resistance, bone resorption and cardiovascular risk factors during bed rest. Nutrients. (2019) 11:2012. doi: 10.3390/nu11092012
44. Harris, JE, and Raynor, HA. Crossover designs in nutrition and dietetics research. J Acad Nutr Diet. (2017) 117:1023–30. doi: 10.1016/j.jand.2017.03.017
45. Knudsen, SH, Hansen, LS, Pedersen, M, Dejgaard, T, Hansen, J, Hall, GV, et al. Changes in insulin sensitivity precede changes in body composition during 14 days of step reduction combined with overfeeding in healthy young men. J Appl Physiol. (2012) 113:7–15. doi: 10.1152/japplphysiol.00189.2011
46. Silva, FM, Duarte-Mendes, P, Teixeira, AM, Soares, CM, and Ferreira, JP. The effects of combined exercise training on glucose metabolism and inflammatory markers in sedentary adults: a systematic review and meta-analysis. Sci Rep. (2024) 14:1936. doi: 10.1038/s41598-024-51832-y
47. Imayama, I, Ulrich, CM, Alfano, CM, Wang, C, Xiao, L, Wener, MH, et al. Effects of a caloric restriction weight loss diet and exercise on inflammatory biomarkers in overweight/obese postmenopausal women: a randomized controlled trial. Cancer Res. (2012) 72:2314–26. doi: 10.1158/0008-5472.CAN-11-3092
Keywords: blood glucose, glycemic index, randomized controlled trial, meta-analysis, homeostasis model assessment of insulin resistance
Citation: Yu Y-T, Fu Y-H, Chen Y-H, Fang Y-W and Tsai M-H (2025) Effect of dietary glycemic index on insulin resistance in adults without diabetes mellitus: a systematic review and meta-analysis. Front. Nutr. 12:1458353. doi: 10.3389/fnut.2025.1458353
Edited by:
Mingzhu Cai, Imperial College London, United KingdomReviewed by:
Kona Chowdhury, Enam Medical College, BangladeshCopyright © 2025 Yu, Fu, Chen, Fang and Tsai. This is an open-access article distributed under the terms of the Creative Commons Attribution License (CC BY). The use, distribution or reproduction in other forums is permitted, provided the original author(s) and the copyright owner(s) are credited and that the original publication in this journal is cited, in accordance with accepted academic practice. No use, distribution or reproduction is permitted which does not comply with these terms.
*Correspondence: Ming-Hsien Tsai, Y2hhb3NteXRoLnR3QGdtYWlsLmNvbQ==
†These authors have contributed equally to this work
Disclaimer: All claims expressed in this article are solely those of the authors and do not necessarily represent those of their affiliated organizations, or those of the publisher, the editors and the reviewers. Any product that may be evaluated in this article or claim that may be made by its manufacturer is not guaranteed or endorsed by the publisher.
Research integrity at Frontiers
Learn more about the work of our research integrity team to safeguard the quality of each article we publish.