- 1The Key Laboratory of Interventional Pulmonology of Zhejiang Province, Department of Respiratory and Critical Care Medicine, The First Affiliated Hospital of Wenzhou Medical University, Wenzhou, China
- 2Department of Respiratory and Critical Care Medicine, The Second Hospital of Yiwu, Yiwu, China
Background: Identifying nutritional risk in COVID-19 patients poses a challenge due to the unique qualities of every nutritional screening instrument. The objective was to assess the efficacy of six nutritional scores, including the Nutritional Risk Screening 2002 (NRS-2002) score, the NUTRIC (nutrition risk in the critically ill) score, the modified NUTRIC score, the prognostic nutritional index (PNI), controlling nutritional status (CONUT) score, TCB index (TCBI), predicting prognosis of COVID-19 patients.
Methods: Clinical data were collected from COVID-19 patients admitted to the First Affiliated Hospital of Wenzhou Medical University between December 2022 and February 2023. Participants in this research were divided into two groups: all patients and those specifically from the intensive care unit (ICU). Each group was further stratified into two groups: survivors and non-survivors.
Result: 506 COVID-19 patients and 190 COVID-19 patients in intensive care unit (ICU) were evaluated. In all COVID-19 patients, we found that NRS-2002 (p < 0.001) and TCBI (p = 0.002) were statistically significant independent predictors in multivariate analyses, while APACHE II score (p = 0,048) and the mNUTRIC score (p = 0.025) were statistically significant independent predictors in multivariate analyses in ICU patients. The NRS-2002 demonstrated a higher AUC value (0.687) than other nutritional scores in all patients, with an optimum cut-off value of 3, translating into a corresponding sensitivity of 66.2% and specificity of 68.7%. With an optimum cut-off value of 4, the mNUTRIC score demonstrated a higher AUC value (0.884) in ICU patients, resulting in a sensitivity of 88.4% and a specificity of 76.9%. By using the discrimination and clinical application (DCA) curve, NRS-2002 demonstrated the greatest net benefit in all patients, while NUTRIC score and mNUTRIC score offered the more significant overall advantage than other nutritional scores in ICU patients. Kaplan–Meier analyses showed lower survival rates in patients in low nutritional risk.
Conclusion: Malnutrition was common in COVID-19 patients. The mNUTRIC score and NRS-2002 were, respectively, more effctive scoring systems of prognosis in all COVID-19 patients and severe or critical COVID-19 patients of the intensive care unit (ICU).
1 Introduction
COVID-19 is a critical respiratory illness constituting a substantial threat to human life. There is a great deal of variation in the clinical manifestations of COVID-19, ranging from asymptomatic illness to severe pneumonia with potentially fatal consequences. Acute respiratory distress syndrome (ARDS), multiorgan failure, and sometimes lethal consequences are some of these problems (1–4). Individuals with severe illness had a greater frequency of comorbid diseases than individuals without it. These diseases often need treatment in an intensive care unit (ICU) and may potentially be fatal, thus placing a significant burden on healthcare facilities (5). Early identification of those who might have a serious disease is essential for effective allocation of medical resources and timely intervention to enhance their prognosis. Malnutrition is strongly linked to poor prognosis in various diseases, but is often ignored and modifiable (6–17). By identifying individuals who are at risk of malnutrition, we can offer them early nutritional support, which in turn improves their outcomes and extends their lifespan (9).
In most cases, malnutrition is studied through screening tools, which are usually applied by doctors, nutritionists or other healthcare professionals prior to conducting a comprehensive nutritional assessment. However, there is no golden standard for determining malnutrition (18, 19). There are a few screening tools for malnutrition, which associated with poor prognosis in COVID-19 (20–22). Two scoring systems are used to evaluate the nutritional risk in patients receiving intensive care unit (ICU) treatment: the NUTRIC (nutrition risk in the critically sick) score and the modified NUTRIC score. The sole distinction between the two lies in the examination of interleukin-6 (IL-6) levels (23, 24). The nutritional risk score (NRS-2002) is a commonly utilized nutritional screening tool in clinical settings (25). The prognostic nutritional index (PNI), controlling nutritional status (CONUT) score, and Triglycerides (TG) × Total Cholesterol (TC) × Body Weight (BW) Index (TCBI) are convenient, efficientive and practical nutritional scores that can be derived from readily available and cost-effective parameters (26–28). Nevertheless, determining which scoring system is better at predicting prognostic outcomes for COVID-19 patients still lacks clarity.
There is a dearth of research on how nutritional ratings compare to predict COVID-19 patient prognosis. As a result, we investigated the usefulness of nutrition scores utilizing the various above-mentioned scoring systems in determining the prognostic relevance of the nutritional status in COVID-19 patients.
2 Methods
2.1 Study population
This single-center, retrospective cohort research included information from 595 patients aged 18 years and above who were under follow-up at the First Affiliated Hospital of Wenzhou Medical University from December 2022 to February 2023.
Patients with positive results from thoracic CT scans or reverse transcriptase-polymerase chain reaction (RT-PCR), which showed features that indicated the disease, were included in the study. The cohort under observation in the ICU comprised individuals diagnosed with severe pneumonia and critically ill patients. The exclusion criteria included re-admissions, immunosuppressed state (treated with corticosteroids, immunosuppressive agents or cytotoxic agents for a duration exceeding 1 month), therapeutic limitations, individuals who are pregnant or whose data is insufficient.
The First Affiliated Hospital Ethics Committee of Wenzhou Medical University approved the research protocol.
2.2 Data collection
The baseline information, which includes immunosuppressive and glucocorticoid usage (previous use of immunosuppressive agents and corticosteroids, but for less than 1 month), anthropometric measurements, and demographic traits, history of smoking, chronic medical conditions, days in hospital preceding admission to the ICU, total length of stay in hospital, length of stay in ICU, Glasgow Coma Score (GCS), the requirement for vasopressors, the requirement for noninvasive oxygen treatments and the development of acute kidney damage, the length of invasive mechanical ventilation, the amount of urine produced, the need for renal replacement treatment, disease outcome (survival/non-survival) and laboratory parameters.
2.3 Assessment of nutritional status
The NUTRIC score and the mNUTRIC score for each patient were assessed based on six paraments: Acute Physiology and Chronic Health Evaluation II (APACHE II) score, Sequential Organ Failure Assessment (SOFA) score, age, quantity of comorbid conditions, duration of hospital stay prior to ICU admission and interleukin-6 (IL-6) levels (23, 24). NRS-2002 comprises the patient’s declining eating capacity, the recent proportion of weight loss over the last 3 months, the current Body Mass Index (BMI), age and comorbidities (25). PNI was determined using the formula: (26). CONUT was assessed using lymphocyte count, total cholesterol (TC) and levels (27). TCBI was determined using the formula: (28).
Calculate the NUTRIC score and the mNUTRIC score for patients upon their admission to the ICU, within 24 h of ICU admission, the remaining nutritional scores were calculated within 48 h after the patient is admitted. For the purpose of comparison, instead of using established scoring definitions, we purposely classified patients into low nutritional risk and high nutritional risk based on the optimal cut-off value of the ROC curve for one of any nutritional scores.
2.4 Outcome
The rate of COVID-19-related in-hospital mortality was the study’s major endpoint, while the 28-day all-cause mortality was its secondary objective.
2.5 Statistical analysis
As a retrospective analysis, there was no prior statistical analysis plan. There was no calculation of statistical power. The missing values for each variable were estimated using multiple imputation (29).
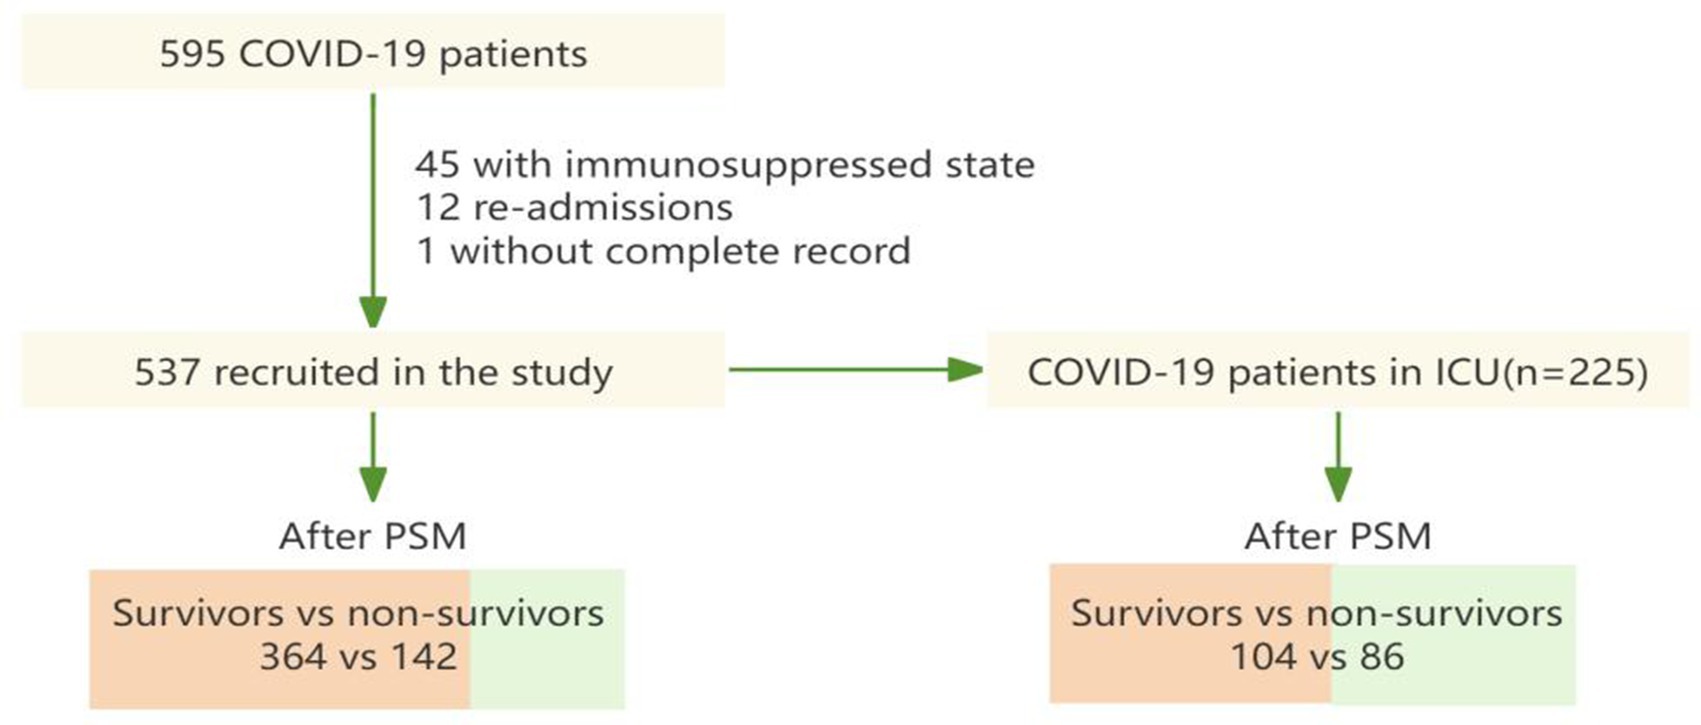
In this study, patients were segregated into two distinct groups of study subjects, all patients and ICU patients. Each group was further categorized into survivors and non-survivors (Figure 1). The propensity score-matching (PSM) model is employed to mitigate baseline characteristic disparities among study subjects. For variables that have a normal distribution, the data are shown as mean ± standard deviation; for skewed variables, they are presented as median with interquartile range; and for categorical variables, as n (%). In testing, differences were compared using the Mann–Whitney U test for skewed data, the student’s t-test for normally distributed variables, or the Chi-squared test for categorical variables. Spearman’s correlation analysis is used to test the multicollinearity of variables.
The optimum cut-off values of nutritional scores and its area under the curve (AUC) for in-hospital mortality were assessed using receiver operating characteristic (ROC) curves (37). We employed sensitivity, specificity, and accuracy to assess the optimum cut-off values’ diagnostic usefulness. The predictive model proposed here has a net therapeutic benefit that was evaluated using decision-curve analysis (DCA) (38).
Using Kaplan–Meier analyses to ascertain the influence of prognostic variables on patient survival, patients were divided into groups according to their nutritional risk: high and low, which based on the optimal cut-off value derived from the ROC curve of one of any nutritional scores. A significance threshold of p < 0.05 was used as the standard for statistical significance in all tests.
R statistical software1 was utilized for data handing, statistical analyses, and the generation of graphical representations. The particular packages used were multipleROC, rmda, MatchIt, ggplot2, ggpubr, corrplot.
3 Results
3.1 Population characteristics
Figure 1 shows that a total of 595 COVID-19 patients were found in the course of the study. Following the exclusion of episodes related to re-admissions (n = 12), patients with immunosuppressed state (n = 45) and patients without complete record (n = 1), 537 patients were included in this study. For subjects enrolled in the propensity score-matching (PSM) model, 142 deceased patients were matched with 364 patients who were discharged. Meanwhile, after PSM, 86 patients in ICU from the dead group were matched to 104 patients in ICU from the discharged group.
Tables 1, 2 respectively described the baseline characteristics of all COVID-19 patients and COVID-19 patients in ICU before and after propensity score matching (PSM). In the respective study groups, the baseline characteristics were found to be comparable between the survivors and the non-survivors after propensity score matching (PSM).
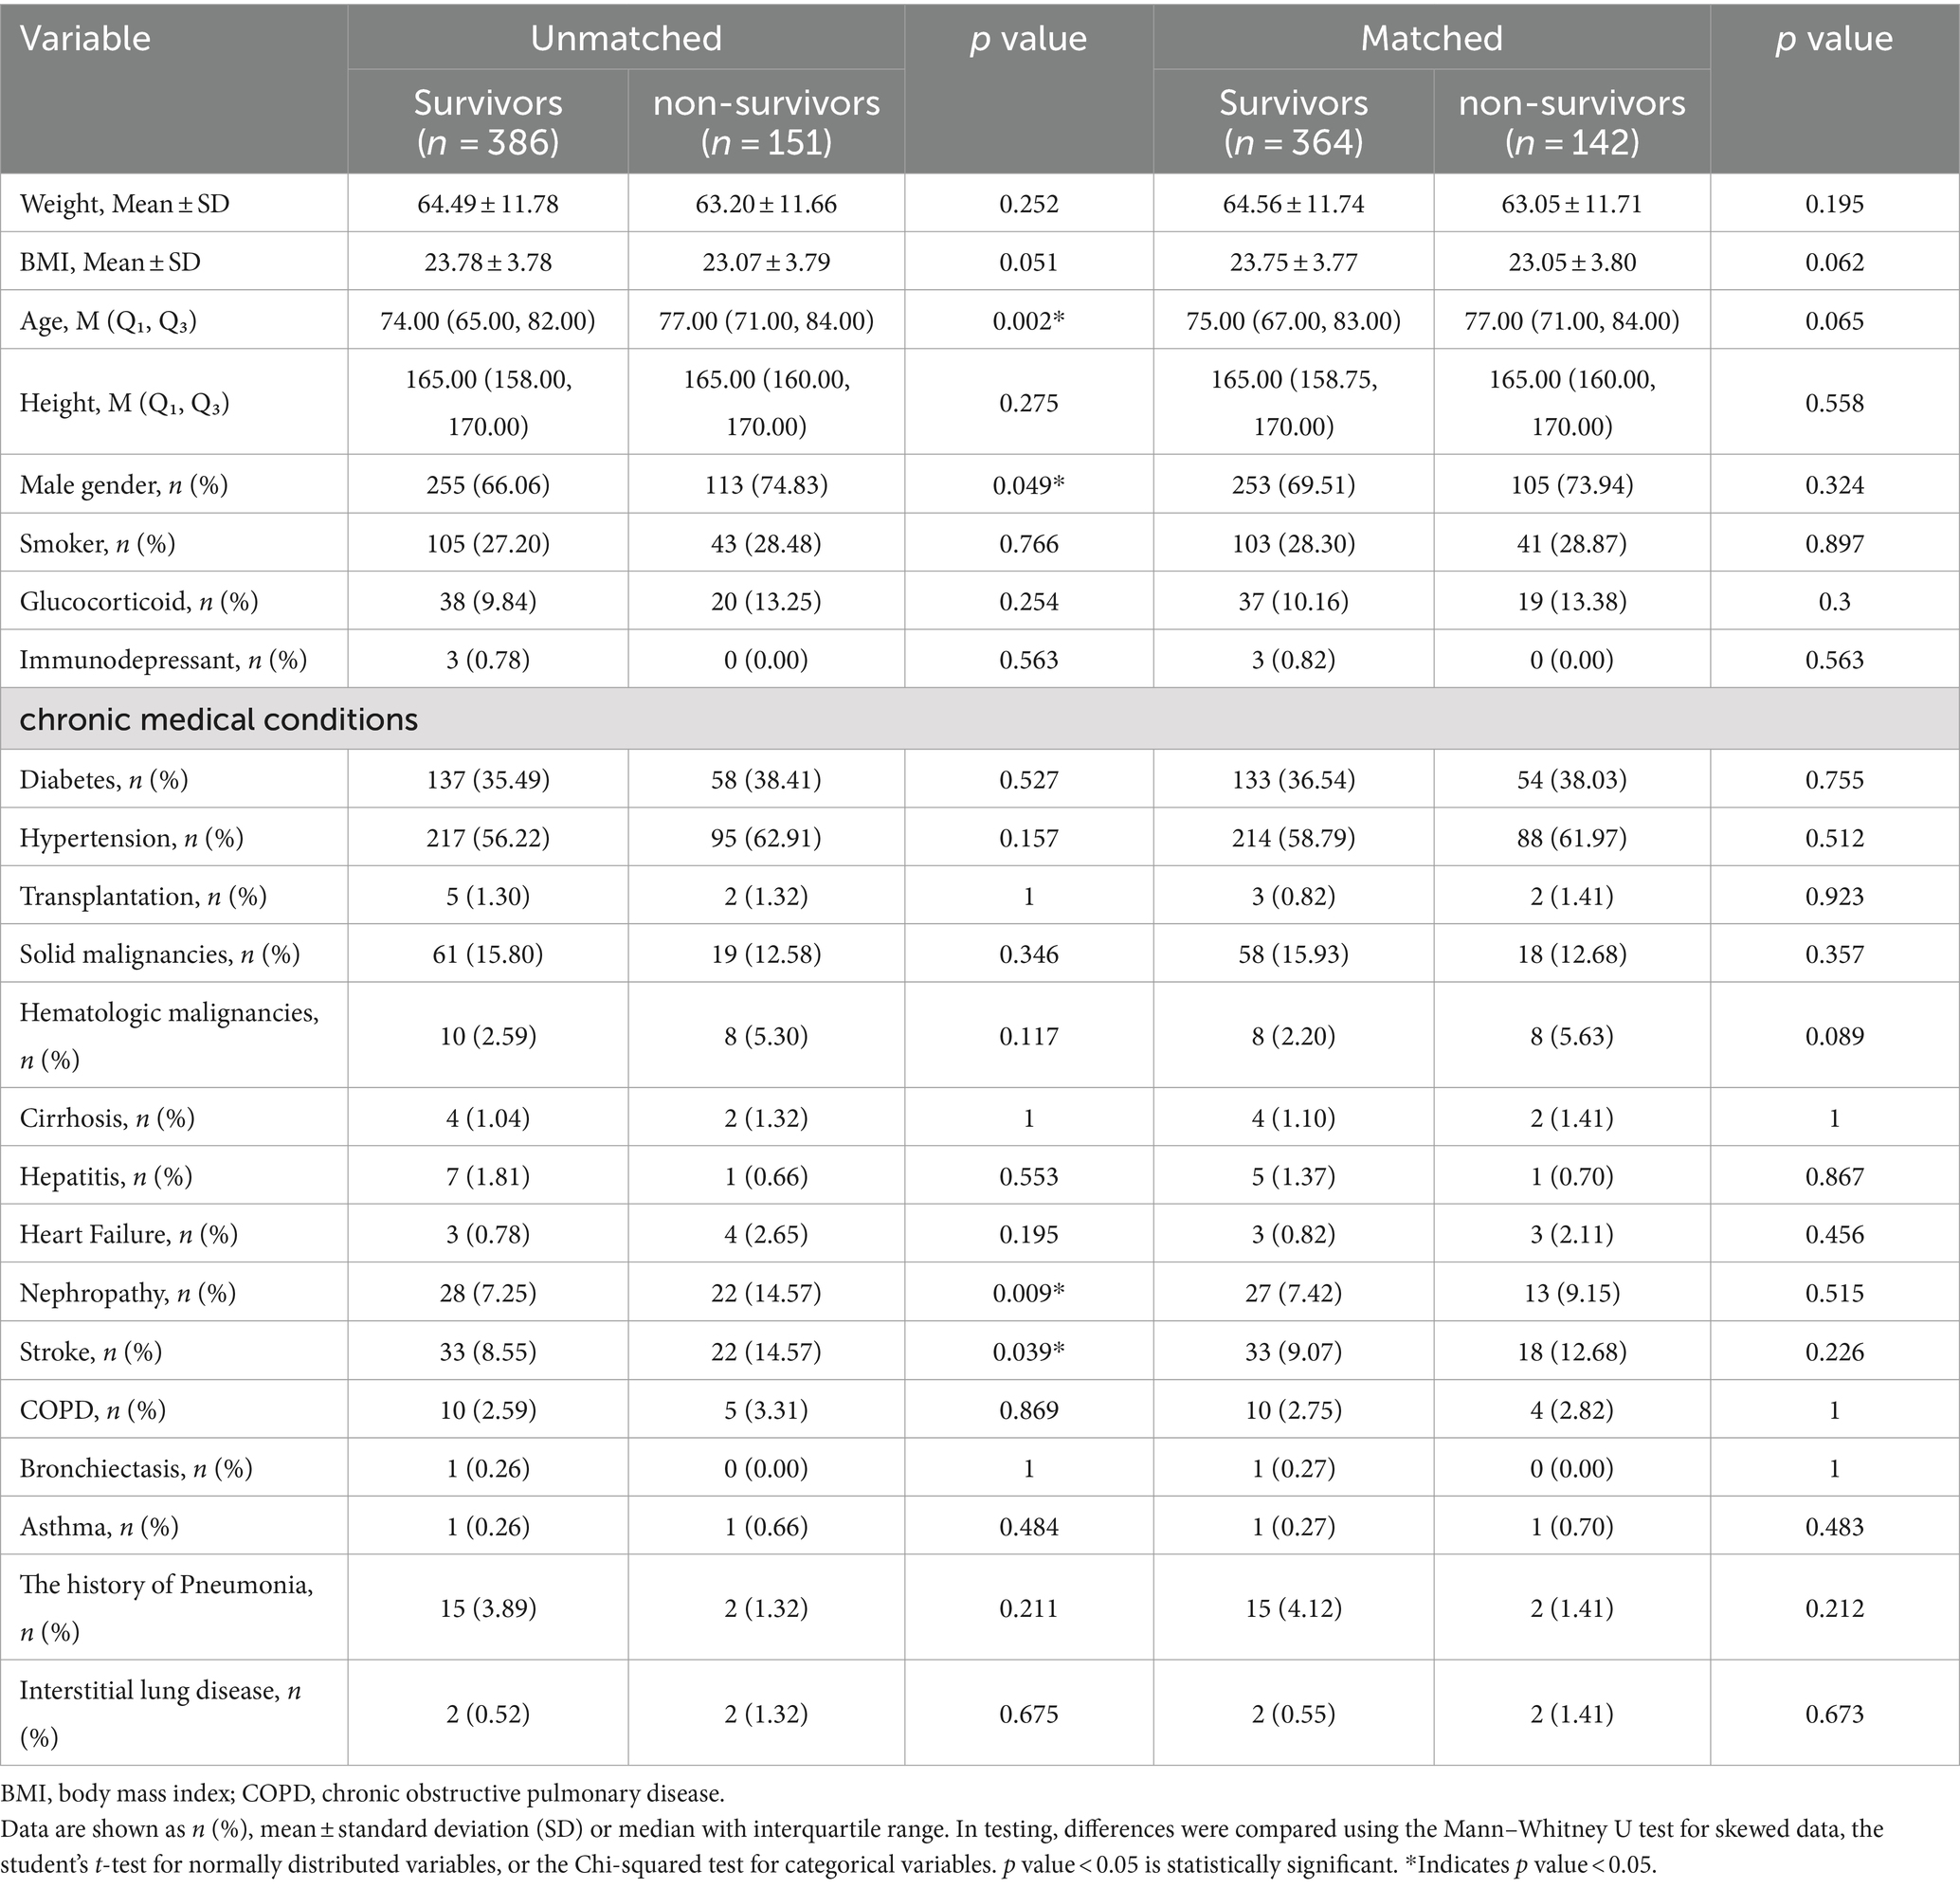
Table 1. Baseline characteristics of all COVID-19 patients before and after propensity score matching (PSM).
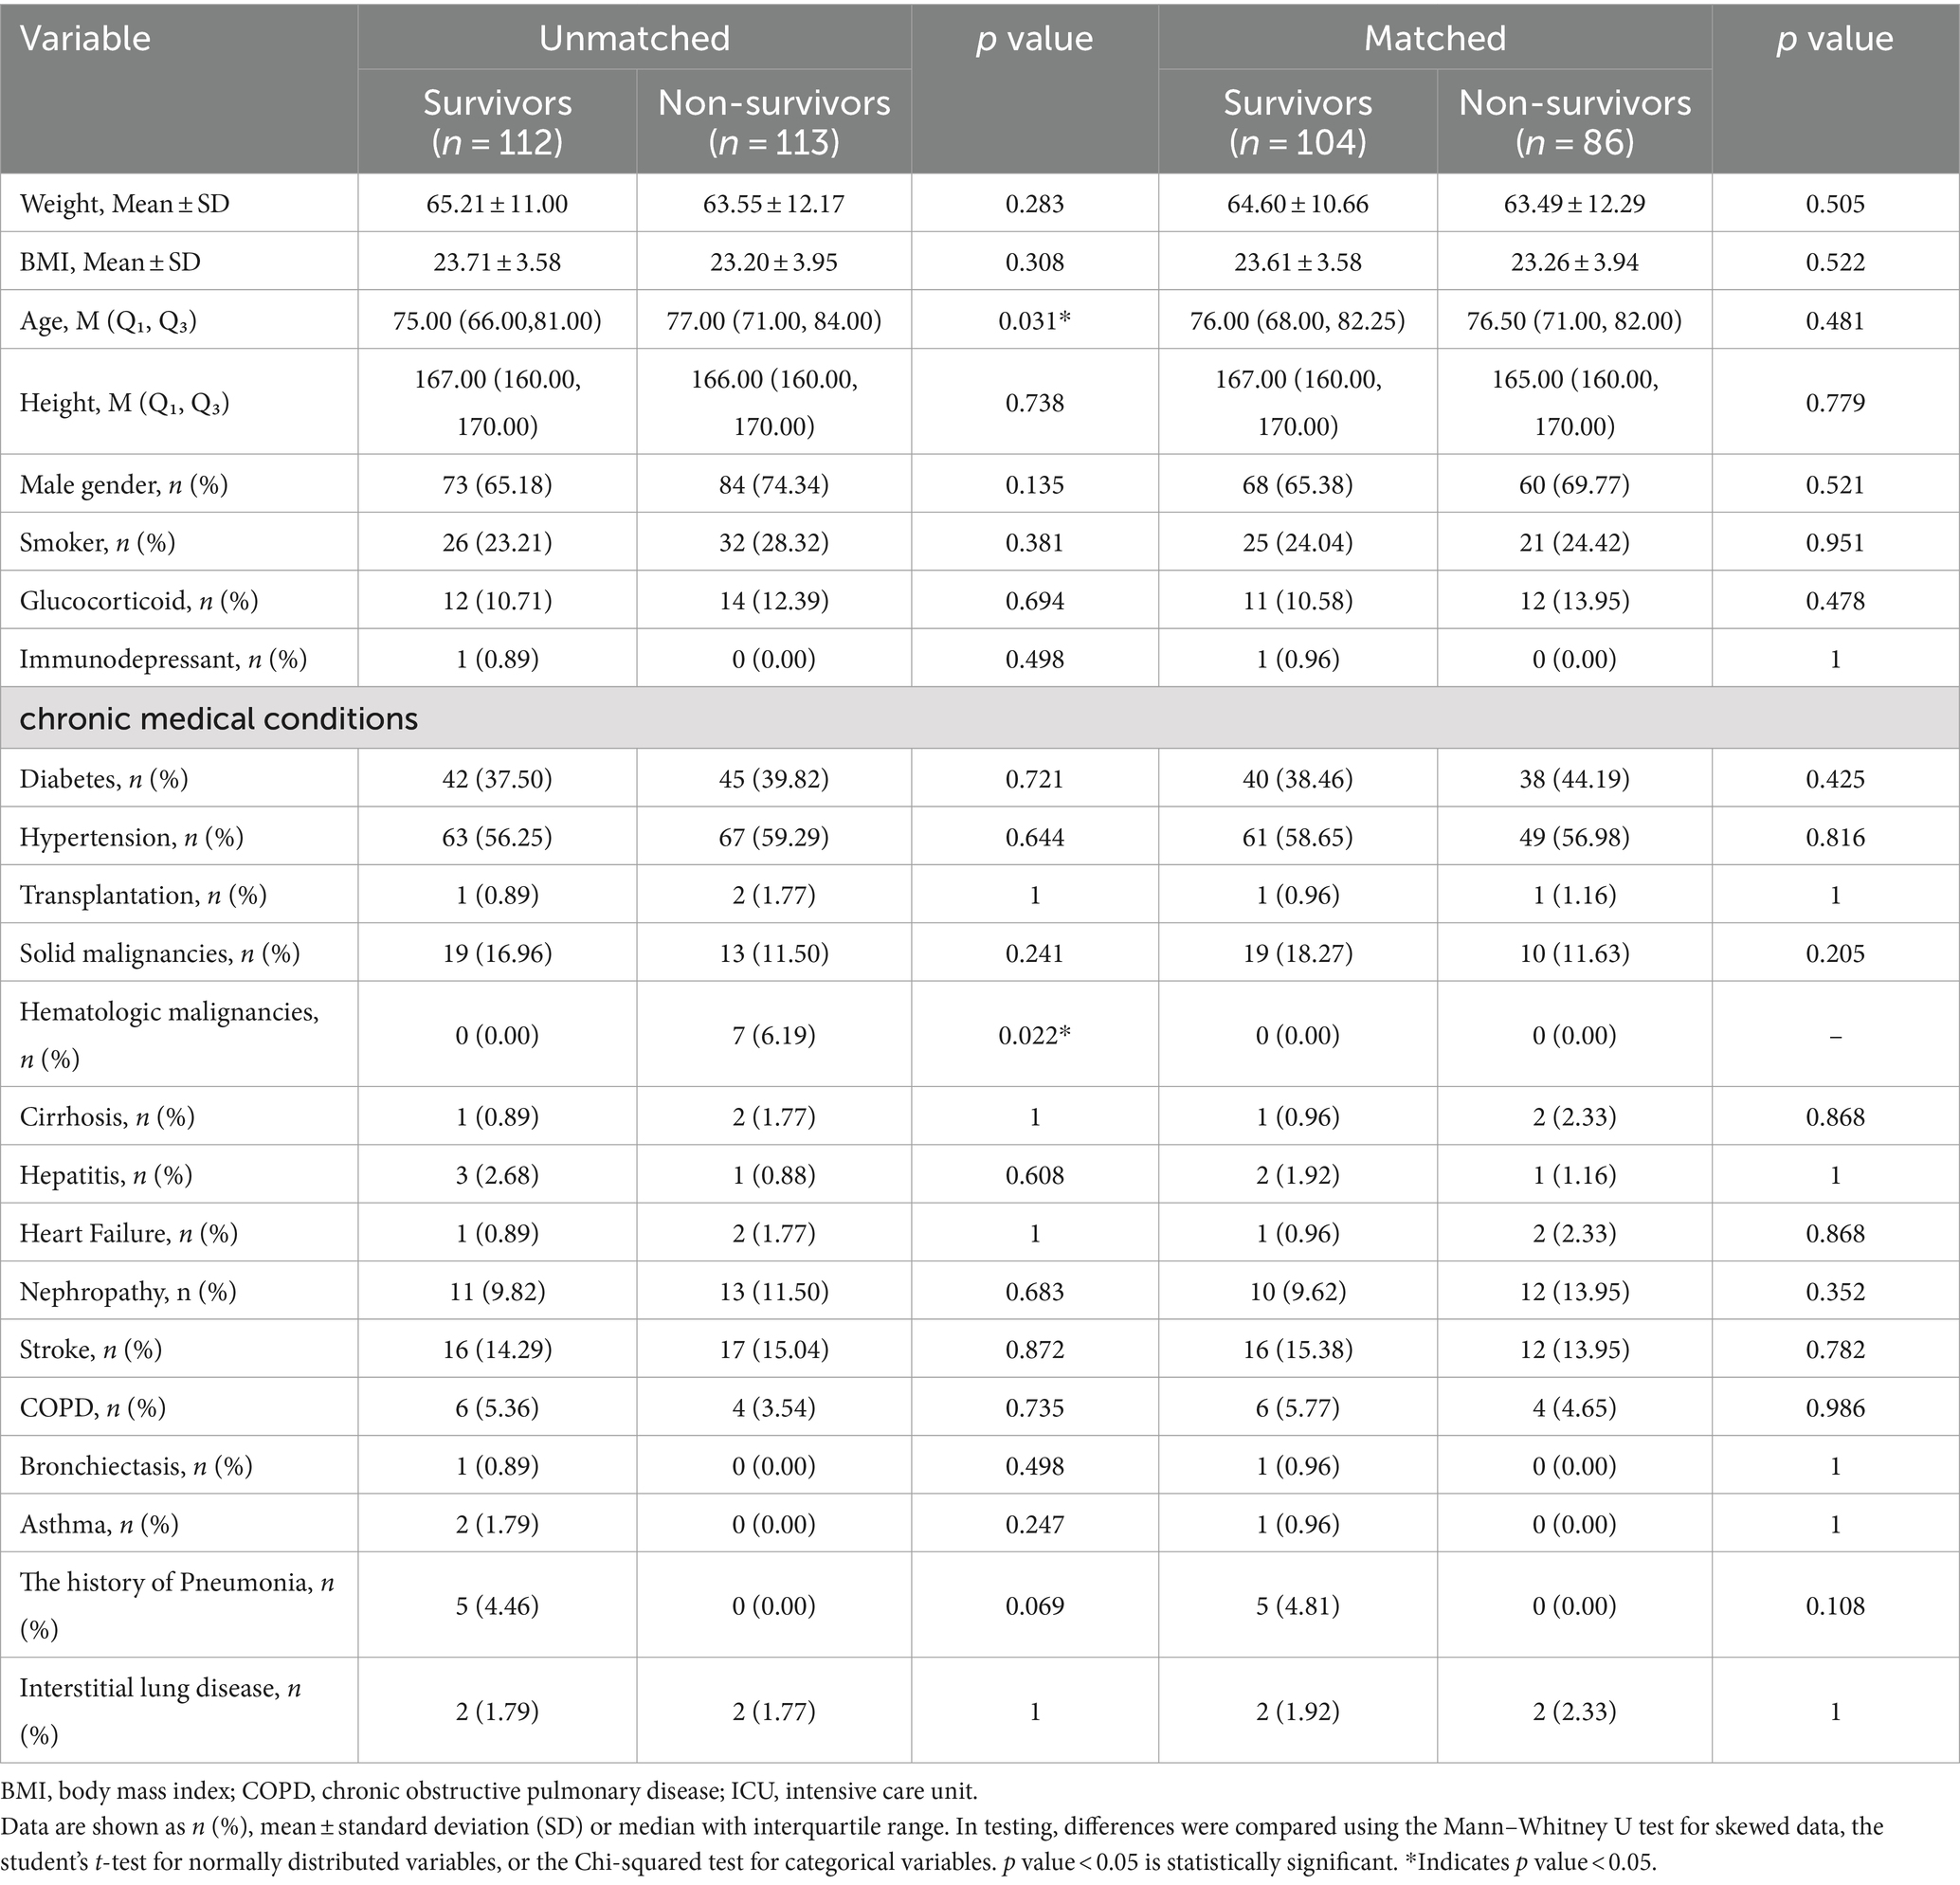
Table 2. Baseline characteristics of COVID-19 patients in ICU before and after propensity score matching (PSM).
Among the 537 selected patients, their median age ranged from 68.00 to 83.00 years, with 368 male and 169 female cases. Among them, 151 patients died, 386 patients were discharged, and 225 patients were admitted in ICU. The mortality rate inside hospitals was reported to be 28.1%, the ICU admission rate was 37.8%. The participants who died were older (77.0 versus 74.0 years of age, p = 0.002), had a greater percentage of men and had higher prevalence of chronic medical conditions, including chronic kidney diseases (14.57% versus 7.25%, p = 0.009), the history of stroke (14.57% versus 8.55%, p = 0.039) than those who were discharged.
The baseline characteristics of all COVID-19 patients and COVID-19 patients in ICU before and after propensity score matching were shown in Tables 1, 2.
3.2 Testing multicollinearity of variables
PNI and CONUT showed a strong negative association, according to Spearman’s correlation study (r = −0.88) in all COVID-19 patients. In COVID-19 patients in ICU, apart from the mNUTRIC score and the NUTRIC score exhibited a strong correlation, the mNUTRIC score and its components showed a strong positive correlation, PNI and CONUT showed a strong negative association, according to spearman’s correlation study (r = −0.83) (Figure 2).
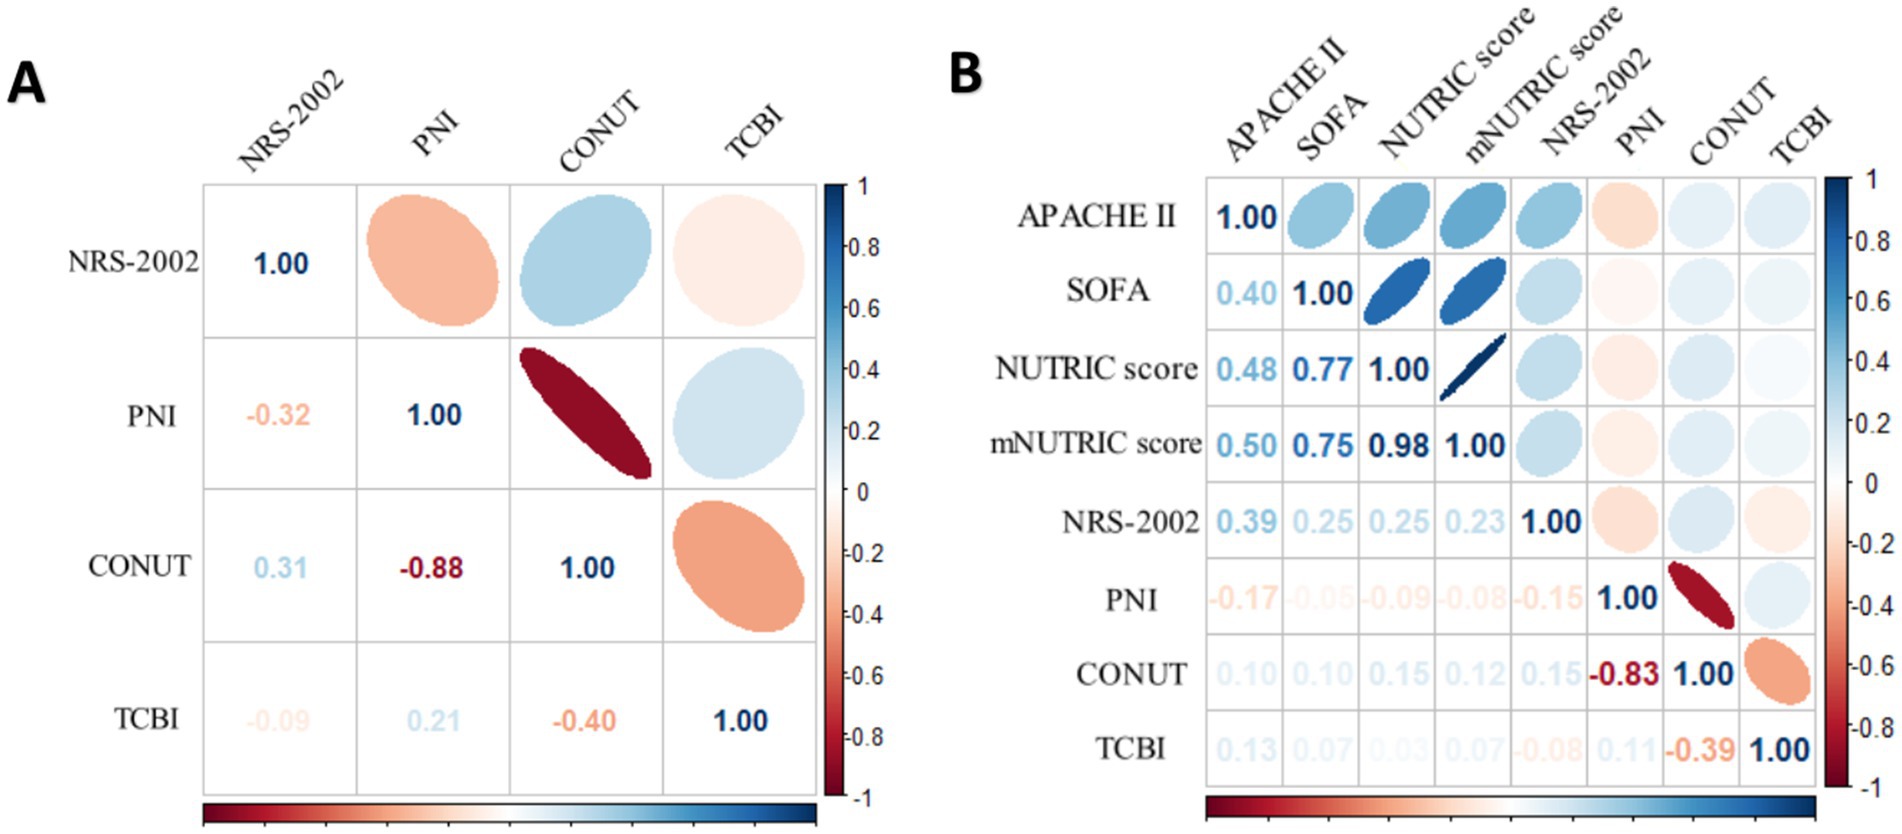
Figure 2. (A) Spearman correlation analysis of NRS-2002, PNI CONUT and TCBI for all COVID-19 patients. (B) Spearman correlation analysis of the NUTRIC score, mNUTRIC score and its components, NRS-2002, PNI, CONUT, TCBI for all COVID-19 patients.
3.3 Comparison of predictive accuracy and predictors for in-hospital mortality
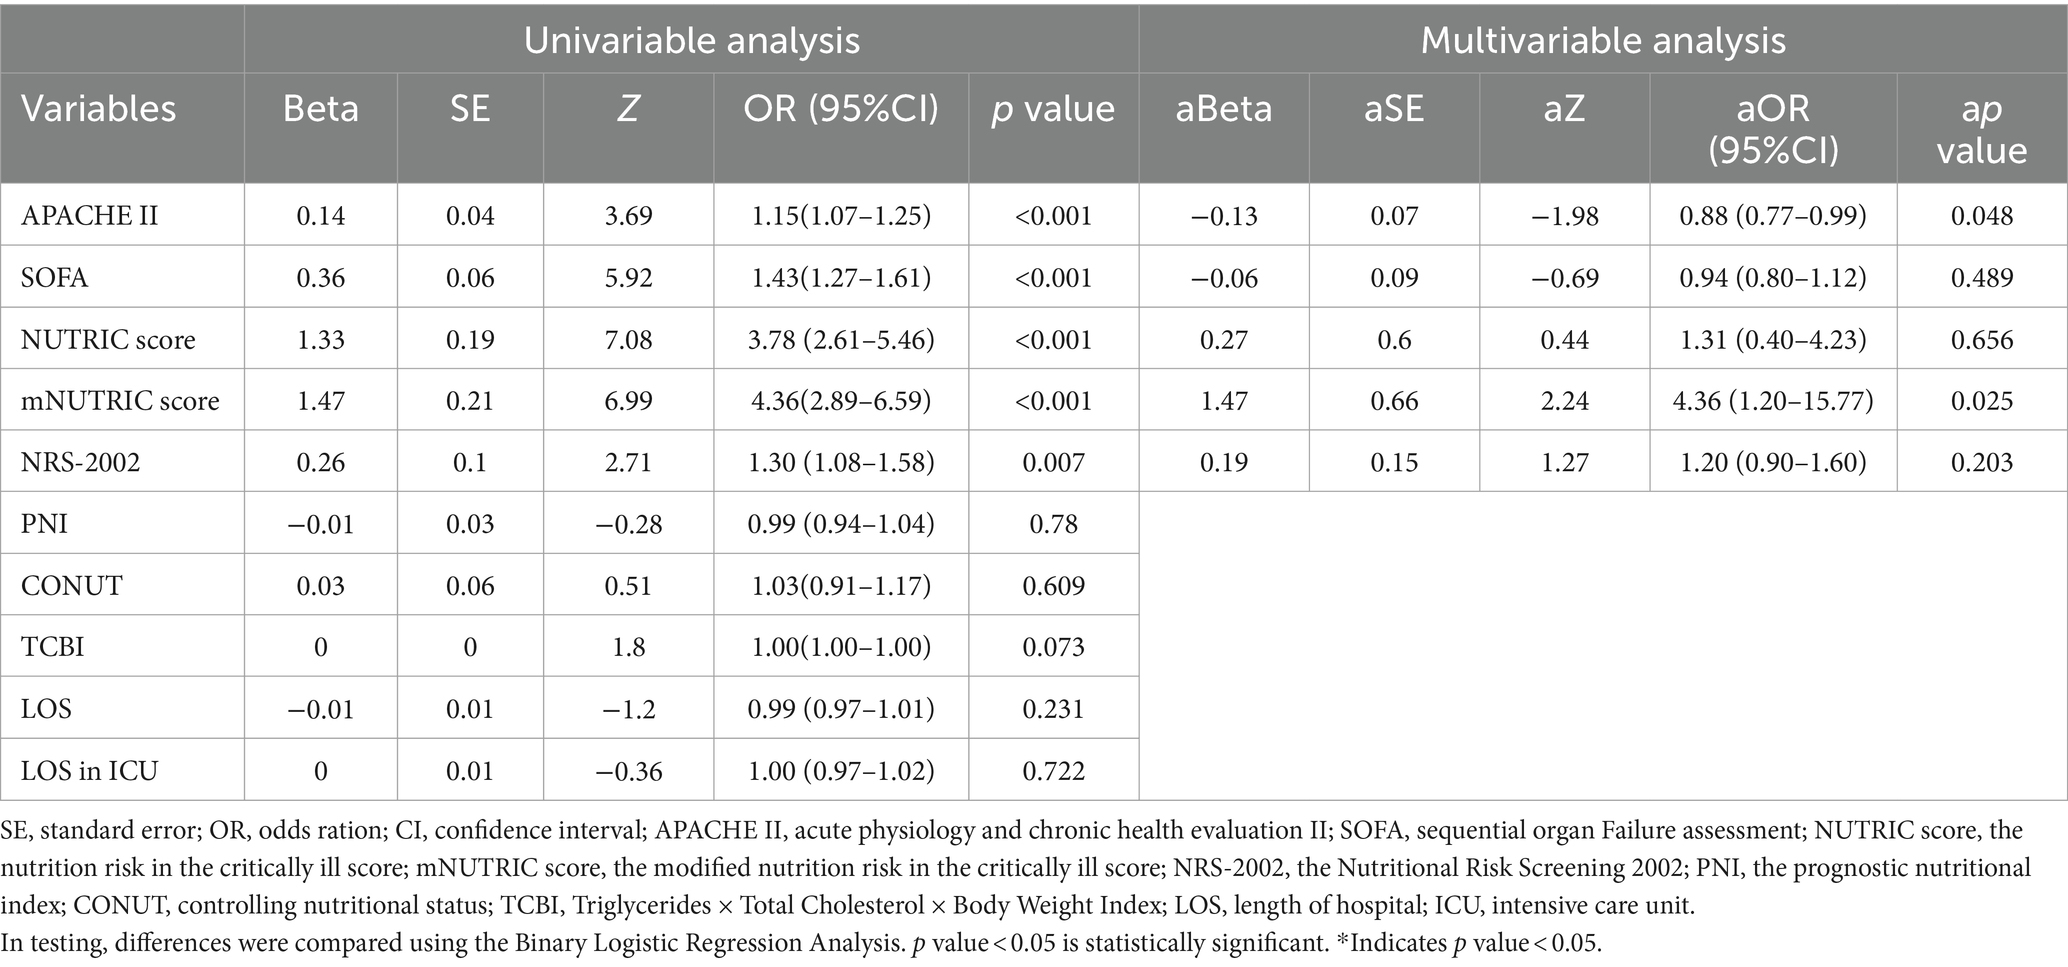
Univariable and multivariable analyses of in-hospital death in all patients and ICU patients are detailed in Tables 3, 4, respectively.
Table 3 indicated, that in all COVID-19 patients, NRS-2002(p < 0.001), CONUT (p < 0.001), PNI (p < 0.001), LOS (p = 0.047) were significantly elevated in non-survivors compared to survivors, PNI (p < 0.001) was much greater in survivors than in non-survivors. However, TCBI although was an independent predictor in multivariate analyses that was statistically significant, but its Beta was 0. We also found that NRS-2002 (p < 0.001) and TCBI (p = 0.002) were statistically significant independent predictors in multivariate analyses.
Table 4 indicated that among patients in ICU, APACHE II score (p < 0.001), SOFA score (p < 0.001), the NUTRIC score (p < 0.001), the mNUTRIC score (p < 0.001), NRS-2002 (p = 0.007) were much greater in non-survivors than in survivors. The mNUTRIC score (p = 0.025) and the APACHE II score (p = 0.048) were both shown to be statistically significant independent predictors in multivariate analyses.
Employing the ROC approach, curves were generated to ascertain the optimal cut-off points for forecasting mortality inside hospitals. The optimum cut-off value for the CONUT score was 6, which produced an AUC of 0.625, 73.9% sensitivity, and 46.2% specificity for all patients. With the optimum cut-off value set at 3, the NRS-2002 score demonstrated a higher AUC value of 0.687, surpassing the CONUT score and yielding a sensitivity and specificity of 66.2 and 68.7%, respectively. The sensitivity and specificity of the APACHE II score in ICU patients were 41.9 and 83.7%, respectively, with an optimum cut-off value of 13 and an AUC of 0.65. With an optimum cut-off value of 4, the mNUTRIC score and the NUTRIC score showed surperior AUC values of 0.884 and 0.878, respectively, outperforming the APACHE II score (Figure 3).
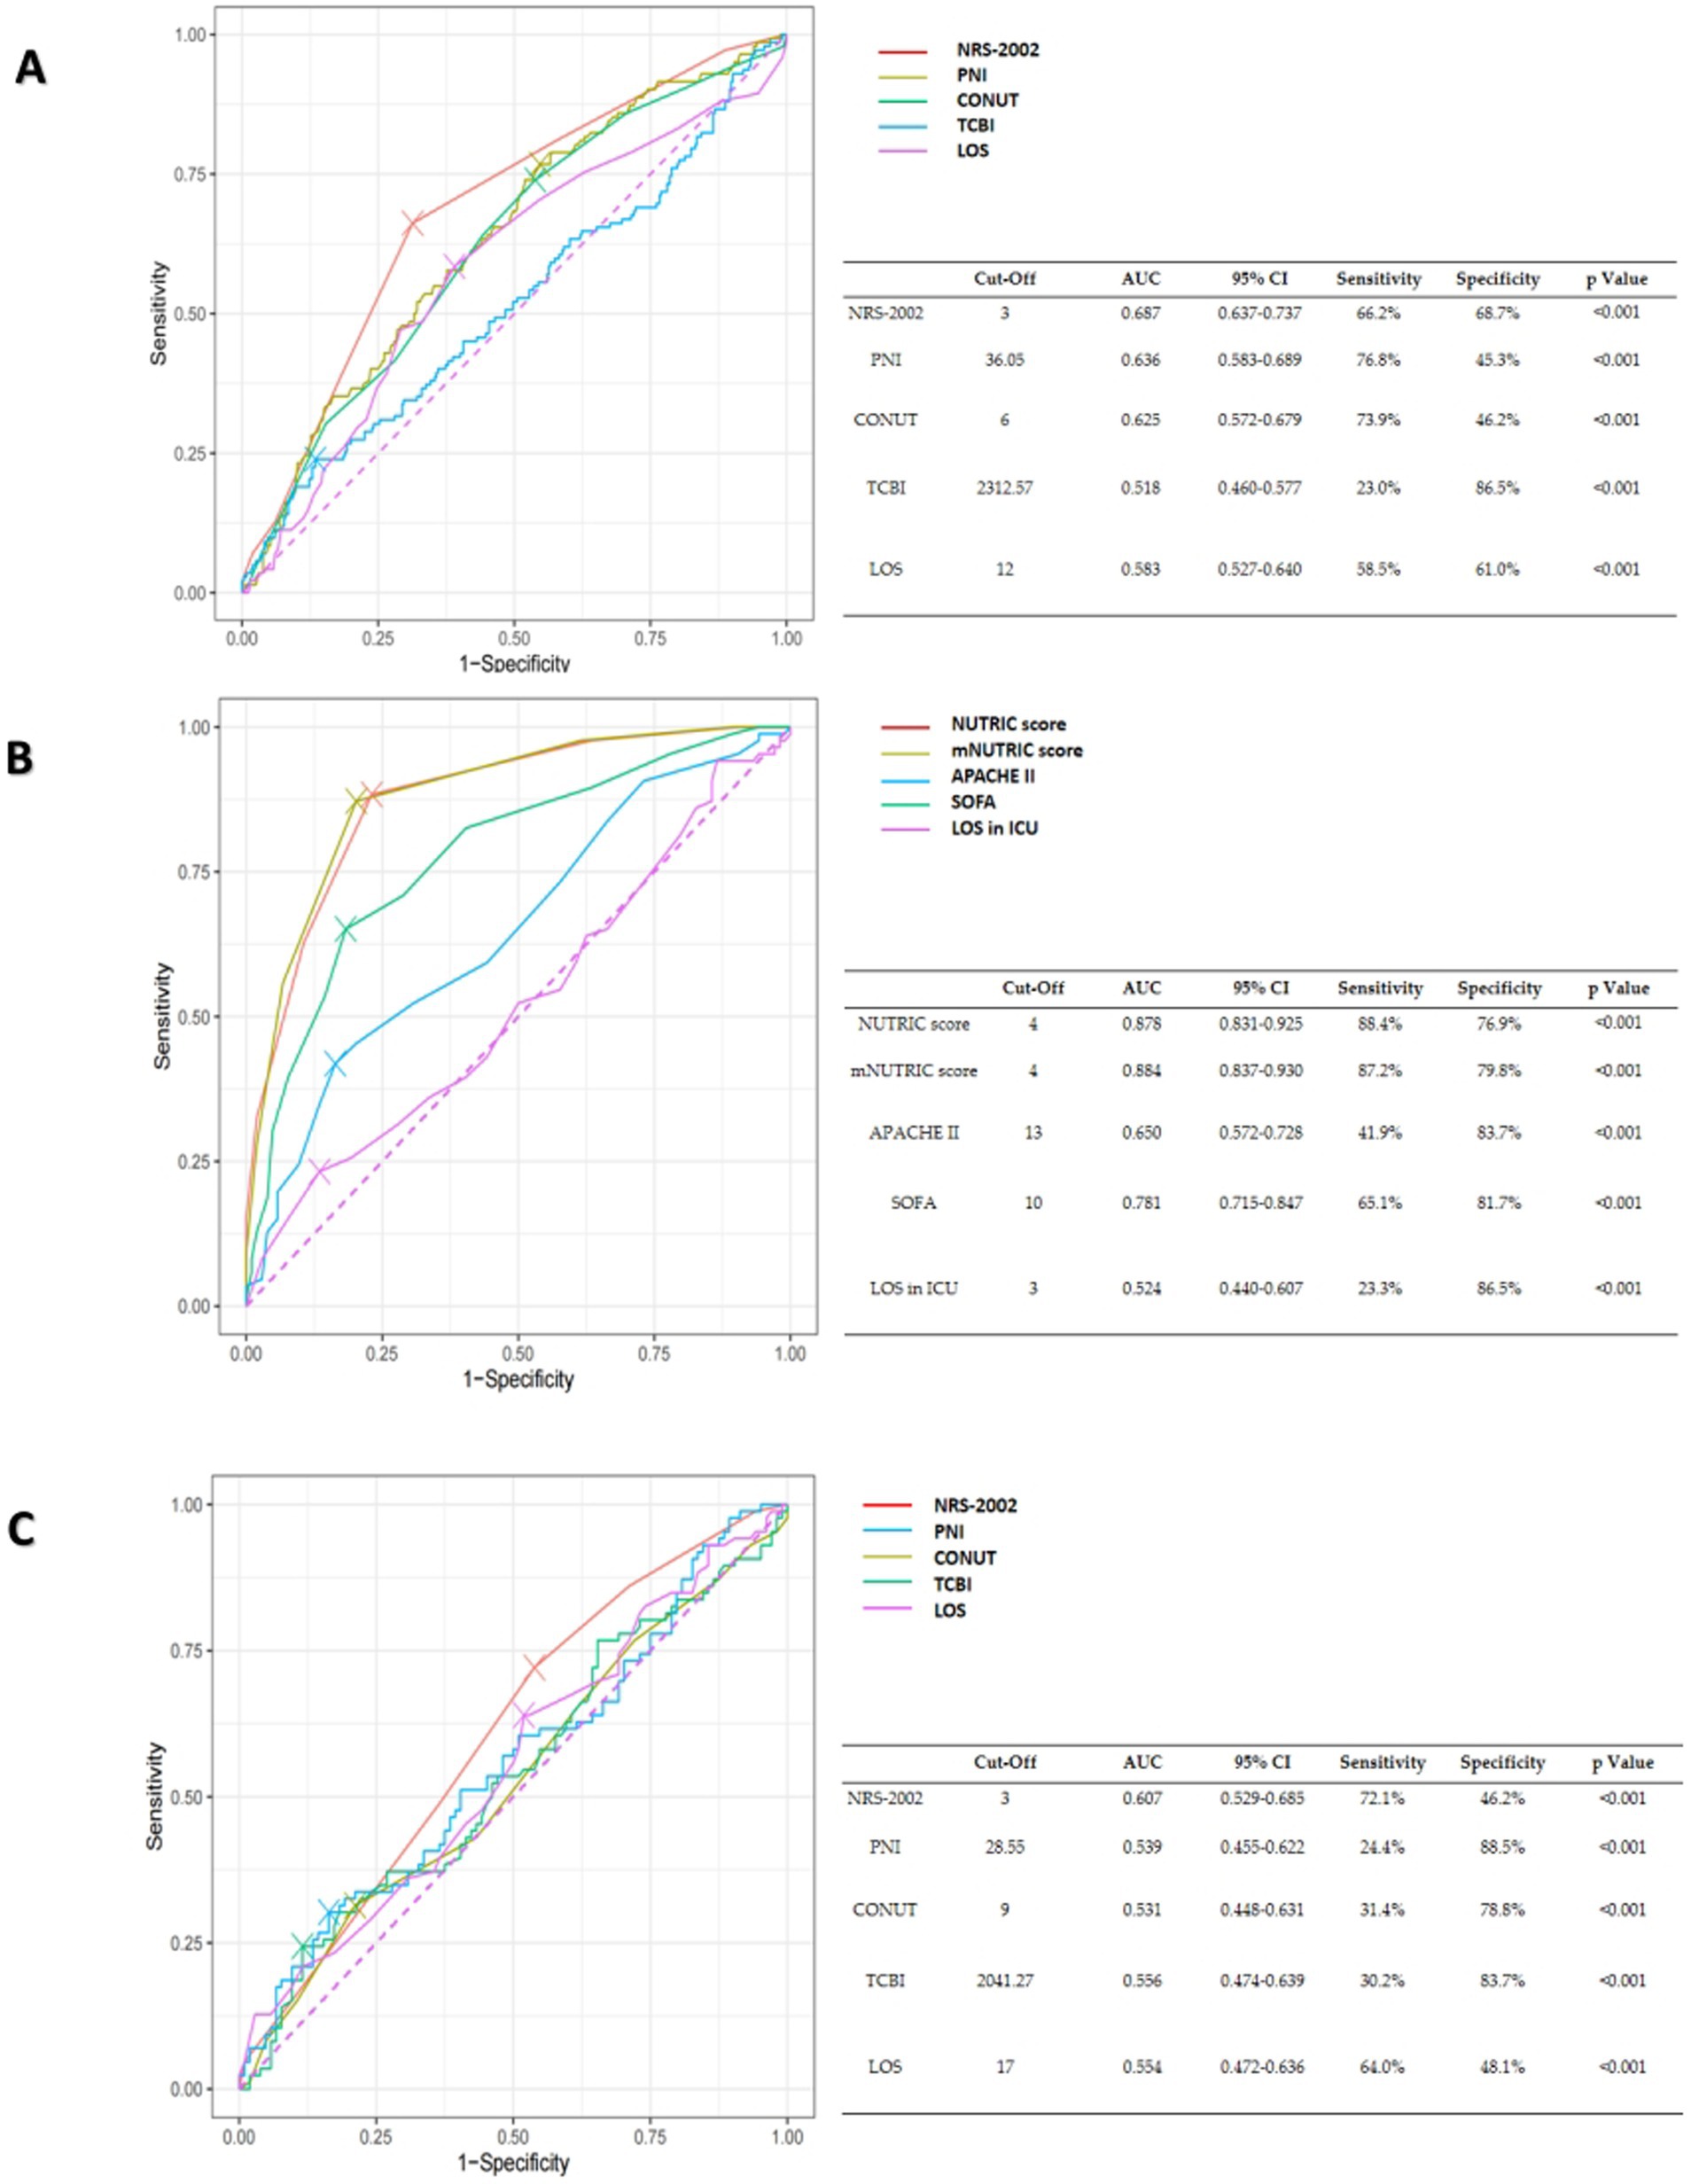
Figure 3. (A) The ROC curves of NRS-2002, PNI, CONUT, TCBI and hospital length of stay (LOS) for the prediction of in-hospital mortality of all COVID-19 patients. (B) The ROC curves of the NUTRIC score, the mNUTRIC score and its components, hospital length of stay (LOS) in ICU for the prediction of in-hospital mortality of COVID-19 patients in ICU. (C) The ROC curves of NRS-2002, PNI, CONUT, TCBI, hospital length of stay (LOS) for the prediction of in-hospital mortality of COVID-19 patients in ICU.
Statistical significance calculated by De-long’s test, the outcomes are shown in Table 5.
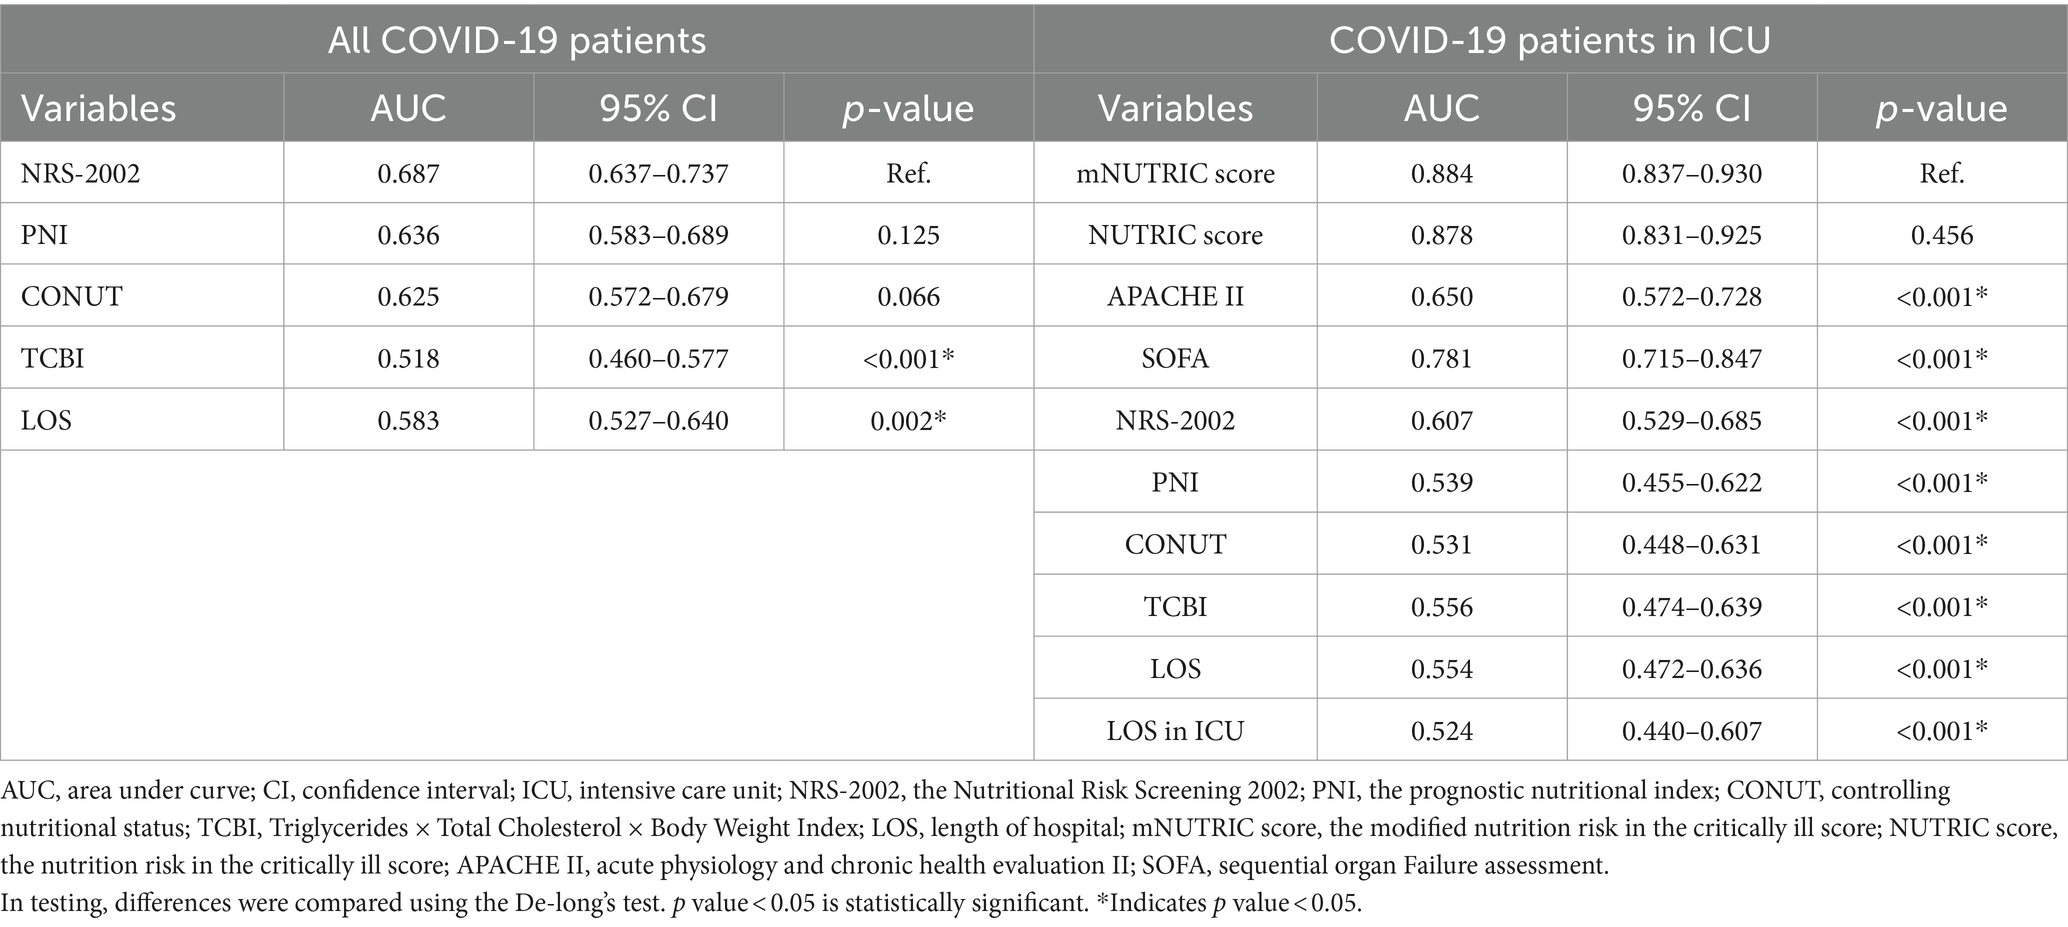
Table 5. De-long’s test of AUC of nutritional scores in all COVID-19 patients and COVID-19 patients in ICU.
3.4 Comparison of clinical application value
The Discrimination and Clinical Application (DCA) curve was shown in Figure 4. In all patients, through a comparison of NRS-2002 with PNI, CONUT score, TCBI, and length of hospital (LOS), it was evident that NRS-2002 demonstrated the greatest net benefit. In ICU patients, upon evaluating the NUTRIC score, the mNUTRIC score, APACHE 2 score, SOFA score, NRS-2002, PNI, TCBI, and CONUT scores, LOS, LOS in ICU, it becomed apparent that NUTRIC score and mNUTRIC score offered the more significant overall advantage than other nutritional scores.
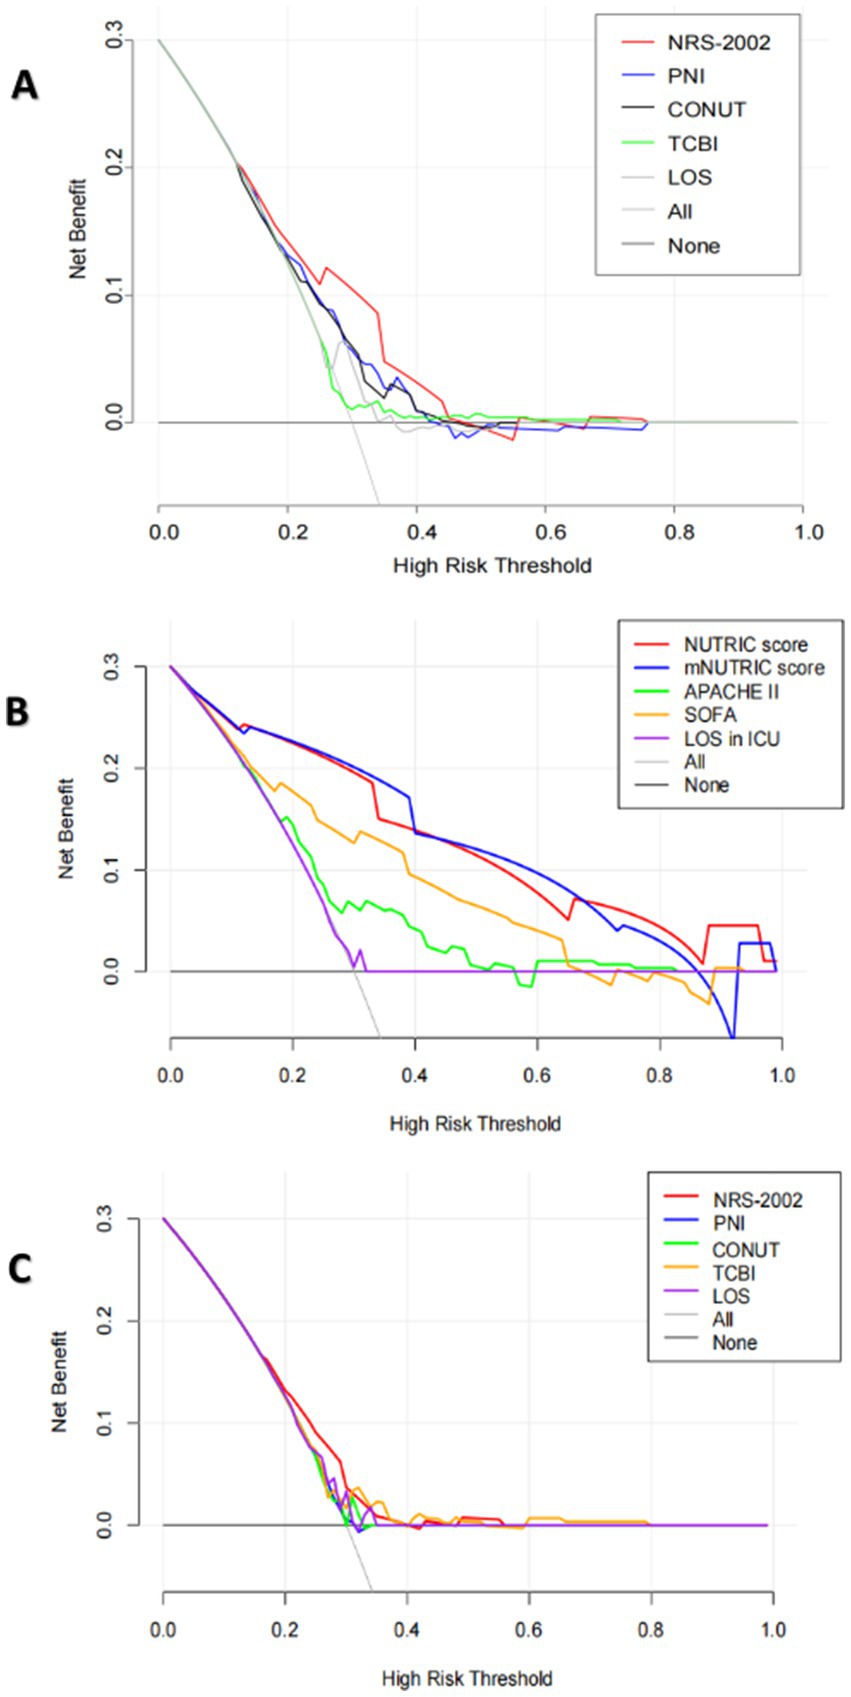
Figure 4. (A) The DCA curves of NRS-2002, PNI, CONUT, TCBI and hospital length of stay (LOS) for the prediction of in-hospital mortality of all COVID-19 patients. (B) The DCA curves of the NUTRIC score, the mNUTRIC score and its components, LOS in ICU for the prediction of in-hospital mortality of COVID-19 patients in ICU. (C) The DCA curves of NRS-2002, PNI, CONUT, TCBI, hospital length of stay (LOS), LOS in ICU for the prediction of in-hospital mortality of COVID-19 patients in ICU.
3.5 Kaplan–Meier analyses showed lower survival rates in patients in low nutritional risk
In all COVID-19 patients, 208 individuals had high nutritional risk (41.1%), which assessed by NRS-2002. In COVID-19 patients in ICU, 94 individuals had high nutritional risk (49.5%). Figure 5 shows the Kaplane Meier curve for 28-day all-cause mortality stratified by nutritional risk, as evaluated using NRS-2002 in all COVID-19 patients, as well as the NUTRIC score and the mNUTRIC score among COVID-19 patients in ICU. Patients with a high risk of malnutrition exhibit a significantly poorer prognosis than those at low nutritional risk, with the statistical significance of the observed discrepancies (p < 0.001).
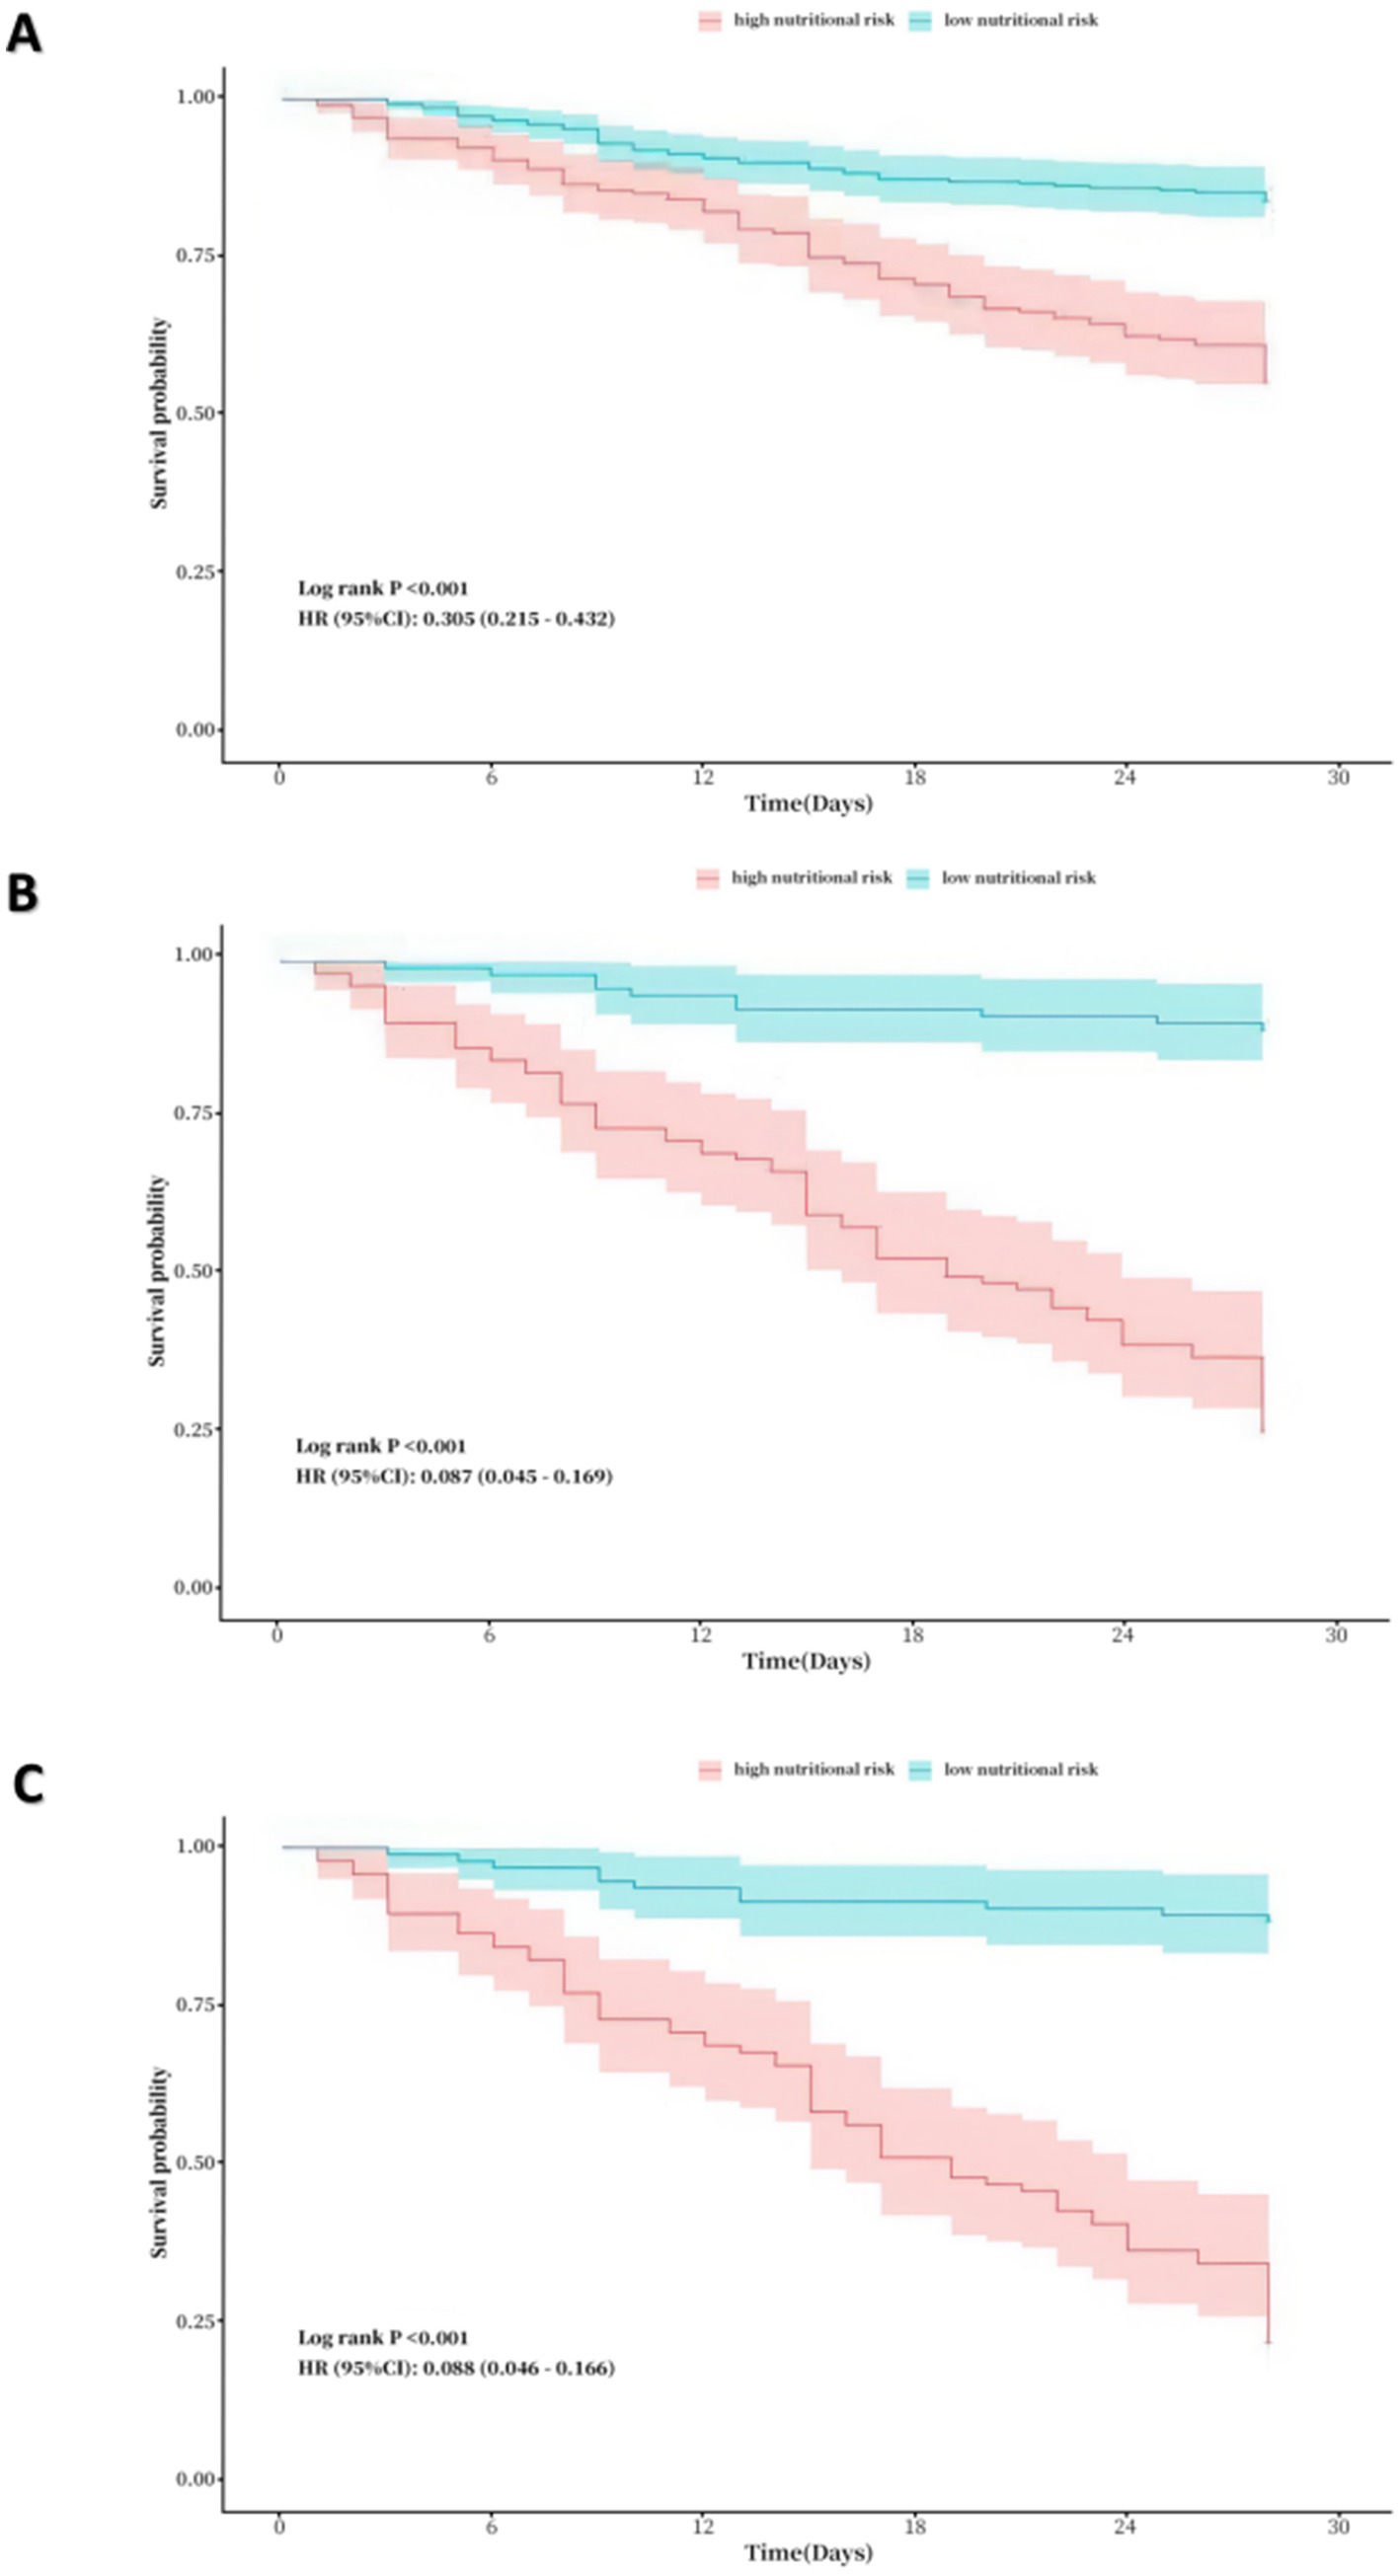
Figure 5. (A) Kaplane-Meier curve for 28-day all-cause mortality by nutritional risk in all patients. (assessed by NRS-2002, where low nutrional risk: NRS-2002 < 3 vs. high nutritional risk: NRS-200 ≥ 3). (B) Kaplane-Meier curve for 28-day all-cause mortality by nutritional risk in ICU patients (assessed by the NUTRIC score, where low nutrional risk: the NUTRIC score < 4 vs. high nutritional risk: the NUTRIC score ≥ 4). (C) Kaplane-Meier curve for 28-day all-cause mortality by nutritional risk in ICU patients (assessed by the mNUTRIC score, where low nutrional risk: the NUTRIC score < 4 vs. high nutritional risk: the NUTRIC score ≥ 4).
4 Discussion
The COVID-19 pandemic has brought about various challenges and posed threats to both healthcare and economic infrastructures (5, 30). A few studies have demonstrated the importance of nutritional scores to forecast the prognosis of COVID-19 patients, highlighting its ability to promptly detect malnutrition (20–22). Currently, the incidence of malnutrition may vary depending on the nutritional screening methods used, and there is no widely agreed set of criteria for identifying malnutrition (18, 19). To the extent of our understanding, this study represents the initial investigation into the prognostic significance of six nutritional scores among patients diagnosed with COVID-19. The current investigation suggested that patients identified as having a high nutritional risk based on any of the six objective nutritional scores (the NUTRIC score, the mNUTRIC score, NRS-2002, PNI, TCBI, and CONUT score), demonstrated lower overall survival rates. Furthermore, NRS-2002 and TCBI were connected with significant in-hospital mortality in each patient in an independent manner, APACHE 2 score and mNUTRIC score were independently correlated with high in-hospital mortality in ICU patients, even after controlling for irrelevant factors through binary logistic regression analysis, the conclusion remains valid. As an independent predictor in multivariate analyses, TCBI was statistically significant in all COVID-19 patients, but its Beta was 0. The reason maybe was the insufficient sample size.
In ICU patients, the AUC values of both the mNUTRIC score and the NUTRIC score were significantly higher than those of other nutritional scores, indicating superior predictive accuracy. In all COVID-19 patients, the NRS-2002 score exhibited a higher AUC value compared to other nutritional scores, despite not showing significant differences from them. Evaluating the clinical application value of various nutritional scores through DCA Curves, NRS-2002 showed the greatest net benefit in all patients, the NUTRIC score and the mNUTRIC score were offer significant advantage over other nutritional indices in ICU patients. The results above indicated that the mNUTRIC score and the NUTRIC score exhibited more effective prognostic assessment capabilities among all COVID-19 patients, while NRS-2002 score exhibited more effective prognostic assessment capability in COVID-19 patients of ICU. Further Kaplan–Meier analyses for these three factors reaffirmed their predictive significance for patient prognosis.
Several potential factors may contribute to the risk of malnutrition among COVID-19 patients. The development of malnutrition is mainly influenced by multiple factors, including diminished dietary intake, elevated requirements for energy and protein, augmented losses, and inflammation (31). Elsa Dent noted that aging, inadequate supply of food, socioeconomic and psychological factors, and modifiable risk factors such as low physical function, low appetite, eating dependency, poor self-perceived health, a previous hospital stay, marital status, and poor oral health. These elements collectively contribute significantly to the occurrence of malnutrition (32).
In 2016, the American Society for Parenteral and Enteral Nutrition (ASPEN) endorsed the utilization of both NRS-2002 and the NUTRIC score for evaluating the nutritional status of critically ill patients (33). The NUTRIC score considers inflammation and nutritional factors, including age, BMI, organ dysfunction, diagnosis, inflammatory markers and nutritional therapy requirements. On the other hand, NRS-2002 takes into account the patient’s nutritional status, age, BMI, nature and severity of the disease and treatment modalities. Both of them share the APACHE II score as a common variable, which can be used to forecast the severity of diseases and assist researchers in evaluating the effectiveness of new or alternative treatments (33). Neeraj Kumar observed a mortality rate of 92.8% in COVID-19 patients with elevated NUTRIC score, contrasting sharply with a 38% mortality rate in patients with low NUTRIC score, while using 3.5 as the cut-off value (34).
Berkay Kucuk reported that, in addition to the APACHE II and SOFA scores, the NUTRIC score and the mNUTRIC score were both effective in predicting death in COVID-19 patients in the intensive care unit, which is consistent with our research (22). Considering its easier accessibility, the mNUTRIC score may be preferred in comparison to the NUTRIC score. The research conducted by Matteo Luigi Giuseppe Leoni indicates that the prevalence of malnutrition is high among critically ill COVID-19 patients admitted to the ICU, and that mNUTRIC and CRP levels are independently associated with 28-day mortality in critically ill COVID-19 patients (35). In our presented study, we determined that the mNUTRIC score cut-off value of 4 for predicting in-hospital mortality in COVID-19 patients was much lower than the previously established cut-off of 5. This suggested an increased importance of nutrition in COVID-19 patients relative to those unaffected by the SARS-CoV-2, necessitating a paramount focus on this aspect.
Ghalia Shamlan observed that COVID-19 patients with an infection duration of 6 months or longer, those who had been vaccinated, obese patients, and those without cardiovascular disease were less likely to experience malnutrition when assessed using the NRS-2002 as a tool for evaluating nutritional risk (36). Ghadamieh Fatemeh et al. reported that patients exhibiting elevated NRS-2002 scores experienced increased in-hospital mortality rates, prolonged hospital stays, and higher rates of ICU admission (20). Among all COVID-19 patients, we found that the NRS-2002 demonstrated superior predictive efficacy for in-hospital mortality compared to other nutritional assessment scores, which also served as a stand-alone predictor of death inside a hospital. The NRS-2002 was not specifically intended for the assessment of critically ill patients. In COVID-19 patients of ICU, the NUTRIC and mNUTRIC scores have much more prediction power for in-hospital mortality than the NRS-2002 score. Interestingly, Audrey Machado dos Reis also demonstrated that the mNUTRIC exhibited superior discriminatory performance in calculating the critical illness patients’ chance of dying in the hospital (8).
Our investigation is constrained by specific limitations. First, all score data were gathered exclusively by a single trained investigator. Second, this research is a retrospective study, hence susceptible to inherent limitations common in such studies. Objective data like laboratory values may be underrepresented due to reliance on historical medical records predating the study. Third, this study, conducted at a single center, presents both benefits and limitations inherent to its design. Enrolling numerous consecutive patients and ensuring uniform criteria and assessments are simpler in a single center. Conversely, variations in patients and procedures, along with potential enrollment challenges, might compromise the epidemiological representativeness of multicenter studies compared to a well-executed single-center study. Our study has several innovative aspects. First, following PSM based on baseline characteristics, we reduced selection bias and enhancing the credibility of causal inference. Furthermore, we divided the study population into all patients and ICU patients, comparing more comprehensively the predictive abilities of prognosis of various nutritional scores. On the other hand, it is underscored that this study represents the inaugural evaluation of the performance of six nutritional scores to date, to predict prognosis of COVID-19 patients that could be implemented to improve prognosis in this population.
5 Conclusion
This study revealed that malnutrition is prevalent among COVID-19 patients. The mNUTRIC score and NRS-2002 were, respectively, more effctive scoring systems of prognosis in all COVID-19 patients and COVID-19 patients of ICU. Early application of the aforementioned nutritional scores in clinical practice to evaluate nutritional risk in COVID-19 patients, it may be possible to identify the risk of malnutrition earlier and implement nutritional interventions, thereby reducing mortality rates and alleviating the socioeconomic burden. It is anticipated that this study will be expanded to include a larger population.
Data availability statement
The original contributions presented in the study are included in the article/supplementary material, further inquiries can be directed to the corresponding authors.
Ethics statement
The studies involving humans were approved by Ethics Committee in Clinical Research of the First Affiliated Hospital of Wenzhou Medical University. The studies were conducted in accordance with the local legislation and institutional requirements. The human samples used in this study were acquired from a by- product of routine care or industry. Written informed consent for participation was not required from the participants or the participants’ legal guardians/next of kin in accordance with the national legislation and institutional requirements.
Author contributions
SZ: Conceptualization, Data curation, Formal analysis, Funding acquisition, Investigation, Methodology, Project administration, Resources, Software, Supervision, Validation, Visualization, Writing – original draft, Writing – review & editing. PL: Writing – original draft, Writing – review & editing. XC: Writing – original draft, Writing – review & editing. LX: Writing – original draft, Writing – review & editing. XL: Writing – original draft, Writing – review & editing. SS: Writing – original draft, Writing – review & editing. YZ: Writing – original draft, Writing – review & editing. YL: Writing – original draft, Writing – review & editing.
Funding
The author(s) declare that financial support was received for the research, authorship, and/or publication of this article. The work was supported by Wenzhou Collaborative Innovation Center for Technology Enhancement in Diagnosis and Treatment of Severe Respiratory Infections (No.84923003).
Acknowledgments
Thank all the patients who participate the study.
Conflict of interest
The authors declare that the research was conducted in the absence of any commercial or financial relationships that could be construed as a potential conflict of interest.
Publisher’s note
All claims expressed in this article are solely those of the authors and do not necessarily represent those of their affiliated organizations, or those of the publisher, the editors and the reviewers. Any product that may be evaluated in this article, or claim that may be made by its manufacturer, is not guaranteed or endorsed by the publisher.
Footnotes
References
1. Huang, C, Wang, Y, Li, X, Ren, L, Zhao, J, Hu, Y, et al. Clinical features of patients infected with 2019 novel coronavirus in Wuhan. China Lancet. (2020) 395:497–506. doi: 10.1016/s0140-6736(20)30183-5
2. Wang, D, Hu, B, Hu, C, Zhu, F, Liu, X, Zhang, J, et al. Clinical characteristics of 138 hospitalized patients with 2019 novel coronavirus-infected pneumonia in Wuhan, China. JAMA. (2020) 323:1061–9. doi: 10.1001/jama.2020.1585
3. Chen, N, Zhou, M, Dong, X, Qu, J, Gong, F, Han, Y, et al. Epidemiological and clinical characteristics of 99 cases of 2019 novel coronavirus pneumonia in Wuhan, China: a descriptive study. Lancet. (2020) 395:507–13. doi: 10.1016/s0140-6736(20)30211-7
4. Moledina, DG, Simonov, M, Yamamoto, Y, Alausa, J, Arora, T, Biswas, A, et al. The association of COVID-19 with acute kidney injury independent of severity of illness: a multicenter cohort study. Am J Kidney Dis. (2021) 77:490–499.e1. doi: 10.1053/j.ajkd.2020.12.007
5. Guan, W . Jie, Ni Z yi, Hu Y, Liang W hua, Ou C quan, he J xing, et al. clinical characteristics of coronavirus disease 2019 in China. N Engl J Med. (2020) 382:1708–20. doi: 10.1056/nejmoa2002032
6. Söderström, L, Rosenblad, A, Thors Adolfsson, E, and Bergkvist, L. Malnutrition is associated with increased mortality in older adults regardless of the cause of death. Br J Nutr. (2017) 117:532–40. doi: 10.1017/s0007114517000435
7. Isabel, TD, and Correia, M. The impact of malnutrition on morbidity, mortality, length of hospital stay and costs evaluated through a multivariate model analysis. Clin Nutr. (2003) 22:235–9. doi: 10.1016/s0261-5614(02)00215-7
8. Machado dos Reis, A, Marchetti, J, Forte dos Santos, A, Franzosi, OS, and Steemburgo, T. NUTRIC score: isolated and combined use with the NRS-2002 to predict hospital mortality in critically ill patients. JPEN J Parenter Enteral Nutr. (2020) 44:1250–6. doi: 10.1002/jpen.1804
9. Cha, JK, Kim, HS, Kim, EJ, Lee, ES, Lee, JH, and Song, IA. Effect of early nutritional support on clinical outcomes of critically ill patients with Sepsis and septic shock: a single-center retrospective study. Nutrients. (2022) 14:2318. doi: 10.3390/nu14112318
10. Kim, HR, Kang, MG, Kim, K, Koh, JS, Park, JR, Hwang, SJ, et al. Comparative analysis of three nutrition scores in predicting mortality after acute myocardial infarction. Nutrition. (2021) 90:111243. doi: 10.1016/j.nut.2021.111243
11. Roubín, SR, Abu Assi, E, Fernandez, MC, Pardal, CB, Castro, AL, Parada, JA, et al. Prevalence and prognostic significance of malnutrition in patients with acute coronary syndrome. J Am Coll Cardiol. (2020) 76:828–40. doi: 10.1016/j.jacc.2020.06.058
12. Goldfarb, M, Lauck, S, Webb, JG, Asgar, AW, Perrault, LP, Piazza, N, et al. Malnutrition and mortality in frail and non-frail older adults undergoing aortic valve replacement. Circulation. (2018) 138:2202–11. doi: 10.1161/circulationaha.118.033887
13. Sze, S, Zhang, J, Pellicori, P, Morgan, D, Hoye, A, and Clark, AL. Prognostic value of simple frailty and malnutrition screening tools in patients with acute heart failure due to left ventricular systolic dysfunction. Clin Res Cardiol. (2017) 106:533–41. doi: 10.1007/s00392-017-1082-5
14. Lei, J, Wang, L, Li, Q, Gao, L, Zhang, J, and Tan, Y. Identification of RAGE and OSM as new prognosis biomarkers of severe pneumonia. Can Respir J. (2022) 2022:1–9. doi: 10.1155/2022/3854191
15. Tseng, CC, Tu, CY, Chen, CH, Wang, YT, Chen, WC, Fu, PK, et al. Significance of the modified NUTRIC score for predicting clinical outcomes in patients with severe community-acquired pneumonia. Nutrients. (2021) 14:198. doi: 10.3390/nu14010198
16. Yenibertiz, D, and Cirik, MO. The comparison of GNRI and other nutritional indexes on short-term survival in geriatric patients treated for respiratory failure. Aging Clin Exp Res. (2022) 33:611–7. doi: 10.1007/s40520-020-01740-8
17. Hong, J, Huang, QQ, Liu, WY, Hu, X, Jiang, FF, Xu, ZR, et al. Three nutritional indices are effective predictors of mortality in patients with type 2 diabetes and foot ulcers. Front Nutr. (2022) 9:851274. doi: 10.3389/fnut.2022.851274
18. Cereda, E, Veronese, N, and Caccialanza, R. The final word on nutritional screening and assessment in older persons. Curr Opin Clin Nutr Metab Care. (2018) 21:24–9. doi: 10.1097/mco.0000000000000431
19. Dent, E, Hoogendijk, E, Visvanathan, R, and Wright, O. Malnutrition screening and assessment in hospitalised older people. J Nutr Health Aging. (2019) 23:431–41. doi: 10.25905/5d26da7e6b889
20. Fatemeh, G, Fotsing, G, Marques-Vidal, P, Kopp, P, and Barigou, M. Predictive value of multiple variable models including nutritional risk score (NRS 2002) on mortality and length of stay of patients with covid-19 infections. The INCOVO study Clin Nutr ESPEN. (2023) 55:357–63. doi: 10.1016/j.clnesp.2023.04.001
21. Bengelloun, AK, Ortega, GJ, Ancochea, J, Sanz-Garcia, A, Rodríguez-Serrano, DA, Fernández-Jiménez, G, et al. Usefulness of the CONUT index upon hospital admission as a potential prognostic indicator of COVID-19 health outcomes. Chin Med J. (2021) 135:187–93. doi: 10.1097/cm9.0000000000001798
22. Kucuk, B, Baltaci Ozen, S, Kocabeyoglu, GM, Mutlu, NM, Cakir, E, and Ozkocak, TI. NUTRIC score is not superior to mNUTRIC score in prediction of mortality of COVID-19 patients. Int J Clin Pract. (2022) 2022:1–9. doi: 10.1155/2022/1864776
23. Heyland, DK, Dhaliwal, R, Jiang, X, and Day, AG. Identifying critically ill patients who benefit the most from nutrition therapy: the development and initial validation of a novel risk assessment tool. Crit Care. (2011) 15:R268. doi: 10.1186/cc10546
24. Rahman, A, Hasan, RM, Agarwala, R, Martin, C, Day, AG, and Heyland, DK. Identifying critically-ill patients who will benefit most from nutritional therapy: further validation of the “modified NUTRIC” nutritional risk assessment tool. Clin Nutr. (2016) 35:158–62. doi: 10.1016/j.clnu.2015.01.015
25. Kondrup, J . ESPEN guidelines for nutrition screening 2002. Clin Nutr. (2003) 22:415–21. doi: 10.1016/s0261-5614(03)00098-0
26. Buzby, GP, Mullen, JL, Matthews, DC, Hobbs, CL, and Rosato, EF. Prognostic nutritional index in gastrointestinal surgery. Am J Surg. (1980) 139:160–7. doi: 10.1016/0002-9610(80)90246-9
27. Médica, GA, Ignacio, UDJ, González-Madroño, DVA, de Villar, NG, González, P, González, B, et al. CONUT: a tool for controlling nutritional status. First validation in a hospital population. Nutr Hosp. (2005) 20:38–45.
28. Doi, S, Iwata, H, Wada, H, Funamizu, T, Shitara, J, Endo, H, et al. A novel and simply calculated nutritional index serves as a useful prognostic indicator in patients with coronary artery disease. Int J Cardiol. (2018) 262:92–8. doi: 10.1016/j.ijcard.2018.02.039
29. Sterne, JAC, White, IR, Carlin, JB, Spratt, M, Royston, P, Kenward, MG, et al. Multiple imputation for missing data in epidemiological and clinical research: potential and pitfalls. BMJ. (2009) 338:b2393. doi: 10.1136/bmj.b2393
30. Sharma, A, Tiwari, S, Deb, MK, and Marty, JL. Severe acute respiratory syndrome coronavirus-2 (SARS-CoV-2): a global pandemic and treatment strategies. Int J Antimicrob Agents. (2020) 56:106054. doi: 10.1016/j.ijantimicag.2020.106054
31. Norman, K, Pichard, C, Lochs, H, and Pirlich, M. Prognostic impact of disease-related malnutrition. Clin Nutr. (2008) 27:5–15. doi: 10.1016/j.clnu.2007.10.007
32. Dent, E, Wright, ORL, Woo, J, and Hoogendijk, EO. Malnutrition in older adults. Lancet. (2023) 401:951–66. doi: 10.1016/s0140-6736(22)02612-5
33. McClave, SA, Taylor, BE, Martindale, RG, Warren, MM, Johnson, DR, Braunschweig, C, et al. Guidelines for the provision and assessment of nutrition support therapy in the adult critically ill patient. JPEN J Parenter Enteral Nutr. (2016) 40:159–211. doi: 10.1177/0148607115621863
34. Kumar, N, Kumar, A, Kumar, A, Pattanayak, A, Singh, K, and Singh, P. NUTRIC score as a predictor of outcome in COVID-19 ARDS patients: a retrospective observational study. Indian J Anaesth. (2021) 65:669–75. doi: 10.4103/ija.ija_474_21
35. Leoni, MLG, Moschini, E, Beretta, M, Zanello, M, and Nolli, M. The modified NUTRIC score (mNUTRIC) is associated with increased 28-day mortality in critically ill COVID-19 patients: internal validation of a prediction model. Clin Nutr ESPEN. (2022) 48:202–9. doi: 10.1016/j.clnesp.2022.02.014
36. Shamlan, G, Albreiki, M, Almasoudi, HO, Alshehri, LA, Ghaith, MM, Alharthi, AS, et al. Nutritional status of elderly patients previously ill with COVID-19: assessment with nutritional risk screening 2002 (NRS-2002) and mini nutritional assessment (MNA-sf). J Infect Public Health. (2023) 17:372–7. doi: 10.1016/j.jiph.2023.11.005
37. Hajian-Tilaki, K . Receiver operating characteristic (ROC) curve analysis for medical diagnostic test evaluation. Caspian J Intern Med. (2013) 4:627–35.
Keywords: nutritional scores, COVID-19, prognostic value, nutritional risk, nutritional assessment
Citation: Zou S, Lin P, Chen X, Xia L, Liu X, Su S, Zhou Y and Li Y (2024) Comparative analysis of six nutritional scores in predicting prognosis of COVID-19 patients. Front. Nutr. 11:1501132. doi: 10.3389/fnut.2024.1501132
Edited by:
Juliana Vaz, Federal University of Pelotas, BrazilReviewed by:
Virginia Maria Muniz, Secretaria de Estado da Saúde do Espírito Santo, BrazilDafeng Liu, Public Health and Clinical Center of Chengdu, China
Copyright © 2024 Zou, Lin, Chen, Xia, Liu, Su, Zhou and Li. This is an open-access article distributed under the terms of the Creative Commons Attribution License (CC BY). The use, distribution or reproduction in other forums is permitted, provided the original author(s) and the copyright owner(s) are credited and that the original publication in this journal is cited, in accordance with accepted academic practice. No use, distribution or reproduction is permitted which does not comply with these terms.
*Correspondence: Ying Zhou, ZG9jemh5ODUzMDJAMTI2LmNvbQ==; Yuping Li, d3psaXlwQDE2My5jb20=
†These authors have contributed equally to this work
 Shangpu Zou
 Pengcheng Lin
 Xiaoyu Chen
 Lijing Xia
 Xiling Liu
 Shanshan Su
 Ying Zhou
 Yuping Li