 Lin Xie
 Huali Qu
 Dandan Lai
 Juan Li1
 Xushan Chen
 Jiajia Xie
- 1The Seventh Clinical Medical College of Guangzhou University of Chinese Medicine, Shenzhen, China
- 2Shenzhen Bao’an Chinese Medicine Hospital, Guangzhou University of Chinese Medicine, Shenzhen, China
Objectives: Despite substantial evidence that visceral obesity is an epidemiological risk factor for hyperuricemia (HUA), studies on the connection between the Metabolic Score for Visceral Fat (METS-VF) and HUA remain insufficient. This research focused on METS-VF’s potential role as a risk factor for HUA.
Methods: Notably, 8,659 participants from the National Health and Nutrition Examination Survey (NHANES) from 1999 to 2018 were enrolled in this study. Propensity score matching (PSM), multivariate logistic regression analysis, subgroup analysis, interaction test, and restricted cubic spline (RCS) analysis were implemented to identify the correlation between METS-VF and HUA.
Results: In the fully adjusted model, the results of the multiple logistic regression analysis indicated that METS-VF was related to an elevated prevalence of HUA [before PSM: odds ratio (OR) = 3.51 (2.88, 4.27), p < 0.001; after PSM: OR = 2.90 (2.36, 3.58), p < 0.001]. In RCS analysis, a non-linear positive correlation was observed between METS-VF and the incidence of HUA (before PSM: p-non-linear <0.001; after PSM: p-non-linear = 0.0065). Subgroup analysis and interaction tests revealed that the impact of METS-VF on HUA was modified by sex and ethnicity.
Conclusion: There is a significant positive correlation between METS-VF and HUA in adults in the United States. METS-VF could serve as a valuable metric for assessing the development and progression of HUA.
Introduction
Hyperuricemia (HUA) is a purine metabolism disorder distinguished by abnormally elevated serum uric acid levels (1). In the United States (US), approximately 47.1 million adults have HUA (2). In China, the prevalence of HUA is on the rise, with 14% of adults affected (3). HUA has become a significant global public health issue linked to gout and various other conditions (4–7).
Obesity, a worldwide pandemic, impacts over one-third of the global population (8). By 2025, it is anticipated that obesity will reach 18% in males and 21% in females (9). Compelling evidence indicates that obesity is a distinct and influential factor in the onset of HUA (10). Body mass index (BMI) is a standard physical measure to assess adiposity (11). However, BMI could not accurately assess fat and muscle mass (12). Waist circumference (WC) and waist-to-height ratio (WHtR) are utilized as indicators of central obesity to measure the distribution of body fat (13, 14). The limitation of WC is that it is not only affected by age and sex, but it also does not consider the individual’s height (15, 16). WHtR is not a suitable indicator for the surveillance of obesity in the elderly population in the prediction of central obesity (17). In addition, there is an interaction between visceral obesity and insulin resistance (IR) (18–20). Therefore, developing a comprehensive evaluation of visceral fat metabolism is crucial than using a single index to assess visceral fat accumulation. Metabolic Score for Visceral Fat (METS-VF) is an innovative measure of abdominal fat comprised of BMI, WHtR, Metabolic Score for Insulin Resistance (METS-IR), age, and sex (21). Previous studies have indicated that METS-VF serves as a superior predictor of HUA risk compared to the triglyceride-to-low-density lipoprotein cholesterol ratio, the triglyceride-to-glucose (TyG) index, the TyG-to-body mass index ratio, the TyG-to-waist-circumference ratio, and the insulin resistance metabolic score (22). In addition, research has demonstrated that METS-VF has links with chronic renal disease (23), erectile dysfunction (24), diabetes (25), and kidney stones (26). Currently, no research has investigated the link between METS-VF and HUA in the US population. We postulated a positive correlation between METS-VF and HUA.
Methods
Study population
The National Health and Nutrition Examination Survey (NHANES) is a study to assess the health and nutritional status of a nationally representative sample of adults and children in the US. The National Ethical Review Board approved the study for Health Statistics Research, and participants provided their participation by signing an informed consent form. This study utilized a 10-cycle survey dataset from 1999 to 2018, focusing on participants with HUA. We screened participants by the following exclusion criteria: (1) individuals under the age of 20 (n = 46,235); (2) missing METS-VF data: BMI (n = 3,751), WC (n = 2,178), height (n = 0), high-density lipoprotein cholesterol (HDL-C, n = 2,452), triglyceride (n = 24,078), blood glucose (n = 46); (3) missing uric acid data (n = 70); (4) pregnancy (n = 644); (5) cancer diagnosis (n = 1,994); and (6) covariates: smoking (n = 18), physical activity (n = 9,414), dietary data (n = 407), blood pressure (n = 225), total cholesterol (n = 0), low-density lipoprotein cholesterol (LDL-C, n = 274), serology index (n = 16), data on urinary protein and urinary creatinine (n = 46), cardiovascular disease (CVD, n = 0), education level (n = 6), income-to-poverty ratio (PIR, n = 727), and marital status (n = 76). The ultimate study population consisted of 8,659 participants (Figure 1).
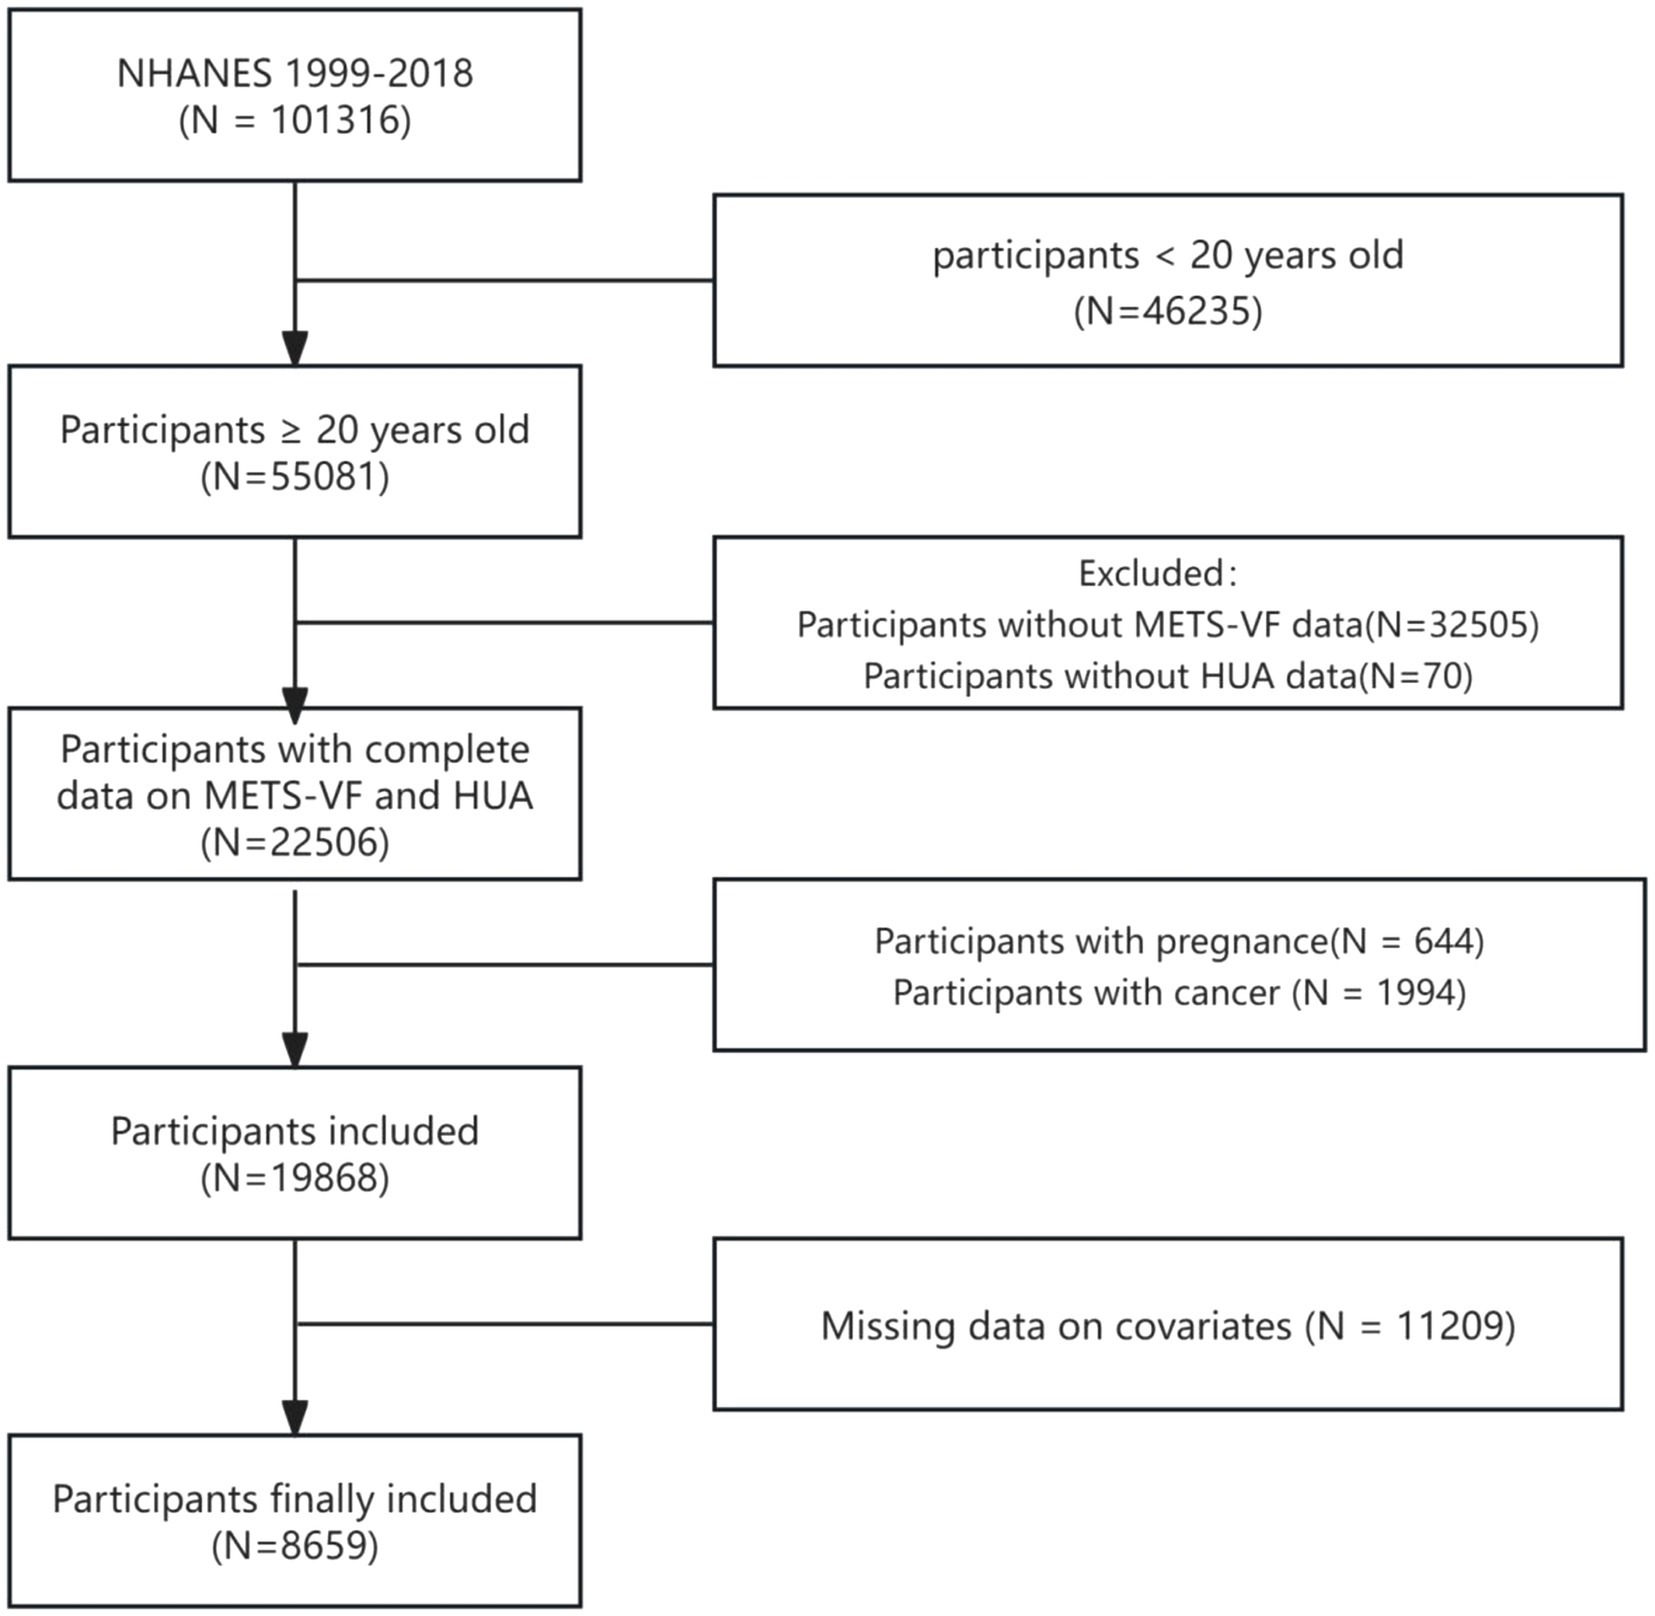
Figure 1. A flow chart of participants screening in NHANES 1999–2018. NHANES: National Health and Nutrition Examination Survey, HUA: hyperuricemia, METS-VF: Metabolic Score for Visceral Fat.
METS-VF calculation
METS-VF is a new surrogate index of fat accumulation calculated from METS-IR, WHtR, BMI, age, and sex. Specialized technicians assessed the individual’s height, BMI, and WC. The Cobas 6,000 chemistry analyzer was employed to analyze HDL-C and triglyceride, while the Roche/Hitachi Cobas C311 chemistry analyzer was used to measure fasting blood glucose. The following measurements were taken: fasting blood glucose and HDL-C in mg/dl, triglyceride in mg/dl, BMI in kg/m2, age in years, and sex as male = 1 and female = 0. The calculation formula is as follows:
Definition of HUA
HUA was defined as a serum uric acid threshold of 420 mmol/L or higher in men and 360 mmol/L or higher in women. We obtained serum uric acid data in the serum module with the variable name LBDSUASI.
Covariates
According to the previous study (27), we consider the following confounding factors as covariates: (1) demographic data: age, sex, race, education level, marital status, and PIR; (2) lifestyle: smoking, alcohol consumption, physical activity, and energy intake; (3) combined diseases: hypertension, diabetes, hyperlipidemia, chronic kidney disease (CKD), and CVD; (4) serological indexes: aspartate aminotransferase (AST) and alanine aminotransferase (ALT); (5) Drug use: diuretic use. Notably, we obtained alcohol-drinking data in the dietary module. Moderate daily alcohol drinking was measured from 0–30 mg for men and from 0–15 mg for women. Physical activity was the weekly metabolic equivalent for calculation. We categorized moderate activity as the weekly metabolic equivalents of 600 to 1,200 per week.
Statistical analysis
WTSAF4YR and WTSAF2YR were selected as the sampling weights for the weighted analysis. Continuous data were represented as weighted averages (means) and standard deviations (SDs) (i.e., mean ± SD), whereas categorical variables were expressed as weighted percentages (percentages, %). We employed chi-square and t-tests to compare categorical and continuous variables among distinct groups. We performed a 1:1 nearest-neighbor propensity matching score for HUA and non-HUA patients with a caliper score of 0.05. The adjusted variables were selected for age, sex, education level, marital status, smoking, alcohol consumption, diabetes, hypertension, hyperlipidemia, CKD, CVD, diuretic use, energy intake, AST, and ALT. The correlation between METS-VF and HUA before and after PMS was analyzed using three weighted logistic regression models. Model 1 does not account for any variables. Model 2 was modified to account for age, sex, and race. The Model 3 was controlled for all potential confounding variables. Sensitivity analysis included subgroup analysis, interaction test, and restricted cubic spline (RCS) analysis. The study was carried out using R Statistical Software (v4.3.1; (56)), which included the survey, rms, and MatchIt packages; p < 0.05 indicated statistical significance.
Results
Population characteristics described by the quartiles of METS-VF
The study comprised 8,659 individuals aged 20 years and older, of whom 1,465 (16.52%) were diagnosed with HUA. Among these participants, 51.21% were males. METS-VF was divided into quartiles ≤5.75, 5.75–6.26, 6.26–6.62, and > 6.62. Compared with the lowest quartile (Q1) group, individuals in the highest METS-VF group (Q4) were more inclined to be aged 40–65 years, males, Non-Hispanic White, above high school level, married, PIR ≥3.5, former smokers, those who never consumed alcohol, hypertension, diabetes, hyperlipidemia, CKD, CVD, low physical activity, more individuals using diuretics, and higher AST and ALT. There was a corresponding rise in METS-VF and HUA prevalence (Table 1).
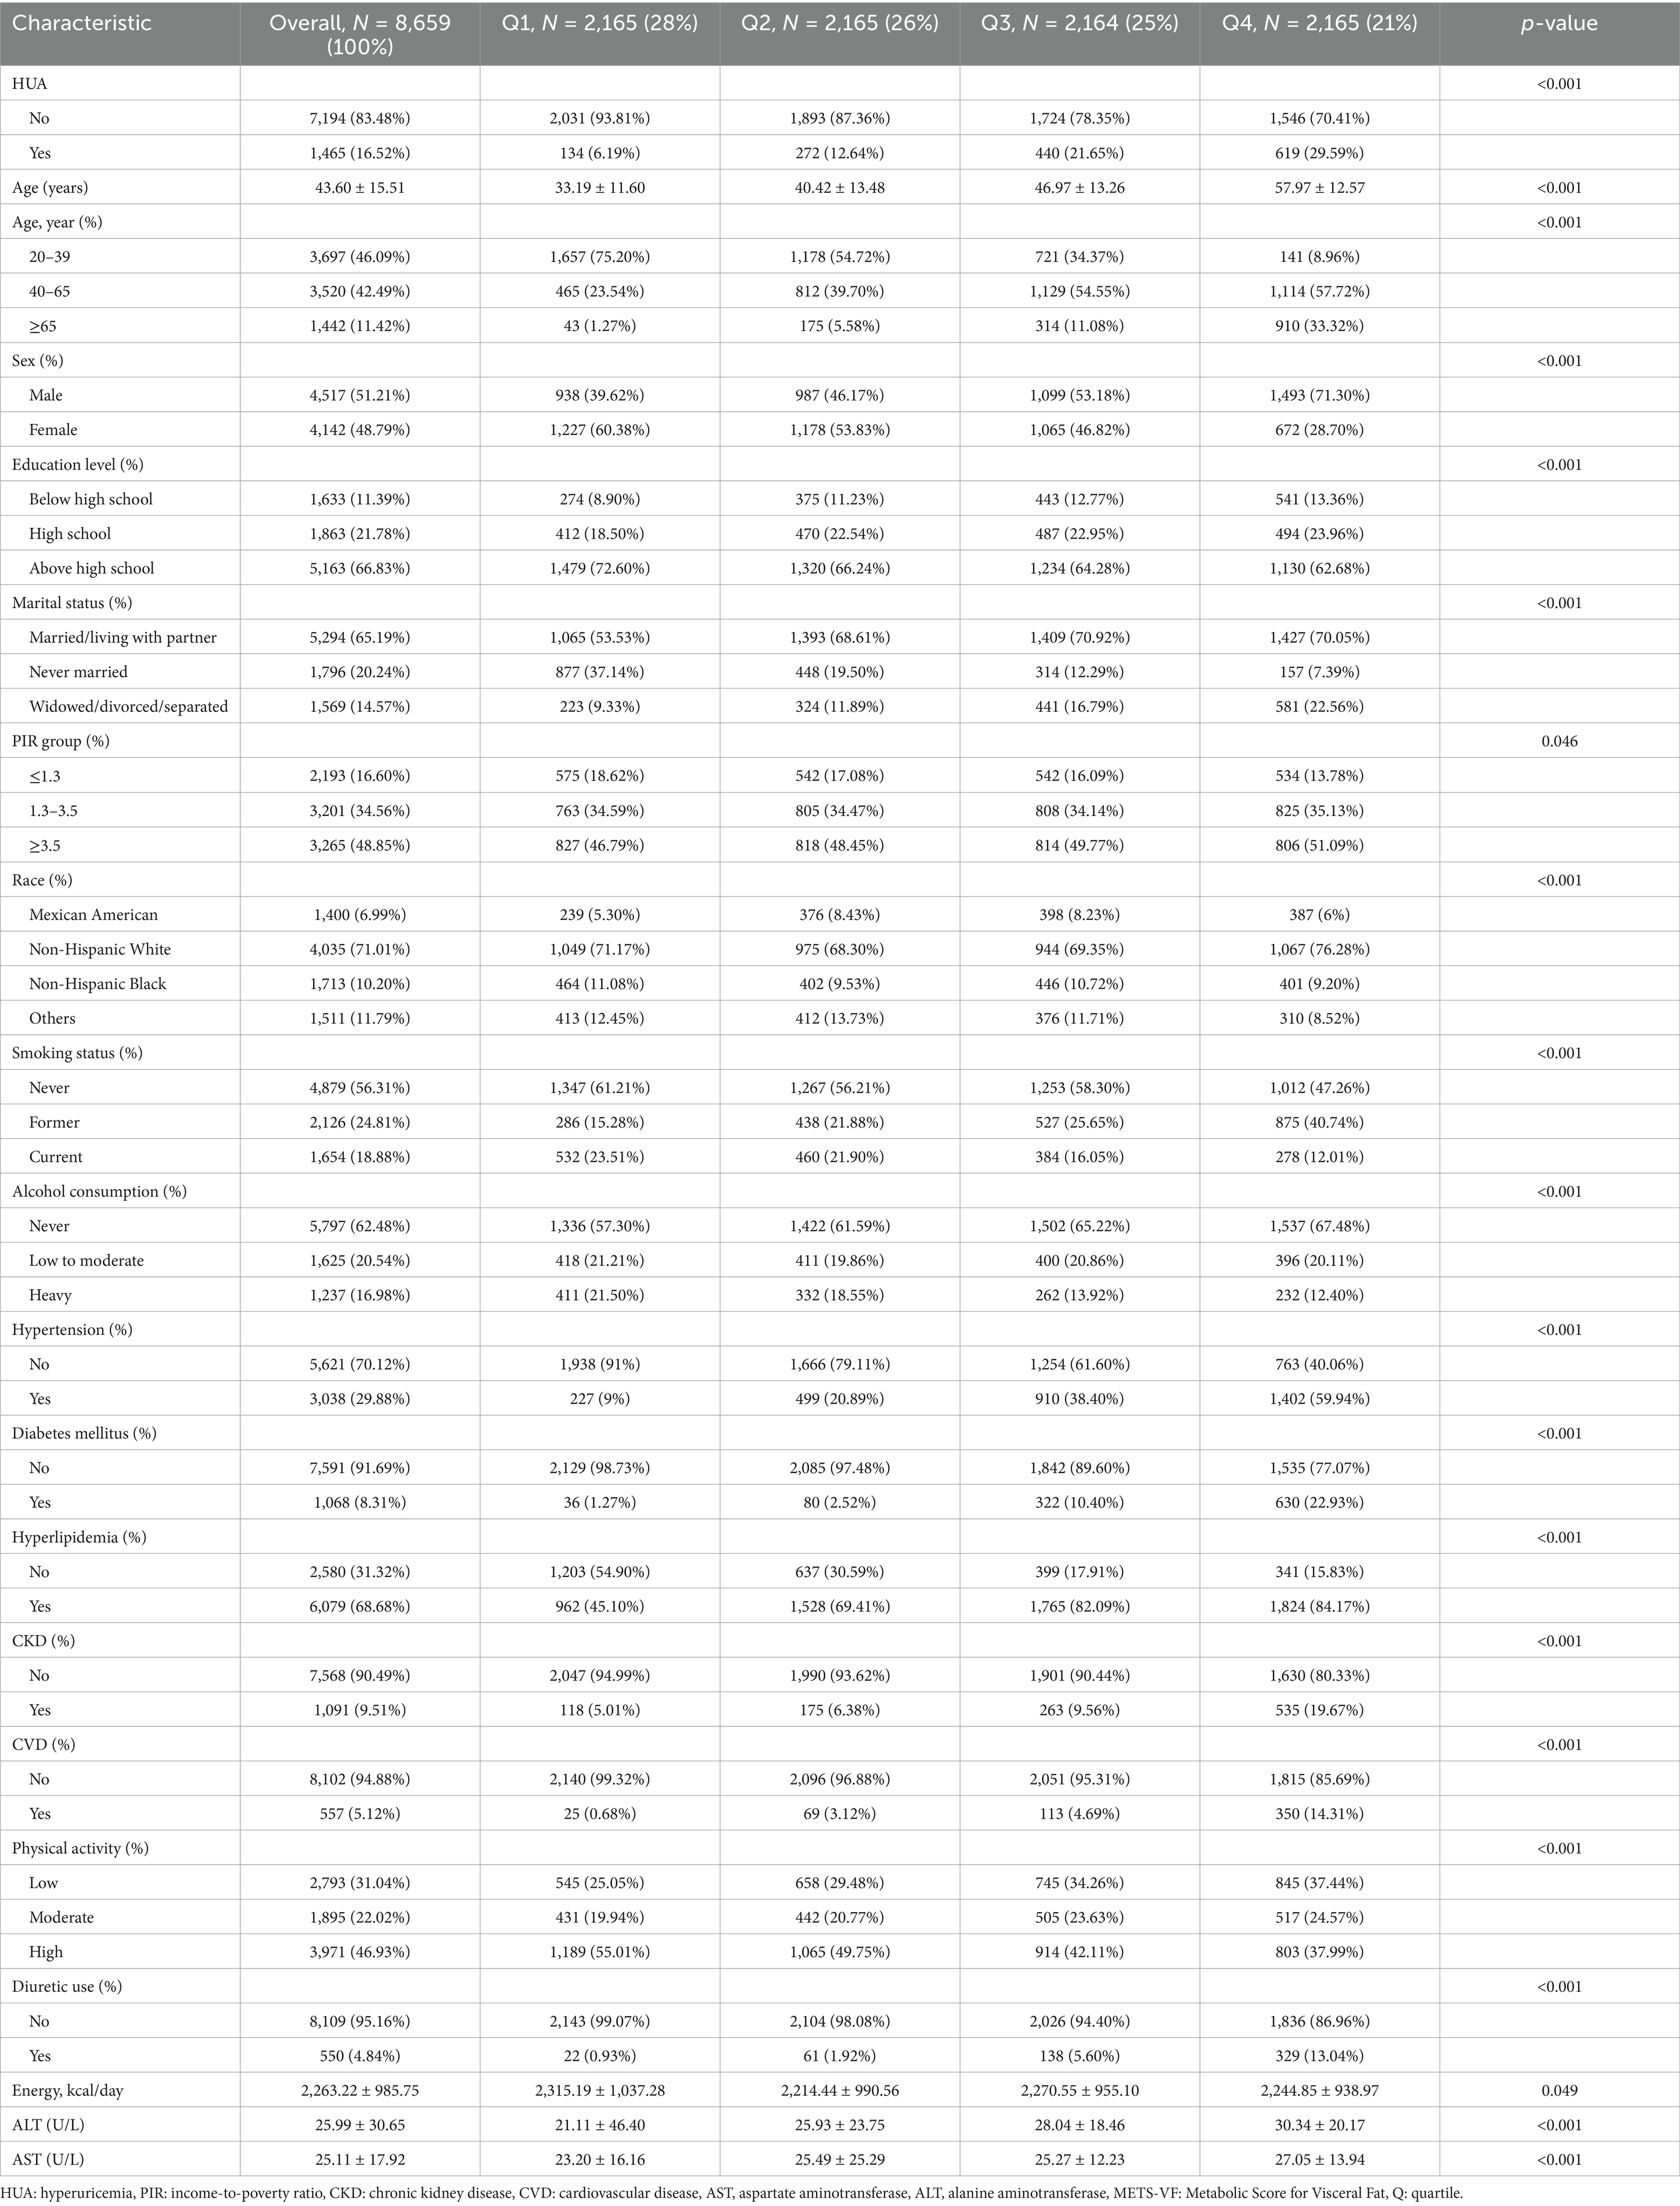
Table 1. Demographic characteristics of all participants based on METS-VF quartile grouping.
Characteristics of participants before and after propensity matching
After PSM 1:1 caliper matching therapy, 1,434 pairs were matched with HUA and non-HUA groups. Before PSM, the two groups were statistically different in age, sex, education level, marital status, smoking, alcohol consumption, hypertension, diabetes, hyperlipidemia, CKD, CVD, diuretic use, ALT, and AST. After PSM, no statistically significant comparisons were made between the two groups except for physical activity, energy intake, ALT, and AST. METS-VF was higher in the HUA group than in the non-HUA group, with statistical significance before and after matching (Figure 2; Table 2).
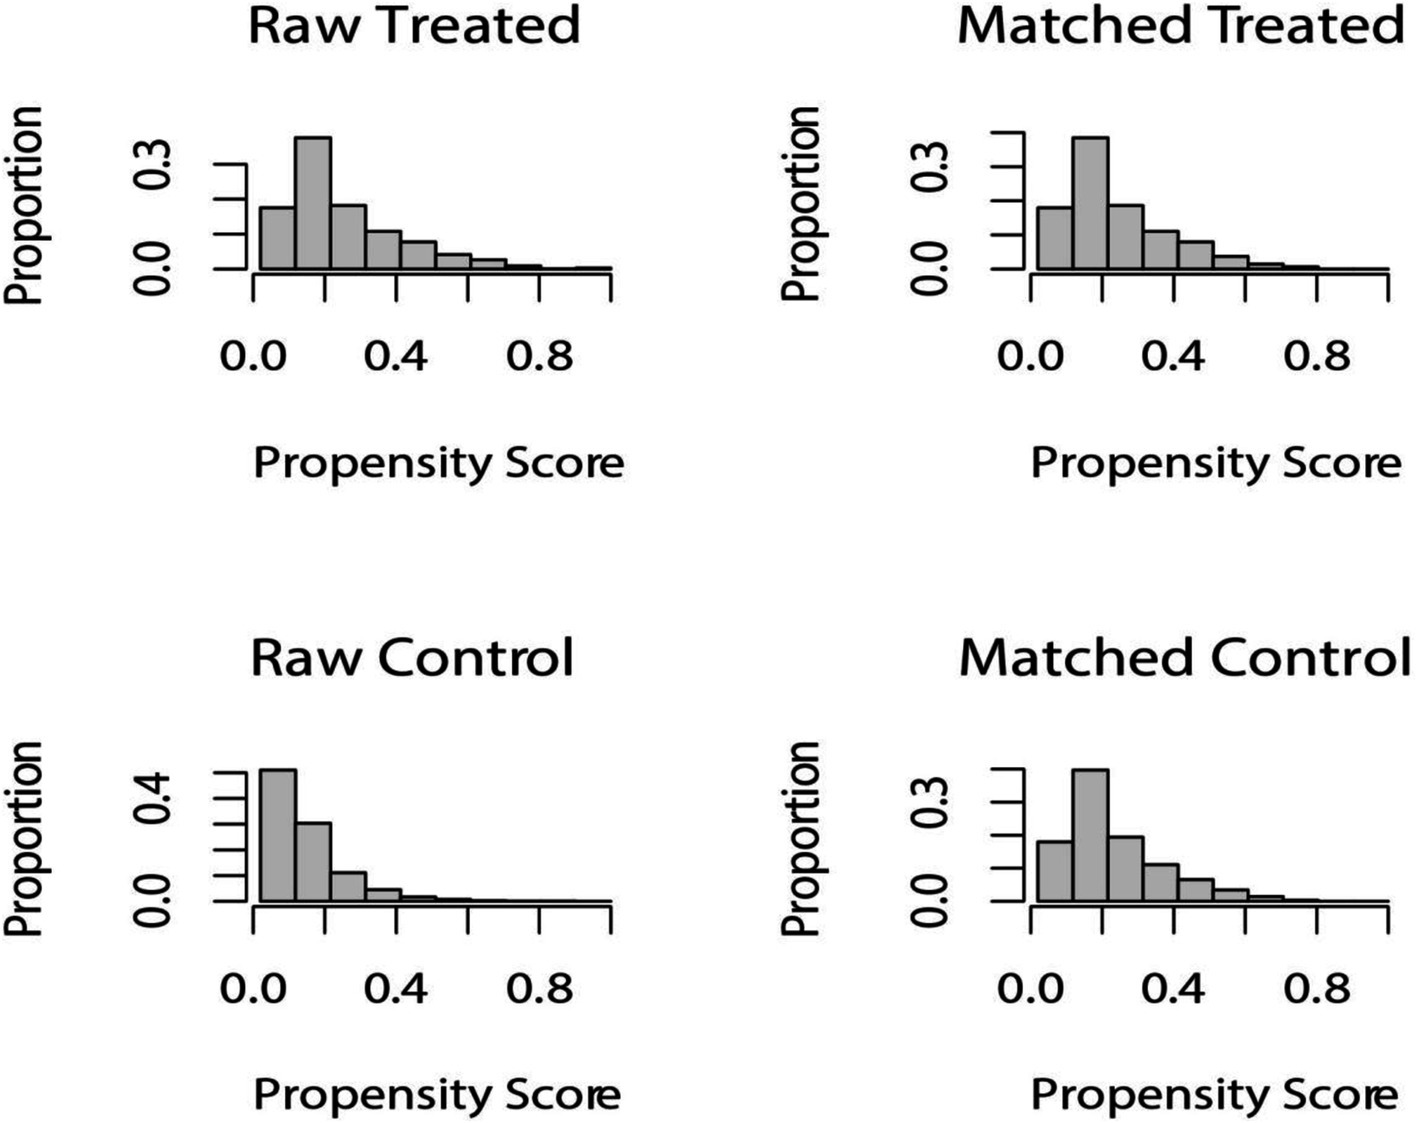
Figure 2. Distribution of propensity score before and after matching. Before undergoing PSM at a 1:1 ratio, raw treated units, and raw control units represented the distribution of individuals in the HUA and non-HUA groups, respectively. After matching, the two groups were represented by matched treated units and matched control units, respectively. The figure illustrates the balanced distribution of individuals in the matched groups following PSM.
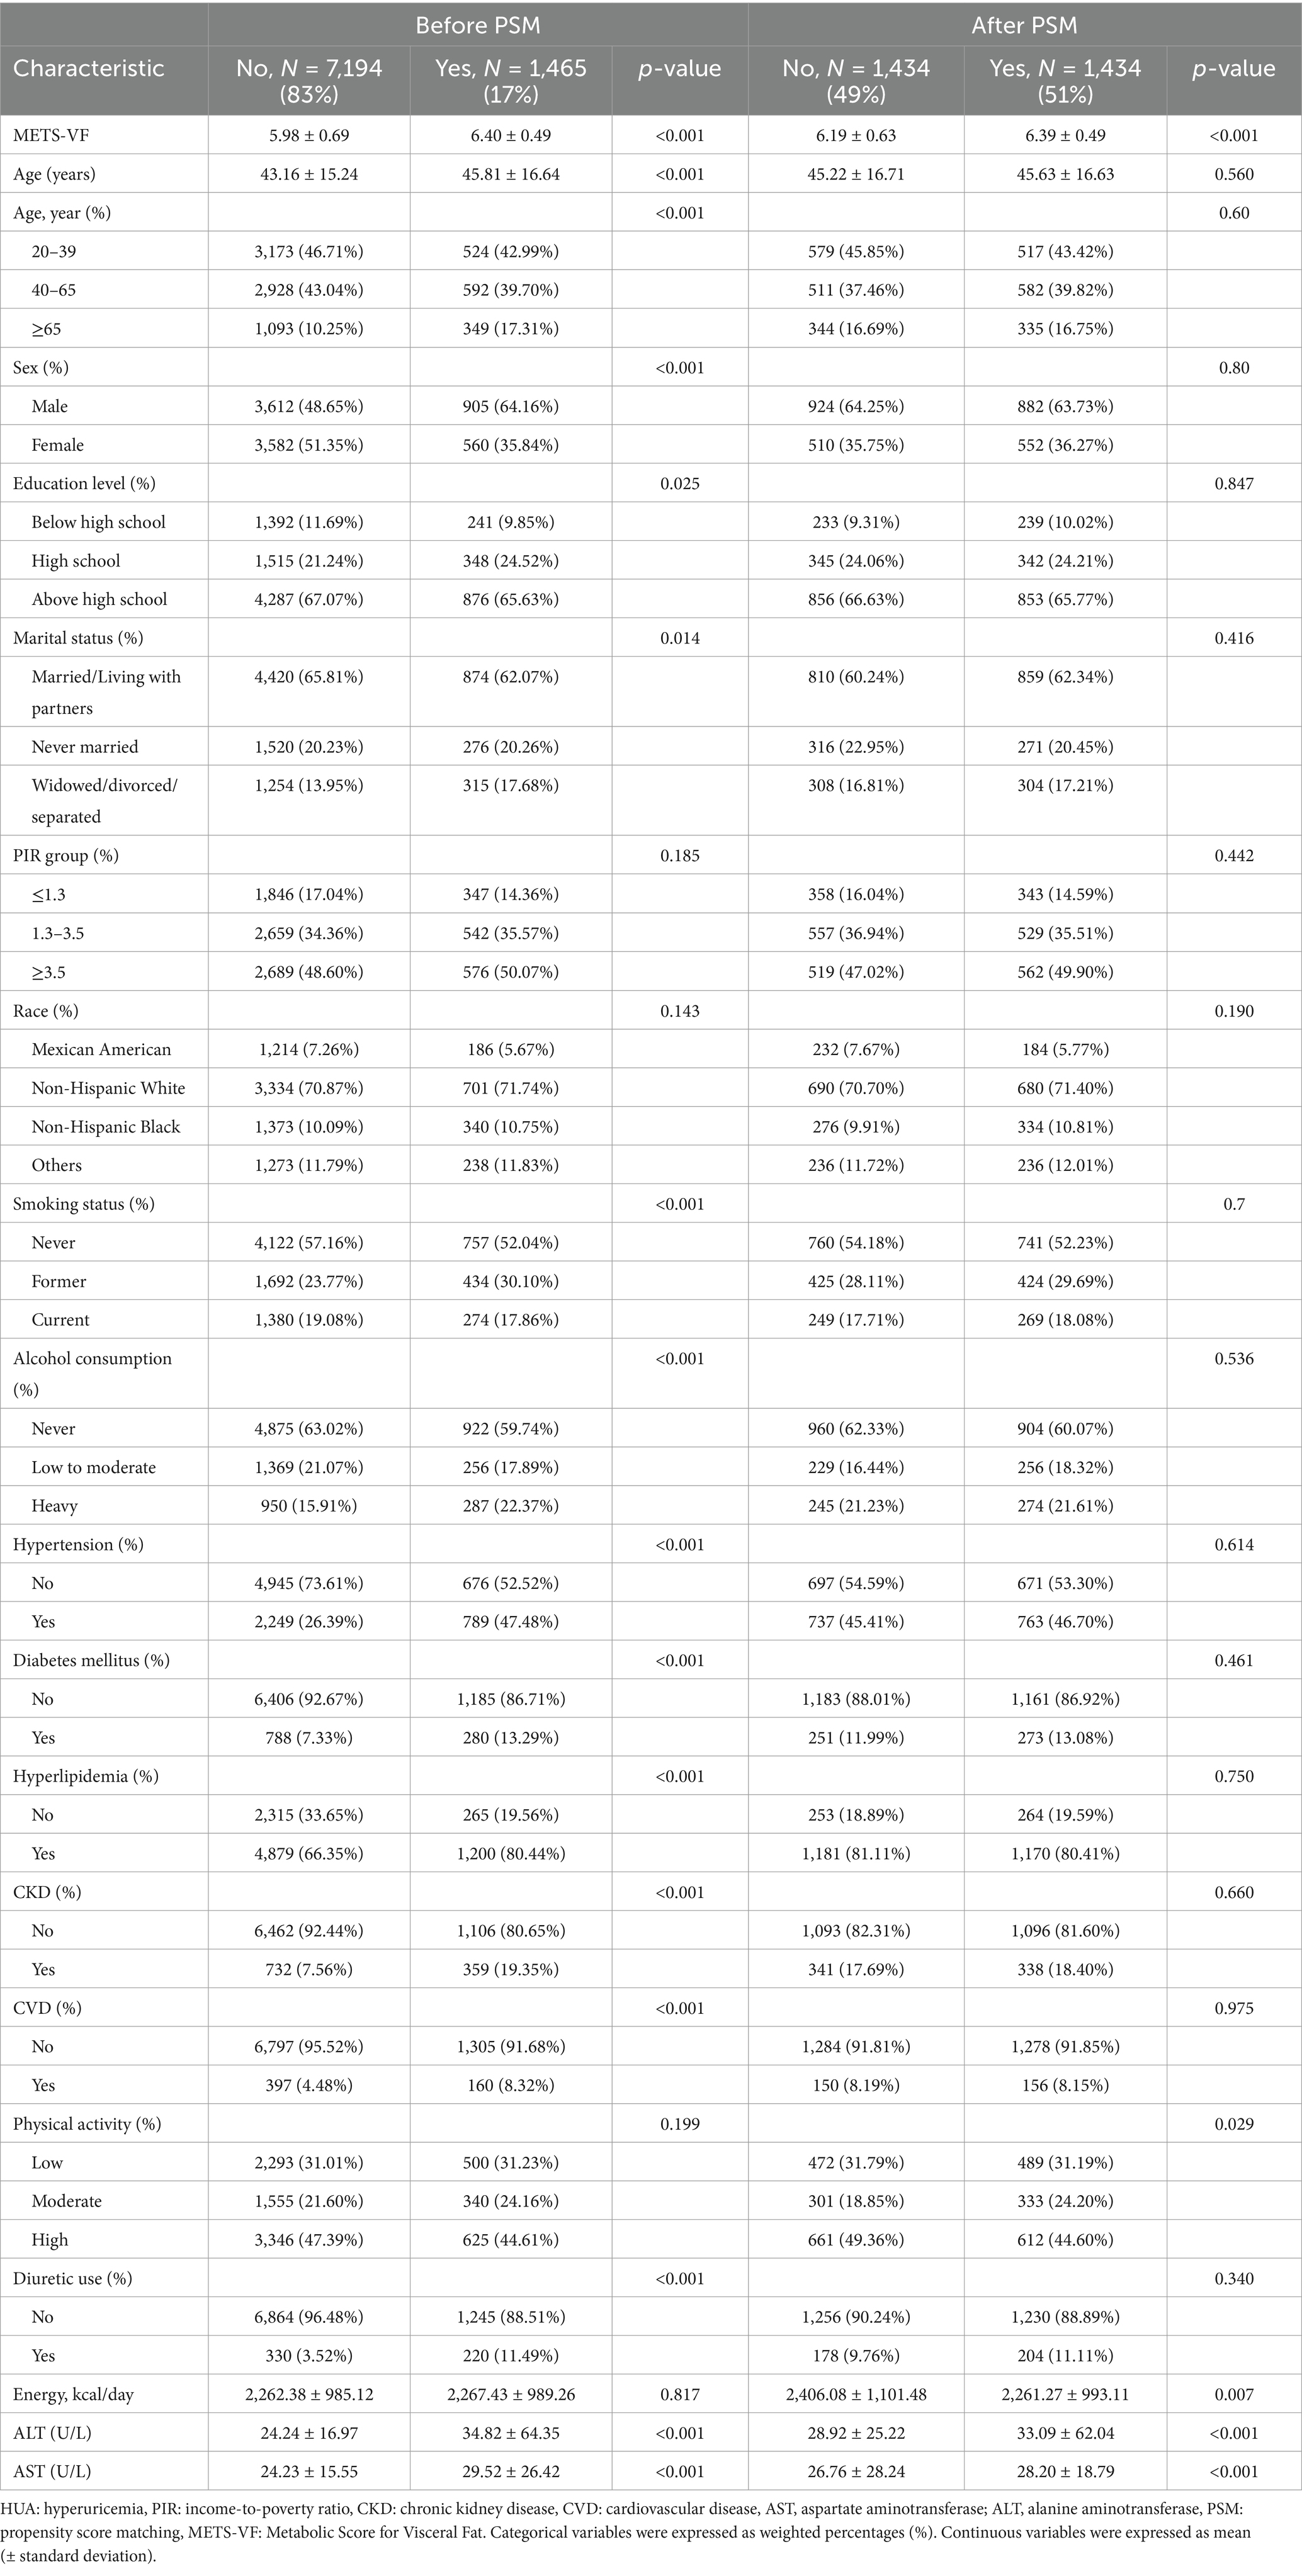
Table 2. Before and after PSM, characteristics of participants with and without HUA.
Correlation analysis between METS-VF and HUA
Three multivariate logistic regression models were constructed to examine the association between METS-VF and HUA (Table 3). In model 3, we controlled for age, sex, race, education level, marital status, PIR, smoking, alcohol consumption, hypertension, diabetes, hyperlipidemia, CKD, CVD, physical activity, diuretic use, energy intake, ALT, and AST. The results indicated that for every unit rise in METS-VF, the likelihood of HUA increased by 251% after accounting for all potential influencing factors [OR: 3.51 (2.88, 4.27)]. The OR for the highest level of METS-VF was 6.07 (4.39, 8.38) compared to the lowest level of METS-VF.
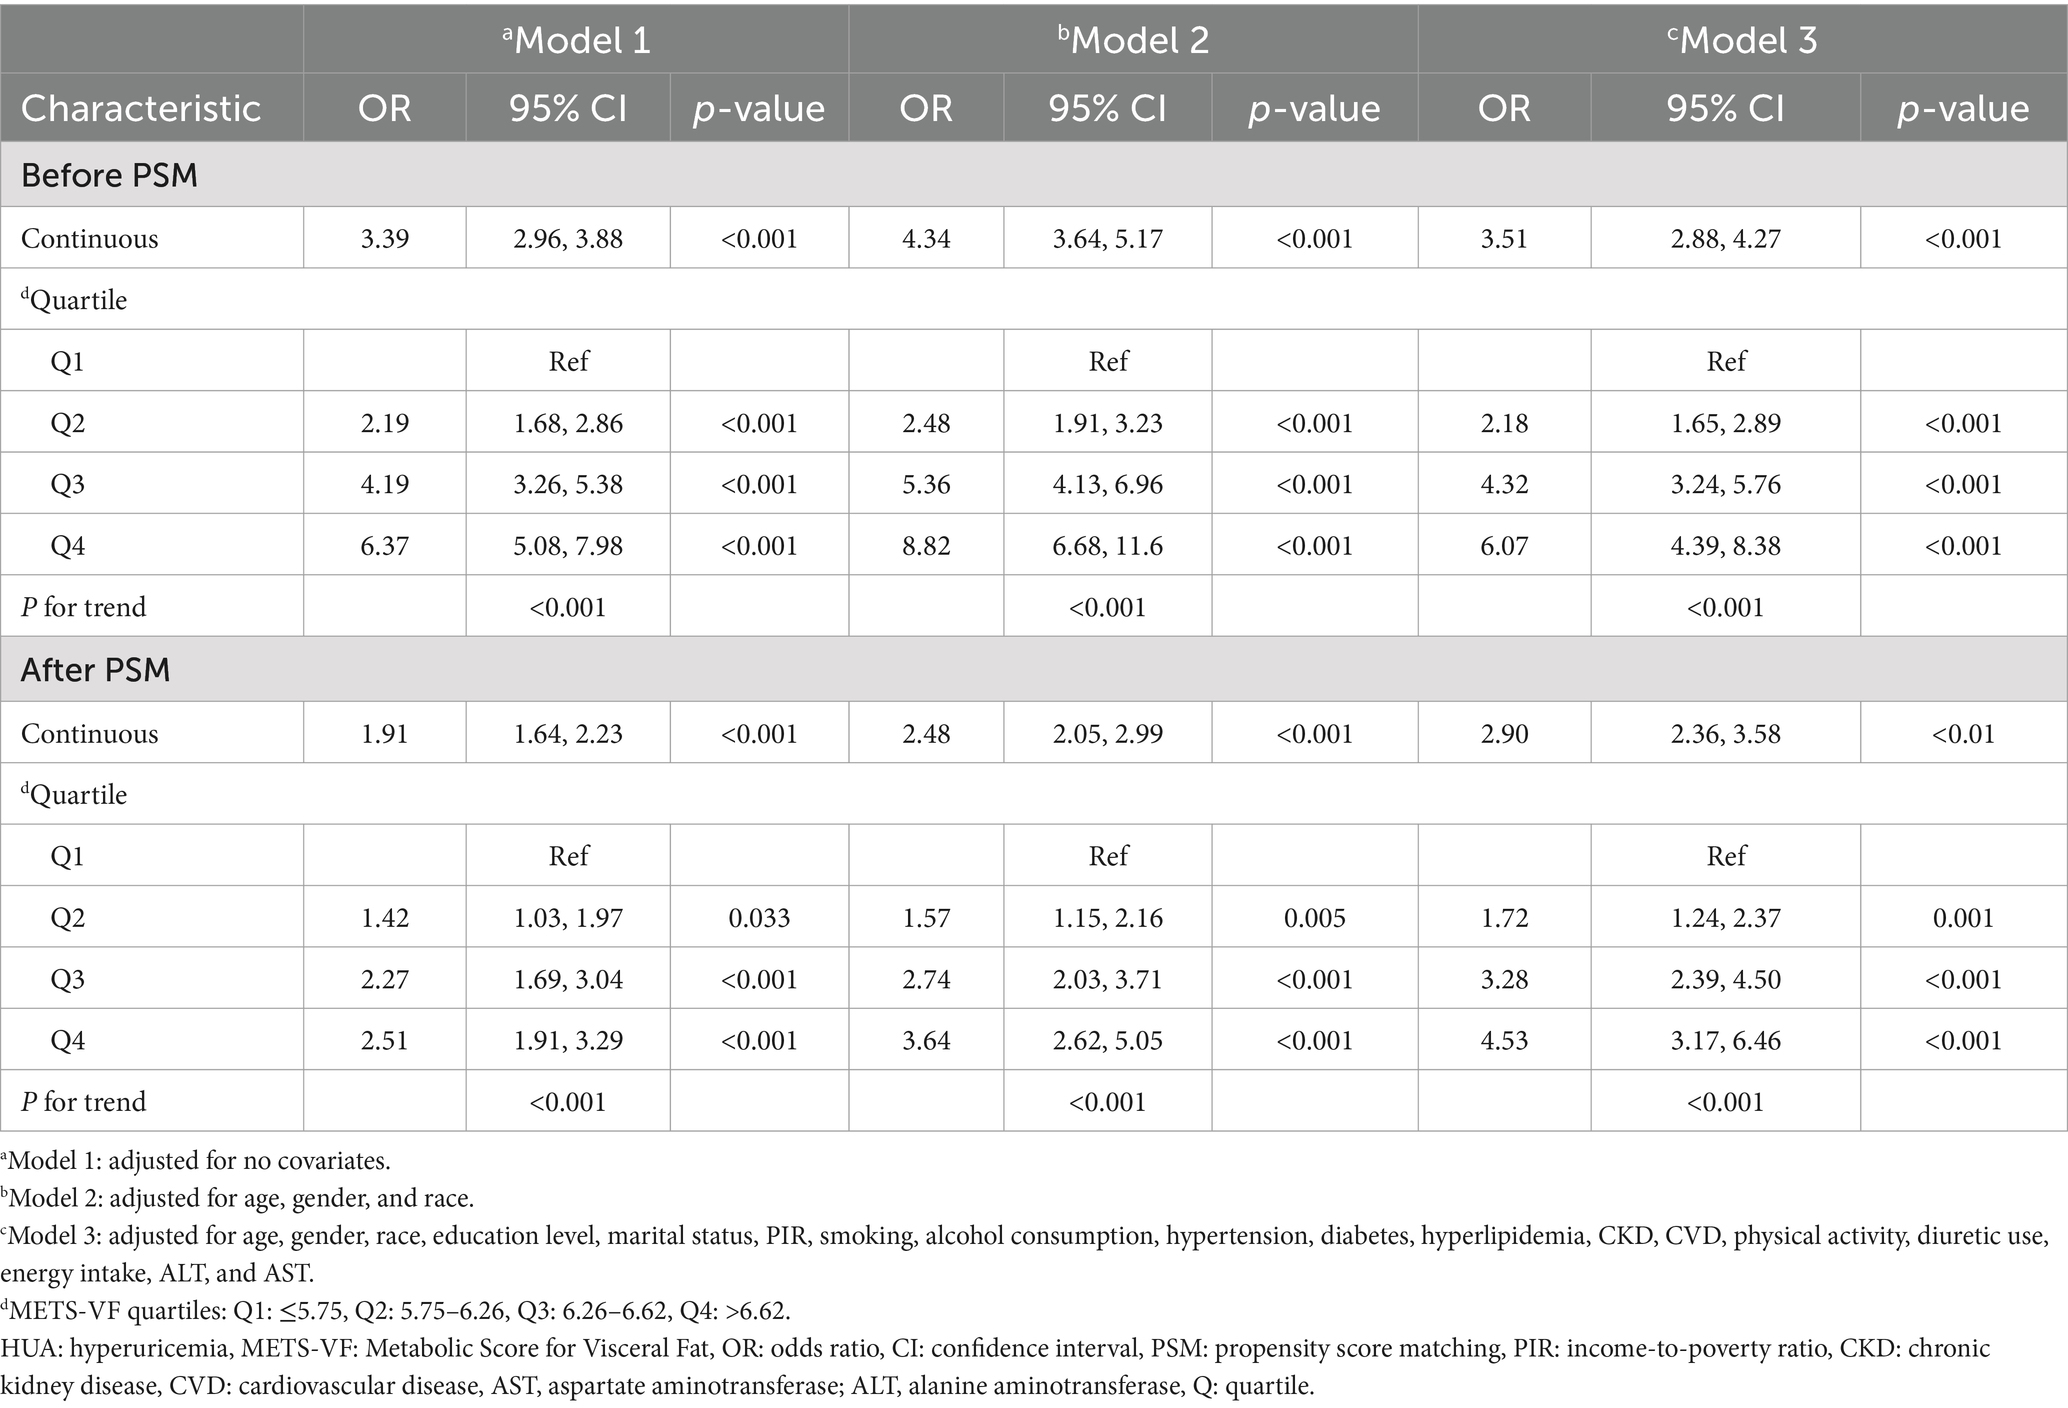
Table 3. Weighted logistic regression analysis of the connection between METS-VF and HUA.
After PSM, the connection between METS-VF and HUA remained substantial. In the fully adjusted model, the odds ratio for developing HUA was 2.90 (2.36, 3.58) for each unit of rise in METS-VF. Using Q1 as the reference, the ORs for Q2, Q3, and Q4 are 1.72 (1.24, 2.37), 3.28 (2.39, 4.50), and 4.53 (3.17, 6.46), respectively.
RCS analysis of the METS-VF and HUA
After correcting for all confounding variables, the RCS analysis of the connection between METS-VF and HUA was conducted. The study identified a non-linear positive connection between METS-VF and the incidence of HUA both before and after PSM (before PSM: p-non-linear <0.001; after PSM: p-non-linear = 0.0065) (Figure 3).
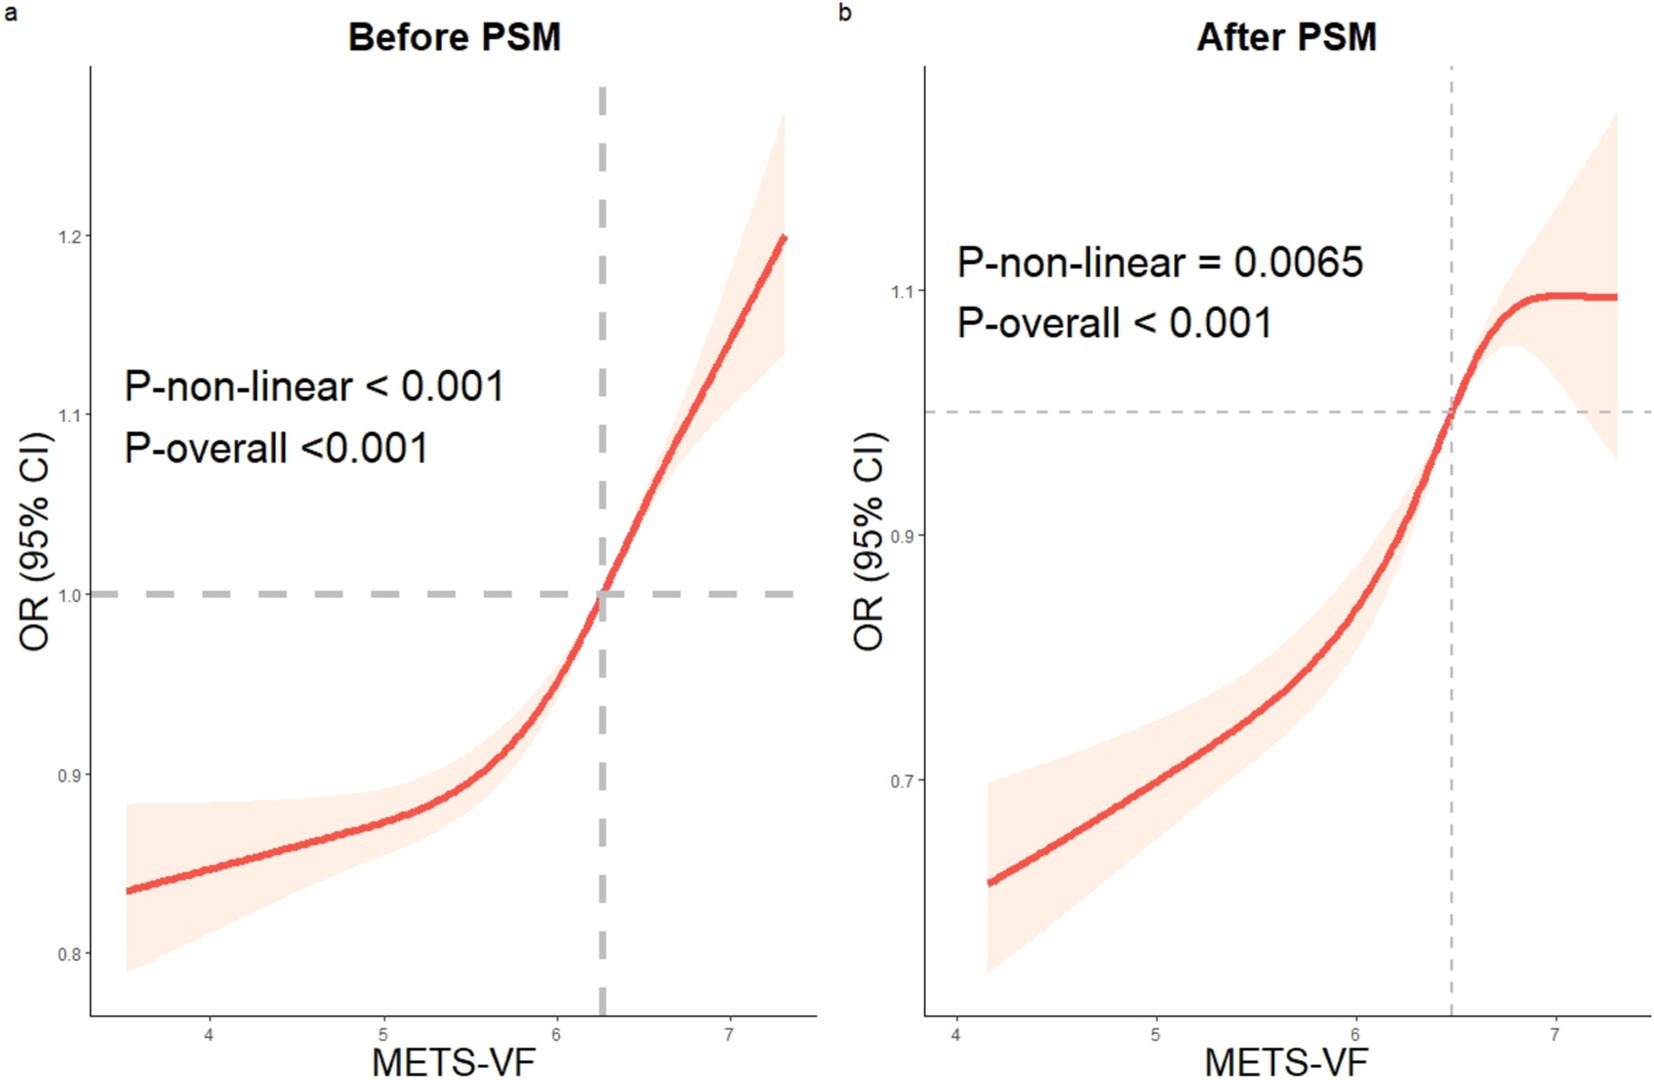
Figure 3. The RCS analysis of METS-VF and HUA. Before and after PSM, a non-linear correlation between METS-VF and HUA. RCS: restricted cubic spline, HUA: hyperuricemia, METS-VF: Metabolic Score for Visceral Fat, PSM: propensity score matching.
Subgroup analysis and interaction test between METS-VF and HUA
In general, consistent results before and after PSM are considered reliable (28). Before and after PSM, the relationship between METS-VF and HUA was statistically significantly different between classes, indicating that age, sex, education level, PIR, hypertension, race except for others, and diabetes all significantly affected this positive association. Interaction tests showed that the effect of METS-VF on HUA varied by sex and race (p < 0.05 for interaction) (Figure 4).
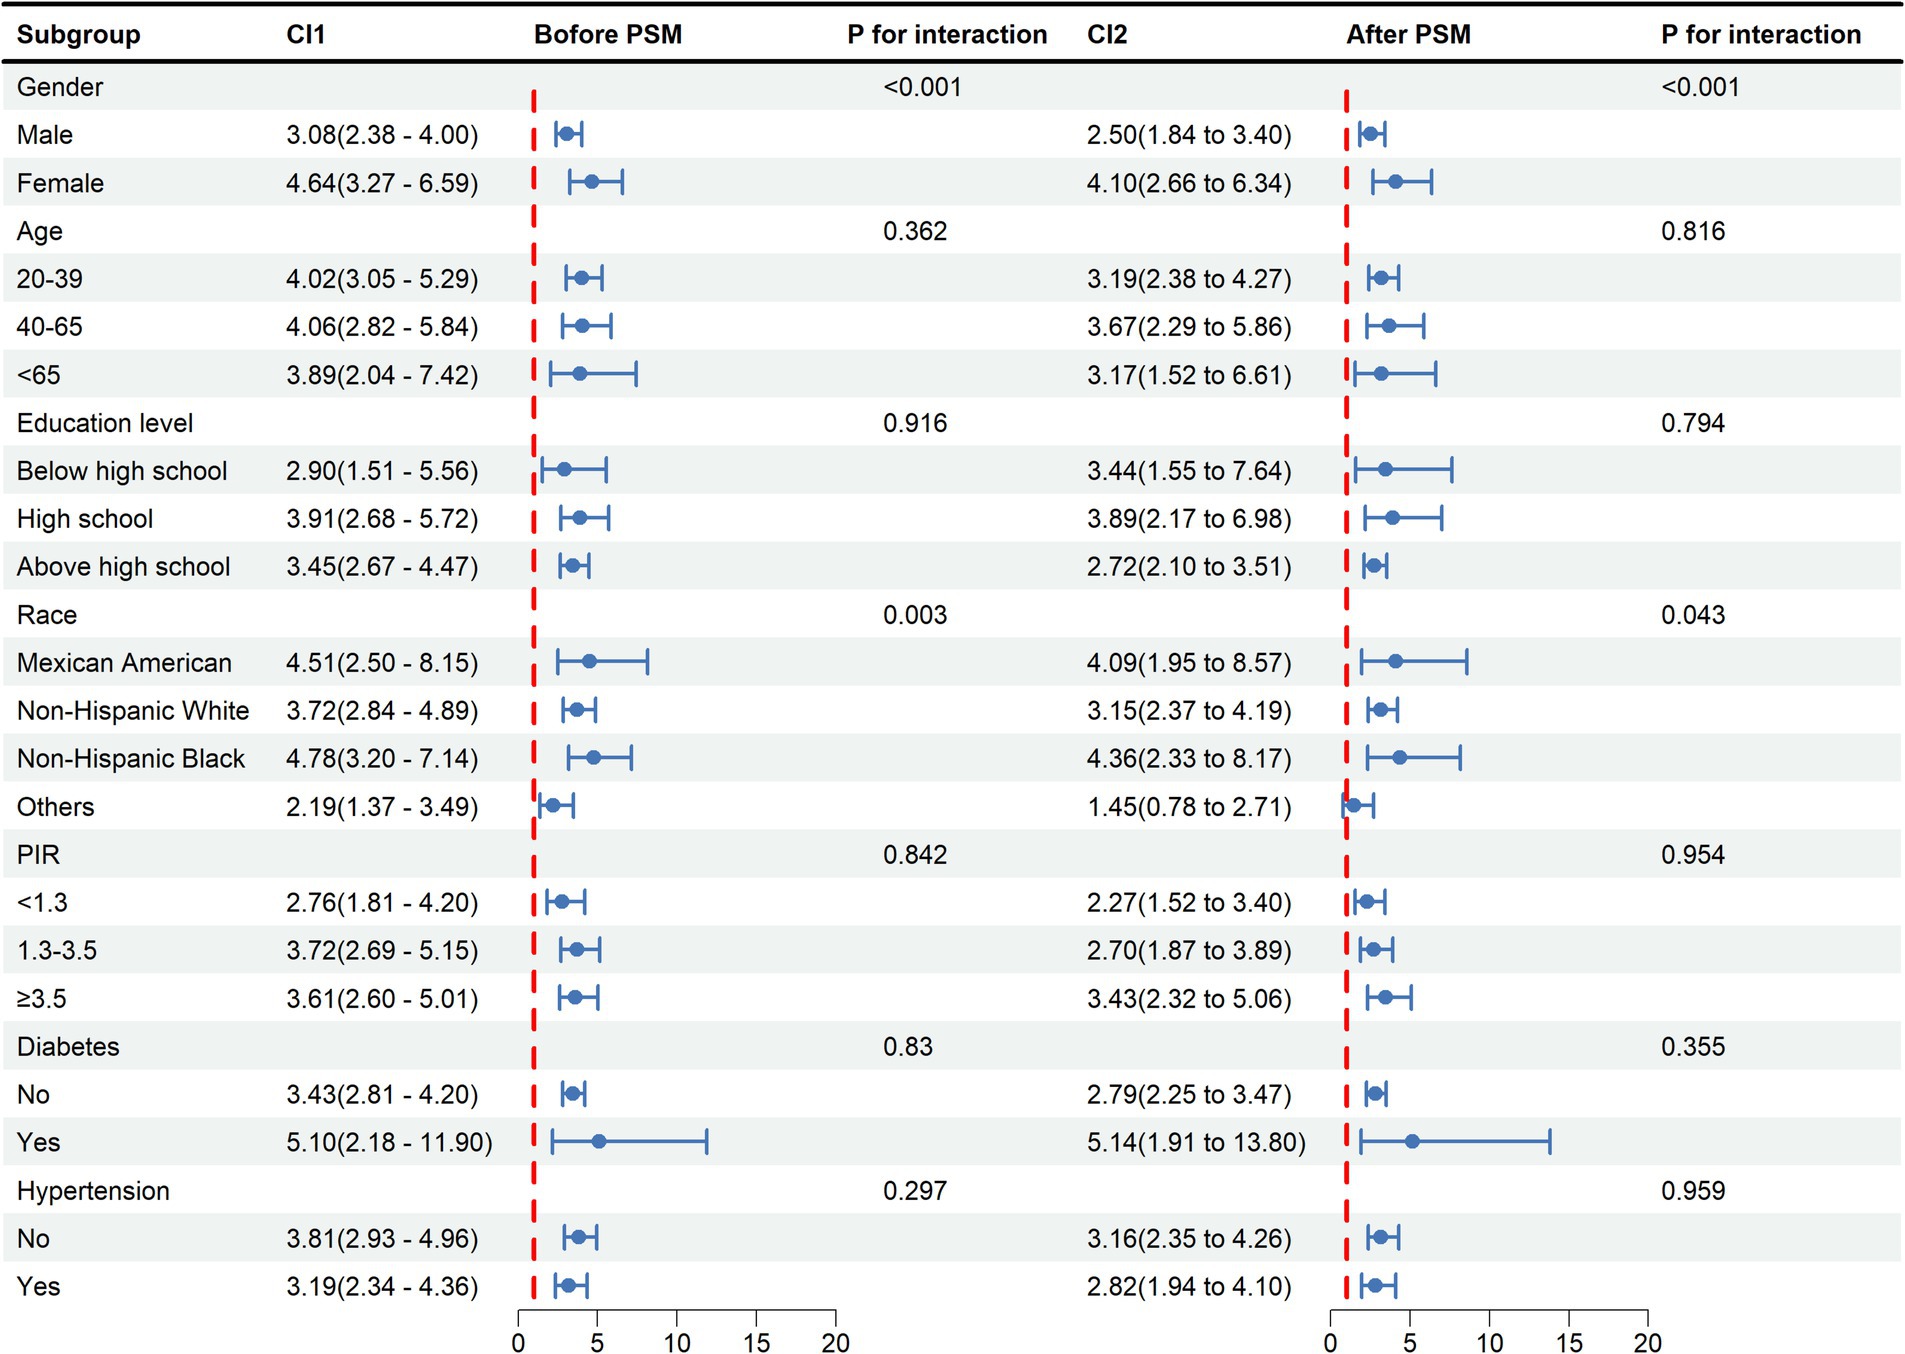
Figure 4. Subgroup analysis and interaction tests for the relationship between METS-VF and HUA. METS-VF: Metabolic Score for Visceral Fat, HUA: hyperuricemia, PSM: propensity score matching, CI: confidence interval, PIR: income-to-poverty ratio.
Discussion
Our study was designed to examine the correlation between METS-VF and HUA. We discovered that the elevated METS-VF was substantially correlated with the increased likelihood of HUA in a cross-sectional study that involved 8,659 individuals. The results of the RCS showed a non-linear positive correlation between METS-VF and HUA. It was demonstrated that a higher likelihood of HUA was connected with elevated METS-VF in age, sex, education level, PIR, hypertension, race except for others, and diabetes subgroups. Interaction tests revealed that the effect of METS-VF on HUA varied by sex and ethnicity. The consistent results before and after PSM underscored the robustness of our findings.
Obesity as a recognized risk factor for HUA has prompted researchers to focus on effective prevention strategies for HUA in the obese population (29). Research has demonstrated that HUA is linked to adipose distribution (30). Consequently, it is imperative to conduct a precise evaluation of the actual obesity status of individuals. An elevated BMI is linked to an elevated incidence of HUA (31). Palmer et al. discovered that an elevated BMI contributes to the development of uric acid levels and HUA (32). In a Japanese cross-sectional study, Tanaka et al. discovered that BMI remained highly correlated with uric acid even after taking into account genetic and family environmental factors (33). Yamashita et al. established that weight loss can lead to an improvement in levels of uric acid in obese people (34). Unfortunately, BMI cannot distinguish between lean and adipose tissue mass (35). Accumulating visceral fat has a more harmful impact on uric acid metabolism compared to BMI and subcutaneous fat accumulation (36). Although both WC and WHtR are predictive of HUA (37), visceral obesity is susceptible to race, sex, and age (35, 38). Furthermore, high insulin levels caused by IR might limit uric acid excretion while increasing uric acid production, resulting in uric acid accumulation (39, 40). METS-VF combines age, sex, WhtR, and METS-IR variables and is expected to serve as a response indicator for HUA. In the Chinese population, a longitudinal association study demonstrated that a higher METS-VF increased the likelihood of HUA (41). Our study confirmed a positive correlation between METS-VF and HUA in the US population.
Considering that the reduction of visceral fat can mitigate the risk of HUA, we propose that public health initiatives should concentrate on lifestyle modifications to decrease visceral fat, potentially preventing HUA and enhancing overall health. Takeshita et al. discovered in a murine model that prolonged voluntary exercise reduced visceral fat in mice (42). Excessive fructose consumption can elevate intracellular cortisol levels, resulting in enhanced fatty acid release from subcutaneous adipocytes, hence facilitating more substrate storage in visceral adipose tissue (43). De Amicis et al. demonstrated that evening-type circadian rhythms may be a significant factor in abdominal obesity and its visceral component (44). Furthermore, a population study conducted by Nakanishi et al. revealed that women who smoked exhibited a higher propensity for visceral fat accumulation (45). Consequently, we underscore that alongside identifying individuals at elevated risk for visceral obesity to avert hyperuricemia, it is imperative to prioritize establishing a healthy lifestyle and sound dietary practices.
Visceral fat accumulation causes an inflow of plasma-free fatty acids into the liver and hepatic portal vein, which boosts triglyceride synthesis and, through altering purine metabolism, causes an increase in the generation of uric acid (46, 47). Matsuura et al. discovered that in obese males, visceral fat increase had a more substantial impact on uric acid metabolism (48). Also, uric acid produces oxidized lipids and inflammatory mediators in adipocytes by activating NADPH oxidase, which, in turn, induces and exacerbates IR (39). IR leads to a significant accumulation of insulin, which can reduce renal excretion of uric acid (39).
The results of this study indicate that sex and racial disparities have significant significance for the relationships examined. The METS-VF formula includes age and IR, which contribute to the accumulation of visceral fat. As age advances, the distribution of fat shifts from being located just beneath the skin to being stored around internal organs, and visceral fat accumulation increases at a rapid pace (49, 50). Studies have shown a gradual increase and centralization of fat mass with age in women (51). Visceral adipose tissue area is significantly increased in postmenopausal women compared to premenopausal women (52). Additionally, in a population-based study, researchers discovered that both abdominal subcutaneous fat and visceral fat were associated with IR. They confirmed that the accumulation of visceral fat is particularly harmful in women (53). These factors may explain the stronger correlation between METS-VF and HUA risk in women. Differences in body fat distribution in different racial groups may be related to biological differences, sociocultural, and socioeconomic status, health behaviors, and neighborhood environments (54, 55). In conclusion, racial differences should be considered when taking measures to prevent HUA caused by visceral fat obesity.
Study strengths and limitations
The connection between METS-VF and the probability of HUA development in the US population has been thoroughly investigated in this study. This study gives vital information about the potential link between these two disorders and the diagnosis and treatment of HUA. Nevertheless, our study has drawbacks. First, this study could not prove a causal link between METS-VF and HUA because of its cross-sectional methodology. Second, self-reported food and lifestyle data in the NHANES database include limitations, such as memory and social desirability bias. These biases may impact the accuracy and reliability of the data and should be taken into account when evaluating the study’s conclusions. Third, studies have indicated that consuming fructose and purine-rich foods can result in hyperuricemia. The study could not rule out the possibility that dietary and other factors could interfere with the results. Fourth, the NHANES data are representative of the US population. The study’s findings may not apply to other populations due to lifestyle, diet, and genetics differences. Finally, the METS-VF assessment was not validated by objective laboratory measurements; therefore, more research is needed to understand this correlation.
Conclusion
Our research demonstrated a consistent and robust link between METS-VF and the incidence of HUA. Furthermore, our study has the potential to offer novel insights into the prevention and treatment of HUA.
Data availability statement
The original contributions presented in the study are included in the article/supplementary material, further inquiries can be directed to the corresponding author.
Ethics statement
The studies involving humans were approved by the National Ethical Review Board. The studies were conducted in accordance with the local legislation and institutional requirements. The participants provided their written informed consent to participate in this study.
Author contributions
LX: Formal analysis, Writing – original draft. HQ: Methodology, Writing – original draft. JL: Formal analysis, Writing – original draft. DL: Visualization, Writing – original draft. XC: Supervision, Writing – review & editing. JX: Supervision, Writing – review & editing.
Funding
The author(s) declare financial support was received for the research, authorship, and/or publication of this article. This study was funded by the Sanming Project of Medicine in Shenzhen (no. SZZYSM202206014).
Acknowledgments
We thank the organizers and staff of the National Health and Nutrition Examination Survey (NHANES) project for collecting and compiling the data.
Conflict of interest
The authors declare that the research was conducted in the absence of any commercial or financial relationships that could be construed as a potential conflict of interest.
Publisher’s note
All claims expressed in this article are solely those of the authors and do not necessarily represent those of their affiliated organizations, or those of the publisher, the editors and the reviewers. Any product that may be evaluated in this article, or claim that may be made by its manufacturer, is not guaranteed or endorsed by the publisher.
References
1. Maiuolo, J, Oppedisano, F, Gratteri, S, Muscoli, C, and Mollace, V. Regulation of uric acid metabolism and excretion. Int J Cardiol. (2016) 213:8–14. doi: 10.1016/j.ijcard.2015.08.109
2. Chen-Xu, M, Yokose, C, Rai, SK, Pillinger, MH, and Choi, HK. Contemporary prevalence of gout and hyperuricemia in the United States and decadal trends: the National Health and nutrition examination survey, 2007-2016. Arthritis Rheumatol. (2019) 71:991–9. doi: 10.1002/art.40807
3. Zhang, M, Zhu, X, Wu, J, Huang, Z, Zhao, Z, Zhang, X, et al. Prevalence of hyperuricemia among Chinese adults: findings from two nationally representative cross-sectional surveys in 2015-16 and 2018-19. Front Immunol. (2021) 12:791983. doi: 10.3389/fimmu.2021.791983
4. Dehlin, M, Jacobsson, L, and Roddy, E. Global epidemiology of gout: prevalence, incidence, treatment patterns and risk factors. Nat Rev Rheumatol. (2020) 16:380–90. doi: 10.1038/s41584-020-0441-1
5. Eliseev, MS, and Novikova, AM. Comorbidity in gout and hyperuricemia: prevalence, causes, prospects of urate lowering therapy. Ter Arkh. (2019) 91:120–8. doi: 10.26442/00403660.2019.05.000232
6. Rodenbach, KE, Schneider, MF, Furth, SL, Moxey-Mims, MM, Mitsnefes, MM, Weaver, DJ, et al. Hyperuricemia and progression of CKD in children and adolescents: the chronic kidney disease in children (CKiD) cohort study. Am J Kidney Dis. (2015) 66:984–92. doi: 10.1053/j.ajkd.2015.06.015
7. Wang, J, Qin, T, Chen, J, Li, Y, Wang, L, Huang, H, et al. Hyperuricemia and risk of incident hypertension: a systematic review and meta-analysis of observational studies. PLoS One. (2014) 9:e114259. doi: 10.1371/journal.pone.0114259
8. Chooi, YC, Ding, C, and Magkos, F. The epidemiology of obesity. Metabolism. (2019) 92:6–10. doi: 10.1016/j.metabol.2018.09.005
9. NCD Risk Factor Collaboration (NCD-RisC). Trends in adult body-mass index in 200 countries from 1975 to 2014: a pooled analysis of 1698 population-based measurement studies with 19·2 million participants. Lancet. (2016) 387:1377–96. doi: 10.1016/s0140-6736(16)30054-x
10. Gong, M, Wen, S, Nguyen, T, Wang, C, Jin, J, and Zhou, L. Converging relationships of obesity and hyperuricemia with special reference to metabolic disorders and plausible therapeutic implications. Diab Metab Syndr Obes. (2020) 13:943–62. doi: 10.2147/dmso.S232377
11. Rhéaume, C, Leblanc, M, and Poirier, P. Adiposity assessment: explaining the association between obesity, hypertension and stroke. Expert Rev Cardiovasc Ther. (2011) 9:1557–64. doi: 10.1586/erc.11.167
12. Nevill, AM, Stewart, AD, Olds, T, and Holder, R. Relationship between adiposity and body size reveals limitations of BMI. Am J Phys Anthropol. (2006) 129:151–6. doi: 10.1002/ajpa.20262
13. Huxley, R, Mendis, S, Zheleznyakov, E, Reddy, S, and Chan, J. Body mass index, waist circumference and waist:hip ratio as predictors of cardiovascular risk--a review of the literature. Eur J Clin Nutr. (2010) 64:16–22. doi: 10.1038/ejcn.2009.68
14. Hadaegh, F, Zabetian, A, Harati, H, and Azizi, F. Waist/height ratio as a better predictor of type 2 diabetes compared to body mass index in Tehranian adult men--a 3.6-year prospective study. Exp Clin Endocrinol Diabetes. (2006) 114:310–5. doi: 10.1055/s-2006-924123
15. Stevens, J, Katz, EG, and Huxley, RR. Associations between gender, age, and waist circumference. Eur J Clin Nutr. (2010) 64:6–15. doi: 10.1038/ejcn.2009.101
16. Liu, X, He, M, and Li, Y. Adult obesity diagnostic tool: a narrative review. Medicine (Baltimore). (2024) 103:e37946. doi: 10.1097/md.0000000000037946
17. Gao, Y, Min, YI, Bell, RA, Bertoni, AG, and Correa, A. Cross-sectional and longitudinal analyses of variations of anthropometric measures of obesity with age in the Jackson heart study. BMJ Open. (2023) 13:e069127. doi: 10.1136/bmjopen-2022-069127
18. Gierach, M, and Junik, R. Insulin resistance in metabolic syndrome depending on the occurrence of its components. Endokrynol Pol. (2021) 72:243–8. doi: 10.5603/EP.a2021.0037
19. Frayn, KN. Visceral fat and insulin resistance--causative or correlative? Br J Nutr. (2000) 83:S71–7. doi: 10.1017/s0007114500000982
20. Kabir, M, Catalano, KJ, Ananthnarayan, S, Kim, SP, Van Citters, GW, Dea, MK, et al. Molecular evidence supporting the portal theory: a causative link between visceral adiposity and hepatic insulin resistance. Am J Physiol Endocrinol Metab. (2005) 288:E454–61. doi: 10.1152/ajpendo.00203.2004
21. Bello-Chavolla, OY, Antonio-Villa, NE, Vargas-Vázquez, A, Viveros-Ruiz, TL, Almeda-Valdes, P, Gomez-Velasco, D, et al. Metabolic score for visceral fat (METS-VF), a novel estimator of intra-abdominal fat content and cardio-metabolic health. Clin Nutr. (2020) 39:1613–21. doi: 10.1016/j.clnu.2019.07.012
22. Li, Y, Yi, S, Jiang, W, and Gong, M. Exploring the relationship between different obesity metabolism indices and hyperuricemia in patients with hypertension and coronary heart disease. Diabetes Metab Syndr Obes. (2024) 17:3817–32. doi: 10.2147/dmso.S491255
23. Yu, P, Meng, X, Kan, R, Wang, Z, and Yu, X. Association between metabolic scores for visceral fat and chronic kidney disease: a cross-sectional study. Front Endocrinol (Lausanne). (2022) 13:1052736. doi: 10.3389/fendo.2022.1052736
24. Deng, CY, Ke, XP, and Guo, XG. Investigating a novel surrogate indicator of adipose accumulation in relation to erectile dysfunction. Lipids Health Dis. (2024) 23:139. doi: 10.1186/s12944-024-02118-9
25. Yang, R, Kuang, M, Qiu, J, Yu, C, Sheng, G, and Zou, Y. Assessing the usefulness of a newly proposed metabolic score for visceral fat in predicting future diabetes: results from the NAGALA cohort study. Front Endocrinol (Lausanne). (2023) 14:1172323. doi: 10.3389/fendo.2023.1172323
26. Guo, Z, Li, G, Chen, Y, Fan, S, Sun, S, Hao, Y, et al. Could METS-VF provide a clue as to the formation of kidney stones? Front Endocrinol (Lausanne). (2023) 14:1166922. doi: 10.3389/fendo.2023.1166922
27. Wang, H, Qin, S, Li, F, Zhang, H, and Zeng, L. A cross-sectional study on the association between dietary inflammatory index and hyperuricemia based on NHANES 2005-2018. Front Nutr. (2023) 10:1218166. doi: 10.3389/fnut.2023.1218166
28. Zeng, Z, Cen, Y, Xiong, L, Hong, G, Luo, Y, and Luo, X. Dietary copper intake and risk of Parkinson's disease: a cross-sectional study. Biol Trace Elem Res. (2024) 202:955–64. doi: 10.1007/s12011-023-03750-9
29. Nakanishi, N, Yoshida, H, Nakamura, K, Suzuki, K, and Tatara, K. Predictors for development of hyperuricemia: an 8-year longitudinal study in middle-aged Japanese men. Metabolism. (2001) 50:621–6. doi: 10.1053/meta.2001.24196
30. Kawano, K, Ueno, T, Maeda, T, Nohara, C, Maki, K, Iwanaga, K, et al. Relationship between abdominal circumference and the incidence of hyperuricemia in the general Japanese population. Sci Rep. (2024) 14:4573. doi: 10.1038/s41598-024-55008-6
31. Kuwabara, M, Kuwabara, R, Niwa, K, Hisatome, I, Smits, G, Roncal-Jimenez, CA, et al. Different risk for hypertension, diabetes, dyslipidemia, and hyperuricemia according to level of body mass index in Japanese and American subjects. Nutrients. (2018) 10:1011. doi: 10.3390/nu10081011
32. Palmer, TM, Nordestgaard, BG, Benn, M, Tybjærg-Hansen, A, Davey Smith, G, Lawlor, DA, et al. Association of plasma uric acid with ischaemic heart disease and blood pressure: mendelian randomisation analysis of two large cohorts. BMJ. (2013) 347:f4262. doi: 10.1136/bmj.f4262
33. Tanaka, K, Ogata, S, Tanaka, H, Omura, K, Honda, C, and Hayakawa, K. The relationship between body mass index and uric acid: a study on Japanese adult twins. Environ Health Prev Med. (2015) 20:347–53. doi: 10.1007/s12199-015-0473-3
34. Yamashita, S, Matsuzawa, Y, Tokunaga, K, Fujioka, S, and Tarui, S. Studies on the impaired metabolism of uric acid in obese subjects: marked reduction of renal urate excretion and its improvement by a low-calorie diet. Int J Obes. (1986) 10:255–64.
35. Sun, J, Yue, C, Liu, Z, Li, J, and Kang, W. The association between Total percent fat and serum uric acid in adults. Front Nutr. (2022) 9:851280. doi: 10.3389/fnut.2022.851280
36. Takahashi, S, Yamamoto, T, Tsutsumi, Z, Moriwaki, Y, Yamakita, J, and Higashino, K. Close correlation between visceral fat accumulation and uric acid metabolism in healthy men. Metabolism. (1997) 46:1162–5. doi: 10.1016/s0026-0495(97)90210-9
37. Zhou, Z, Li, K, Li, X, Luan, R, and Zhou, R. Independent and joint associations of body mass index, waist circumference, waist-height ratio and their changes with risks of hyperuricemia in middle-aged and older Chinese individuals: a population-based nationwide cohort study. Nutr Metab (Lond). (2021) 18:62. doi: 10.1186/s12986-021-00590-z
38. Li, Z, Gao, L, Zhong, X, Feng, G, Huang, F, and Xia, S. Association of Visceral fat Area and Hyperuricemia in non-obese US adults: a cross-sectional study. Nutrients. (2022) 14:14. doi: 10.3390/nu14193992
39. Facchini, F, Chen, YD, Hollenbeck, CB, and Reaven, GM. Relationship between resistance to insulin-mediated glucose uptake, urinary uric acid clearance, and plasma uric acid concentration. JAMA. (1991) 266:3008–11. doi: 10.1001/jama.1991.03470210076036
40. Yanai, H, Adachi, H, Hakoshima, M, and Katsuyama, H. Molecular biological and clinical understanding of the pathophysiology and treatments of hyperuricemia and its association with metabolic syndrome, cardiovascular diseases and chronic kidney disease. Int J Mol Sci. (2021) 22:22. doi: 10.3390/ijms22179221
41. Liu, XZ, Chen, DS, Xu, X, Li, HH, Liu, LY, Zhou, L, et al. Longitudinal associations between metabolic score for visceral fat and hyperuricemia in non-obese adults. Nutr Metab Cardiovasc Dis. (2020) 30:1751–7. doi: 10.1016/j.numecd.2020.06.001
42. Takeshita, H, Horiuchi, M, Izumo, K, Kawaguchi, H, Arimura, E, Aoyama, K, et al. Long-term voluntary exercise, representing habitual exercise, lowers visceral fat and alters plasma amino acid levels in mice. Environ Health Prev Med. (2012) 17:275–84. doi: 10.1007/s12199-011-0249-3
43. DiNicolantonio, JJ, Mehta, V, Onkaramurthy, N, and O'Keefe, JH. Fructose-induced inflammation and increased cortisol: a new mechanism for how sugar induces visceral adiposity. Prog Cardiovasc Dis. (2018) 61:3–9. doi: 10.1016/j.pcad.2017.12.001
44. De Amicis, R, Galasso, L, Leone, A, Vignati, L, De Carlo, G, Foppiani, A, et al. Is abdominal fat distribution associated with Chronotype in adults independently of lifestyle factors? Nutrients. (2020) 12:592. doi: 10.3390/nu12030592
45. Nakanishi, K, Nishida, M, Ohama, T, Moriyama, T, and Yamauchi-Takihara, K. Smoking associates with visceral fat accumulation especially in women. Circ J. (2014) 78:1259–63. doi: 10.1253/circj.cj-13-1134
46. Ali, N, Perveen, R, Rahman, S, Mahmood, S, Rahman, S, Islam, S, et al. Prevalence of hyperuricemia and the relationship between serum uric acid and obesity: a study on Bangladeshi adults. PLoS One. (2018) 13:e0206850. doi: 10.1371/journal.pone.0206850
47. Nagao, H, Nishizawa, H, Tanaka, Y, Fukata, T, Mizushima, T, Furuno, M, et al. Hypoxanthine secretion from human adipose tissue and its increase in hypoxia. Obesity (Silver Spring). (2018) 26:1168–78. doi: 10.1002/oby.22202
48. Matsuura, F, Yamashita, S, Nakamura, T, Nishida, M, Nozaki, S, Funahashi, T, et al. Effect of visceral fat accumulation on uric acid metabolism in male obese subjects: visceral fat obesity is linked more closely to overproduction of uric acid than subcutaneous fat obesity. Metabolism. (1998) 47:929–33. doi: 10.1016/s0026-0495(98)90346-8
49. Mau, T, and Yung, R. Adipose tissue inflammation in aging. Exp Gerontol. (2018) 105:27–31. doi: 10.1016/j.exger.2017.10.014
50. Enzi, G, Gasparo, M, Biondetti, PR, Fiore, D, Semisa, M, and Zurlo, F. Subcutaneous and visceral fat distribution according to sex, age, and overweight, evaluated by computed tomography. Am J Clin Nutr. (1986) 44:739–46. doi: 10.1093/ajcn/44.6.739
51. Kosková, I, Petrásek, R, Vondra, K, Bláha, P, Skibová, J, Glagolicová, A, et al. Weight, body composition and fat distribution of Czech women in relation with reproductive phase: a cross-sectional study. Prague Med Rep. (2007) 108:13–26.
52. Zamboni, M, Armellini, F, Milani, MP, De Marchi, M, Todesco, T, Robbi, R, et al. Body fat distribution in pre-and post-menopausal women: metabolic and anthropometric variables and their inter-relationships. Int J Obes Relat Metab Disord. (1992) 16:495–504.
53. de Mutsert, R, Gast, K, Widya, R, de Koning, E, Jazet, I, Lamb, H, et al. Associations of abdominal subcutaneous and visceral fat with insulin resistance and secretion differ between men and women: the Netherlands epidemiology of obesity study. Metab Syndr Relat Disord. (2018) 16:54–63. doi: 10.1089/met.2017.0128
54. Wilson, PW. Lipids, lipases, and obesity: does race matter? Arterioscler Thromb Vasc Biol. (2000) 20:1854–6. doi: 10.1161/01.atv.20.8.1854
55. Min, J, Goodale, H, Xue, H, Brey, R, and Wang, Y. Racial-ethnic disparities in obesity and biological, behavioral, and sociocultural influences in the United States: a systematic review. Adv Nutr. (2021) 12:1137–48. doi: 10.1093/advances/nmaa162
56. R Core Team. (2023) R: A Language and Environment for Statistical Computing. R Foundation for Statistical Computing, Vienna, Austria. Available at: https://www.r-project.org/
Glossary
Keywords: hyperuricemia, visceral fat, cross-sectional survey, propensity score matching, NHANES
Citation: Xie L, Qu H, Lai D, Li J, Chen X and Xie J (2025) The association of visceral fat metabolism score with hyperuricemia—evidence from NHANES 1999–2018. Front. Nutr. 11:1497529. doi: 10.3389/fnut.2024.1497529
Edited by:
Ren-You Gan, The Hong Kong Polytechnic University, ChinaReviewed by:
Abraham Wall-Medrano, Universidad Autónoma de Ciudad Juárez, MexicoMahsa Mahjani, Shahid Beheshti University of Medical Sciences, Iran
Copyright © 2025 Xie, Qu, Lai, Li, Chen and Xie. This is an open-access article distributed under the terms of the Creative Commons Attribution License (CC BY). The use, distribution or reproduction in other forums is permitted, provided the original author(s) and the copyright owner(s) are credited and that the original publication in this journal is cited, in accordance with accepted academic practice. No use, distribution or reproduction is permitted which does not comply with these terms.
*Correspondence: Jiajia Xie, eGllamlhamlhYmF6eXlAMTYzLmNvbQ==
†ORCID: Jiajia Xie, orcid.org/0009-0001-0819-4714