- 1Department of Clinical Laboratory, Hangzhou Women’s Hospital (Hangzhou Maternity and Child Health Care Hospital), Hangzhou, Zhejiang, China
- 2Department of Psychosomatic Diseases, Hangzhou Seventh People's Hospital, Hangzhou, Zhejiang, China
- 3Department of Imaging Sciences, Zhejiang Greentown Cardiovascular Hospital, Hangzhou, Zhejiang, China
- 4School of Public Health, Hangzhou Normal University, Hangzhou Women’s Hospital (Hangzhou Maternity and Child Health Care Hospital), Hangzhou, Zhejiang, China
Objective: This study aims to investigate the relationship between serum vitamin D levels and the atherogenic index of plasma (AIP) in individuals aged 20 years and above, as well as analyze potential influencing factors.
Methods: A total of 9,637 participants aged 20 years and above from the National Health and Nutrition Examination Survey (NHANES) conducted between 2011 and 2018 were included in this study. The AIP was calculated using the formula log[triglycerides (TG)/high-density lipoprotein cholesterol (HDL-C)]. Due to the skewed distribution of serum vitamin D levels in the study population, a normal transformation was performed. Weighted multivariate linear regression models were used to assess the linear relationship between the transformed serum vitamin D levels and AIP. Subgroup analysis was conducted by stratifying the data based on age, gender, and race to evaluate the stability of the relationship between serum vitamin D levels and AIP in different populations. In addition, a smooth curve fitting and generalized linear models were employed to examine the nonlinear relationship between serum vitamin D levels and AIP.
Results: After controlling for confounding factors, the multivariate linear regression analysis revealed a negative correlation between serum vitamin D levels and AIP [β = −0.0065, 95% CI: (−0.0106, −0.0024)]. This negative correlation was significant in male participants [β = −0.0077, 95% CI: (−0.0142, −0.0011)], Non-Hispanic Black participants [β = −0.0135, 95% CI: (−0.0211, −0.0059)], as well as participants aged 40–50 [β = −0.0124, 95% CI: (−0.0226, −0.0022)] and 60–70 [β = −0.0118, 95% CI: (−0.0214, −0.0023)]. Furthermore, a nonlinear relationship and saturation effect were observed between the transformed serum vitamin D levels and AIP, with a turning point at 8.5617 nmol/L.
Conclusion: Our study revealed a significant negative correlation and saturation effect between serum vitamin D levels and AIP.
Introduction
Cardiovascular disease (CVD) remains a leading cause of morbidity and mortality worldwide (1). Atherosclerosis, characterized by the accumulation of arterial wall plaques, is a major contributor to the development of cardiovascular disease (2). Its progression is influenced by various factors, including abnormalities in lipid metabolism, chronic inflammation, and vitamin D levels (3, 4). Vitamin D is primarily obtained through sunlight exposure and diet (5). As a fat-soluble vitamin, vitamin D not only plays a role in regulating calcium and phosphate metabolism but also exhibits anti-inflammatory, immune-regulatory, and antioxidant effects, making it a multifunctional hormone with pleiotropic effects. Previous studies have shown that vitamin D deficiency may impact the occurrence and progression of atherosclerosis (6). Increasing circulating levels of 25-hydroxyvitamin D(25[OH]D), the major circulating form of vitamin D, has been found to effectively reduce the risk of hypertension, stroke, and myocardial infarction (7, 8). Dyslipidemia refers to an abnormal lipid/lipoprotein profile characterized by elevated total cholesterol (TC), triglycerides (TG), and low-density lipoprotein cholesterol (LDL-C) levels, along with decreased high-density lipoprotein cholesterol (HDL-C) levels, which is recognized as a significant risk factor for atherosclerosis and cardiovascular disease (9).
The atherogenic index of plasma (AIP) is a novel indicator calculated as the logarithm of the ratio of triglyceride (TG) to high-density lipoprotein cholesterol (HDL-C). It reflects the particle size and esterification rate of low-density lipoprotein cholesterol (LDL-C), which are related to lipoprotein lipase activity. Therefore, AIP is considered an important marker composed of TG and HDL-C, widely used for quantifying lipid levels and considered the optimal indicator for evaluating dyslipidemia and cardiovascular disease (CVD) (10, 11). Some studies have found AIP to be a significant and independent predictor of increased CVD risk, superior to traditional lipid parameters, and a potential biomarker for assessing the severity of coronary artery disease (12, 13). However, there is limited and conflicting research on the relationship between serum vitamin D levels and AIP. Some studies have reported a negative correlation between serum vitamin D levels and AIP, indicating that lower vitamin D levels are associated with higher AIP values (14). On the other hand, a study by Wang et al. (15) found a negative correlation between serum vitamin D concentrations and AIP in males but not in females. AIP values were higher in males with vitamin D deficiency compared to those with sufficient vitamin D levels. In order to investigate the relationship between vitamin D and AIP more accurately, we conducted this study.
The objective of this study was to elucidate the relationship between serum vitamin D levels and AIP in individuals aged 20 years and older, and further explore the influencing factors of this relationship. By analyzing a large sample dataset from NHANES 2011–2018, we aim to provide more reliable evidence to support the role of vitamin D in the prevention and treatment of atherosclerosis.
Materials and methods
Study population
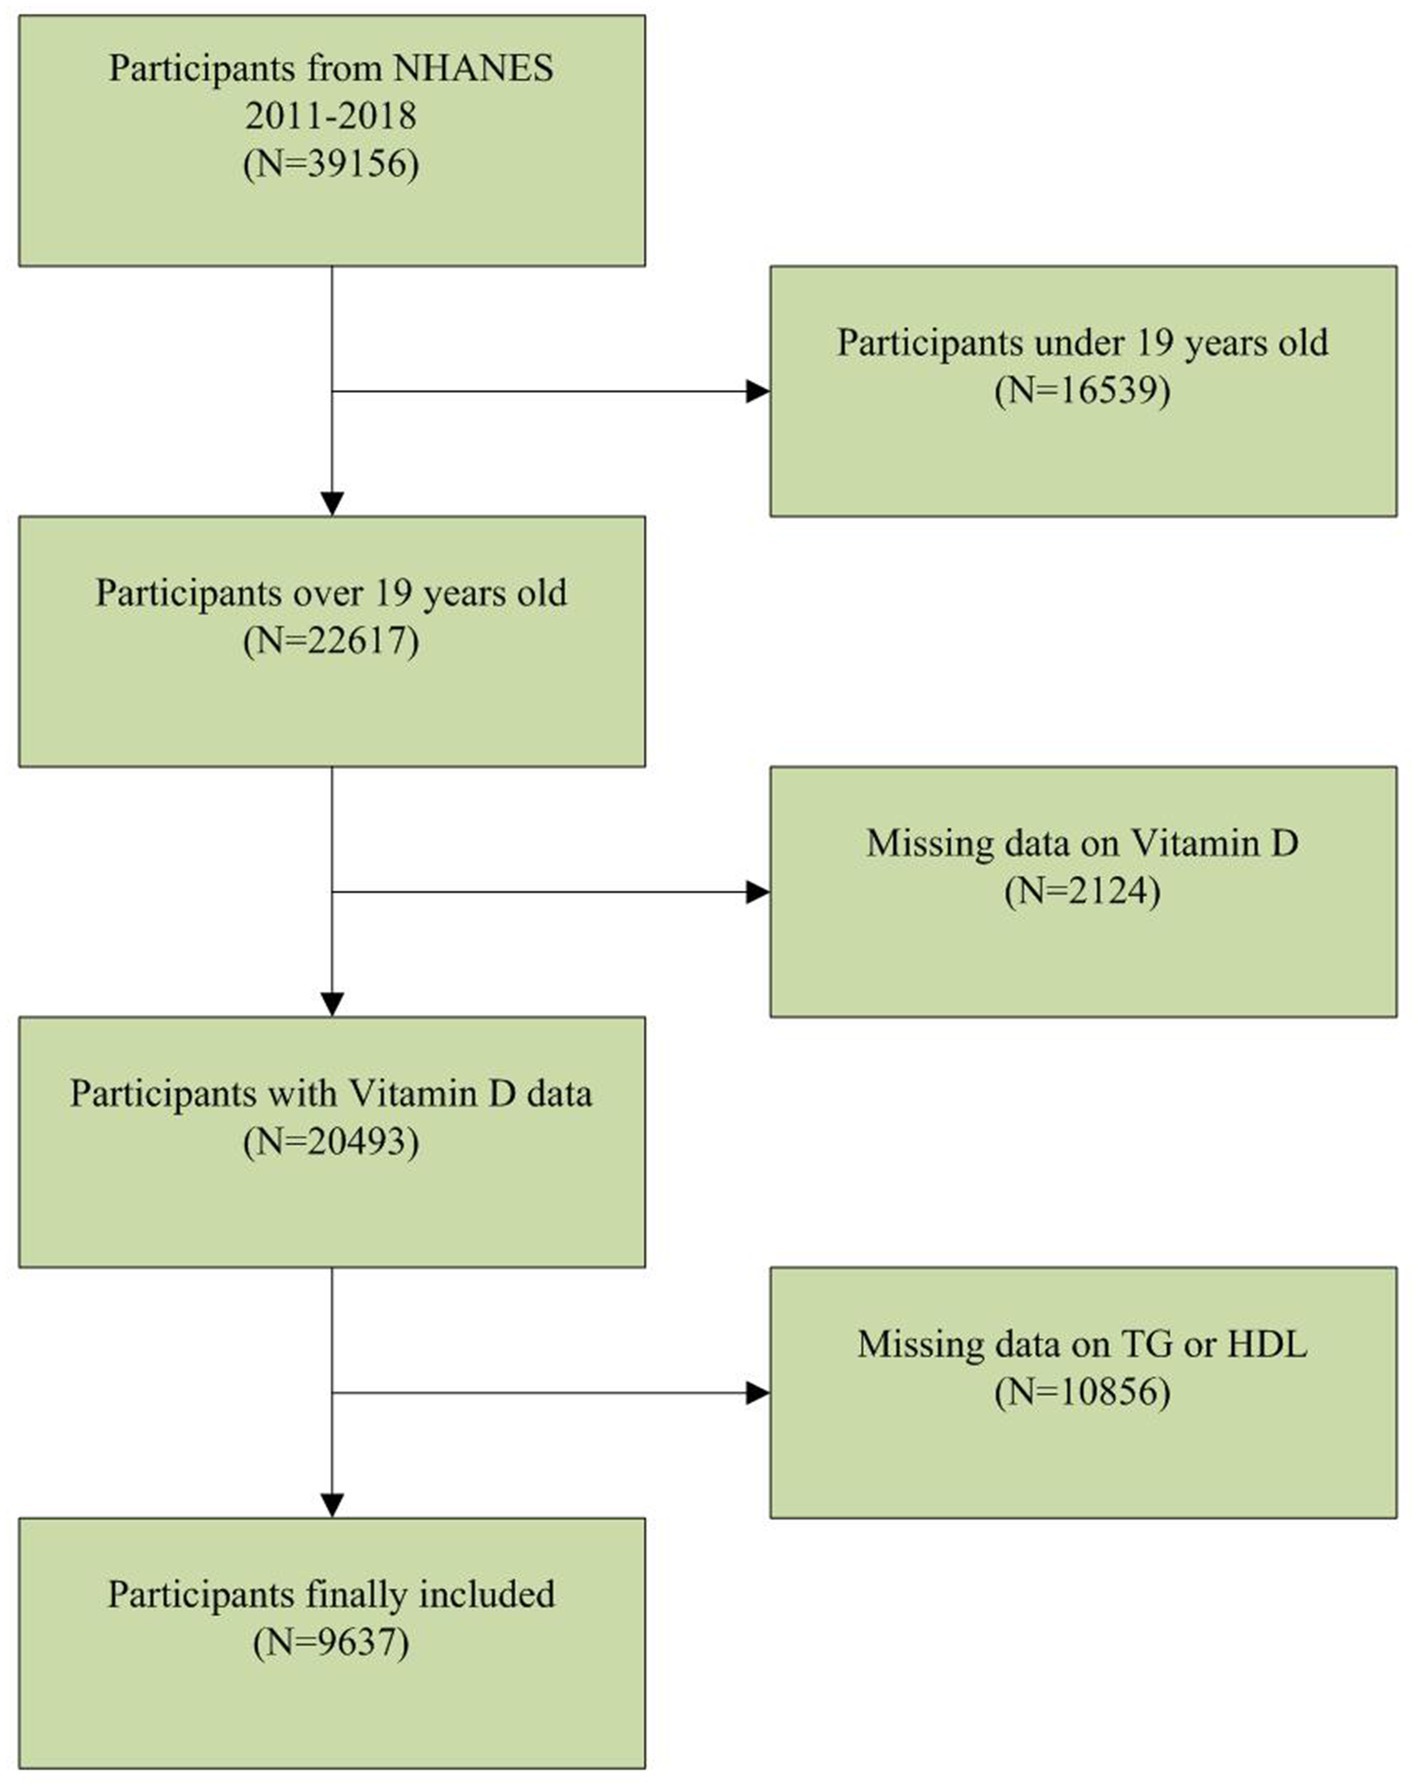
The NHANES database is a population-based nationwide survey that provides information on population nutrition and health. The NHANES database can be publicly accessed at www.cdc.gov/nchs/nhanes. Our study utilized NHANES data from 2011 to 2018. Among the 39,156 participants, there were 16,539 individuals below the age of 20, 2,124 with missing serum vitamin D data, and 10,856 with missing TG or HDL data. After applying these exclusion criteria, a total of 9,637 participants were included in the clinical analysis (Figure 1).
Study variables
The independent variable in this study is serum Vitamin D. Due to the skewed distribution of serum Vitamin D in the study population (Figure 2A), a normal transformation was applied to serum Vitamin D in the article (Figure 2B). The dependent variable is the calculated plasma atherogenic index (AIP), which is computed using the formula AIP = log (TG [mg/dL]/HDL-C [mg/dL]). The following variables were included as covariates in the clinical analysis: age, gender, race, ratio of family income to poverty (PIR), body mass index (BMI), alanine aminotransferase (ALT), aspartate aminotransferase (AST), blood urea nitrogen (BUN), serum creatinine (Scr), TC, alkaline phosphatase (ALP), Calcium (Ca), and Phosphorus (P). The examination section related to clinical and laboratory evaluations was provided by well-trained medical experts. Detailed procedures and measurement methods for each variable can be found at www.cdc.gov/nchs/nhanes.
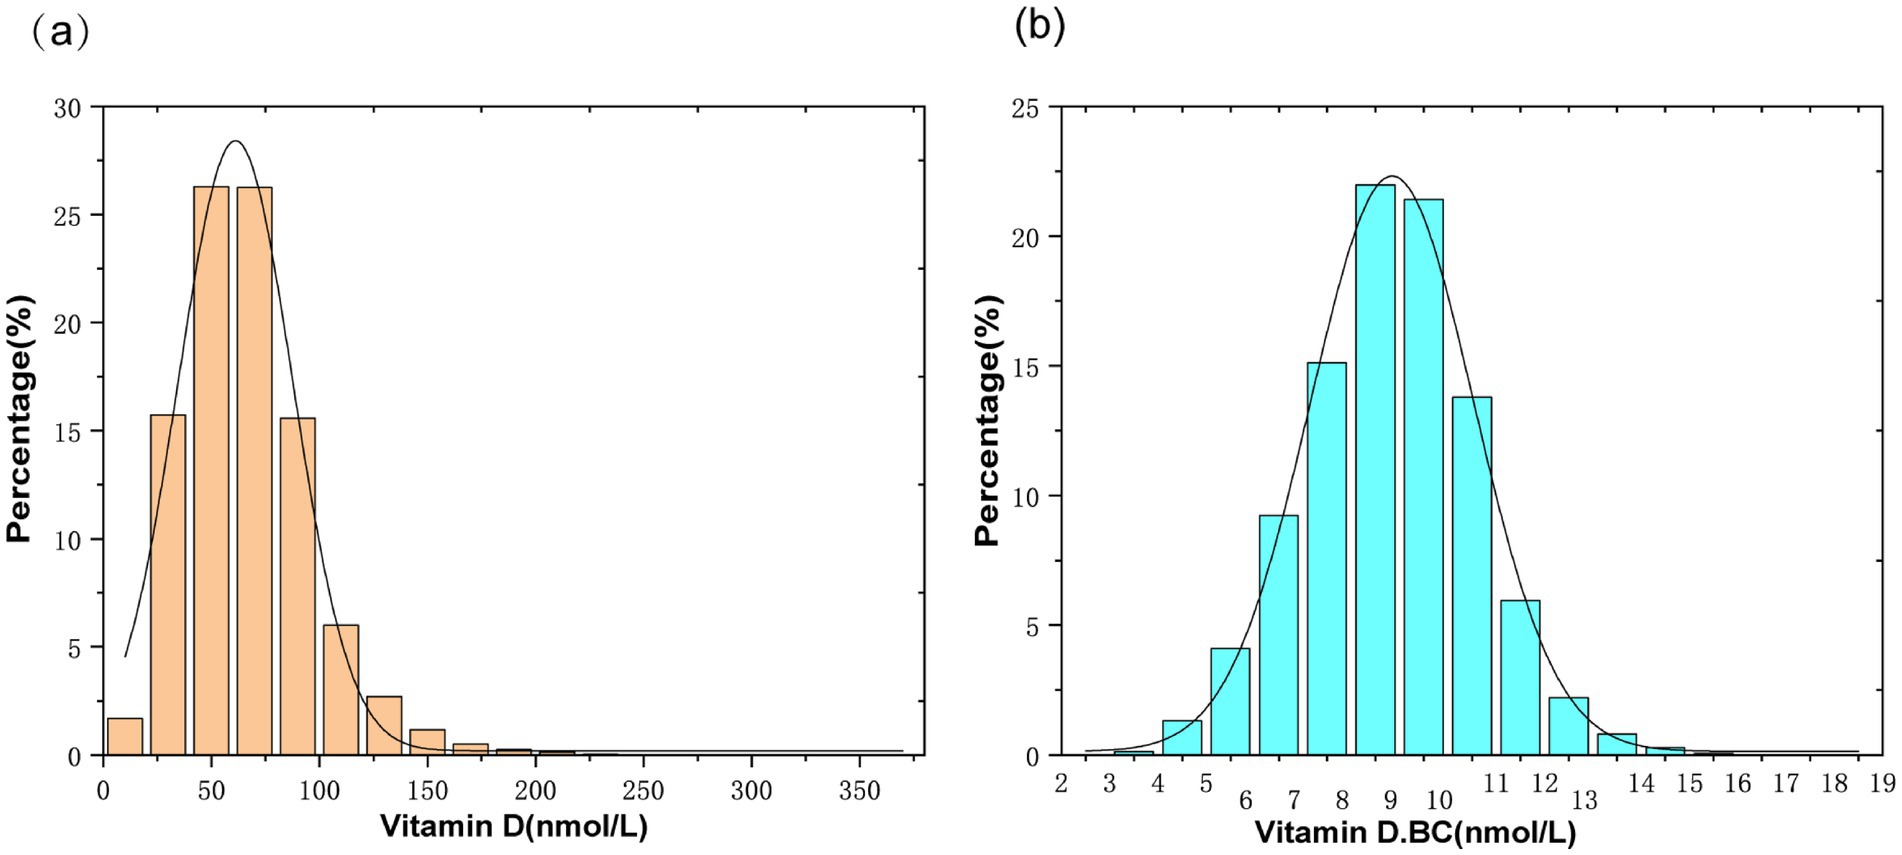
Figure 2. (A) Histogram of serum vitamin D distribution; (B) Histogram of serum vitamin D distribution after normalization transformation(Vitamin D.BC).
Statistical analysis
All analyses were conducted using the weights from the NHANES examination sample, and the baseline characteristics of all participants included in the final analysis were described as mean ± standard deviation (continuous variables) or percentage (categorical variables). A weighted multivariable linear regression model was used to assess the linear relationship between serum Vitamin D after normal transformation and AIP, and subgroup analyses were performed to evaluate the linear relationship between serum Vitamin D and AIP in different populations by stratifying for age, gender, and race. Additionally, a smoothed curve fitting and generalized linear models were employed to investigate the non-linear relationship between serum Vitamin D and AIP. The inflection point (if it existed) was calculated using a two-segment linear regression model with a recursive algorithm. A p value <0.05 was considered statistically significant. We utilized EmpowerStats (http://www.empowerstats.com, X&Y Solutions, Inc., Boston, MA) and the statistical software package R (http://www.Rproject.org, The R Foundation) for the modeling process. Frequency distribution plots for serum Vitamin D and serum Vitamin D after normal transformation were generated using Origin (version: 2024).
Results
Baseline characteristics of participants
After applying the inclusion and exclusion criteria, a total of 9,637 participants met the criteria. The population characteristics, weighted according to the quartiles of serum Vitamin D after normal transformation (Q1: 6.65 ± 0.82 nmol/L; Q2: 8.31 ± 0.34 nmol/L; Q3: 9.40 ± 0.32 nmol/L; Q4: 10.99 ± 0.93 nmol/L), are presented in Table 1. Significant differences were observed in age, gender, race, PIR, BMI, ALT, BUN, Scr, TC, TG, HDL, LDL, ALP, and Ca among different groups based on serum Vitamin D quartiles (Q1–Q4). Compared to the lowest quartile, individuals in the highest quartile were more likely to be older, female, have a higher PIR, a higher proportion of Non-Hispanic Whites, and higher levels of BUN, Scr, TC, HDL, LDL, and Ca. Conversely, they exhibited lower BMI, ALT, TG, and ALP levels (Table 1).
Association between serum vitamin D and AIP
Table 2 presents the relationship between serum Vitamin D and Atherogenic Index of Plasma (AIP). Three weighted multivariate linear regression models were constructed. In the unadjusted model, there was a negative correlation between serum Vitamin D and AIP [β = −0.0169, 95% CI: (−0.0209, −0.0129)]. After controlling for confounding factors, this negative correlation persisted in Model 2 [β = −0.0258, 95% CI: (−0.0301, −0.0215)] and Model 3 [β = −0.0065, 95% CI: (−0.0106, −0.0024)]. When serum Vitamin D was converted from a continuous variable to a categorical variable (quartiles), individuals in the highest quartile had an AIP that was 0.0266 lower than those in the lowest quartile.
Subgroup analysis
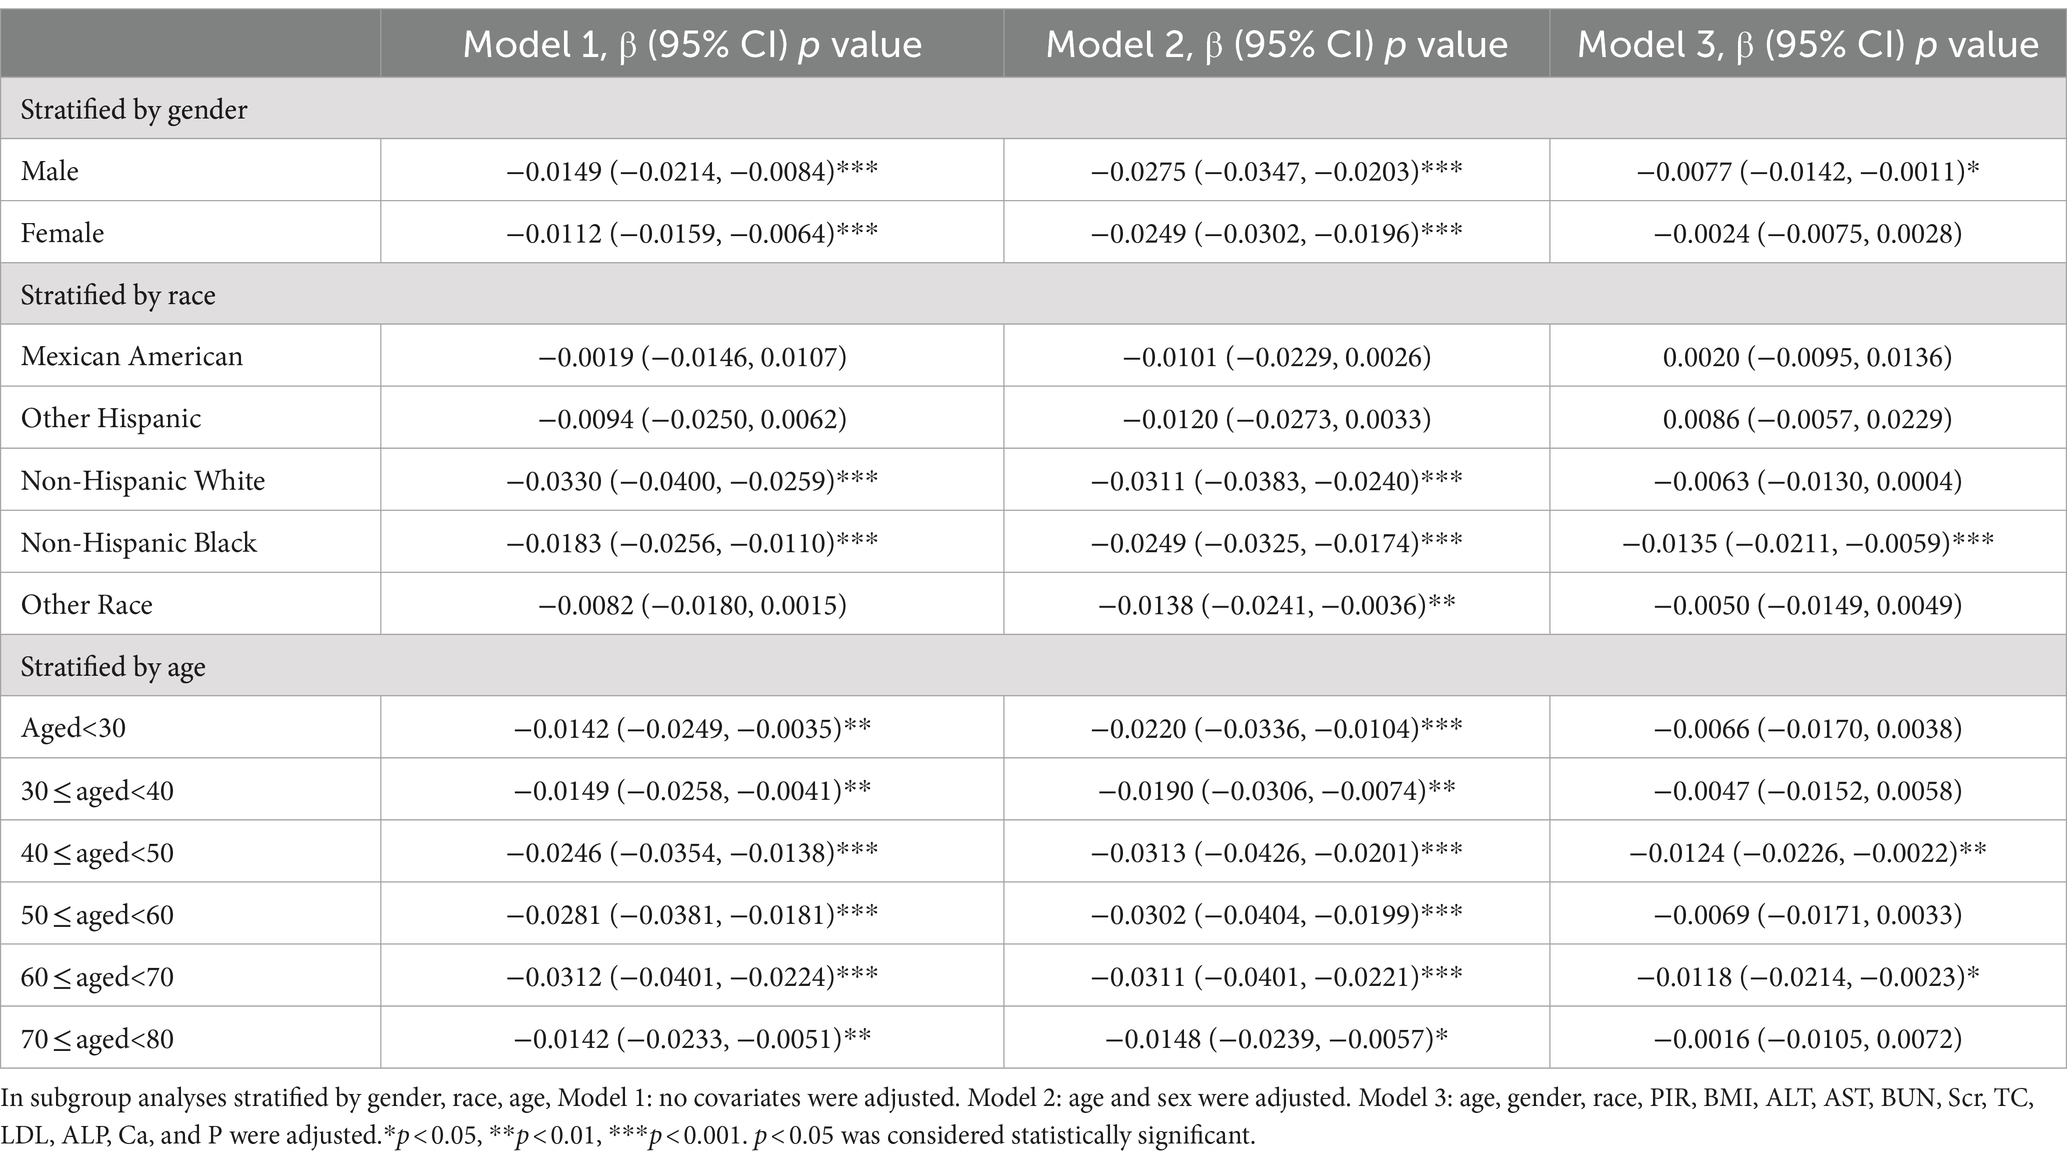
Subgroup analyses were performed in this study to assess the stability of the relationship between Atherogenic Index of Plasma (AIP) and serum Vitamin D across different population backgrounds. The results showed a significant negative correlation between serum Vitamin D and AIP among male participants [−0.0077 (−0.0142, −0.0011)]. When stratified by race, Non-Hispanic Black participants exhibited a significant negative correlation between serum Vitamin D and AIP [−0.0135 (−0.0211, −0.0059)]. Among different age groups, participants aged 40–50 years [−0.0124 (−0.0226, −0.0022)] and 60–70 years [−0.0118 (−0.0214, −0.0023)] demonstrated a significant negative correlation between serum Vitamin D and AIP. Other factors did not significantly influence the relationship between serum Vitamin D and AIP (Table 3).
Non-linearity and saturation effect analysis between serum vitamin D and AIP
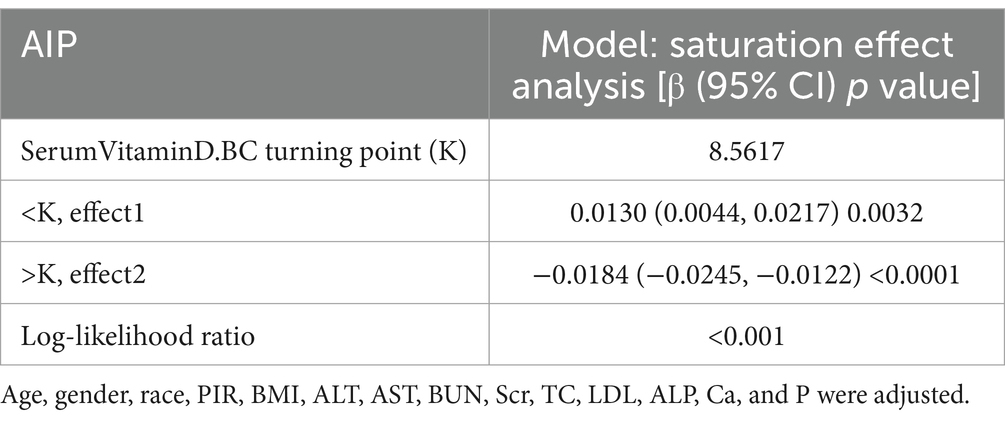
A smoothed curve fitting was used to describe the non-linear association and saturation phenomenon between serum Vitamin D and Atherogenic Index of Plasma (AIP) (Figure 3). The results showed that the saturation point for the relationship between serum Vitamin D (after undergoing a normal transformation) and AIP in all participants was 8.5617 nmol/L. When the transformed serum Vitamin D was below 8.5617 nmol/L, the effect size was 0.0130; whereas when the transformed serum Vitamin D exceeded 8.5617 nmol/L, the effect size changed to −0.0184 (Table 4).
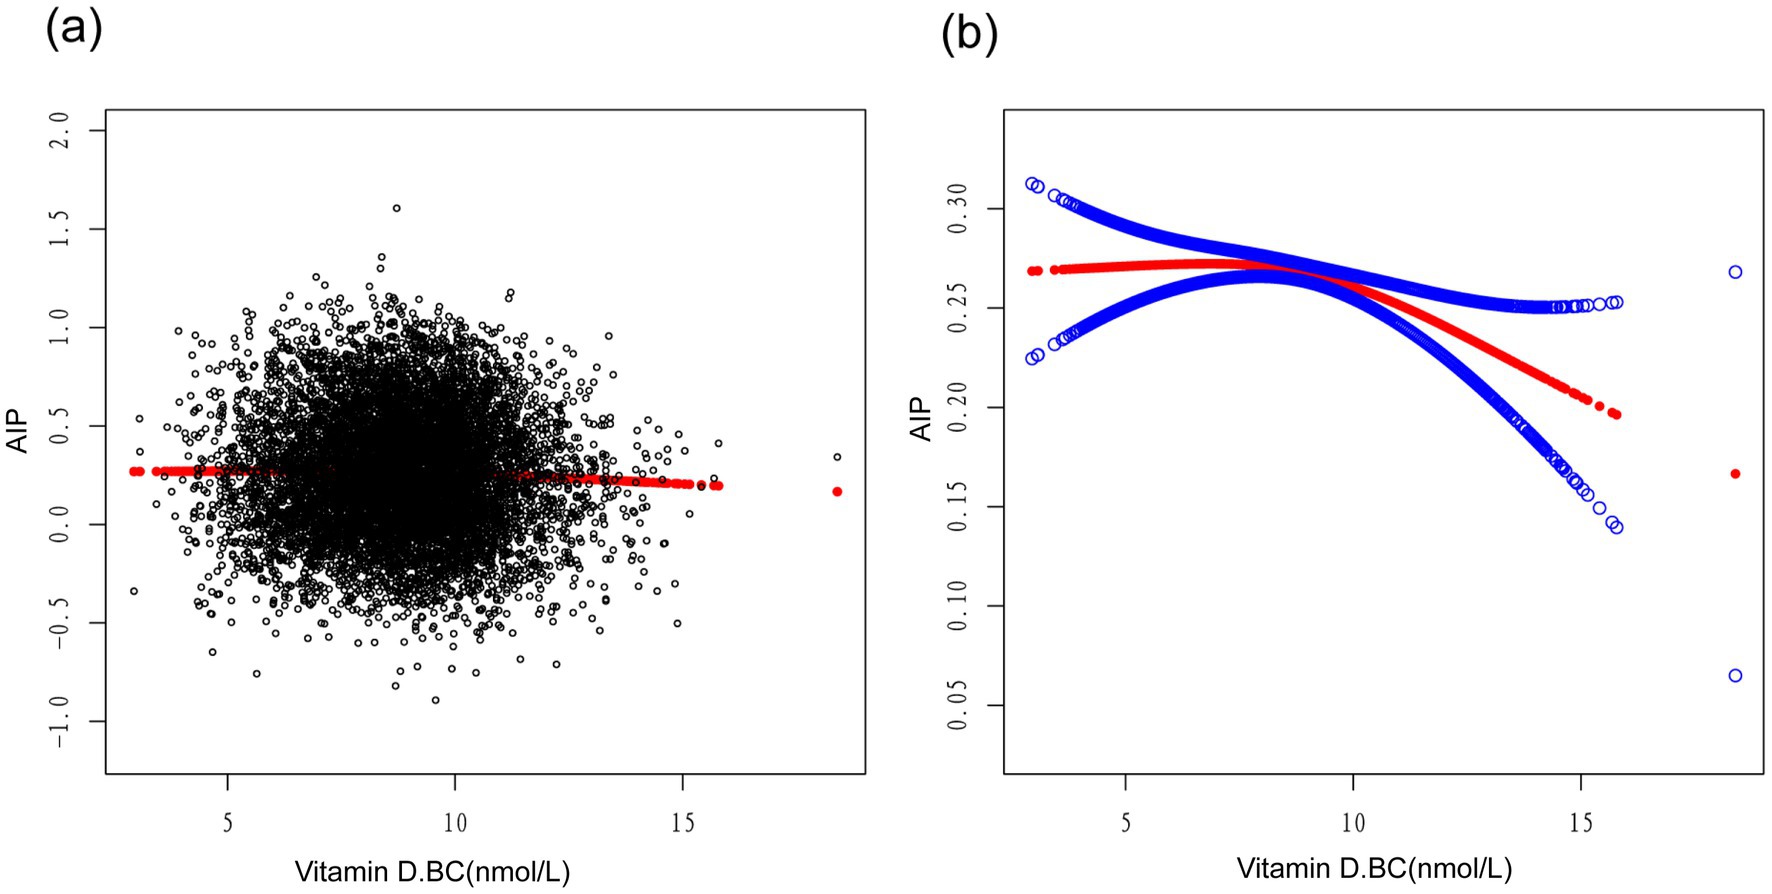
Figure 3. Association between vitamin D.BC and AIP (The solid red line represents the smooth curve fit between variables. Blue bands represent the 95% confidence interval from the fit).
Discussion
In our study, we found a negative correlation between serum vitamin D levels and AIP. Further subgroup analysis revealed significant associations between serum vitamin D levels and AIP in male participants, non-Hispanic black individuals, and those aged between 40–50 and 60–70 years. Interestingly, we observed an inverted L-shaped relationship between logarithmically transformed serum vitamin D levels and AIP, with a turning point at 8.5617 nmol/L.
Cardiovascular disease (CVD) poses a significant threat to human health, with high global incidence, mortality, and disability rates (16). AIP has been identified as one of the strongest biomarkers for predicting CVD risk (17). AIP reflects the balance between pro-atherogenic lipids such as triglycerides and anti-atherogenic lipids like high-density lipoprotein cholesterol (18). It can serve as an adjunct to individual lipid profiles. AIP is a better determinant of HDL-C particle fractionation than conventional lipid parameters (19, 20). Studies have shown that higher AIP values are associated with an increased risk of coronary artery disease (CAD) (21). In recent years, an increasing number of studies have demonstrated an association between low 25(OH)D levels and increased cardiovascular disease risk and all-cause mortality (22, 23). Ge et al. (24) found in their study among rural Chinese population that serum 25(OH)D3 concentration was correlated with lipid levels, with varying associations between individuals with normal lipid levels and those with abnormal lipid levels; as serum 25(OH)D3 levels increased, the incidence of lipid abnormalities decreased. A cross-sectional study conducted among middle-aged and elderly Chinese population found a positive correlation between vitamin D deficiency and abnormal lipid profiles and AIP (25). Our study also revealed similar findings in individuals aged 20 and above.
In this study, we found a significant correlation between serum vitamin D levels and AIP. After adjusting for confounding factors, we observed a significant negative correlation between serum vitamin D levels and AIP in males. However, in females, our results showed a p value greater than 0.05, indicating no significant relationship between serum vitamin D levels and AIP after adjusting for confounding factors. This finding is consistent with some previous studies. Wang et al. (15) reported a negative correlation between serum 25(OH)D concentration and AIP in males but not in females. Furthermore, males with vitamin D deficiency had higher AIP values compared to males with sufficient vitamin D. Naganuma et al. (26) reported that low serum 25(OH)D levels were associated with increased atherosclerosis risk in adolescent boys but not in girls. Several factors may contribute to these gender-specific differences. First, it could be related to hormonal changes. Hormones have profound effects on lipid metabolism (27), which could have different impacts on the relationship between vitamin D and AIP in males and females. Sex hormones play an important role in the regulation of lipid metabolism. A sex-stratified meta-analysis identified lipid-related loci showing sex-biased effects on both autosomes and the X chromosome, with associations with the pleiotropy of sex hormones, highlighting the important role of sex hormone regulation in lipid metabolism (28). These hormones may interact with the vitamin D signaling pathway, leading to gender-specific effects on AIP. Secondly, vitamin D signaling has multiple effects outside the skeletal system, including regulation of cell proliferation, immune and muscle function, skin differentiation and reproduction, as well as vascular and metabolic properties (29). These effects may manifest differently in males and females, resulting in differential associations between serum vitamin D levels and AIP in both sexes. Lastly, there are differences in dietary patterns, exercise habits, sunlight exposure, and other factors between males and females, which may influence the synthesis and absorption of vitamin D. Therefore, these behavioral and lifestyle differences between male and female populations may modulate the relationship between serum vitamin D levels and AIP.
We conducted a stratified analysis based on race and found a significant negative correlation between serum vitamin D and AIP among non-Hispanic Black individuals, while no such phenomenon was observed in other races. This may be related to genetic variations that affect vitamin D metabolism. In a cross-sectional study of multi-ethnic populations with atherosclerosis (MESA), significant racial differences were found in vitamin D metabolism indicators. Compared to Black participants, White participants had significantly higher concentrations of 25-hydroxyvitamin D in their serum. The ratios of circulating vitamin D metabolites indicated lower CYP27B1 activity and higher CYP24A1 activity among White participants. Differences in vitamin D-binding globulin haplotypes were also observed (30). These genetic variations may lead to different ways of metabolizing and utilizing vitamin D among non-Hispanic Black participants compared to other races. Therefore, the relationship between vitamin D and AIP may exhibit different patterns.
When stratified by age, we found a significant negative correlation between serum vitamin D levels and plasma atherogenic index of plasma (AIP) among participants aged 40–50 and 60–70. With increasing age, there are various changes in the metabolism and activity of vitamin D. The ability of the skin to produce vitamin D3 decreases with age, reducing by 13% every decade (31). The resistance of the intestines to 1,25-dihydroxyvitamin D increases, affecting calcium absorption in the gut. Among various organs involved in calcium metabolism, the number of vitamin D receptors decreases with age, and the activity of 1α-hydroxylase decreases mainly due to declining kidney function, leading to reduced activation of vitamin D (32). Vitamin D deficiency is common in the elderly population as a result. Age-related factors also include changes in hormone and bone morphogenetic protein levels. In conclusion, this significant negative correlation may be attributed to age-related changes in vitamin D metabolism, cumulative effects of vitamin D deficiency, alterations in lipid metabolism, and complex interactions with other age-related factors (33). Further research is needed to understand the exact mechanisms and clinical significance of this age-specific relationship.
In our study, we employed a smooth curve fitting to describe the non-linear association and saturation phenomenon between serum vitamin D and AIP. The saturation effect value of 8.5617 nmol/L may have physiological significance in the relationship between vitamin D and AIP. When the serum vitamin D level, transformed into a normal distribution, is below this threshold, its regulatory effect on AIP is limited, while beyond this threshold, vitamin D may exert a stronger negative regulatory effect. The interpretation of these findings may also need to consider the metabolism and mechanisms of action of vitamin D. Vitamin D mediates its biological effects in cells by binding to vitamin D receptors. The saturation phenomenon may reflect the saturation or regulatory mechanism of these receptors, resulting in a non-linear relationship and the manifestation of a saturation effect for vitamin D. Similar studies have found a U-shaped association between serum 25(OH)D levels and CVD risk, suggesting a non-linear relationship between vitamin D and CVD prevalence (34). It should be noted that although we observed the saturation effect between serum vitamin D and AIP, further research is still needed to determine the optimal level of vitamin D. An animal model experiment showed that high-dose vitamin D, as an adjunct to simvastatin therapy, was superior to omega-3 levels in improving TG, HDL, and AIP (35). Additionally, maintaining an appropriate serum level of vitamin D appears to be crucial for calcium homeostasis and cardiovascular risk, blood pressure regulation, stroke incidence, metabolic syndrome, and peripheral arterial disease. Vitamin D exerts beneficial effects on the cardiovascular system by reducing the activity of the renin-angiotensin-aldosterone system (RAAS), lowering blood pressure, and possessing anti-inflammatory, anti-proliferative, anti-hypertensive, anti-fibrotic, anti-diabetic, and anti-thrombotic properties (36). These potential benefits further underscore the significance of determining the optimal level of vitamin D and suggest that vitamin D may play a vital role in the prevention and treatment of cardiovascular diseases.
The investigation of the non-linear association between vitamin D and AIP may contribute to a better understanding of the biological effects of vitamin D and its impact on cardiovascular health. One of the major strengths of this study was the utilization of the NHANES database, which provided a large representative sample of the general population. By employing rigorous statistical analysis and adjusting for confounding factors, we were able to establish a strong association between serum vitamin D levels and AIP. However, there were several limitations to our study. Firstly, the cross-sectional design of NHANES limited our ability to establish causality. Secondly, reliance on self-reported data may have introduced recall bias. Thirdly, our findings may not be generalizable to populations beyond the NHANES sample. Future prospective studies and clinical trials are necessary to confirm our findings and explore underlying mechanisms.
Conclusion
In conclusion, our study uncovered a negative correlation between serum vitamin D levels and AIP, suggesting a potential protective role against atherosclerosis and cardiovascular diseases. Subgroup analyses stratified by gender, race, and age revealed interesting variations in the associations. These findings highlight the significance of optimizing vitamin D status as a prospective preventive strategy for cardiovascular diseases, including atherosclerosis. Further research, including prospective studies and clinical trials, is warranted to validate our findings and elucidate the underlying mechanisms.
Data availability statement
Publicly available datasets were analyzed in this study. This data can be found here: www.cdc.gov/nchs/nhanes.
Ethics statement
The studies involving humans were approved by Board of the National Center for Health Statistics. The studies were conducted in accordance with the local legislation and institutional requirements. The human samples used in this study were acquired from Publicly available datasets were analyzed in this study. This data can be found here: www.cdc.gov/nchs/nhanes. Written informed consent for participation was not required from the participants or the participants’ legal guardians/next of kin in accordance with the national legislation and institutional requirements.
Author contributions
TH: Data curation, Formal analysis, Methodology, Writing – original draft. YZ: Conceptualization, Methodology, Writing – review & editing. ZC: Formal analysis, Writing – review & editing. JS: Formal analysis, Supervision, Validation, Writing – review & editing.
Funding
The author(s) declare that financial support was received for the research, authorship, and/or publication of this article. The current research was funded by 2022 Postgraduate Research and Innovation Advancement Project at Hangzhou Normal University (2022HSDYJSKY010), 2022 Hangzhou Municipal Special Science and Technology Project for supporting the Development of Biomedical, Pharmaceutical, and Health Industries (8th phase) (2022WJC276 and 2022WJC159), and 2023 Zhejiang Provincial Traditional Chinese Medicine Science and Technology Plan (2023ZL582).
Conflict of interest
The authors declare that the research was conducted in the absence of any commercial or financial relationships that could be construed as a potential conflict of interest.
Publisher’s note
All claims expressed in this article are solely those of the authors and do not necessarily represent those of their affiliated organizations, or those of the publisher, the editors and the reviewers. Any product that may be evaluated in this article, or claim that may be made by its manufacturer, is not guaranteed or endorsed by the publisher.
References
1. Patoulias, D, Stavropoulos, K, Imprialos, K, Athyros, V, Grassos, H, Doumas, M, et al. Inflammatory markers in cardiovascular disease; lessons learned and future perspectives. Curr Vasc Pharmacol. (2021) 19:323–42. doi: 10.2174/1570161118666200318104434
2. Faa, G, Cau, R, Ravarino, A, Canino, A, Van Eyken, P, Fraschini, M, et al. Lessons from autopsy: Topographical variability of atherosclerosis plaques. J Public Health Res. (2024) 13:22799036241249659. doi: 10.1177/22799036241249659
3. Rafieian-Kopaei, M, Setorki, M, Doudi, M, Baradaran, A, and Nasri, H. Atherosclerosis: process, indicators, risk factors and new hopes. Int J Prev Med. (2014) 5:927–46.
4. Bennett, AL, and Lavie, CJ. Vitamin D Metabolism and the Implications for Atherosclerosis. Adv Exp Med Biol. (2017) 996:185–92. doi: 10.1007/978-3-319-56017-5_15
5. Tuncel, G, Temel, SG, and Ergoren, MC. Strong association between VDR FokI (rs2228570) gene variant and serum vitamin D levels in Turkish Cypriots. Mol Biol Rep. (2019) 46:3349–55. doi: 10.1007/s11033-019-04796-6
6. Khanolkar, S, Hirani, S, Mishra, A, Vardhan, S, Hirani, S, Prasad, R, et al. Exploring the role of vitamin D in atherosclerosis and its impact on cardiovascular events: a comprehensive review. Cureus. (2023) 15:e42470. doi: 10.7759/cureus.42470
7. Li, YC, Kong, J, Wei, M, Chen, ZF, Liu, SQ, and Cao, LP. 1,25-Dihydroxyvitamin D(3) is a negative endocrine regulator of the renin-angiotensin system. J Clin Invest. (2002) 110:229–38. doi: 10.1172/JCI0215219
8. Lee, JH, O'Keefe, JH, Bell, D, Hensrud, DD, and Holick, MF. Vitamin D deficiency an important, common, and easily treatable cardiovascular risk factor? J Am Coll Cardiol. (2008) 52:1949–56. doi: 10.1016/j.jacc.2008.08.050
9. Polkowska, A, Głowińska-Olszewska, B, Tobiaszewska, M, and Bossowski, A. Risk factors for cardiovascular disease in children with type 1 diabetes in 2000-2010 in Podlasie Province. Pediatr Endocrinol Diabetes Metab. (2015) 20:47–54. doi: 10.18544/PEDM-20.02.0002
10. Dobiásová, M, and Frohlich, J. The plasma parameter log (TG/HDL-C) as an atherogenic index: correlation with lipoprotein particle size and esterification rate in apoB-lipoprotein-depleted plasma (FER(HDL)). Clin Biochem. (2001) 34:583–8. doi: 10.1016/S0009-9120(01)00263-6
11. Zhu, X, Yu, L, Zhou, H, Ma, Q, Zhou, X, Lei, T, et al. Atherogenic index of plasma is a novel and better biomarker associated with obesity: a population-based cross-sectional study in China. Lipids Health Dis. (2018) 17:37. doi: 10.1186/s12944-018-0686-8
12. Çelik, E, Çora, AR, and Karadem, KB. The effect of untraditional lipid parameters in the development of coronary artery disease: atherogenic index of plasma, atherogenic coefficient and lipoprotein combined index. J Saudi Heart Assoc. (2021) 33:244–50. doi: 10.37616/2212-5043.1266
13. Li, Y, Feng, Y, Li, S, Ma, Y, Lin, J, Wan, J, et al. The atherogenic index of plasma (AIP) is a predictor for the severity of coronary artery disease. Front Cardiovasc Med. (2023) 10:1140215. doi: 10.3389/fcvm.2023.1140215
14. Izadi, A, Aliasghari, F, Gargari, BP, and Ebrahimi, S. Strong association between serum Vitamin D and Vaspin Levels, AIP, VAI and liver enzymes in NAFLD patients. Int J Vitam Nutr Res. (2020) 90:59–66. doi: 10.1024/0300-9831/a000443
15. Wang, Y, Si, S, Liu, J, Wang, Z, Jia, H, Feng, K, et al. The associations of serum lipids with vitamin D status. PLoS One. (2016) 11:e0165157. doi: 10.1371/journal.pone.0165157
16. Neshat, S, Rezaei, A, Farid, A, Javanshir, S, Dehghan Niri, F, Daneii, P, et al. Cardiovascular diseases risk predictors: ABO blood groups in a different role. Cardiol Rev. (2024) 32:174–9. doi: 10.1097/CRD.0000000000000463
17. Bo, MS, Cheah, WL, Lwin, S, Moe Nwe, T, Win, TT, and Aung, M. Understanding the relationship between atherogenic index of plasma and cardiovascular disease risk factors among staff of an University in Malaysia. J Nutr Metab. (2018) 2018:1–6. doi: 10.1155/2018/7027624
18. Viktorinova, A, Fabryova, L, Malickova, D, Choudhury, S, and Krizko, M. Clinical utility of the logarithmically transformed ratio of triglycerides-to-high-density lipoprotein cholesterol and its relationship with other atherosclerosis-related lipid factors in type 2 diabetes. Metab Syndr Relat Disord. (2021) 19:205–12. doi: 10.1089/met.2020.0087
19. Dobiásová, M, Urbanová, Z, and Samánek, M. Relations between particle size of HDL and LDL lipoproteins and cholesterol esterification rate. Physiol Res. (2005) 54:159–65. doi: 10.33549/physiolres.930565
20. Tan, MH, Johns, D, and Glazer, NB. Pioglitazone reduces atherogenic index of plasma in patients with type 2 diabetes. Clin Chem. (2004) 50:1184–8. doi: 10.1373/clinchem.2004.031757
21. Ulloque-Badaracco, JR, Hernandez-Bustamante, EA, Alarcon-Braga, EA, Mosquera-Rojas, MD, Campos-Aspajo, A, Salazar-Valdivia, FE, et al. Atherogenic index of plasma and coronary artery disease: a systematic review. Open Med. (2022) 17:1915–26. doi: 10.1515/med-2022-0590
22. Perna, L, Schöttker, B, Holleczek, B, and Brenner, H. Serum 25-hydroxyvitamin D and incidence of fatal and nonfatal cardiovascular events: a prospective study with repeated measurements. J Clin Endocrinol Metab. (2013) 98:4908–15. doi: 10.1210/jc.2013-2424
23. Wang, TJ, Pencina, MJ, Booth, SL, Jacques, PF, Ingelsson, E, Lanier, K, et al. Vitamin D deficiency and risk of cardiovascular disease. Circulation. (2008) 117:503–11. doi: 10.1161/CIRCULATIONAHA.107.706127
24. Ge, H, Sun, H, Wang, T, Liu, X, Li, X, Yu, F, et al. The association between serum 25-hydroxyvitamin D3 concentration and serum lipids in the rural population of China. Lipids Health Dis. (2017) 16:215. doi: 10.1186/s12944-017-0603-6
25. Huang, F, Liu, Q, Zhang, Q, Wan, Z, Hu, L, Xu, R, et al. Sex-specific association between serum vitamin D status and lipid profiles: a cross-sectional study of a middle-aged and elderly Chinese population. J Nutr Sci Vitaminol (Tokyo). (2020) 66:105–13. doi: 10.3177/jnsv.66.105
26. Naganuma, J, Koyama, S, Arisaka, O, and Yoshihara, S. Low serum 25-hydroxyvitamin D level is associated with obesity and atherogenesis in adolescent boys. Ann Pediatr Endocrinol Metab. (2022) 27:30–6. doi: 10.6065/apem.2142112.056
27. Gerdts, E, and Regitz-Zagrosek, V. Sex differences in cardiometabolic disorders. Nat Med. (2019) 25:1657–66. doi: 10.1038/s41591-019-0643-8
28. Kanoni, S, Graham, SE, Wang, Y, Surakka, I, Ramdas, S, Zhu, X, et al. Implicating genes, pleiotropy, and sexual dimorphism at blood lipid loci through multi-ancestry meta-analysis. Genome Biol. (2022) 23:268. doi: 10.1186/s13059-022-02837-1
29. Bouillon, R, Marcocci, C, Carmeliet, G, Bikle, D, White, JH, Dawson-Hughes, B, et al. Skeletal and extraskeletal actions of vitamin D: current evidence and outstanding questions. Endocr Rev. (2019) 40:1109–51. doi: 10.1210/er.2018-00126
30. Hsu, S, Hoofnagle, AN, Gupta, DK, Gutierrez, OM, Peralta, CA, Shea, S, et al. Race, ancestry, and vitamin D metabolism: the multi-ethnic study of atherosclerosis. J Clin Endocrinol Metab. (2020) 105:e4337–50. doi: 10.1210/clinem/dgaa612
31. Wacker, M, and Holick, MF. Sunlight and Vitamin D: A global perspective for health. Dermatoendocrinol. (2013) 5:51–108. doi: 10.4161/derm.24494
32. de Jongh, RT, van Schoor, NM, and Lips, P. Changes in vitamin D endocrinology during aging in adults. Mol Cell Endocrinol. (2017) 453:144–50. doi: 10.1016/j.mce.2017.06.005
33. Cappola, AR, Auchus, RJ, El-Hajj Fuleihan, G, Handelsman, DJ, Kalyani, RR, McClung, M, et al. Hormones and aging: an endocrine society scientific statement. J Clin Endocrinol Metab. (2023) 108:1835–74. doi: 10.1210/clinem/dgad225
34. Wang, T, Sun, H, Ge, H, Liu, X, Yu, F, Han, H, et al. Association between vitamin D and risk of cardiovascular disease in Chinese rural population. PLoS One. (2019) 14:e0217311. doi: 10.1371/journal.pone.0217311
35. Lianto, D, Djabir, YY, Mustamu, BO, and Arsyad, A. Vitamin D was superior to omega-3 as a simvastatin adjuvant in improving blood lipids and atherogenic index in type-I dyslipidemic rats. Turk J Pharm Sci. (2024) 20:390–6. doi: 10.4274/tjps.galenos.2023.56958
Keywords: vitamin D, arteriosclerosis index of plasma, NHANES, cardiovascular disease, saturation effect
Citation: Hu T, Zhang Y, Chen Z and Su J (2024) Relationship between serum vitamin D levels and the atherogenic index of plasma: a study based on NHANES database 2011–2018. Front. Nutr. 11:1468284. doi: 10.3389/fnut.2024.1468284
Edited by:
Cristina Vassalle, Gabriele Monasterio Tuscany Foundation (CNR), ItalyReviewed by:
Ioana Mozos, Victor Babes University of Medicine and Pharmacy, RomaniaOtilia Marginean, Victor Babes University of Medicine and Pharmacy, Romania
Copyright © 2024 Hu, Zhang, Chen and Su. This is an open-access article distributed under the terms of the Creative Commons Attribution License (CC BY). The use, distribution or reproduction in other forums is permitted, provided the original author(s) and the copyright owner(s) are credited and that the original publication in this journal is cited, in accordance with accepted academic practice. No use, distribution or reproduction is permitted which does not comply with these terms.
*Correspondence: Jun Su, anVuanVuc3VAMTYzLmNvbQ==
 Tingting Hu
 Ying Zhang2