- 1The Fourth Affiliated Hospital of Guangzhou Medical University, Guangzhou, China
- 2Longhu Street Community Health Service Center, Guangzhou, China
- 3Shitan Town Sanjiang Health Center, Guangzhou, China
Background: An innovative way to quantify obesity that appropriately captures levels of visceral and body fat is the Body Roundness Index (BRI). The purpose of this study is to look at the relationship between BRI and osteoporosis (OP) in adult Americans.
Methods: This study utilized data from the National Health and Nutrition Examination Survey (NHANES) collected between 2007 and 2018. NHANES is a research program designed to assess the health and nutritional status of adults and children in the United States. It conducts surveys focusing on various populations and health-related topics. Logistic regression analysis was employed to investigate the relationship between BRI and OP, adjusting for various covariates. BRI was categorized into four levels to further explore the association trends between different BRI levels and OP, enhancing the robustness of the results. Using restricted cubic spline (RCS) analysis, the dose–response relationship between BRI and OP was illustrated. Subgroup analyses were also carried out to evaluate the consistency and robustness of the findings.
Results: This study included 8,899 participants aged 50 years and older, among whom 763 had OP. BRI and the prevalence of OP were inversely correlated in the fully adjusted model (OR = 0.79, 95% CI: 0.69–0.86). The prevalence of OP considerably reduced with higher BRI levels when BRI was converted from a continuous to a categorical variable in comparison to the lowest BRI quartile. RCS analysis revealed an L-shaped negative correlation between BRI and OP prevalence, with a threshold effect analysis identifying a breakpoint at BRI = 5.29. Each unit increase in BRI to the left of this breakpoint was linked to a 36% decrease in the probability of OP (OR = 0.64, 95% CI: 0.57–0.72). Based on stratified factor subgroup analyses, it was shown that the negative correlation between BRI and OP persisted.
Conclusion: In a large, representative sample of American adults, this study identified a significant negative correlation between BRI and the prevalence of OP. Specifically, as BRI increases, the prevalence of osteoporosis decreases. Maintaining an appropriate and healthy BRI level may play a critical role in the prevention of osteoporosis. Therefore, regular monitoring of BRI and the adoption of appropriate health measures are essential for reducing the risk of osteoporosis.
1 Introduction
Reduced bone mass, degradation of the microstructure of the bone, increased fragility of the bone, and an increased risk of fractures are the hallmarks of osteoporosis (OP), a systemic skeletal disease (1, 2). OP is particularly prevalent among elderly postmenopausal women, primarily due to estrogen deficiency (3), which leads to decreased bone density and subsequently reduced mechanical strength of bones, making them prone to fractures (4). An estimated 10 million people in the US have OP (5), and an additional 43 million people have inadequate bone density, according to study estimates (6). With the aging population, the direct annual cost of OP is projected to reach $25.3 billion by 2025 (7). OP not only significantly increases the risk of fractures but also leads to a marked decline in quality of life (8), increased mortality, and substantially higher healthcare costs (9), thereby making it a major global public health challenge (10). Therefore, minimizing the difficulties associated with OP requires early identification and prevention.
Traditionally, the Body Mass Index (BMI) has been widely used to assess obesity and related health risks. However, BMI’s limitation lies in its inability to distinguish between fat and muscle tissue (11), and its inability to accurately reflect fat distribution (12). The Body Roundness Index (BRI) is an emerging body composition indicator first proposed in 2013, which combines height and waist circumference to more accurately reflect body fat distribution (13), offering a new perspective for assessing body fat percentage and visceral fat proportion (14). The advantage of this measurement is that it focuses not just on overall weight but more precisely reflects fat distribution patterns (15), particularly abdominal fat accumulation (16), which is a key factor in increasing the risk of many chronic diseases. Previous studies have demonstrated that BRI possesses high sensitivity and specificity in assessing health risks such as cardiovascular disease, diabetes, and metabolic syndrome (17–19). There is also a link between metabolic syndrome and BMD (20). As an indicator reflecting visceral fat accumulation (21), BRI provides significant value in predicting and assessing the risks of these diseases. We used data from the National Health and Nutrition Examination Survey (NHANES) to examine the relationship between BRI levels and the prevalence of OP in adults 50 years of age and older in order to shed light on the possible role of BRI in OP. This information may help in the development of future preventative or therapeutic approaches for OP.
2 Methods
2.1 Survey description
The goal of the National Health and Nutrition Examination study (NHANES), a two-year cycle national study, is to systematically evaluate the health and nutritional status of the American people. The Ethics Review Board has authorized this study endeavor, and each participant gave written informed permission. Researchers can examine a variety of health patterns and correlations using the quantity of public health information these data give.
2.2 Study population
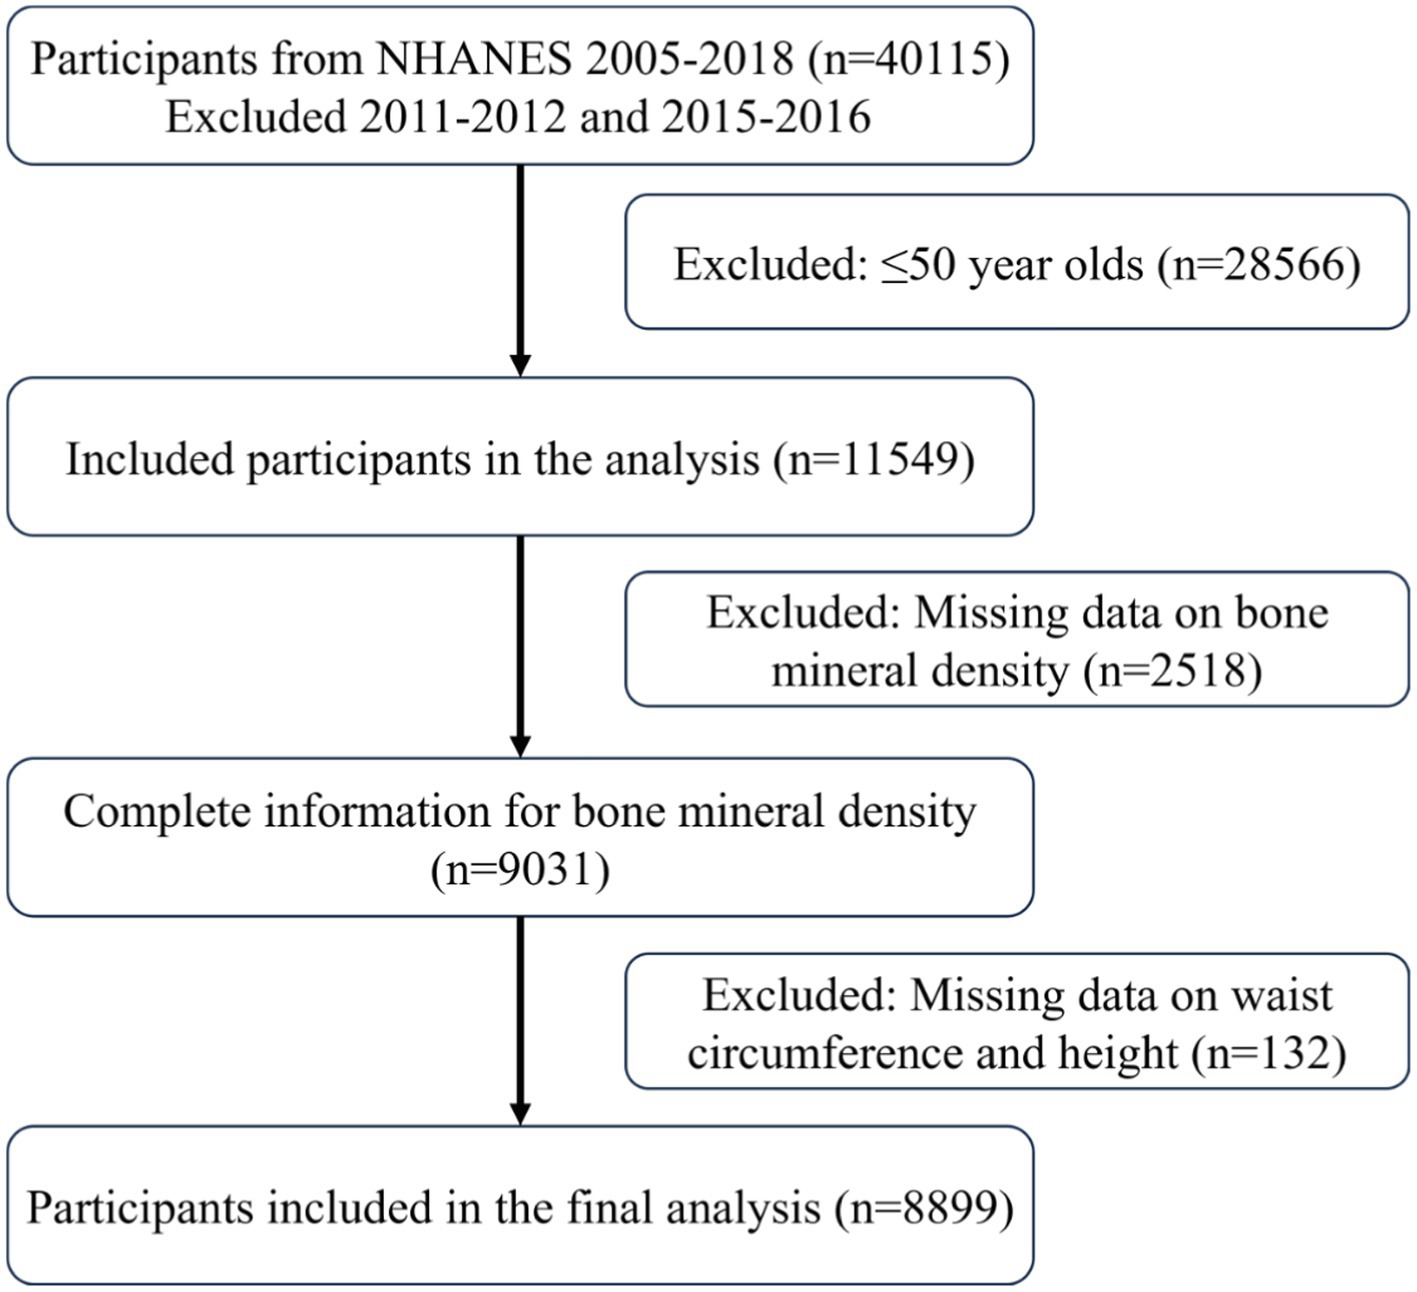
This study utilized data collected by NHANES from 2007 to 2018. Due to the lack of femur bone density data for the 2011–2012 and 2015–2016 cycles, these two cycles were excluded from the analysis. The following three requirements had to be met in order for participants to be included: (1) they had to be adults 50 years of age or older; (2) they had to provide complete bone density measurement data; and (3) they had to provide complete waist circumference and height data. The last set of chosen research participants were added for additional investigation once these criteria were applied.
2.3 Calculation of BRI
BRI is calculated by combining two key body measurements: height (BH) and waist circumference (WC) (14). These measurements were obtained by professionally trained medical technicians at Mobile Examination Centers (MEC). The formula for calculating BRI is as follows:
2.4 Definition of osteoporosis
NHANES used dual-energy X-ray absorptiometry (DXA) to measure the proximal femur of participants throughout the 2007–2010, 2013–2014, and 2017–2018 cycles. Shepherd Laboratories reviewed and analysed each participant and model scan using standard radiographic techniques and study-specific protocols developed for NHANES. Hologic software APEX v4.0 (Hologic) was used to analyse the acquired proximal femur scans, and bone mineral density (BMD) was measured at the femoral rotor, inter-rotor region, femoral neck, and throughout the femur. According to the World Health Organization (WHO) recommendations, the T-Score was calculated using the following formula: T-Score = (BMD measurement - BMD reference)/standard deviation. The reference standard is the BMD of Non-Hispanic White women between the ages of 20 and 29 years. Participants were diagnosed with OP when the T-Score was less than −2.5 standard deviations at any given site (22).
2.5 Covariates
To comprehensively analyze the relationship between BRI and OP, this study included various covariates such as demographic characteristics, lifestyle factors, health conditions, and laboratory test results. Demographic characteristics encompassed age, sex, race, poverty income ratio (PIR), and education level. PIR is divided into three levels: <1, 1 to <3, and ≥ 3 (23). It is computed by dividing total family income by the poverty line. Lifestyle variables encompassed smoking and physical activity. More than 100 cigarettes smoked throughout one’s lifetime was considered smoking. Physical activity was assessed using the Global Physical Activity Questionnaire to calculate metabolic equivalents (MET), with the formula: MET (minutes/week) = MET value × weekly frequency × duration of each activity (24). A MET value of less than 600 min per week was defined as inactivity. Health condition variables included chronic kidney disease, hypertension, high cholesterol, and diabetes, as determined by physician diagnosis records or self-reports. Laboratory tests included serum uric acid (SUA), high-density lipoprotein cholesterol (HDL-C), blood urea nitrogen (BUN), total cholesterol (TC), alanine aminotransferase (ALT), aspartate aminotransferase (AST), calcium, and phosphorus. All laboratory parameters were measured using a Roche Cobas 6,000 analyzer (c501 module). More detailed information on the analyte methods, principles, and operational procedures can be found in the NHANES Laboratory Procedures Manual.
2.6 Statistical analysis
After identifying participants who meet the inclusion criteria, a descriptive analysis based on osteoporosis status was conducted. Continuous variables were expressed as means (standard deviation), and categorical variables as percentages. The 95% confidence intervals (CI) and odds ratios (OR) for the relationship between BRI and OP were determined using logistic regression analysis. To enhance the robustness of the study results, BRI was categorized into four levels to analyze association trends within different BRI ranges. To investigate the nonlinear relationship between BRI and OP, restricted cubic spline (RCS) analysis was utilized, and threshold effect analysis was utilized to identify important spots. Additionally, subgroup analyses based on demographic and lifestyle factors were conducted to further explore the potential relationship between BRI and OP. Finally, additional analyses of BMD in different femoral regions were performed to verify the robustness of the study results. The statistical significance threshold was set at p < 0.05 for all data analyses, which were carried out using the R program (version 4.2.3; https://www.R-project.org).
3 Results
3.1 Characteristics of study population
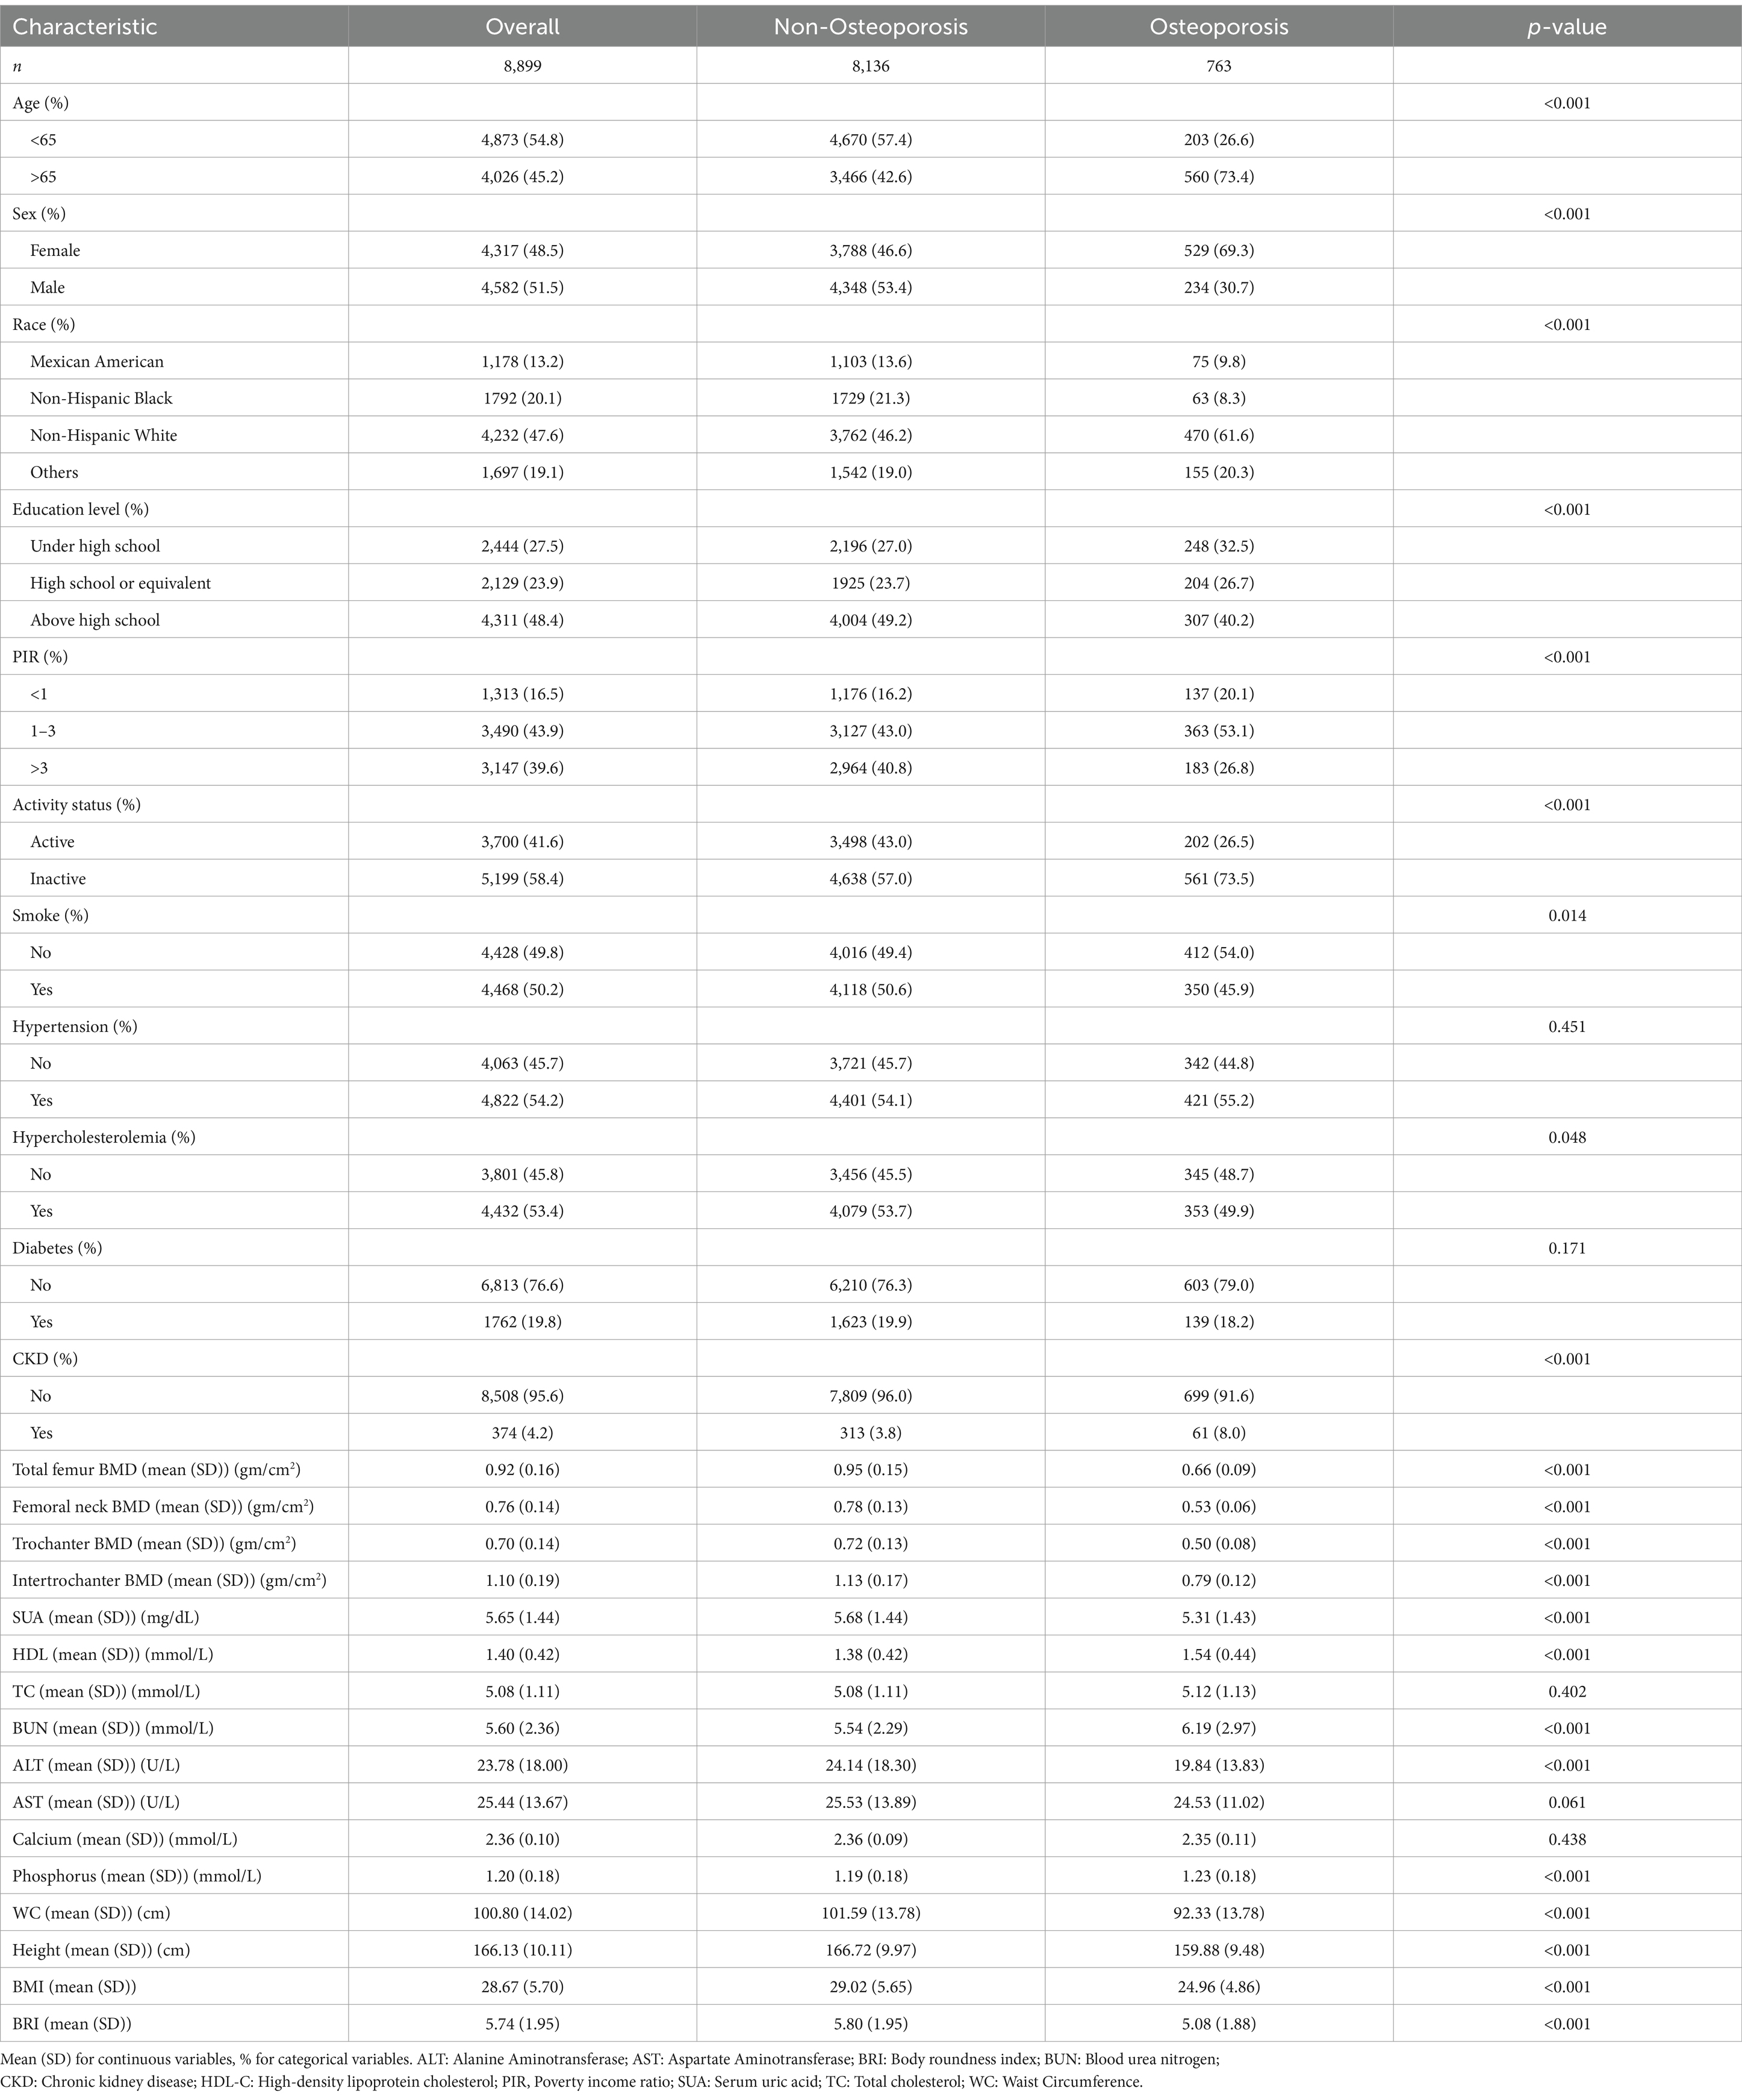
Data from a total of 40,115 participants were extracted from the NHANES database. After the screening process (Figure 1), 8,899 participants were included in the subsequent study, comprising 8,136 non-osteoporotic participants and 763 osteoporotic participants. Baseline characteristics according to OP status are shown in Table 1. In contrast to the non-osteoporotic group, the osteoporotic group’s members exhibited lower levels of physical activity, were mostly Non-Hispanic White, had a greater proportion of females, and were typically older. They also exhibited higher levels of HDL-C, BUN, and serum phosphorus, along with lower waist circumference, height, BRI, and bone density in the femoral regions.
3.2 Association between BRI and prevalence of osteoporosis
Table 2 presents the results of the logistic regression analyses conducted to examine the relationship between WC, BMI, BRI and OP prevalence. It was found that WC, BMI, BRI were negatively associated with OP prevalence in model 1. The results remained stable with gradual adjustment of different covariates. After appropriate adjustment for all variables, the OP prevalence decreased by 5% (OR = 0.95, 95% CI: 0.94–0.96), 14% (OR = 0.86, 95% CI: 0.84–0.89), and 21% (OR = 0.79, 95% CI: 0.69–0.86) for each unit increase in WC, BMI, BRI, respectively. When BRI was converted from a continuous to a categorical variable, the prevalence of OP compared with the lowest BRI quartile declined substantially with increasing levels of BRI (p trend <0.001). This trend persisted even after adjustment for all covariates, suggesting a robust negative association between BRI and OP.
3.3 Analysis of nonlinear relationships and saturation effects
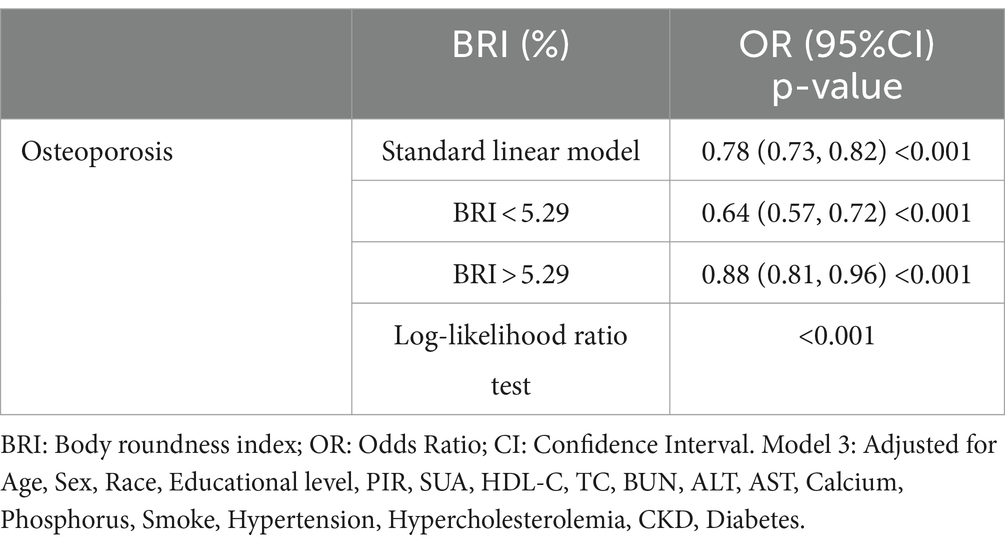
The study using restricted cubic splines (RCS) showed a non-linear relationship between BRI and the prevalence of OS (P-non-linear = 0.0010). This relationship is defined by a negative correlation that has an L-shaped pattern (Figure 2). Threshold effect analysis identified a breakpoint at BRI = 5.29 for the OS group. Segmental logistic regression analysis revealed that for BRI values below 5.29, each 1-unit increase in BRI was linked to a 41% decrease in the probability of OS (odds ratio = 0.64, 95% confidence interval: 0.57–0.72). Nevertheless, as the BRI exceeds 5.29, the impact of increasing BRI on the occurrence of OS gradually decreases (OR=0.88, 95% CI: 0.81-0.96) (Table 3).
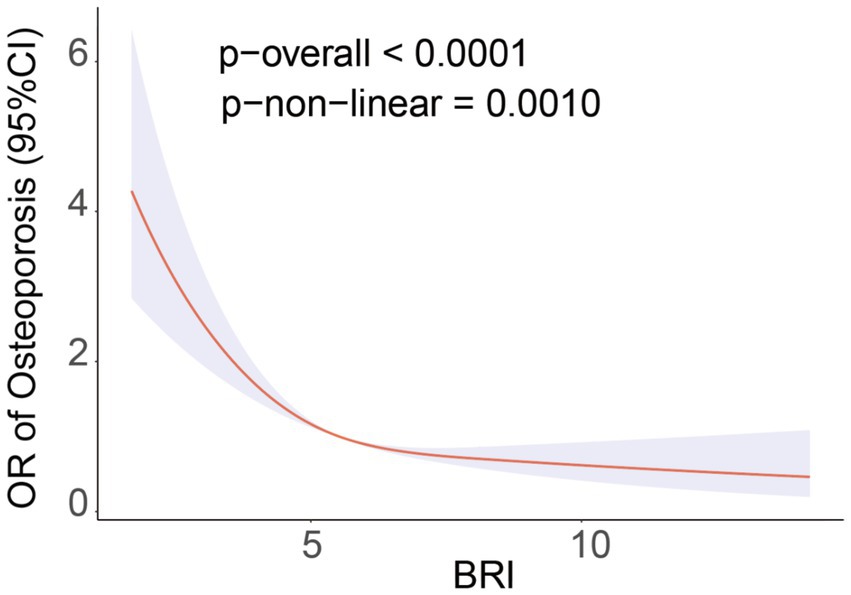
Figure 2. RCS curve fits the association of BRI with osteoporosis. Adjusted for Age, Sex, Race, Educational level, PIR, SUA, HDL-C, TC, BUN, ALT, AST, Calcium, Phosphorus, Smoke, Hypertension, Hypercholesterolemia, CKD, Diabetes.
3.4 Subgroup analysis
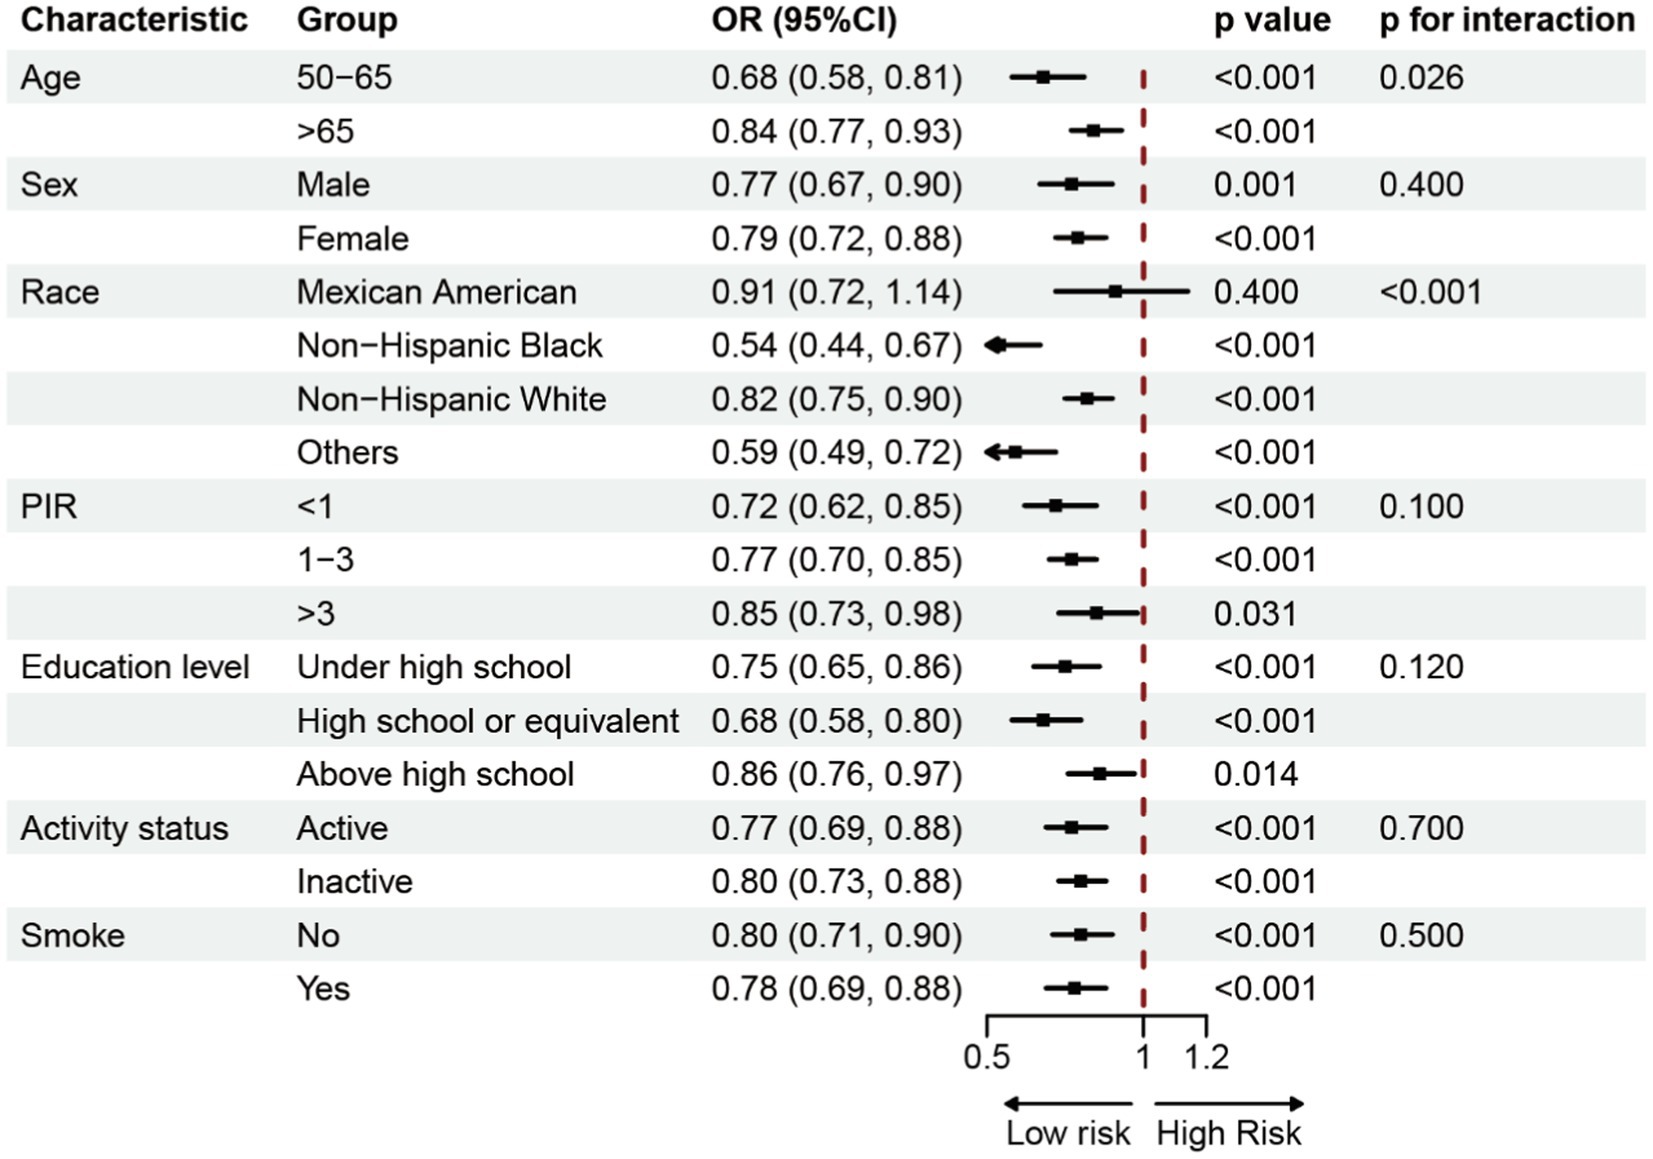
In order to investigate the possible correlation between BRI and OP, a subgroup analysis was performed. This analysis involved categorizing individuals based on parameters such as age, sex, race, poverty income ratio (PIR), education level, physical activity, and smoking status. The study was conducted alongside Model 3 (Figure 3). The findings demonstrated a consistent negative correlation between BRI and the prevalence of OP across various groups.
4 Discussion
In 8,899 subjects, this cross-sectional study sought to determine if BRI and OP prevalence were related. The findings showed an L-shaped nonlinear association with a negative link between BRI and OP prevalence. The OP breakpoint was determined via threshold effect analysis to be BRI = 5.29. The chance of OP was shown to decrease by 41% for every unit increase in BRI until to this breakpoint (OR = 0.64, 95% CI: 0.57–0.72). However, after the breakpoint, the effect of increasing BRI on OP prevalence progressively decreased. Finally, subgroup analysis further confirmed the robustness of these findings. Therefore, these findings suggest that higher BRI levels are associated with a reduced risk of OP among American adults and that BRI is an independent protective factor against OP.
As far as we are aware, this is the first research to assess the relationship between BRI and OP. The BRI is a brand-new obesity index that precisely measures levels of visceral and body fat (25). In this study, BRI was negatively correlated with the prevalence of OP. This finding aligns with previous research suggesting that moderate weight gain has a protective effect on bone density (26, 27). A 13-year descriptive study of individuals aged 60 and above, using the Visceral Adiposity Index (VAI) to reflect abdominal fat distribution, found that when VAI increased to a threshold of 0.68 g/cm2, femoral BMD no longer increased and might even decrease (28). This implies that moderate visceral fat accumulation may positively impact bone health. Similarly, a cross-sectional study involving 6,143 adolescents aged 8–19 years found a significant positive and saturation correlation between BMI and BMD [0.014 (0.013, 0.014)] (29). For each unit increase in BMI, total BMD increased by 0.014 g/cm2, indicating a saturation effect as well. Another observational study involving 4,056 participants demonstrated a positive saturation effect of waist circumference (WC) at 70.5 cm on BMD, suggesting that moderate obesity may promote better bone mass development in adolescents (30). Furthermore, several studies have found a positive correlation between obesity and both bone density and bone metabolism, implying that a moderate amount of fat is crucial for effectively managing bone metabolic health (31, 32). This study further reveals a nonlinear relationship between BRI and OP, showing that within a lower BRI range, increases in BRI significantly reduce the risk of OP, but beyond a certain threshold, this protective effect diminishes. This finding suggests that moderate fat distribution may positively impact bone health by increasing mechanical load on bones and promoting the secretion of bone-forming factors (33–35). However, excessive obesity may negatively affect bone health through various mechanisms, such as the secretion of inflammatory factors and hormones by adipose tissue, potentially leading to OP.
Multiple potential mechanisms are associated with the development of OP, but the underlying mechanisms linking BRI and OP remain unclear. The negative correlation between BRI and OP may involve several mechanisms. First, moderate fat distribution can increase mechanical load on bones, thereby stimulating bone formation (36). Bone is a dynamic tissue whose structure and density are significantly influenced by mechanical loading (37–39). Osteocytes, located within the bone matrix, may sense mechanical load changes through a mechanosensitive ion channel, Piezo1 (40), and generate signals that alter osteoblast bone formation (41). Moderate weight gain can promote bone formation and mineralization by increasing mechanical load on bones. Second, adipose tissue can secrete various hormones and cytokines (42), such as leptin, adiponectin, and inflammatory factors (43–45), which can influence bone metabolism and bone density (46). Receptor activation of NF-κB ligand (RANKL) expression is increased by leptin, which simultaneously promotes osteoclast differentiation and limits osteoblast proliferation via activating the molecular clock and Ap-1 gene in osteoblasts (47). Another pathway involves hypothalamic neuropeptide (cocaine-and amphetamine-regulated transcript) CART inhibiting RANKL expression in osteoblasts, thus inhibiting osteoclast differentiation and increasing bone density (34). Nevertheless, adiponectin possesses anti-inflammatory qualities (48), which decrease pro-inflammatory cytokine production by blocking NF-κB signaling and activating the AMP-activated protein kinase (AMPK) pathway, therefore lowering inflammation-mediated bone resorption (49).
Our study has several strengths. It is the first to evaluate the relationship between BRI and the risk of OP in American adults. The relatively large sample size allows for more accurate and consistent estimates. BRI is superior to traditional obesity indices in assessing individual fat distribution. Our research shows a consistent positive correlation between BRI and OP prevalence, proving that this is not an accident. Additionally, we adjusted for confounding variables based on demographic characteristics and chronic disease conditions. Furthermore, we conducted stratified subgroup analyses to investigate the relationship between BRI and OP in different populations, suggesting the need for more precise OP prevention strategies. Our study does, however, have several shortcomings. First, the causal relationship between BRI and OP cannot be established by the cross-sectional design. To confirm these results and investigate the possible use of BRI in the management and prevention of OP, more long-term research is required. Second, although our study controlled for various covariates, there may still be unmeasured confounding factors, such as dietary habits, physical activity intensity, and medication use, that could affect the results. Finally, as a relatively new body composition index, BRI’s clinical application and widespread use require further research support.
5 Conclusion
In a large, representative sample of American adults, this study identified a significant negative correlation between BRI and the prevalence of OP. Specifically, as BRI increases, the prevalence of osteoporosis decreases. Maintaining an appropriate and healthy BRI level may play a critical role in the prevention of osteoporosis. Therefore, regular monitoring of BRI and the adoption of appropriate health measures are essential for reducing the risk of osteoporosis.
Data availability statement
Publicly available datasets were analyzed in this study. This data can be found at: https://www.cdc.gov/nchs/nhanes/nhanes.
Ethics statement
The studies involving humans were approved by The Research Ethics Review Board of the National Center for Health Statistics (NCHS). The studies were conducted in accordance with the local legislation and institutional requirements. Written informed consent for participation was not required from the participants or the participants’ legal guardians/next of kin in accordance with the national legislation and institutional requirements.
Author contributions
XunZ: Data curation, Methodology, Software, Writing – original draft. JL: Data curation, Formal analysis, Software, Writing – original draft. HL: Investigation, Writing – review & editing. HZ: Validation, Writing – review & editing. JX: Validation, Writing – review & editing. LG: Methodology, Supervision, Writing – review & editing. XueZ: Conceptualization, Methodology, Writing – review & editing.
Funding
The author(s) declare that no financial support was received for the research, authorship, and/or publication of this article.
Acknowledgments
We are appreciative that the National Center for Medical Research at the Institute of Prevention and Control of Disorders has made the National Health and Nutritional Evaluation Survey available to all citizens of the country.
Conflict of interest
The authors declare that the research was conducted in the absence of any commercial or financial relationships that could be construed as a potential conflict of interest.
Publisher’s note
All claims expressed in this article are solely those of the authors and do not necessarily represent those of their affiliated organizations, or those of the publisher, the editors and the reviewers. Any product that may be evaluated in this article, or claim that may be made by its manufacturer, is not guaranteed or endorsed by the publisher.
Abbreviations
BMD, Bone Mineral Density; BMI, Body Mass Index; BRI, Body Roundness Index; BUN, Blood Urea Nitrogen; CART, Cocaine-and Amphetamine-regulated Transcript; CI, Confidence Interval; DXA, Dual-energy X-ray Absorptiometry; HDL-C, High-density Lipoprotein Cholesterol; MET, Metabolic Equivalent; MEC, Mobile Examination Centers; NHANES, National Health and Nutrition Examination Survey; OP, Osteoporosis; PIR, Poverty Income Ratio; RCS, Restricted Cubic Spline; RANKL, Receptor Activator of NF-κB Ligand; SUA, Serum Uric Acid; TC, Total Cholesterol; VAI, Visceral Adiposity Index; WC, Waist Circumference; WHO, World Health Organization; WWI, Weight-Adjusted Waist Index.
References
1. Lane, JM, Russell, L, and Khan, SN. Osteoporosis. Clin Orthop Relat Res. (2000) 372:139–50. doi: 10.1097/00003086-200003000-00016
2. Armas, LA, and Recker, RR. Pathophysiology of osteoporosis: new mechanistic insights. Endocrinol Metab Clin N Am. (2012) 41:475–86. doi: 10.1016/j.ecl.2012.04.006
3. Barron, RL, Oster, G, Grauer, A, Crittenden, DB, and Weycker, D. Determinants of imminent fracture risk in postmenopausal women with osteoporosis. Osteoporosis Int. (2020) 31:2103–11. doi: 10.1007/s00198-020-05294-3
4. Glaser, DL, and Kaplan, FS. Osteoporosis. Definition and clinical presentation. Spine. (1997) 22:12s–6s. doi: 10.1097/00007632-199712151-00003
5. Aggarwal, L, and Masuda, C. Osteoporosis: A quick update. J Fam Pract. (2018) 67:59–65. doi: 10.29663/OLIE.201206.0001
6. Wright, NC, Looker, AC, Saag, KG, Curtis, JR, Delzell, ES, Randall, S, et al. The recent prevalence of osteoporosis and low bone mass in the United States based on bone mineral density at the femoral neck or lumbar spine. J Bone Miner Res Off J Am Soc Bone Miner Res. (2014) 29:2520–6. doi: 10.1002/jbmr.2269
7. Dempster, DW . Osteoporosis and the burden of osteoporosis-related fractures. Am J Manag Care. (2011) 17:S164–9. doi: 10.1007/s11914-003-0011-x
8. Kelsey, JL . Risk factors for osteoporosis and associated fractures. Public Health Rep. (1989) 104:14–20. doi: 10.1007/BF02499889
9. Srivastava, M, and Deal, C. Osteoporosis in elderly: prevention and treatment. Clin Geriatr Med. (2002) 18:529–55. doi: 10.1016/S0749-0690(02)00022-8
10. Hiligsmann, M, Cornelissen, D, Vrijens, B, Abrahamsen, B, Al-Daghri, N, Biver, E, et al. Determinants, consequences and potential solutions to poor adherence to anti-osteoporosis treatment: results of an expert group meeting organized by the European Society for Clinical and Economic Aspects of osteoporosis, osteoarthritis and musculoskeletal diseases (ESCEO) and the international osteoporosis foundation (IOF). Osteoporosis Int. (2019) 30:2155–65. doi: 10.1007/s00198-019-05104-5
11. De Lorenzo, A, Gratteri, S, Gualtieri, P, Cammarano, A, Bertucci, P, and Di Renzo, L. Why primary obesity is a disease? J Transl Med. (2019) 17:169. doi: 10.1186/s12967-019-1919-y
12. Merchant, RA, Seetharaman, S, Au, L, Wong, MWK, Wong, BLL, Tan, LF, et al. Relationship of fat mass index and fat free mass index with body mass index and association with function, cognition and sarcopenia in pre-frail older adults. Front Endocrinol. (2021) 12:765415. doi: 10.3389/fendo.2021.765415
13. Calderón-García, JF, Roncero-Martín, R, Rico-Martín, S, De Nicolás-Jiménez, JM, López-Espuela, F, Santano-Mogena, E, et al. Effectiveness of body roundness index (BRI) and a body shape index (ABSI) in predicting hypertension: a systematic review and Meta-analysis of observational studies. Int J Environ Res Public Health. (2021) 18:607. doi: 10.3390/ijerph182111607
14. Thomas, DM, Bredlau, C, Bosy-Westphal, A, Mueller, M, Shen, W, Gallagher, D, et al. Relationships between body roundness with body fat and visceral adipose tissue emerging from a new geometrical model. Obesity. (2013) 21:2264–71. doi: 10.1002/oby.20408
15. Zhu, Y, Huang, Y, Sun, H, Chen, L, Yu, H, Shi, L, et al. Novel anthropometric indicators of visceral obesity predict the severity of hyperlipidemic acute pancreatitis. Lipids Health Dis. (2024) 23:120. doi: 10.1186/s12944-024-02112-1
16. Yang, H, Zhang, M, Nie, J, Zhang, M, Lu, G, Chen, R, et al. Associations of obesity-related indices with prediabetes regression to normoglycemia among Chinese middle-aged and older adults: a prospective study. Front Nutr. (2023) 10:1075225. doi: 10.3389/fnut.2023.1075225
17. Zhou, D, Liu, X, Huang, Y, and Feng, Y. A nonlinear association between body roundness index and all-cause mortality and cardiovascular mortality in general population. Public Health Nutr. (2022) 25:3008–15. doi: 10.1017/S1368980022001768
18. Zhao, W, Tong, J, Li, J, and Cao, Y. Relationship between body roundness index and risk of type 2 diabetes in Japanese men and women: a reanalysis of a cohort study. Int J Endocrinol. (2021) 2021:4535983.
19. Wu, L, Zhu, W, Qiao, Q, Huang, L, Li, Y, and Chen, L. Novel and traditional anthropometric indices for identifying metabolic syndrome in non-overweight/obese adults. Nutr Metab. (2021) 18:3. doi: 10.1186/s12986-020-00536-x
20. Wung, CH, Chung, CY, Wu, PY, Huang, JC, Tsai, YC, Chen, SC, et al. Associations between metabolic syndrome and obesity-related indices and bone mineral density T-score in hemodialysis patients. J Person Med. (2021) 11:775. doi: 10.3390/jpm11080775
21. Liu, J, Fan, D, Wang, X, and Yin, F. Association of two novel adiposity indicators with visceral fat area in type 2 diabetic patients: novel adiposity indexes for type 2 diabetes. Medicine. (2020) 99:e20046. doi: 10.1097/MD.0000000000020046
23. Zhao, Y, Zhao, J, Xie, R, Zhang, Y, Xu, Y, Mao, J, et al. Association between family income to poverty ratio and HPV infection status among U.S. women aged 20 years and older: a study from NHANES 2003-2016. Front Oncol. (2023) 13:1265356. doi: 10.3389/fonc.2023.1265356
24. Piercy, KL, Troiano, RP, Ballard, RM, Carlson, SA, Fulton, JE, Galuska, DA, et al. The physical activity guidelines for Americans. JAMA. (2018) 320:2020–8. doi: 10.1001/jama.2018.14854
25. Wang, H, Zhang, Y, Liu, Y, Li, H, Xu, R, Fu, H, et al. Comparison between traditional and new obesity measurement index for screening metabolic associated fatty liver disease. Front Endocrinol. (2023) 14:1163682. doi: 10.3389/fendo.2023.1163682
26. Peng, Y, Liu, J, Tang, Y, Liu, J, Han, T, Han, S, et al. High-fat-diet-induced weight gain ameliorates bone loss without exacerbating AβPP processing and cognition in female APP/PS1 mice. Front Cell Neurosci. (2014) 8:225. doi: 10.3389/fncel.2014.00225
27. Sternfeld, B, and Dugan, S. Physical activity and health during the menopausal transition. Obstet Gynecol Clin N Am. (2011) 38:537–66. doi: 10.1016/j.ogc.2011.05.008
28. Sun, A, Hu, J, Wang, S, Yin, F, and Liu, Z. Association of the visceral adiposity index with femur bone mineral density and osteoporosis among the U.S. older adults from NHANES 2005-2020: a cross-sectional study. Front Endocrinol. (2023) 14:1231527. doi: 10.3389/fendo.2023.1231527
29. Ouyang, Y, Quan, Y, Guo, C, Xie, S, Liu, C, Huang, X, et al. Saturation effect of body mass index on bone mineral density in adolescents of different ages: a population-based study. Front Endocrinol. (2022) 13:922903. doi: 10.3389/fendo.2022.922903
30. Wang, GX, Fang, ZB, Li, HL, Liu, DL, Chu, SF, and Zhao, HX. Effect of obesity status on adolescent bone mineral density and saturation effect: a cross-sectional study. Front Endocrinol. (2022) 13:994406. doi: 10.3389/fendo.2022.994406
31. Julian, V, O'Malley, G, Metz, L, Weghuber, D, Courteix, D, Fillon, A, et al. Does the severity of obesity influence bone density, geometry and strength in adolescents? Pediatr Obes. (2021) 16:e12826. doi: 10.1111/ijpo.12826
32. Zhang, L, Li, H, Zhang, Y, Kong, Z, Zhang, T, and Zhang, Z. Association of Body Compositions and Bone Mineral Density in Chinese children and adolescents: compositional data analysis. Biomed Res Int. (2021) 2021:1904343. doi: 10.1155/2021/1904343
33. Simkin, PA . Marrow fat may distribute the energy of impact loading throughout subchondral bone. Rheumatology (Oxford). (2018) 57:414–8. doi: 10.1093/rheumatology/kex274
34. Holloway, WR, Collier, FM, Aitken, CJ, Myers, DE, Hodge, JM, Malakellis, M, et al. Leptin inhibits osteoclast generation. J Bone Miner Res Off J Am Soc Bone Miner Res. (2002) 17:200–9. doi: 10.1359/jbmr.2002.17.2.200
35. Hou, J, He, C, He, W, Yang, M, Luo, X, and Li, C. Obesity and bone health: a complex link. Front Cell Dev Biol. (2020) 8:600181. doi: 10.3389/fcell.2020.600181
36. Lv, S, Zhang, A, Di, W, Sheng, Y, Cheng, P, Qi, H, et al. Assessment of fat distribution and bone quality with trabecular bone score (TBS) in healthy Chinese men. Sci Rep. (2016) 6:24935. doi: 10.1038/srep24935
37. Datta, HK, Ng, WF, Walker, JA, Tuck, SP, and Varanasi, SS. The cell biology of bone metabolism. J Clin Pathol. (2008) 61:577–87. doi: 10.1136/jcp.2007.048868
38. van der Eerden, BC, Teti, A, and Zambuzzi, WF. Bone, a dynamic and integrating tissue. Arch Biochem Biophys. (2014) 561:1–2. doi: 10.1016/j.abb.2014.08.012
39. Oftadeh, R, Perez-Viloria, M, Villa-Camacho, JC, Vaziri, A, and Nazarian, A. Biomechanics and mechanobiology of trabecular bone: a review. J Biomech Eng. (2015) 137:0108021–01080215. doi: 10.1115/1.4029176
40. Li, X, Han, L, Nookaew, I, Mannen, E, Silva, MJ, Almeida, M, et al. Stimulation of Piezo1 by mechanical signals promotes bone anabolism. eLife. (2019) 8:49631. doi: 10.7554/eLife.49631
41. Sandberg, OH, and Aspenberg, P. Inter-trabecular bone formation: a specific mechanism for healing of cancellous bone. Acta Orthop. (2016) 87:459–65. doi: 10.1080/17453674.2016.1205172
42. Peeraully, MR, Jenkins, JR, and Trayhurn, P. NGF gene expression and secretion in white adipose tissue: regulation in 3T3-L1 adipocytes by hormones and inflammatory cytokines. Am J Physiol Endocrinol Metab. (2004) 287:E331–9. doi: 10.1152/ajpendo.00076.2004
43. Villanueva-Carmona, T, Cedó, L, Madeira, A, Ceperuelo-Mallafré, V, Rodríguez-Peña, MM, Núñez-Roa, C, et al. SUCNR1 signaling in adipocytes controls energy metabolism by modulating circadian clock and leptin expression. Cell Metab. (2023) 35:601–619.e10. doi: 10.1016/j.cmet.2023.03.004
44. Karvela, A, Kostopoulou, E, Rojas Gil, AP, Avgeri, A, Pappa, A, Barrios, V, et al. Adiponectin signaling and impaired GTPase Rab 5 expression in adipocytes of adolescents with obesity. Horm Res Paediatr. (2020) 93:287–96. doi: 10.1159/000510851
45. Engin, AB . Adipocyte-macrophage cross-talk in obesity. Adv Exp Med Biol. (2017) 960:327–43. doi: 10.1007/978-3-319-48382-5_14
46. Motyl, KJ, Guntur, AR, Carvalho, AL, and Rosen, CJ. Energy metabolism of bone. Toxicol Pathol. (2017) 45:887–93. doi: 10.1177/0192623317737065
47. Chen, XX, and Yang, T. Roles of leptin in bone metabolism and bone diseases. J Bone Miner Metab. (2015) 33:474–85. doi: 10.1007/s00774-014-0569-7
48. Choi, HM, Doss, HM, and Kim, KS. Multifaceted physiological roles of adiponectin in inflammation and diseases. Int J Mol Sci. (2020) 21:219. doi: 10.3390/ijms21041219
Keywords: body roundness index, osteoporosis, obesity, bone mineral density, cross-sectional study, NHANES
Citation: Zhang X, Liang J, Luo H, Zhang H, Xiang J, Guo L and Zhu X (2024) The association between body roundness index and osteoporosis in American adults: analysis from NHANES dataset. Front. Nutr. 11:1461540. doi: 10.3389/fnut.2024.1461540
Edited by:
Guanwu Li, Shanghai University of Traditional Chinese Medicine, ChinaReviewed by:
Astrid Kamilla Stunes, Center for Oral Health Services and Research (TkMidt), NorwaySalvatore Vaccaro, IRCCS Local Health Authority of Reggio Emilia, Italy
Copyright © 2024 Zhang, Liang, Luo, Zhang, Xiang, Guo and Zhu. This is an open-access article distributed under the terms of the Creative Commons Attribution License (CC BY). The use, distribution or reproduction in other forums is permitted, provided the original author(s) and the copyright owner(s) are credited and that the original publication in this journal is cited, in accordance with accepted academic practice. No use, distribution or reproduction is permitted which does not comply with these terms.
*Correspondence: Lianjin Guo, NTY5NDAyNjMzQHFxLmNvbQ==; Xuemin Zhu, NTIyNzQ4OTI0QHFxLmNvbQ==
†These authors have contributed equally to this work
 Xunmeng Zhang
 Jiarong Liang1†