 Zhichun Tan
 Ning Yan
- Neurology Department, The Affiliate University-Town Hospital, Chongqing Medical University, Chongqing, China
Objective: To investigate the associations between the geriatric nutritional risk index (GNRI) with cognitive functions among U.S. older adults. (Patients were classified into two nutrition risk groups based on the GNRI).
Methods: Our analysis utilized data from the cross-sectional National Health and Nutrition Examination Survey (NHANES) conducted between 2011 and 2014. Cognitive function was measured using CERAD test, AFT and DSST. Composite z-scores were obtained by summing test-specific z-scores of the above three cognitive tests and were used to assess the global cognitive function. We employed weighted logistic regression models to evaluate the associations between GNRI and nutritional status (low and high GNRI) with cognitive function among older participants. The non-linear relationship was described using fitted smoothed curves and threshold effect analyses. Subgroup analysis and interaction tests were also conducted.
Results: This study included 2,592 older participants aged 60 years and older. After adjusting for confounding variables, the GNRI was positively associated with AFT (β = 0.05, 95% CI 0.005–0.096, p-value = 0.0285), DSST (β = 0.192, 95% CI 0.078–0.305, p-value = 0.0010) and the composite z-scores (β = 0.027, 95% CI 0.010–0.044, p-value = 0.0024). The results also showed that the high-GNRI group was significantly associated with AFT (β = 0.922, 95% CI 0.166–1.677, p-value = 0.0169), DSST (β = 2.791, 95% CI 0.884–4.698, p-value = 0.0042) and composite z-scores (β = 0.405, 95% CI 0.115–0.695, p-value = 0.0062) likewise had significant positive correlations, using the low-GNRI group as a reference. In addition, inflection points with CERAD and composite z-scores were found at GNRI of 108.016, and 105.371, respectively. Specifically, on the left side of the inflection point GNRI levels were positively correlated with CERAD and composite z-scores (CERAD β = 0.087, 95% CI 0.024–0.150, p-value = 0.0070; composite z-scores β = 0.065, 95% CI 0.040–0.091, p-value <0.0001), while on the right side of the inflection point were significantly negatively associated (CERAD β = −0.295, 95% CI −0.529 to −0.062, p-value = 0.0133, composite z-scores β = −0.050, 95% CI −0.091 to −0.008, p-value = 0.0184).
Conclusion: Lower GNRI was associated with poorer performance in several cognitive domains. Additionally, there was a non-linear positive association between GNRI and cognitive function in normal nutritional states, for excessive GNRI may cause cognitive decline.
1 Introduction
The increasing incidence of cognitive function deterioration is becoming a significant concern in the context of global aging (1). Cognitive decline refers to the worsening of abilities across various cognitive domains, such as memory, language, judgment, executive functions, visuospatial skills and computational capabilities (2). Without timely prevention and intervention, this decline can evolve into mild cognitive impairment (MCI) and ultimately progress irreversibly to different forms of dementia, predominantly Alzheimer’s disease (3, 4). This progression poses substantial challenges to the quality of life of not only the affected individuals but also their families and society at large (5). Once dementia is established, the outcomes from existing treatments are frequently unsatisfactory (6). However, preemptive measures including lifestyle modifications like enhanced nutrition and increased physical activity can effectively manage and potentially prevent the deterioration of cognitive functions (7).
Previous studies have shown that diet and nutrition, as a common lifestyle, are significantly associated with CI and dementia (8–10). Two studies have relied on specific nutritional markers like vitamin and albumin levels (11, 12) or utilized scales such as the mini nutritional assessment (MNA) and its short form (MNA-SF) to investigate the link between malnutrition and cognitive function (13, 14). However, some of the above criteria for assessing nutritional status are subjective and do not fully reflect the overall nutritional status, so the relationship between nutritional status and cognitive function is still controversial. The geriatric nutritional risk index (GNRI), which is a more straightforward dietary index that evaluates the nutritional status of older adults using objective criteria such as height, weight, ideal body weight, and albumin levels (15), has recently been acknowledged as equally effective as the MNA in determining malnutrition (16).
To date, research examining the link between the GNRI and normal nutritional status with cognitive function remains scarce. In this investigation, we evaluated the relationship between GNRI and cognitive performance using a representative cohort of older U.S. adults from the 2011–2014 National Health and Nutrition Examination Survey (NHANES). Additionally, we analyzed how GNRI levels correlate with cognitive domains, through the application of three tests among older adults who are in a normal nutritional state.
2 Methods
2.1 Study population
The cohort for our study was sourced from the NHANES, which assesses the health and nutritional status of a representative segment of the U.S. populace through complex and multistage stratified random sampling. NHANES data has been collected continuously since 1999, and data are released publicly in 2-year cycles. The study’s protocol was sanctioned by the National Center for Health Statistics (NCHS), and all participants provided informed consent. We can find NHANES database from the link: https://www.cdc.gov/nchs/nhanes/index.htm.
Our analysis incorporated individuals from the 2011 to 2014 NHANES cycles, as these were the periods during which the latest assessments of cognitive function were available. Initially, we included 19,931 participants. Exclusions were made for those under the age of 60, resulting in 16,299 participants being omitted. Additionally, participants missing cognitive function test data (n = 698), GNRI-related data (n = 206), and necessary covariates (n = 136) were also excluded. Eventually, 2,592 participants remained eligible for inclusion in our research (Figure 1).
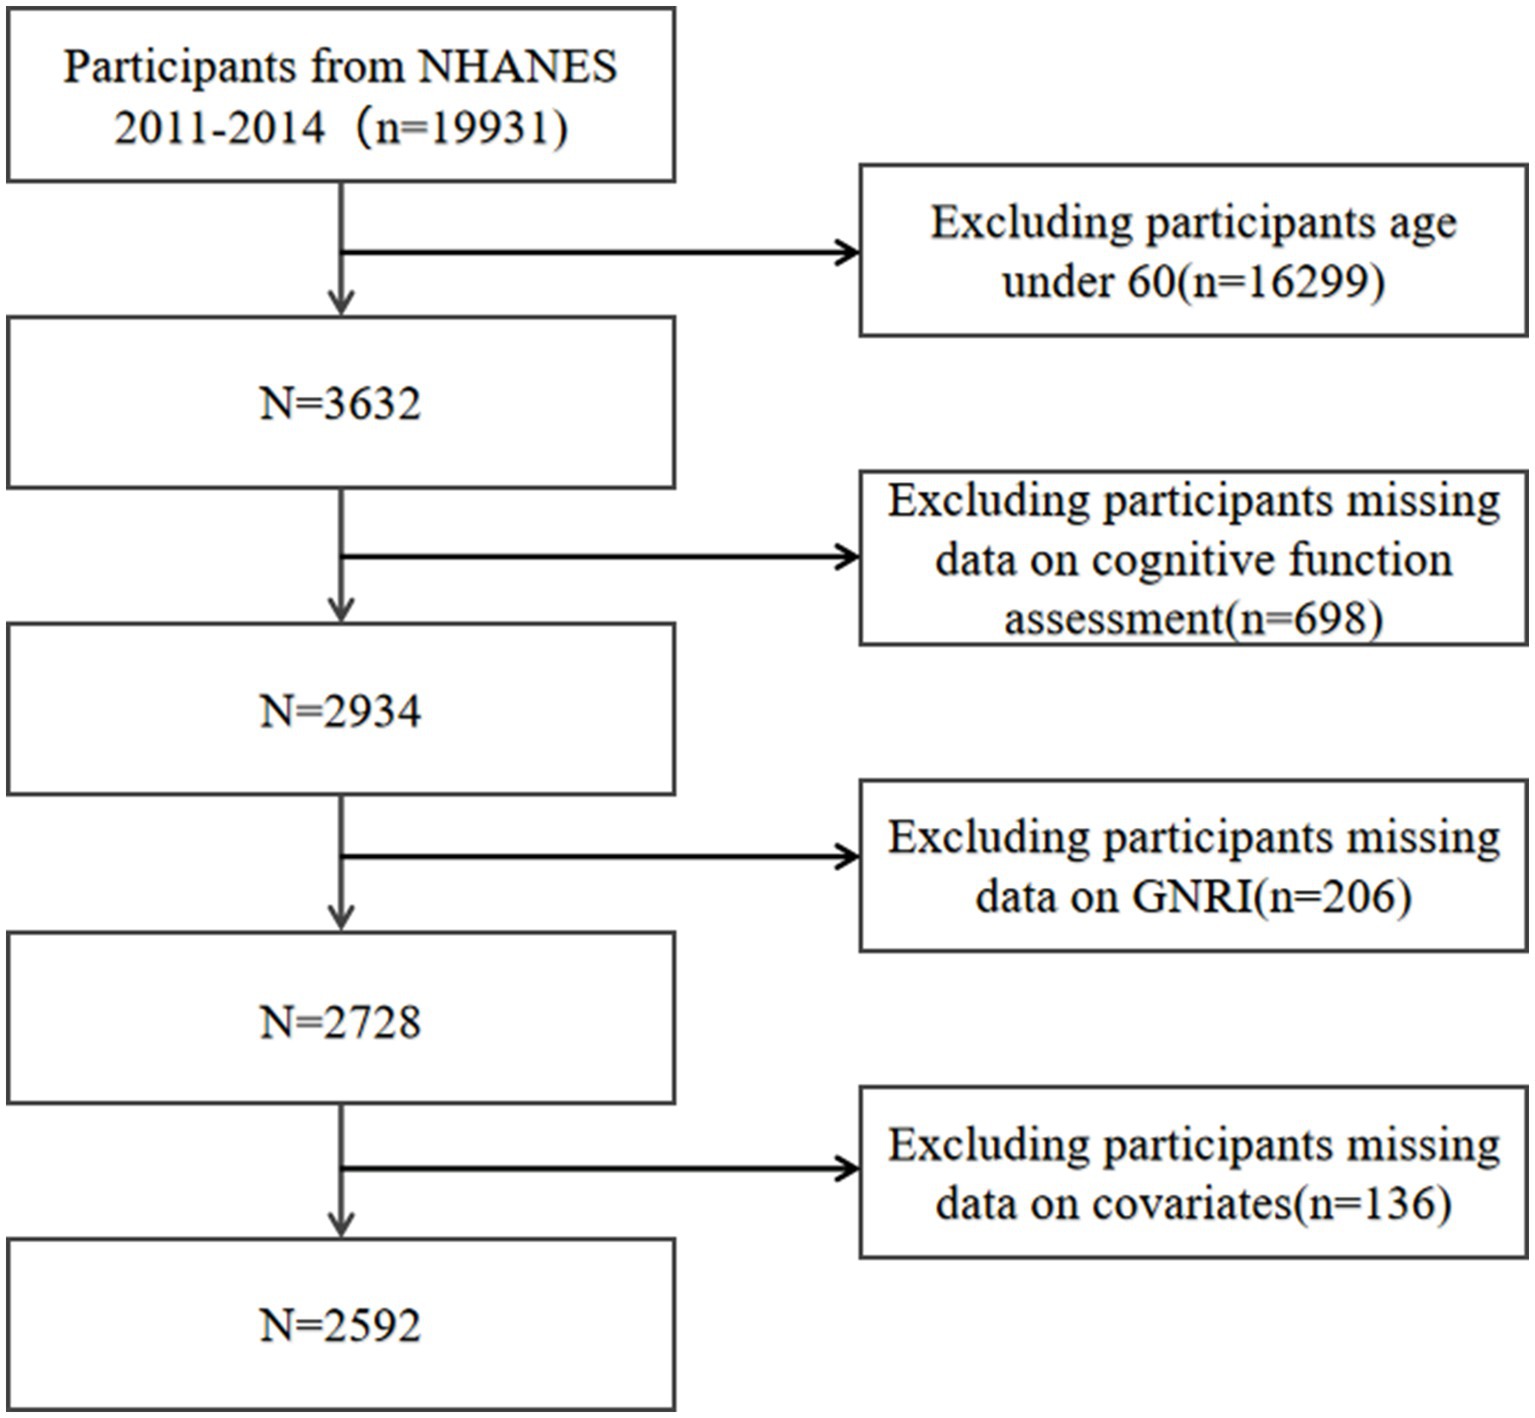
Figure 1. Flow chart of participants selection. NHANES, National Health and Nutrition Examination Survey.
2.2 GNRI assessment
GNRI is a newly nutritional assessment tool designed to evaluate the nutritional risk and its associated morbidity and mortality in older adults. According to previous studies (17, 18), the GNRI is composed of the individual’s height (m), weight (m), ideal weight (kg), and serum albumin (g/L). The calculation formula as follows (18): GNRI = 1.489 × albumin (g/L) + 41.7 × (weight/ideal weight), ideal weight = 22 × height (m) × height (m). In cases where the actual weight exceeded the ideal weight, the set weight/ideal weight was 1. In our study, the total GNRI was treated as a continuous variable and participants were divided into two categories based on their GNRI levels (18): a low-GNRI group (GNRI <98) and a high-GNRI group (GNRI ≥98). The low-GNRI group included individuals identified as malnourished, whereas the high-GNRI group comprised those with normal nutritional status. The GNRI was designated as the exposure variable for the research.
2.3 Cognitive function assessment
To assess the cognitive performance in participants, we employed the following three cognitive function tests, with higher scores indicative of better cognitive function.
The consortium for the establishment of an Alzheimer’s Disease Registry (CERAD) test involves three consecutive learning trials and one delayed recall trial, aimed at evaluating the immediate and delayed acquisition of new verbal information (19), with scores from 1 to 40. The animal fluency test (AFT) assesses categorical language fluency (20), with scores ranging from 3 to 40. The digit symbol substitution test (DSST), a component of the Wechsler Adult Intelligence Scale, measures processing speed, sustained attention, and working memory (21), with scores between 0 and 105.
Additionally, we calculated test-specific z-scores for each cognitive test by using the sample mean and standard deviation of the scores from each of the three listed cognitive tests, based on the prior reference [22]. These specific z-scores were then aggregated to create a composite z-score. The composite z-score was utilized to assess the global cognitive function of the study participants.
2.4 Covariates
We included relevant covariates that could potentially influence the association between GNRI and cognitive function in three categories: sociodemographic variables, lifestyle, and common diseases in older adults (23, 24).
Sociodemographic variables included sex (male/female), age (years), race (Mexican American, other Hispanic, non-Hispanic White, non-Hispanic Black, other), poverty-to-income ratio (PIR), education levels (less than high school, high school and above), and body mass index (BMI, kg/m2). Lifestyle factors comprised physical activity (active/inactive), smoking status (yes/no) and drinking status (yes/no). Common diseases in older adults that were considered included diabetes, hypertension, self-reported cardiovascular diseases (CVD) and stroke. Physically active was defined as engaging in at least 10 consecutive minutes of moderate or vigorous intensity activities not related to work or transport. While activities lasting less than 10 min were classified as physically inactive (25). Smoking status was assessed based on whether an individual had smoked at least 100 cigarettes in their lifetime. Drinking status was identified by whether an individual had at least 12 drinks per year. Self-reported CVD included congestive heart failure, coronary heart disease, angina/angina pectoris, and heart attack. Hypertension was determined either through a mean systolic blood pressure exceeding 140 mmHg or a mean diastolic blood pressure over 90 mmHg from the last three measurements, or by self-reported history. Diabetes was diagnosed either through physician diagnosis or the glycosylated hemoglobin level exceeding 6.5%.
2.5 Statistical analysis
In the weighted baseline table, continuous variables were described using the mean ± standard deviation, while categorical variables were represented as percentages. To explore differences across subgroups defined by varying GNRI levels, we applied t-tests for continuous variables and chi-squared tests for categorical variables. We also conducted analyses using weighted multivariate logistic regression to compute beta values and 95% confidence intervals, aiming to assess the association between GNRI and cognitive function. In our analytical models, no covariates were adjusted in model 1. Model 2 included adjustments for gender, age, and race. Model 3 accounted for all covariates. Furthermore, we performed smoothed curve fitting and threshold effects analyses to further investigate the non-linear relationship between GNRI and cognitive function, including identifying potential inflection points, adjusting for all covariates. Finally, to assess the stability of the correlation between high-GNRI and global cognitive function, we conducted further subgroup analyses and interaction tests, adjusting for all confounding factors in the process. Missing values for continuous variables in this study were entered from the median or mean of available cases for these variables. All study analyses were completed in EmpowerStats (versions 2.0; http://www.empowerstats.com) and R software (version 4.2.2; http://www.r-project.org).
3 Results
3.1 Baseline characteristics of participants
The baseline characteristics of the 2,592 participants in our study, stratified by GNRI levels, are summarized in Table 1. The weighted average age of the study was 69.08 ± 6.63 years, with a slightly higher proportion of females (53.69%) compared to males (46.31%). Compared with the low-GNRI group, the high-GNRI group was younger and more likely to be male, had a higher proportion of other Hispanics and non-Hispanic White people; was more likely to be overweight (BMI ≥25); had higher alcohol consumption and physical activity status; and had a lower prevalence of stroke and diabetes. In addition, the high-GNRI group scored higher on all three cognitive function tests and had higher composite z-scores compared to the low-GNRI group.
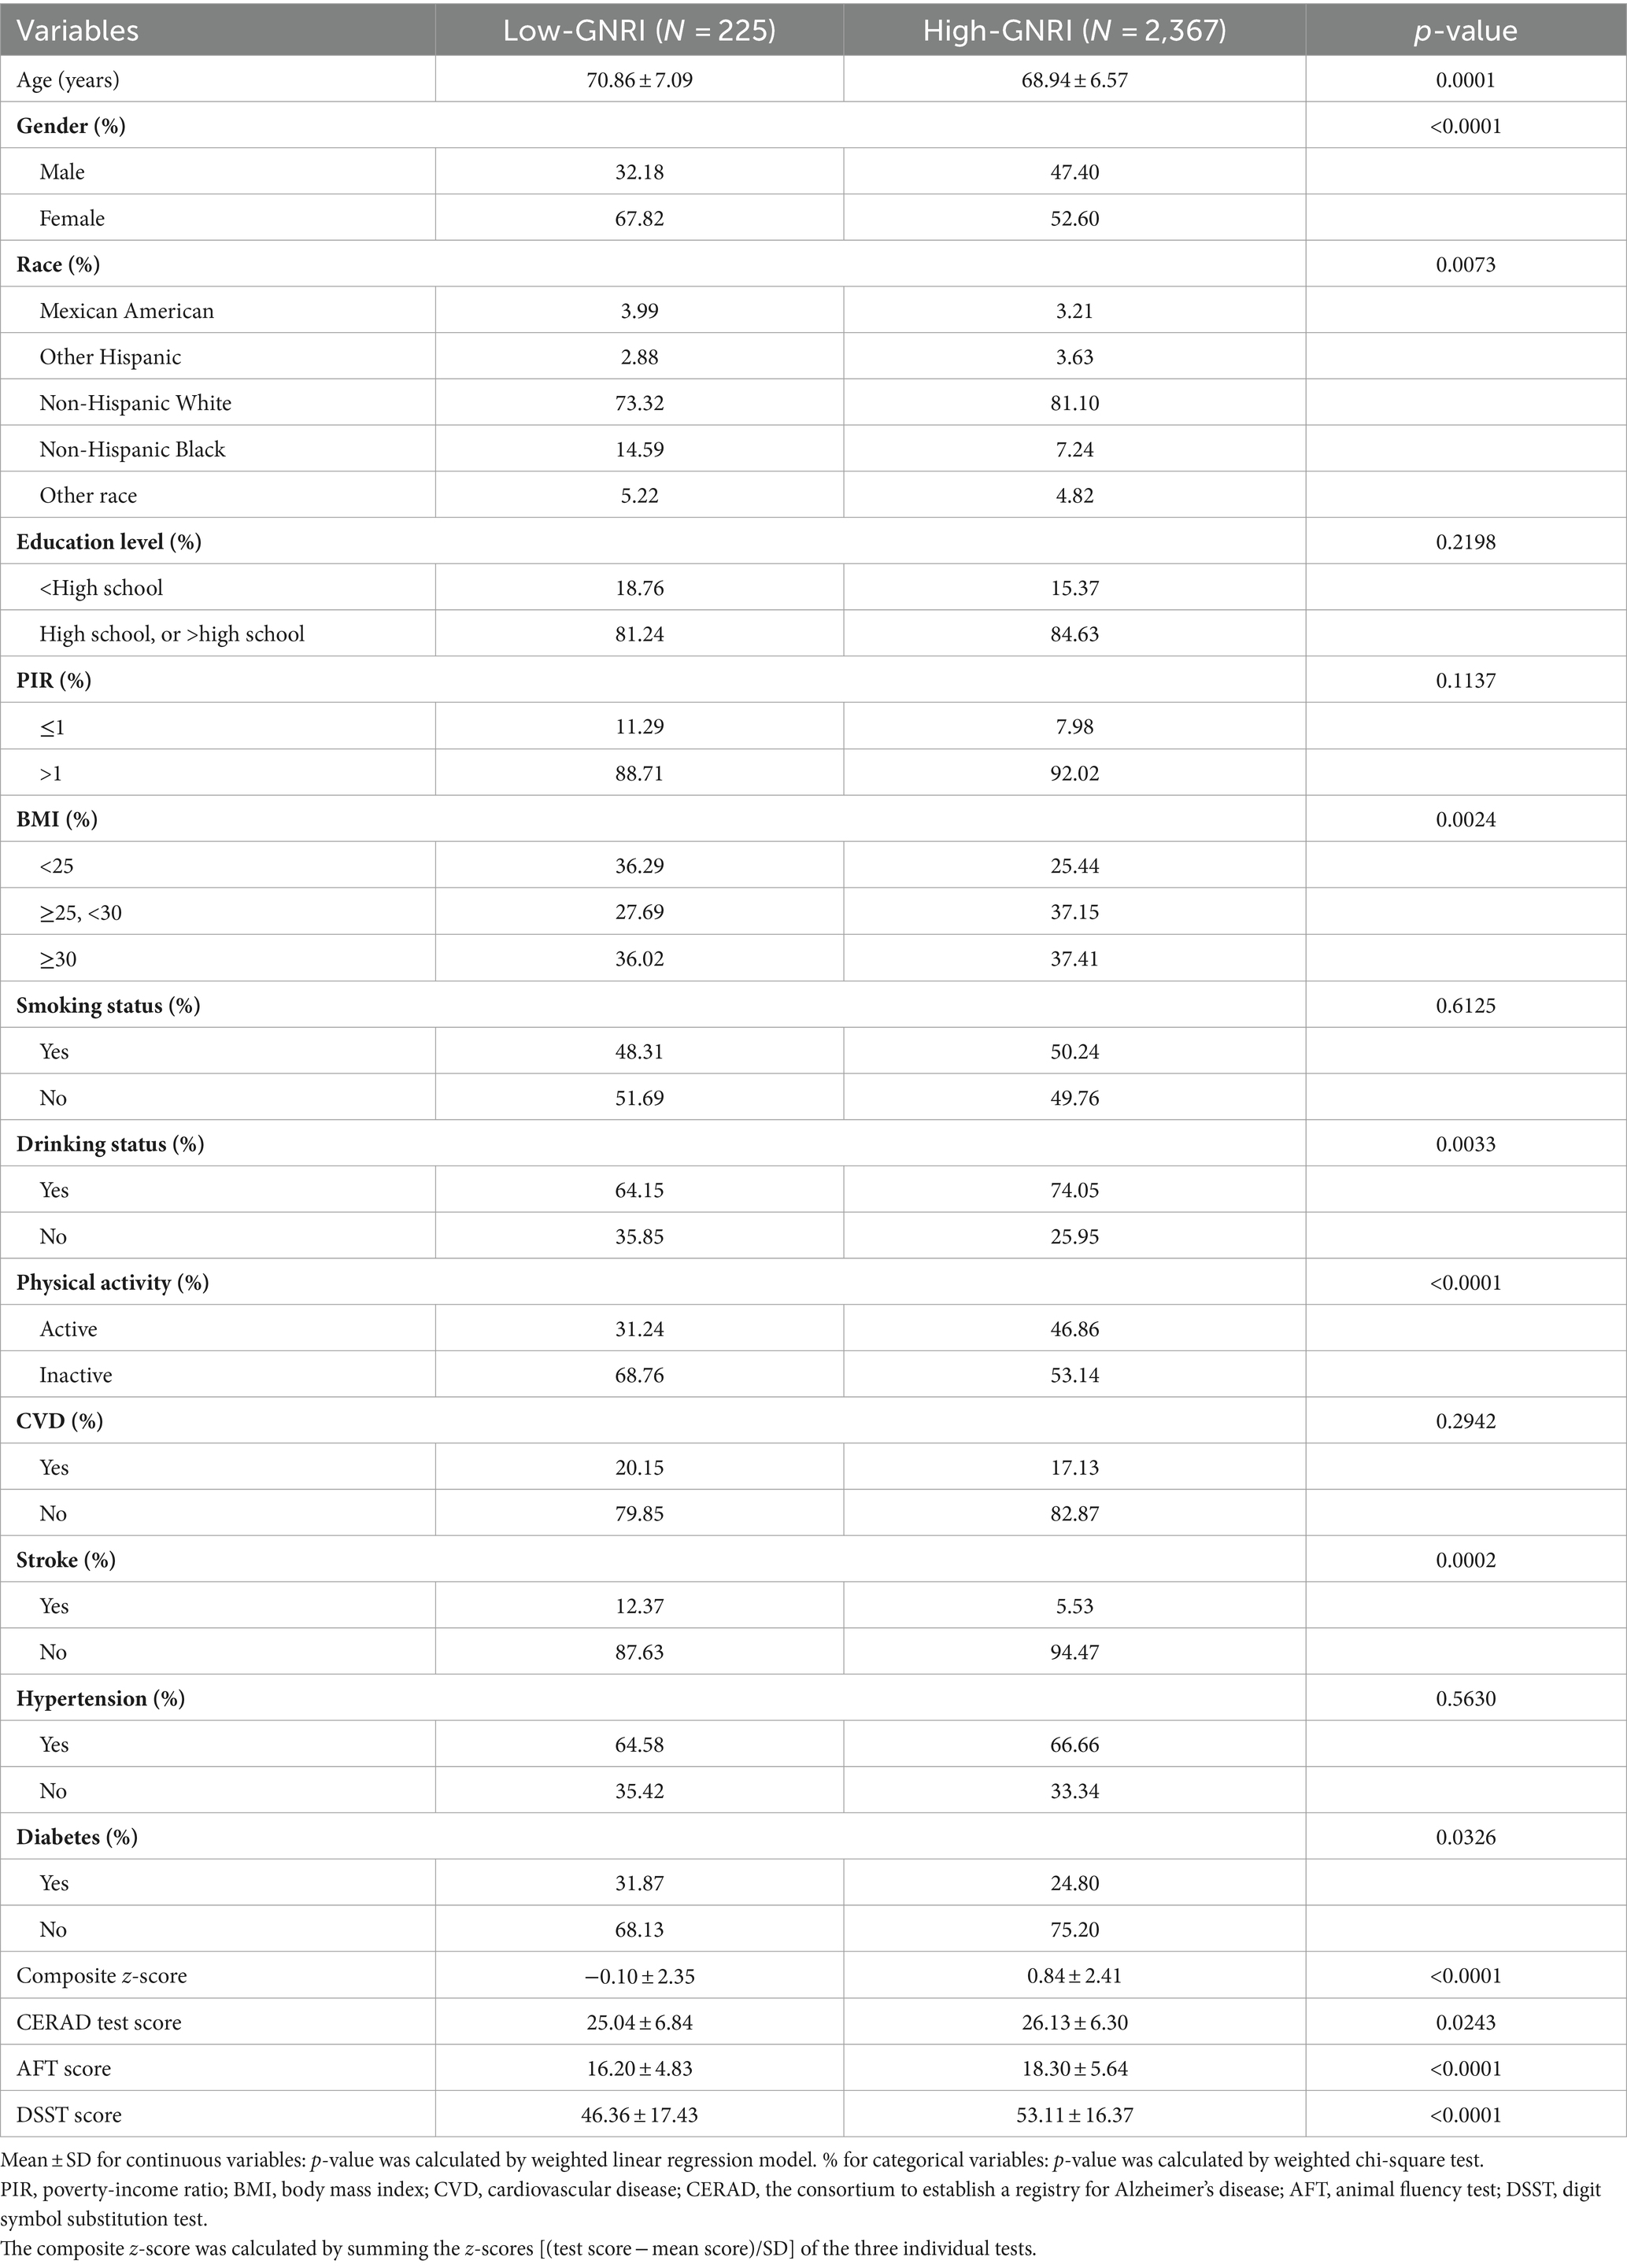
Table 1. Weighted characteristics of study population based on different GNRI levels.
3.2 Composite z-scores distribution of participants in the high-GNRI and low-GNRI group
Participants in the high-GNRI group had higher composite z-scores compared to the low-GNRI group, suggesting higher global cognitive function in the high-GNRI group population. And the difference was statistically significant (p-value <0.0001) (Figure 2).
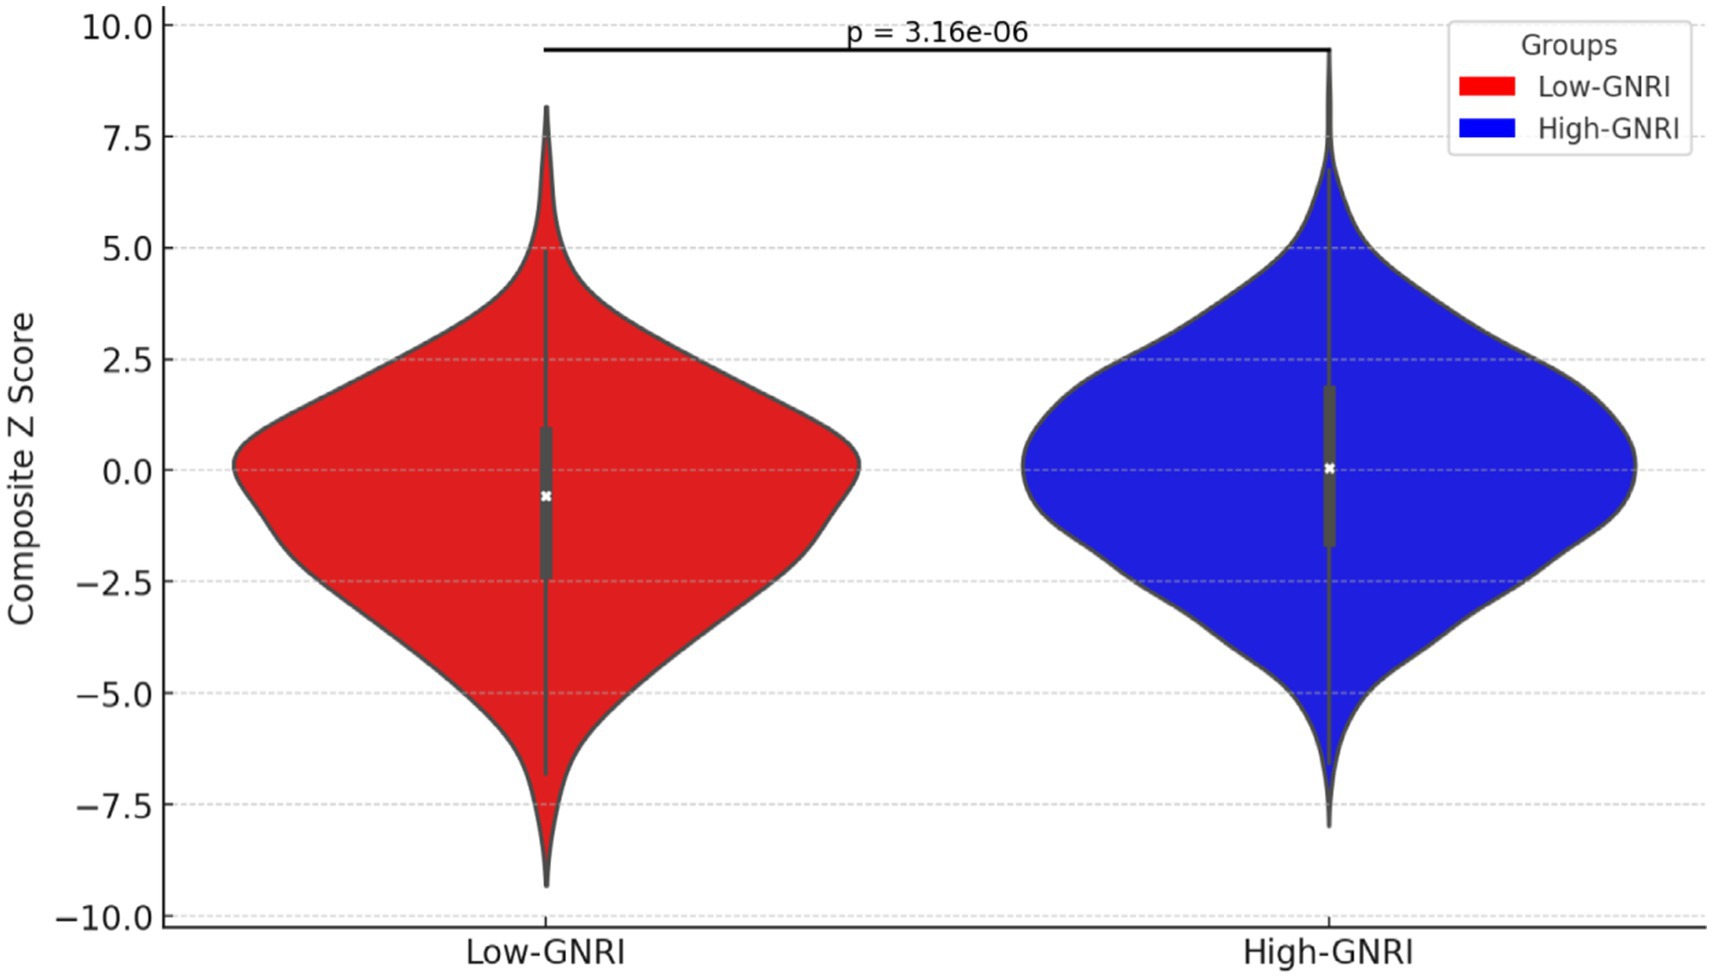
Figure 2. Violin plot of composite z-scores distribution in high-GNRI and low-GNRI group participants.
3.3 The association between GNRI levels and cognitive function
The outcomes of the multivariate logistic regression analyses are detailed in Table 2. After adjusting for all covariates, the significant positive correlation was observed between total GNRI and scores from the AFT, DSST, and composite z-scores. Specifically, for each unit increase in total GNRI, there was an increase of 0.050 points in AFT scores (β = 0.050, 95% CI 0.005–0.096, p-value = 0.0258), 0.192 points in DSST scores (β = 0.192, 95% CI 0.078–0.305, p-value = 0.0010), and 0.027 points in composite z-scores (β = 0.027, 95% CI 0.010–0.044, p-value = 0.0024). Additionally, when analyzed by GNRI levels, the GNRI levels in the high-GNRI group were significantly associated with better outcomes in cognitive functioning. Compared to the low-GNRI group, the high-GNRI group exhibited significantly higher AFT scores (β = 0.922, 95% CI 0.166–1.677, p-value = 0.0169) and DSST scores (β = 2.791, 95% CI 0.884–4.698, p-value = 0.0042). Furthermore, the higher GNRI levels were also significantly and positively correlated with higher composite z-scores, reflecting overall cognitive functioning (β = 0.405, 95% CI 0.115–0.695, p-value = 0.0062).
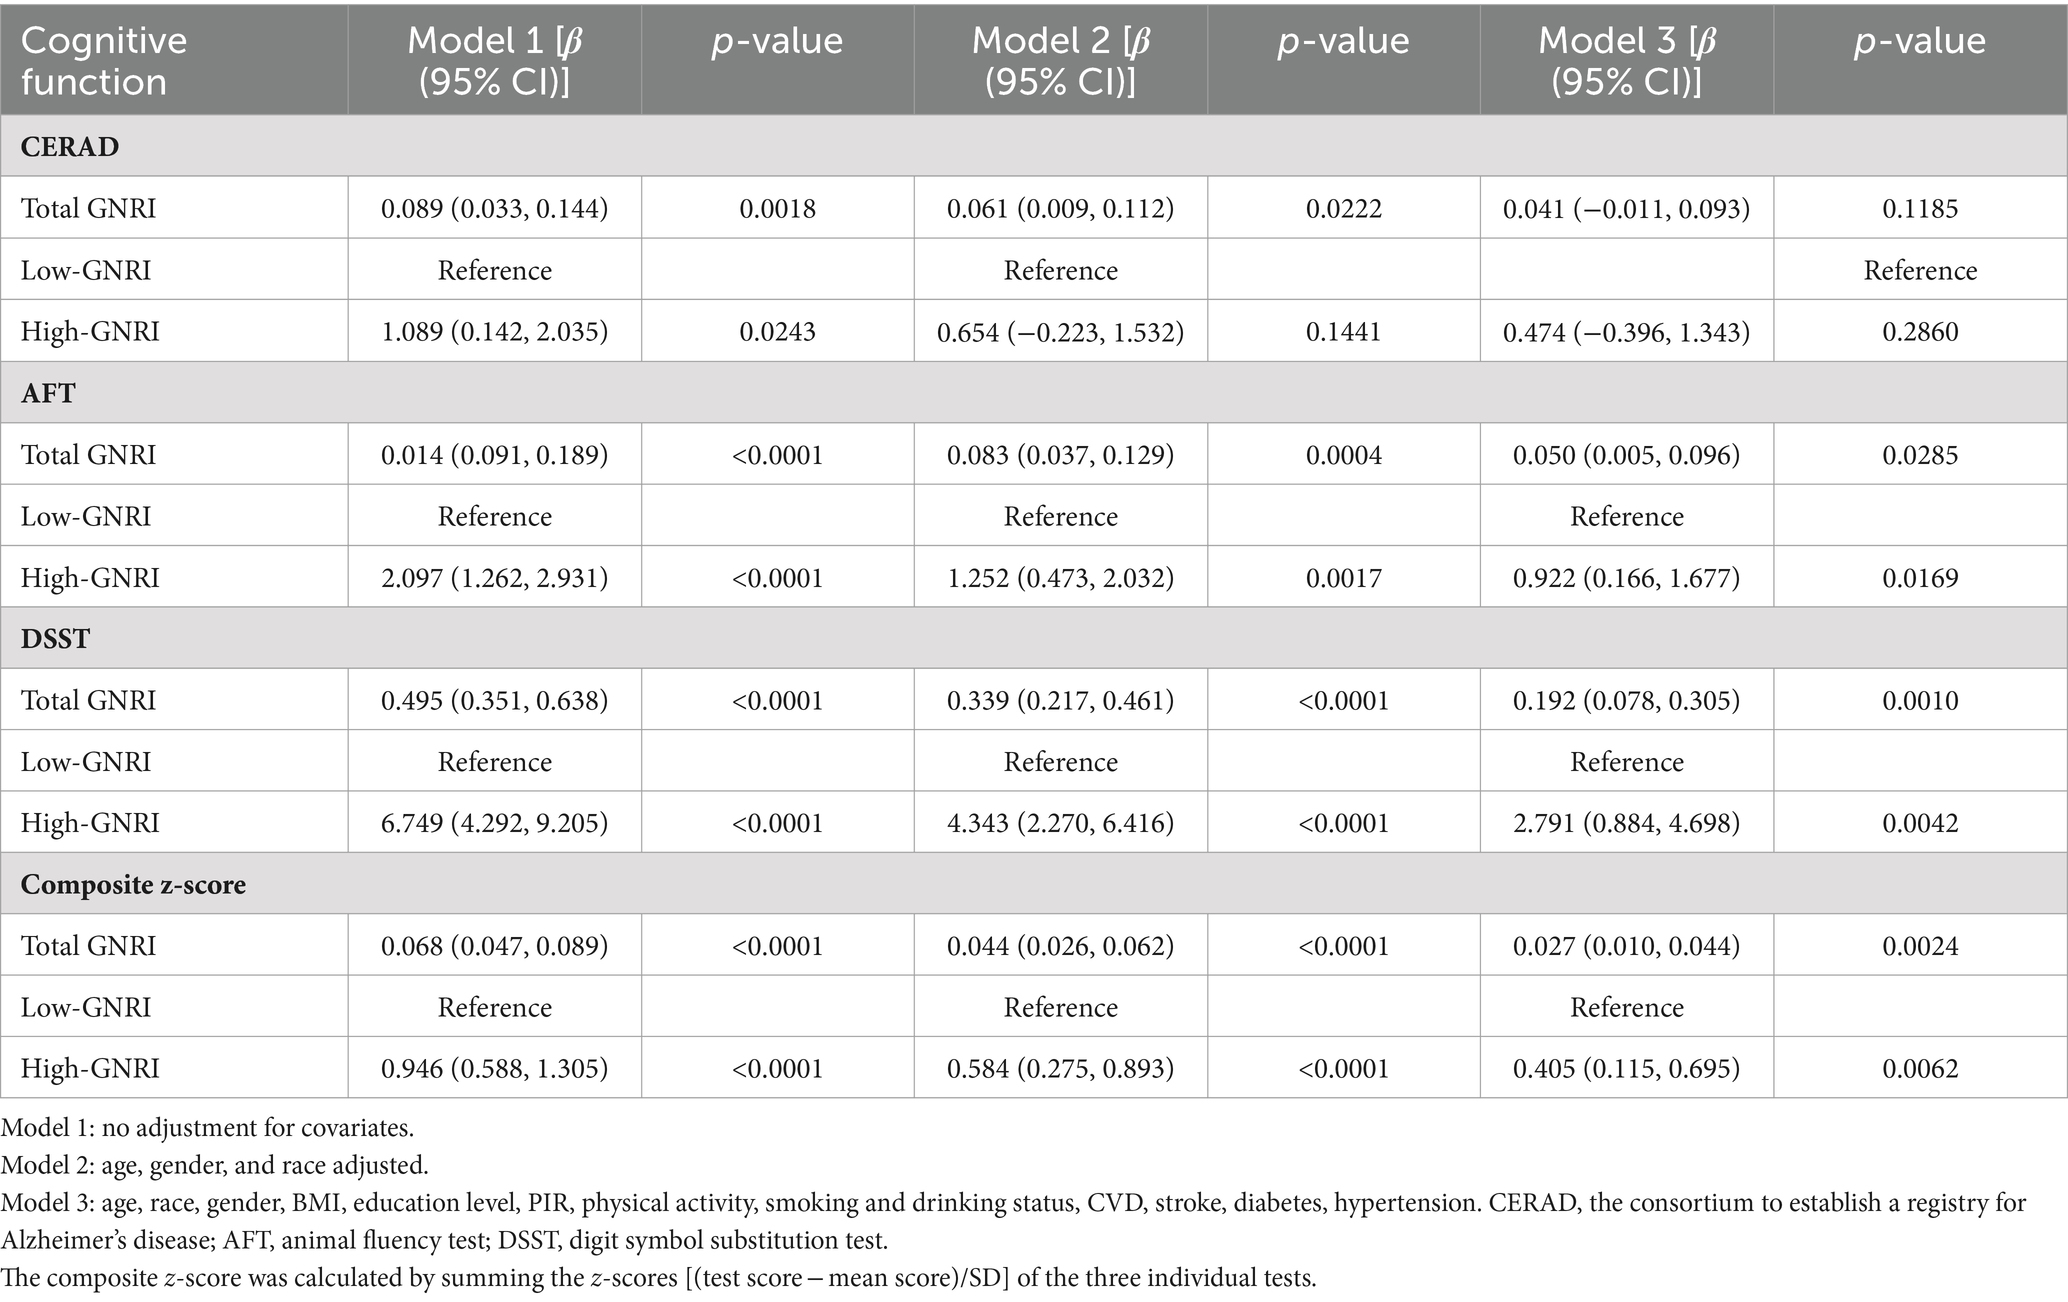
Table 2. Logistic regression analysis for associations between GNRI and cognitive function scores.
3.4 Non-linear relationship between the GNRI and cognitive performance
The non-linear positive association between the GNRI and the three cognitive test scores, as well as the composite z-scores, were confirmed through smoothed curve fitting analyses, as shown in Figure 3. Furthermore, the non-linear U-shaped relationship between GNRI and global cognitive function was identified using a two-segment linear regression model, with calculated threshold effects presented in Table 3.
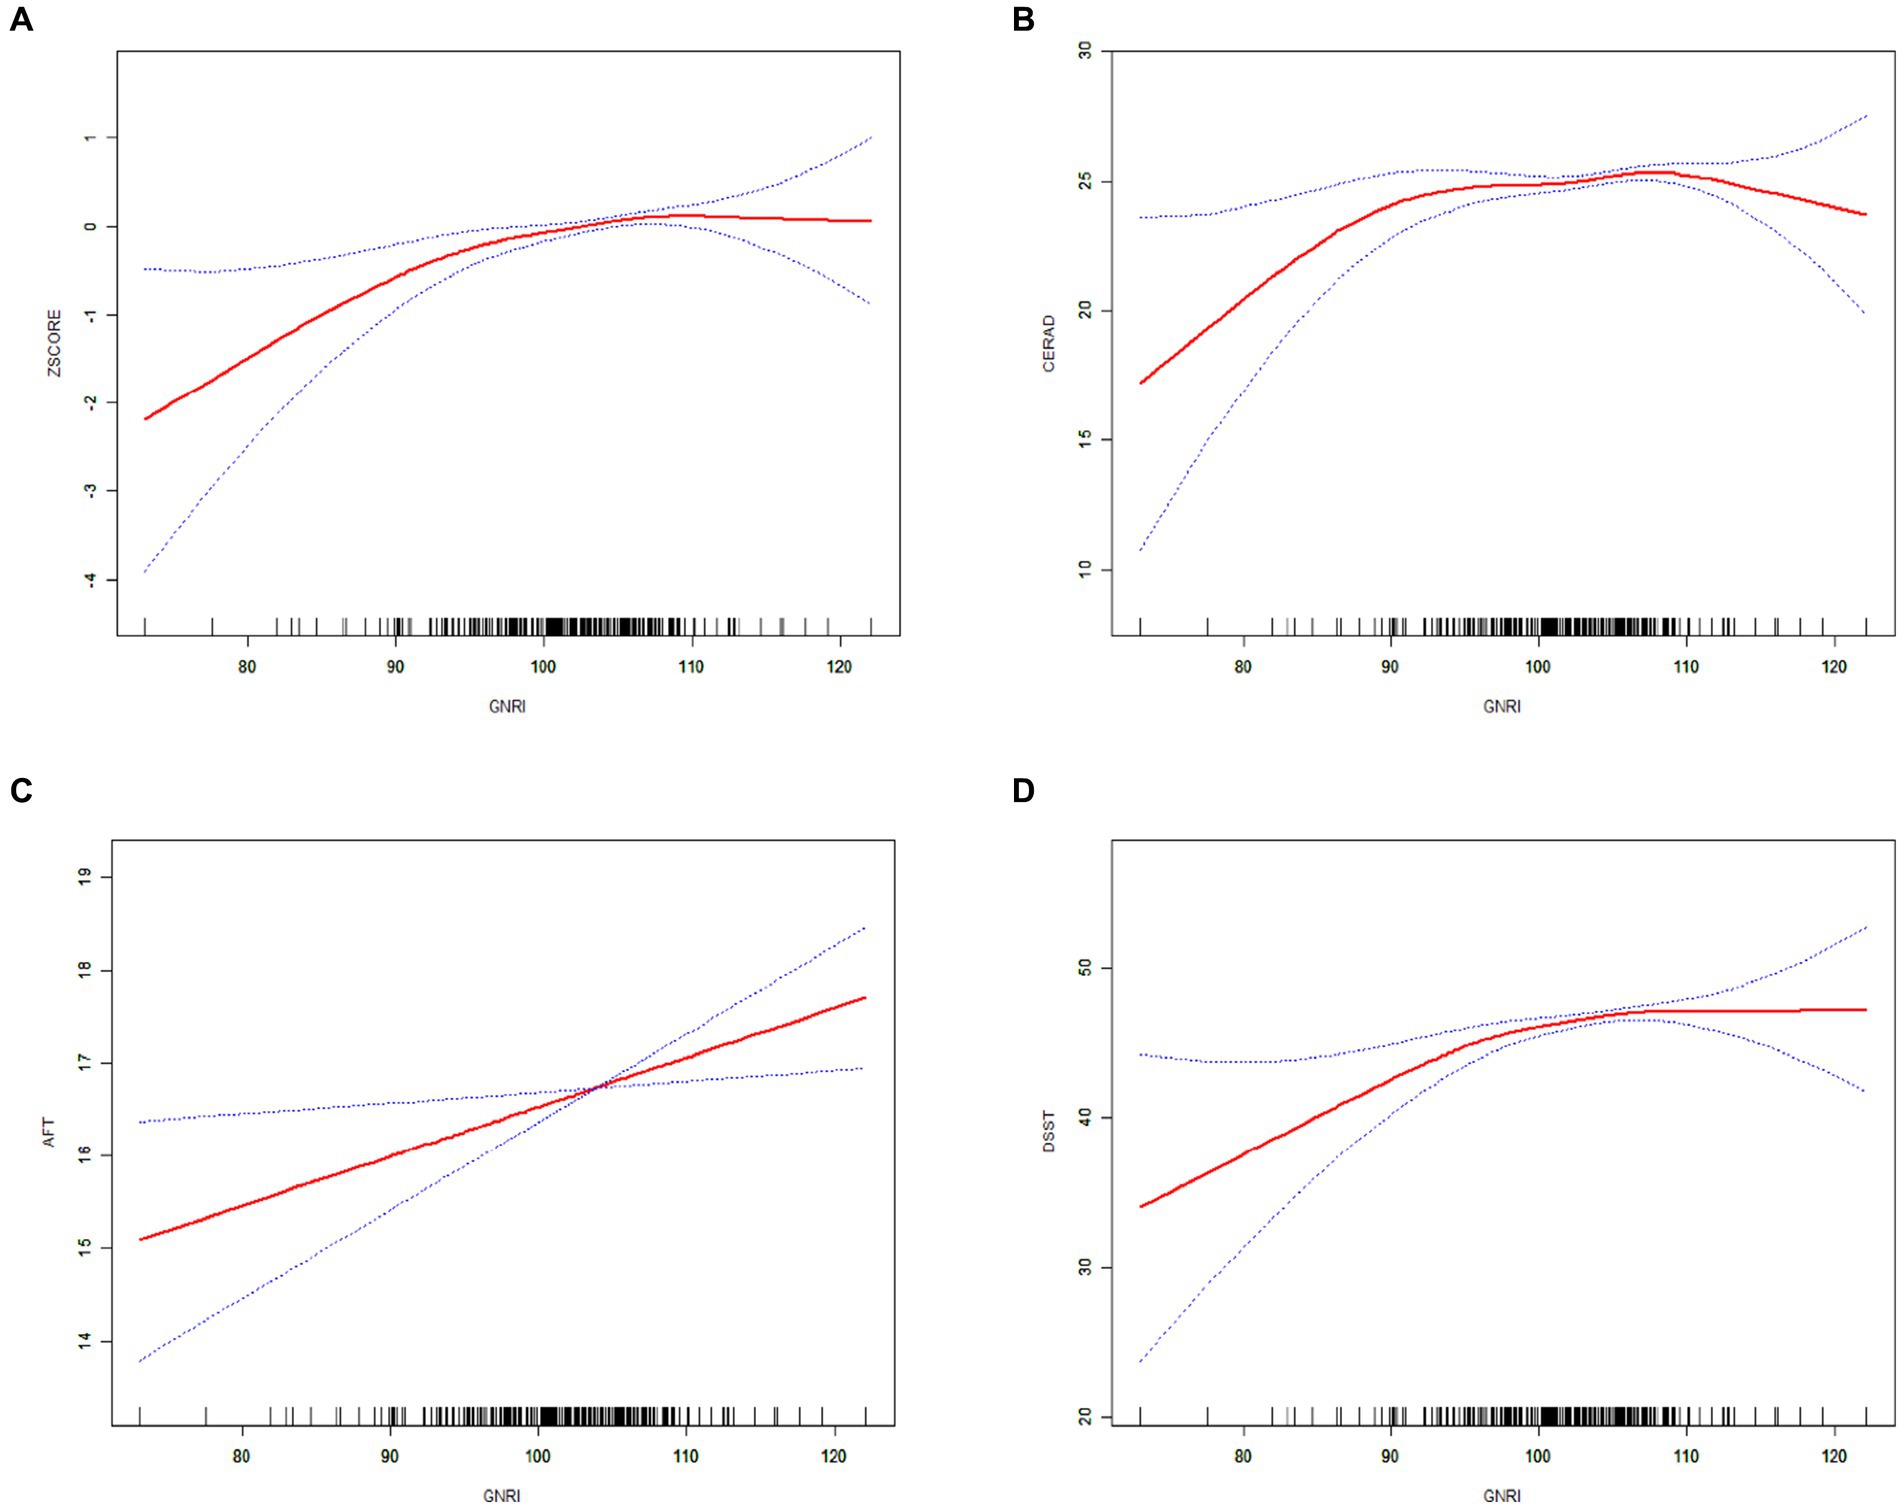
Figure 3. The solid red line indicates a smooth curve fit between the GNRI and cognitive performance. Blue bars indicate 95% of the fitted confidence intervals. (A) GNRI and composite z-score. (B) GNRI and CERAD. (C) GNRI and AFT. (D) GNRI and DSST.
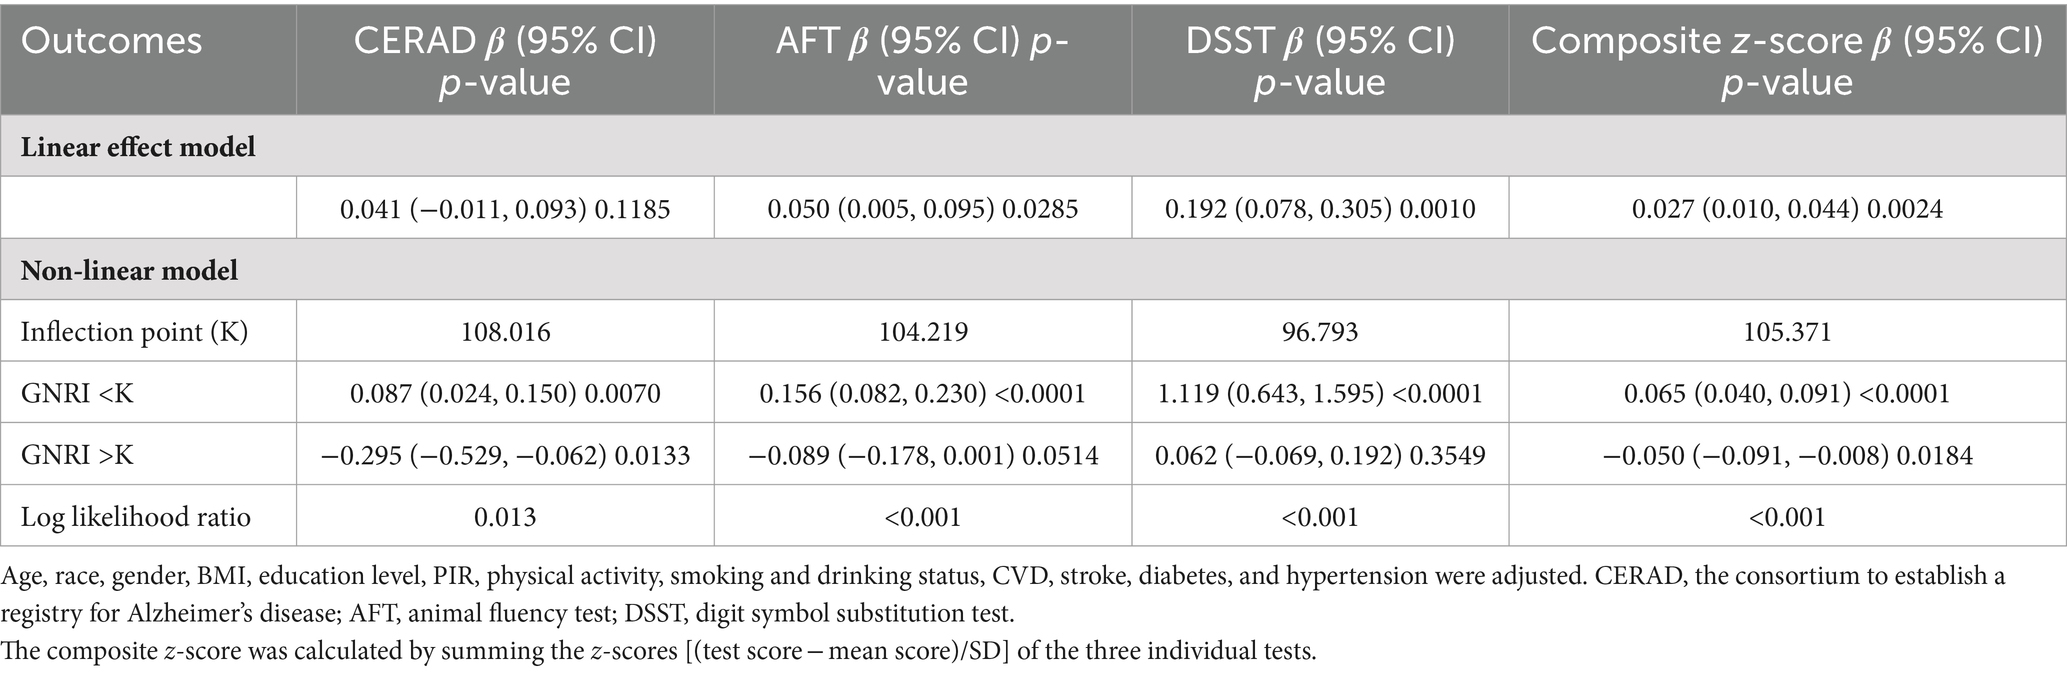
Table 3. Threshold effect analysis of GNRI on cognitive function using a two-segment linear regression model.
The smoothed curve depicting the relationship between GNRI and the global cognitive function revealed an inflection point at a GNRI value of 105.37. On the left side of this inflection point, there was a positive association with an increase in GNRI associated with improved cognitive scores (CERAD β = 0.087; 95% CI: 0.024, 0.150; p-value = 0.0070; composite z-scores β = 0.065; 95% CI: 0.040, 0.091; p-value <0.0001). Conversely, on the right side of the inflection point, the association turned negative, indicating that higher GNRI values beyond this point were associated with cognitive decline (CERAD β = −0.295; 95% CI: −0.529, −0.062; p-value = 0.0133, composite z-scores β = −0.050; 95% CI: −0.091, −0.008; p-value = 0.0184).
3.5 Subgroup analysis
Finally, we implemented adaptive subgroup analyses and interaction tests stratified by all confounders to evaluate the consistency of the correlation between high GNRI and overall cognitive functioning, and to identify potential differences among specific populations, as depicted in Figure 4. The results indicated that participants with diabetes exhibited a significant positive correlation between overall cognitive function and GNRI. This positive correlation was notably absent in non-diabetic patients, with the interaction effect reaching statistical significance (p for interaction = 0.0423). Furthermore, participants with a history of cardiovascular disease (CVD) demonstrated a tendency to have higher cognitive functioning with increased GNRI, which was marginally significant (p-value = 0.0498).
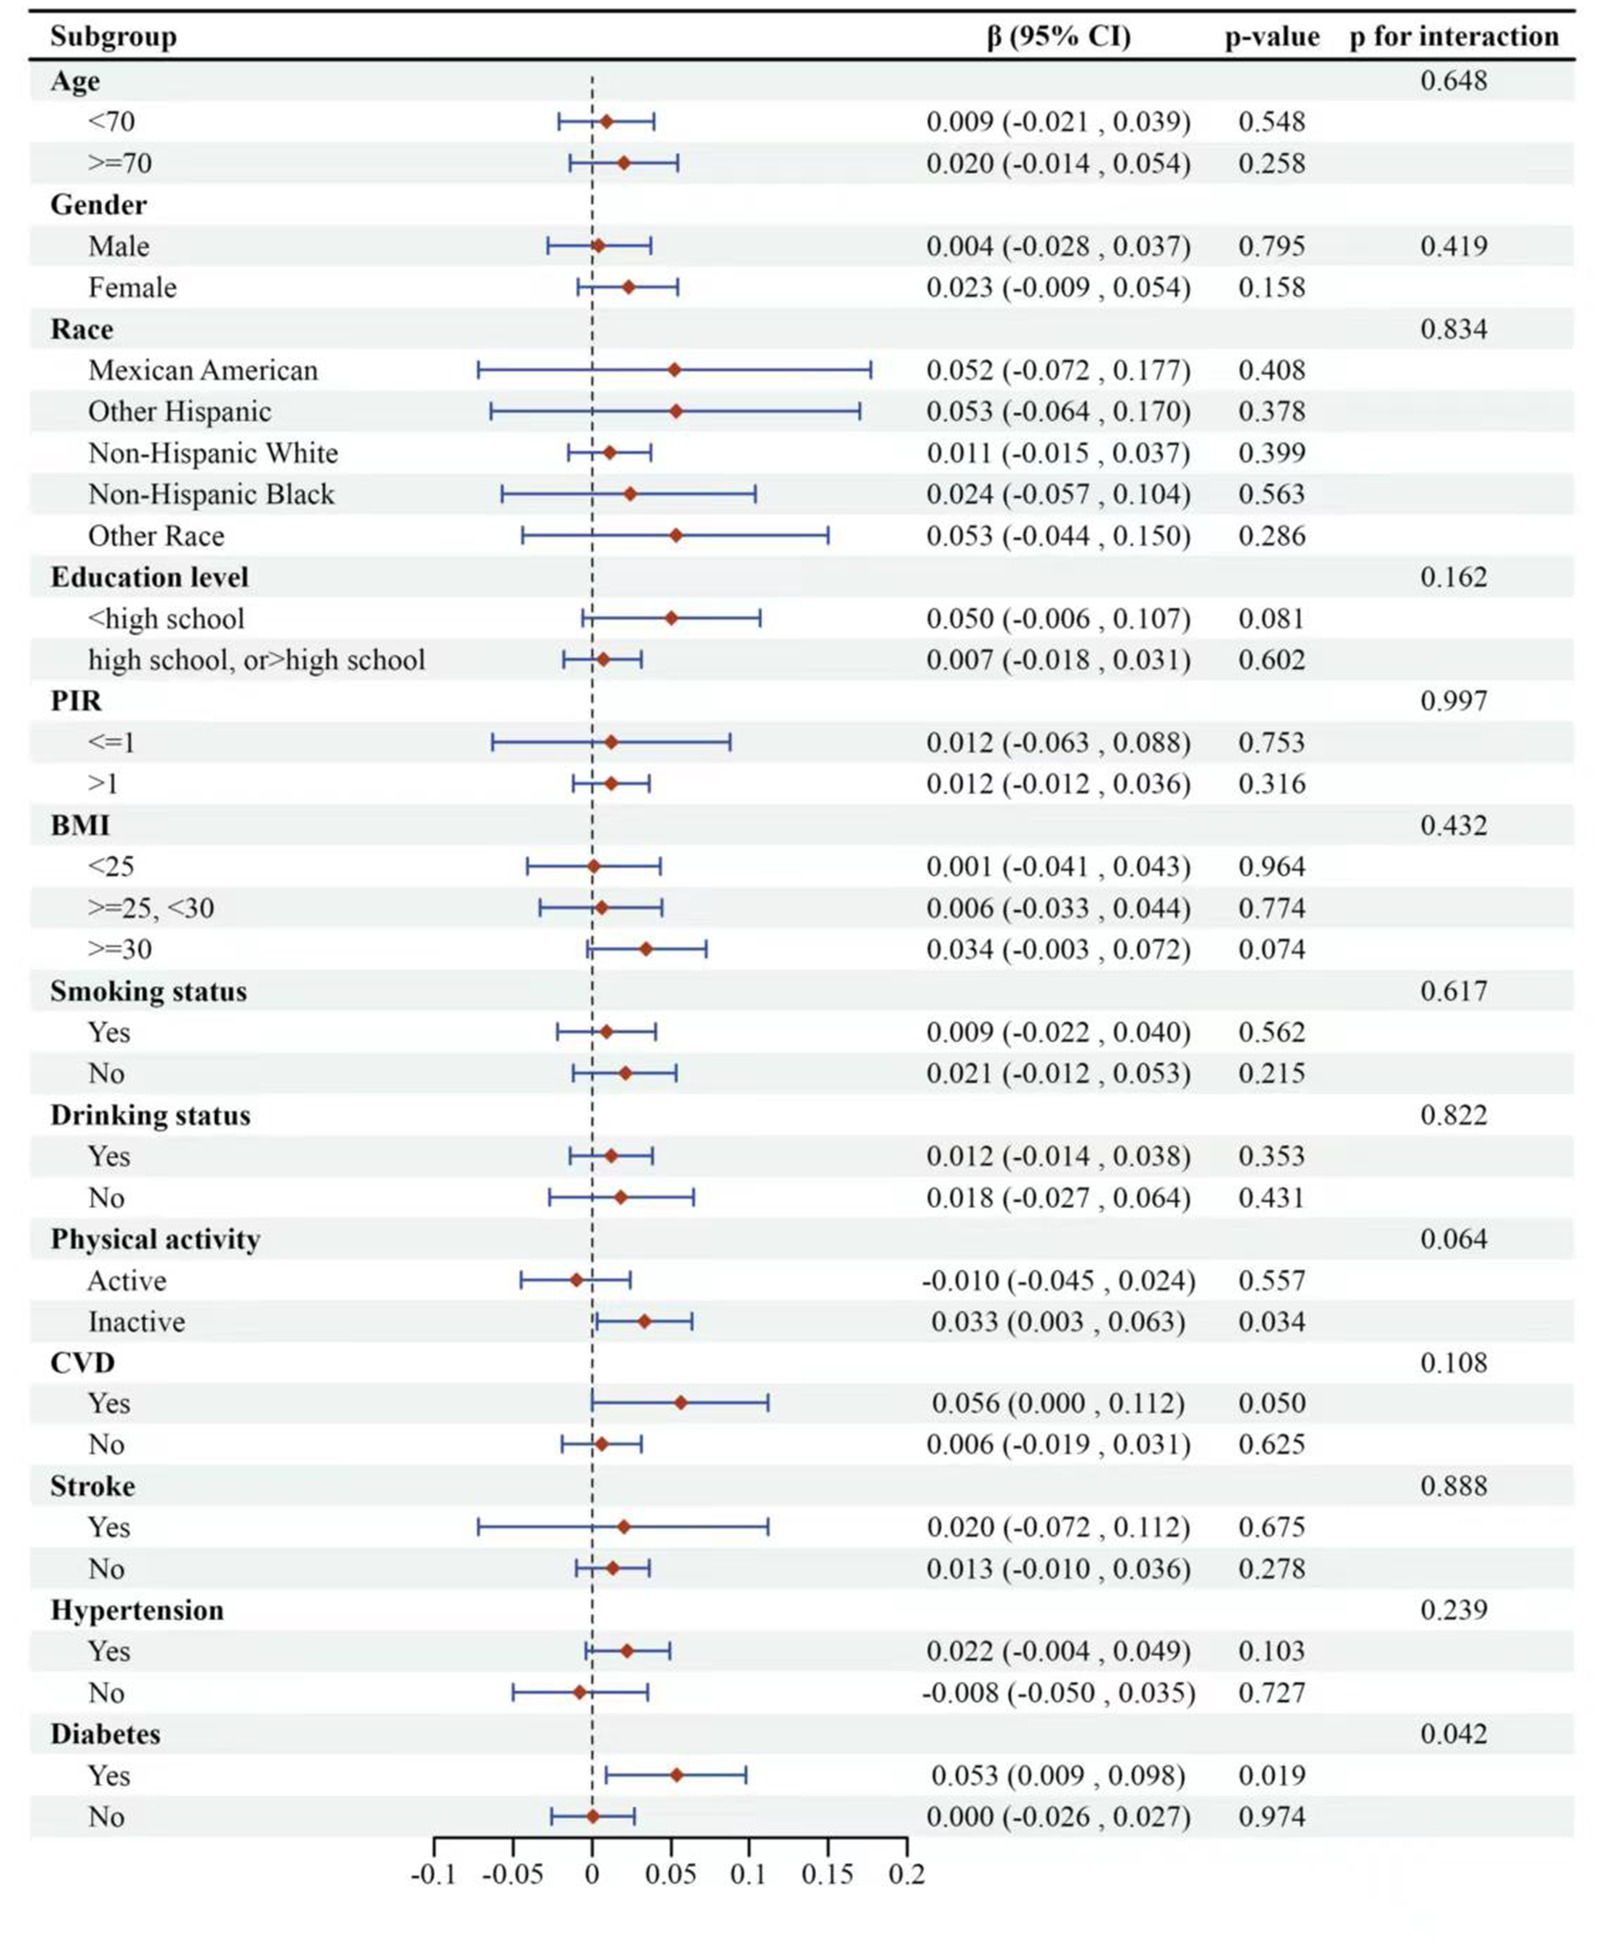
Figure 4. Subgroup logistic regression analysis for the association between high-GNRI and global cognitive function. The global cognitive function was represented by composite z-scores. Low-GNRI was the control group.
Among the other covariates examined, the association between GNRI and global cognitive function remained consistent across the remaining subgroups, with no significant interactions observed (p for interaction >0.05). The analysis suggested that GNRI’s impact on cognitive function may vary depending on the presence of specific health conditions like diabetes and CVD.
4 Discussion
Our results demonstrated that the GNRI is significantly and positively correlated with the AFT, DSST and composite z-scores, even after adjusting for potential confounding variables. These findings indicated that a lower GNRI is linked to declines across multiple cognitive domains and global cognitive deterioration.
Upon categorizing participants based on their nutritional status (GNRI <98; GNRI ≥98), our analysis revealed a positive correlation between GNRI and cognitive functioning in older adults who maintain a normal nutritional status (GNRI ≥98), as opposed to those considered malnourished (GNRI <98).
Previous investigations into the association between the GNRI and cognitive function in older adults have been limited, with most research focusing on malnutrition as assessed by GNRI and yielding mixed results. For instance, a longitudinal analysis from the Chinese Longitudinal Healthy Longevity Survey (CLHLS) found a linear relationship between malnutrition risk (GNRI ≤98) and declining cognitive function, indicating that worsening malnutrition correlates with deteriorating cognitive abilities (26). Additionally, a study of an elderly Chinese stroke population identified a low GNRI (<98) as a predictive marker for post-stroke cognitive impairment (27). However, other studies have reported differing outcomes; for example, Lee et al. (28) found no significant association between GNRI and cognitive impairment risk among hemodialysis patients. And Xu et al. (29) observed no significant link between GNRI and cognitive function indicators in elderly patients with coronary artery disease. These divergent findings may be attributable to the specific diseases affecting the study populations or the varying methodologies employed in assessing cognitive function. Consistent with some prior studies, our research also observed lower cognitive function among malnourished participants, highlighting the ongoing need for extensive research to further elucidate the relationship between GNRI and cognitive function.
Additionally, previous evidence suggested that cognitive decline and the progression of dementia can potentially be mitigated through nutritional supplementation and maintaining a healthy diet (30). Notably, the combined intake of multiple B vitamins such as folic acid, vitamin B6, and vitamin B12 has been shown to prevent cognitive decline by inhibiting the accumulation of homocysteine (31–33). Furthermore, there is an expanding body of evidence supporting the role of n − 3 fatty acids, vitamins D and E, and plant-derived vitamins in preventing cognitive deterioration and potentially dementia (33–36). On the other hand, an increasing number of studies have identified a negative correlation between the consumption of trans fats and added sugars and cognitive function (37, 38), suggesting that higher nutritional status may paradoxically lead to diminished cognitive performance. This aligns with our findings where smoothed curve fitting and threshold effect analyses revealed that higher GNRI levels were negatively associated with both CERAD scores and composite z-scores as GNRI increased. Consequently, a higher nutritional status does not necessarily eliminate the risk of cognitive decline. Effective prevention might be achievable through maintaining an optimal GNRI by adopting a balanced nutritional intake and following a healthy dietary pattern (39).
The mechanism by which the GNRI appears to be associated with cognitive function is unclear. The main reason may be that GNRI is a valid indicator for assessing nutritional status, which has been shown to be strongly associated with cognitive function (16–18), although the exact mechanism is still unclear. GNRI is calculated on the basis of height (cm), body weight (kg), ideal body weight (kg), and serum albumin (18). Therefore, the relationship between GNRI and cognitive function may be related to albumin and BMI. Recent studies have shown that higher albumin levels are associated with a lower risk of cognitive impairment, suggesting that maintaining high levels of albumin may benefit cognitive function in older adults (12, 40, 41). This may be because albumin itself is closely related to nutritional status (42). Reduced albumin levels may interfere with the blood supply to the central nervous system and may disrupt the oxidant/antioxidant balance, contributing to the development of cognitive impairment (43–46). Similarly, BMI, an assessment index for obesity, has been consistently shown to be strongly associated with cognitive function, but the findings were controversial. Some studies have suggested that overweight older adults have a lower risk of developing CI or dementia (47, 48). However, recent studies have shown that higher BMI is associated with poorer cognitive functioning in older adults (49, 50), which may also account for the cognitive decline seen in participants with excessive GNRI. And some studies have found significant correlations between GNRI and the prevalence of diabetes, stroke, and depression (18, 51, 52). Therefore, it is possible that GNRI indirectly affects cognitive function through the above factors (53–55).
The study addressed the underexplored relationship between the geriatric nutritional risk index (GNRI) and cognitive function among a representative cohort of U.S. older adults. We found a significant positive correlation between GNRI and cognitive function. However, excessively high GNRI values were also associated with declines in cognitive performance. This suggested that GNRI could potentially serve as a reliable predictor of cognitive decline in clinical settings, further emphasizing the link between malnutrition and cognitive function.
Our research, a cross-sectional analysis based on data from the NHANES, benefited from the representativeness of the NHANES sample, providing a more accurate reflection of the older American population compared to other studies. We utilized various cognitive tests to evaluate different cognitive abilities among older adults, alongside composite z-scores for an overall assessment of cognitive function. The substantial sample size facilitated subgroup analyses, enhancing our understanding of the GNRI-cognitive function relationship across different demographics. Nonetheless, our study is not without limitations. The cross-sectional nature of NHANES restricts our ability to track changes in nutritional status and cognitive function over time or to establish a causal relationship between these variables. Additionally, some variables in NHANES come from questionnaires and self-reports, which are prone to biases. And the evidence from the U.S. may not be generalizable to other populations due to differences in genetic origin and socioeconomics conditions. Furthermore, of a total 3,632 elderly people, 1,040 (28%) were excluded due to missing data on covariates, which may have affected the results. Consequently, future multicenter longitudinal clinical trials with extended follow-ups are essential to more definitively determine the relationship between GNRI and cognitive function in the aging population.
5 Conclusion
In a representative cohort of older Americans, our study reinforced the link between malnutrition and cognitive decline. Additionally, our findings indicated that higher geriatric nutritional risk index (GNRI) levels correlate with improved cognitive function. However, there may be instances where increased GNRI levels within a normal nutritional status could lead to cognitive deterioration. This implies that GNRI could serve as a valuable tool for predicting changes in cognitive function in clinical environments in the future.
Data availability statement
The original contributions presented in the study are included in the article/supplementary material, further inquiries can be directed to the corresponding author.
Ethics statement
The studies involving humans were approved by National Center for Health Statistics. The studies were conducted in accordance with the local legislation and institutional requirements. The participants provided their written informed consent to participate in this study.
Author contributions
ZT: Conceptualization, Data curation, Formal analysis, Methodology, Visualization, Writing – original draft, Writing – review & editing. YN: Data curation, Formal analysis, Methodology, Software, Writing – original draft, Writing – review & editing. NY: Methodology, Software, Supervision, Validation, Writing – original draft, Writing – review & editing.
Funding
The author(s) declare that no financial support was received for the research, authorship, and/or publication of this article.
Acknowledgments
The authors thank all members of the NHANES teams for surveys and data collection throughout the United States.
Conflict of interest
The authors declare that the research was conducted in the absence of any commercial or financial relationships that could be construed as a potential conflict of interest.
Publisher’s note
All claims expressed in this article are solely those of the authors and do not necessarily represent those of their affiliated organizations, or those of the publisher, the editors and the reviewers. Any product that may be evaluated in this article, or claim that may be made by its manufacturer, is not guaranteed or endorsed by the publisher.
Abbreviations
GNRI, Geriatric nutritional risk index; NHANES, National Health and Nutrition Examination Survey; CERAD, Alzheimer’s Disease Registry; AFT, Animal fluency test; DSST, Digit symbol substitution test; CI, Cognitive impairment; MNA, Mini nutritional assessment; MNA-SF, Mini nutritional assessment-short form; NCHS, National Center for Health Statistics; PIR, Poverty-to-income ratio; BMI, Body mass index; CVD, Cardiovascular diseases.
References
1. Karr, JE, Graham, RB, Hofer, SM, and Muniz-Terrera, G. When does cognitive decline begin? A systematic review of change point studies on accelerated decline in cognitive and neurological outcomes preceding mild cognitive impairment, dementia, and death. Psychol Aging. (2018) 33:195–218. doi: 10.1037/pag0000236
2. Daviglus, ML, Bell, CC, Berrettini, W, Bowen, PE, Connolly, ES Jr, Cox, NJ, et al. National Institutes of Health State-of-the-Science Conference statement: preventing Alzheimer disease and cognitive decline. Ann Intern Med. (2010) 153:176–81. doi: 10.7326/0003-4819-153-3-201008030-00260
3. Shahnawaz, Z, Reppermund, S, Brodaty, H, Crawford, JD, Draper, B, Trollor, JN, et al. Prevalence and characteristics of depression in mild cognitive impairment: the Sydney memory and ageing study. Acta Psychiatr Scand. (2013) 127:394–402. doi: 10.1111/acps.12008
4. Hill, NT, Mowszowski, L, Naismith, SL, Chadwick, VL, Valenzuela, M, and Lampit, A. Computerized cognitive training in older adults with mild cognitive impairment or dementia: a systematic review and meta-analysis. Am J Psychiatry. (2017) 174:329–40. doi: 10.1176/appi.ajp.2016.16030360
5. GBD 2019 Dementia Forecasting Collaborators. Estimation of the global prevalence of dementia in 2019 and forecasted prevalence in 2050: an analysis for the Global Burden of Disease Study 2019. Lancet Public Health. (2022) 7:e105–25. doi: 10.1016/s2468-2667(21)00249-8
6. Tisher, A, and Salardini, A. A comprehensive update on treatment of dementia. Semin Neurol. (2019) 39:167–78. doi: 10.1055/s-0039-1683408
7. Anstey, KJ, Cherbuin, N, and Herath, PM. Development of a new method for assessing global risk of Alzheimer’s disease for use in population health approaches to prevention. Prev Sci. (2013) 14:411–21. doi: 10.1007/s11121-012-0313-2
8. Valls-Pedret, C, Sala-Vila, A, Serra-Mir, M, Corella, D, de la Torre, R, Martínez-González, M, et al. Mediterranean diet and age-related cognitive decline: a randomized clinical trial. JAMA Intern Med. (2015) 175:1094–103. doi: 10.1001/jamainternmed.2015.1668
9. Mantzorou, M, Vadikolias, K, Pavlidou, E, Serdari, A, Vasios, G, Tryfonos, C, et al. Nutritional status is associated with the degree of cognitive impairment and depressive symptoms in a Greek elderly population. Nutr Neurosci. (2020) 23:201–9. doi: 10.1080/1028415x.2018.1486940
10. Shi, R, Duan, J, Deng, Y, Tu, Q, Cao, Y, Zhang, M, et al. Nutritional status of an elderly population in Southwest China: a cross-sectional study based on comprehensive geriatric assessment. J Nutr Health Aging. (2015) 19:26–32. doi: 10.1007/s12603-014-0471-y
11. Travica, N, Ried, K, Sali, A, Scholey, A, Hudson, I, and Pipingas, A. Vitamin C status and cognitive function: a systematic review. Nutrients. (2017) 9:960. doi: 10.3390/nu9090960
12. Hu, Y, Lin, D, Song, M, Wu, D, Zhang, Y, Li, G, et al. Sex and race differences in the association of albumin with cognitive function in older adults. Brain Behav. (2024) 14:e3435. doi: 10.1002/brb3.3435
13. Chye, L, Wei, K, Nyunt, MSZ, Gao, Q, Wee, SL, and Ng, TP. Strong relationship between malnutrition and cognitive frailty in the Singapore longitudinal ageing studies (SLAS-1 and SLAS-2). J Prev Alzheimers Dis. (2018) 5:142–8. doi: 10.14283/jpad.2017.46
14. Assis, APM, de Oliveira, BTN, Gomes, AL, Soares, ADN, Guimarães, NS, and Gomes, JMG. The association between nutritional status, advanced activities of daily living, and cognitive function among Brazilian older adults living in care homes. Geriatr Nurs. (2020) 41:899–904. doi: 10.1016/j.gerinurse.2020.06.014
15. Bouillanne, O, Morineau, G, Dupont, C, Coulombel, I, Vincent, JP, Nicolis, I, et al. Geriatric nutritional risk index: a new index for evaluating at-risk elderly medical patients. Am J Clin Nutr. (2005) 82:777–83. doi: 10.1093/ajcn/82.4.777
16. NAS, AA, Mohd Fahmi Teng, NI, and Kamarul Zaman, M. Geriatric nutrition risk index is comparable to the mini nutritional assessment for assessing nutritional status in elderly hospitalized patients. Clin Nutr ESPEN. (2019) 29:77–85. doi: 10.1016/j.clnesp.2018.12.002
17. Huo, X, Wu, M, Gao, D, Zhou, Y, Han, X, Lai, W, et al. Geriatric nutrition risk index in the prediction of all-cause and cardiovascular mortality in elderly hypertensive population: NHANES 1999–2016. Front Cardiovasc Med. (2023) 10:1203130. doi: 10.3389/fcvm.2023.1203130
18. Li, Z, Zhang, L, Yang, Q, Zhou, X, Yang, M, Zhang, Y, et al. Association between geriatric nutritional risk index and depression prevalence in the elderly population in NHANES. BMC Public Health. (2024) 24:469. doi: 10.1186/s12889-024-17925-z
19. Morris, JC, Heyman, A, Mohs, RC, Hughes, JP, van Belle, G, Fillenbaum, G, et al. The consortium to establish a registry for Alzheimer’s disease (CERAD). Part I. Clinical and neuropsychological assessment of Alzheimer’s disease. Neurology. (1989) 39:1159–65. doi: 10.1212/wnl.39.9.1159
20. Clark, LJ, Gatz, M, Zheng, L, Chen, YL, McCleary, C, and Mack, WJ. Longitudinal verbal fluency in normal aging, preclinical, and prevalent Alzheimer’s disease. Am J Alzheimers Dis Other Dement. (2009) 24:461–8. doi: 10.1177/1533317509345154
21. Salthouse, TA . What do adult age differences in the digit symbol substitution test reflect? J Gerontol. (1992) 47:P121–8. doi: 10.1093/geronj/47.3.p121
22. Li, W, Li, S, Shang, Y, Zhuang, W, Yan, G, Chen, Z, et al. Associations between dietary and blood inflammatory indices and their effects on cognitive function in elderly Americans. Front Neurosci. (2023) 17:1117056. doi: 10.3389/fnins.2023.1117056
23. Huang, W, Xiao, Y, Wang, H, and Li, K. Association of geriatric nutritional risk index with the risk of osteoporosis in the elderly population in the NHANES. Front Endocrinol. (2022) 13:965487. doi: 10.3389/fendo.2022.965487
24. Wei, B, Dong, Q, Ma, J, and Zhang, A. The association between triglyceride-glucose index and cognitive function in nondiabetic elderly: NHANES 2011–2014. Lipids Health Dis. (2023) 22:188. doi: 10.1186/s12944-023-01959-0
25. Vásquez, E, Batsis, JA, Germain, CM, and Shaw, BA. Impact of obesity and physical activity on functional outcomes in the elderly: data from NHANES 2005–2010. J Aging Health. (2014) 26:1032–46. doi: 10.1177/0898264314535635
26. Sun, B, Zhao, Y, Lu, W, and Chen, Y. The relationship of malnutrition with cognitive function in the older Chinese population: evidence from the Chinese longitudinal healthy longevity survey study. Front Aging Neurosci. (2021) 13:766159. doi: 10.3389/fnagi.2021.766159
27. Lee, M, Lim, JS, Kim, Y, Lee, JH, Kim, CH, Lee, SH, et al. Association between geriatric nutritional risk index and post-stroke cognitive outcomes. Nutrients. (2021) 13:1776. doi: 10.3390/nu13061776
28. Lee, H, Kim, K, Ahn, J, Lee, DR, Lee, JH, and Hwang, SD. Association of nutritional status with osteoporosis, sarcopenia, and cognitive impairment in patients on hemodialysis. Asia Pac J Clin Nutr. (2020) 29:712–23. doi: 10.6133/apjcn.202012_29(4).0006
29. Xu, X, Li, D, and Zhang, S. Retrospective study for correlation analysis of nutritional status with osteoporosis, sarcopenia and cognitive impairment in elderly patients with coronary heart disease. Front Cardiovasc Med. (2023) 10:1335572. doi: 10.3389/fcvm.2023.1335572
30. Tucker, KL . Nutrient intake, nutritional status, and cognitive function with aging. Ann N Y Acad Sci. (2016) 1367:38–49. doi: 10.1111/nyas.13062
31. Tucker, KL, Qiao, N, Scott, T, Rosenberg, I, and Spiro, A 3rd. High homocysteine and low B vitamins predict cognitive decline in aging men: the veterans affairs normative aging study. Am J Clin Nutr. (2005) 82:627–35. doi: 10.1093/ajcn.82.3.627
32. Kim, JM, Kim, SW, Shin, IS, Yang, SJ, Park, WY, Kim, SJ, et al. Folate, vitamin B12, and homocysteine as risk factors for cognitive decline in the elderly. Psychiatry Investig. (2008) 5:36–40. doi: 10.4306/pi.2008.5.1.36
33. Smith, AD, Smith, SM, de Jager, CA, Whitbread, P, Johnston, C, Agacinski, G, et al. Homocysteine-lowering by B vitamins slows the rate of accelerated brain atrophy in mild cognitive impairment: a randomized controlled trial. PLoS One. (2010) 5:e12244. doi: 10.1371/journal.pone.0012244
34. Llewellyn, DJ, Lang, IA, Langa, KM, Muniz-Terrera, G, Phillips, CL, Cherubini, A, et al. Vitamin D and risk of cognitive decline in elderly persons. Arch Intern Med. (2010) 170:1135–41. doi: 10.1001/archinternmed.2010.173
35. Morris, MC, Evans, DA, Bienias, JL, Tangney, CC, and Wilson, RS. Vitamin E and cognitive decline in older persons. Arch Neurol. (2002) 59:1125–32. doi: 10.1001/archneur.59.7.1125
36. Lamport, DJ, Saunders, C, Butler, LT, and Spencer, JP. Fruits, vegetables, 100% juices, and cognitive function. Nutr Rev. (2014) 72:774–89. doi: 10.1111/nure.12149
37. Naqvi, AZ, Harty, B, Mukamal, KJ, Stoddard, AM, Vitolins, M, and Dunn, JE. Monounsaturated, trans, and saturated fatty acids and cognitive decline in women. J Am Geriatr Soc. (2011) 59:837–43. doi: 10.1111/j.1532-5415.2011.03402.x
38. Ye, X, Gao, X, Scott, T, and Tucker, KL. Habitual sugar intake and cognitive function among middle-aged and older Puerto Ricans without diabetes. Br J Nutr. (2011) 106:1423–32. doi: 10.1017/s0007114511001760
39. Safouris, A, Tsivgoulis, G, Sergentanis, TN, and Psaltopoulou, T. Mediterranean diet and risk of dementia. Curr Alzheimer Res. (2015) 12:736–44. doi: 10.2174/1567205012666150710114430
40. Yin, ZX, Wang, JL, Lyu, YB, Luo, JS, Zeng, Y, and Shi, XM. Association between serum albumin and cognitive performance in elderly Chinese. Zhonghua Liu Xing Bing Xue Za Zhi. (2016) 37:1323–6. doi: 10.3760/cma.j.issn.0254-6450.2016.10.001
41. Wang, L, Wang, F, Liu, J, Zhang, Q, and Lei, P. Inverse relationship between baseline serum albumin levels and risk of mild cognitive impairment in elderly: a seven-year retrospective cohort study. Tohoku J Exp Med. (2018) 246:51–7. doi: 10.1620/tjem.246.51
42. Covinsky, KE, Covinsky, MH, Palmer, RM, and Sehgal, AR. Serum albumin concentration and clinical assessments of nutritional status in hospitalized older people: different sides of different coins? J Am Geriatr Soc. (2002) 50:631–7. doi: 10.1046/j.1532-5415.2002.50156.x
43. Ohlsson, O, Henningsen, NC, and Malmquist, I. Blood pressure, heart rate and plasma albumin in relatives of hypertensive patients. Acta Med Scand. (1981) 209:445–50. doi: 10.1111/j.0954-6820.1981.tb11627.x
44. Sabayan, B . Westendorp RG: blood pressure control and cognitive impairment--why low is not always better. JAMA Intern Med. (2015) 175:586–7. doi: 10.1001/jamainternmed.2014.8202
45. Guo, J, Jono, H, Kugimiya, T, Saito, S, Maruyama, T, Misumi, Y, et al. Antioxidative effect of albumin on amyloid fibril formation in transthyretin-related amyloidosis. Amyloid. (2011) 18:17–8. doi: 10.3109/13506129.2011.574354005
46. Mao, P . Oxidative stress and its clinical applications in dementia. J Neurodegener Dis. (2013) 2013:319898, 1–15. doi: 10.1155/2013/319898
47. Hou, Q, Guan, Y, Yu, W, Liu, X, Wu, L, Xiao, M, et al. Associations between obesity and cognitive impairment in the Chinese elderly: an observational study. Clin Interv Aging. (2019) 14:367–73. doi: 10.2147/cia.S192050
48. Li, J, Jiao, M, Wen, J, Fan, D, Xia, Y, Cao, Y, et al. Association of body mass index and blood lipid profile with cognitive function in Chinese elderly population based on data from the China Health and Nutrition Survey, 2009–2015. Psychogeriatrics. (2020) 20:663–72. doi: 10.1111/psyg.12559
49. Rubin, LH, Gustafson, D, Hawkins, KL, Zhang, L, Jacobson, LP, Becker, JT, et al. Midlife adiposity predicts cognitive decline in the prospective multicenter AIDS cohort study. Neurology. (2019) 93:e261–71. doi: 10.1212/wnl.0000000000007779
50. Gong, HJ, Tang, X, Chai, YH, Qiao, YS, Xu, H, Patel, I, et al. Relationship between weight-change patterns and cognitive function: a retrospective study. J Alzheimers Dis. (2023) 91:1085–95. doi: 10.3233/jad-220788
51. Shen, X, Yang, L, Gu, X, Liu, YY, and Jiang, L. Geriatric nutrition risk index as a predictor of cardiovascular and all-cause mortality in older Americans with diabetes. Diabetol Metab Syndr. (2023) 15:89. doi: 10.1186/s13098-023-01060-7
52. Zhu, L, Xia, J, Shao, X, Pu, X, Chen, J, Zhang, J, et al. The relationship between the baseline geriatric nutritional risk index (GNRI) and neurological function at the convalescence stage in patients with stroke: a cross-sectional study. BMC Geriatr. (2023) 23:173. doi: 10.1186/s12877-023-03919-w
53. Moheet, A, Mangia, S, and Seaquist, ER. Impact of diabetes on cognitive function and brain structure. Ann N Y Acad Sci. (2015) 1353:60–71. doi: 10.1111/nyas.12807
54. Hua, J, Dong, J, Chen, GC, and Shen, Y. Trends in cognitive function before and after stroke in China. BMC Med. (2023) 21:204. doi: 10.1186/s12916-023-02908-5
Keywords: cross-sectional study, geriatric nutritional risk index, older adults, cognitive function, nutritional status, NHANES
Citation: Tan Z, Nie Y and Yan N (2024) Association between the geriatric nutritional risk index and cognitive functions in older adults: a cross-sectional study from National Health and Nutrition Examination Survey. Front. Nutr. 11:1459638. doi: 10.3389/fnut.2024.1459638
Edited by:
Luciane Bresciani Salaroli, Federal University of Espirito Santo, BrazilReviewed by:
Virginia Maria Muniz, Secretaria de Estado da Saúde do Espírito Santo, BrazilMarcelo Muniz, Federal University of Espirito Santo, Brazil
Copyright © 2024 Tan, Nie and Yan. This is an open-access article distributed under the terms of the Creative Commons Attribution License (CC BY). The use, distribution or reproduction in other forums is permitted, provided the original author(s) and the copyright owner(s) are credited and that the original publication in this journal is cited, in accordance with accepted academic practice. No use, distribution or reproduction is permitted which does not comply with these terms.
*Correspondence: Ning Yan, ODAwMDMzQGhvc3BpdGFsLmNxbXUuZWR1LmNu