
95% of researchers rate our articles as excellent or good
Learn more about the work of our research integrity team to safeguard the quality of each article we publish.
Find out more
ORIGINAL RESEARCH article
Front. Nutr. , 23 October 2024
Sec. Nutrition and Metabolism
Volume 11 - 2024 | https://doi.org/10.3389/fnut.2024.1454880
This article is part of the Research Topic Nutrients, Stress Response, and Human Health View all 8 articles
Background: The association between the triglyceride-glucose (TyG) index and its combination with obesity indictors in aortic aneurysm and dissection (AAD) remains unclear. We aimed to investigate the association between TyG and TyG-body mass index (TyG-BMI), TyG-waist circumference (TyG-WC), TyG-waist height ratio (TyG-WHtR) and AAD risk.
Methods: This study included 387,483 baseline participants from the UK Biobank with complete data on TyG, TyG-BMI, TyG-WC and TyG-WHtR. Cox proportional hazard models evaluated the relationship between these four indicators and the risk of AAD occurrence. Restricted cubic spline (RCS) examined the non-linear relationship between these indicators and AAD risk, while receiver operating characteristic (ROC) curves assessed the predictive value of these four indicators for AAD risk.
Results: Over a median follow-up of 13.7 years, 3,041 AAD events were recorded. Multivariate Cox regression analysis indicated that for each standard deviation increase, the risk of AAD occurrence increased by 33% (HR: 1.33, 95%CI: 1.29–1.38), 25% (HR: 1.25, 95%CI: 1.21–1.29), 61% (HR: 1.61, 95%CI: 1.56–1.66) and 44% (HR: 1.44, 95%CI: 1.39–1.49) for TyG, TyG-BMI, TyG-WC and TyG-WHtR, respectively. RCS demonstrated a linear relationship between these indicators and AAD risk, with TyG-WC demonstrating the best performance in predicting AAD occurrence based on ROC curves.
Conclusion: The present study, based on a large prospective cohort design, showed that higher TyG index and its combination with obesity indices were significantly associated with the risk of AAD. Moreover, AFT models further showed that elevation of these indicators significantly advanced the onset of AAD. In addition, RCS analyses demonstrated a linear association between these indicators and the risk of AAD, and the TyG-WC showed higher predictive ability for AAD. These findings emphasize the potential application of the TyG index and its combination with obesity indicators in the early identification of AAD.
Aortic aneurysm and dissection (AAD) poses a significant risk to cardiovascular health, with an extremely high mortality rate (1). Epidemiological data indicates an annual incidence of AAD ranging from 2 to 16 cases per 100,000 individuals, with a significant male predominance (2, 3). Statistics reveal that AAD claims over 150,000 lives annually (4). Currently, surgical intervention stands as the primary treatment, yet despite advancements, postoperative mortality rates persist above 10% (5). While medications like β-adrenergic receptor antagonists and angiotensin II receptor antagonists offer some control over aneurysm progression, the lack of precise biomarkers and effective therapeutic targets hampers prevention and treatment efforts (6, 7).
Previous research identifies smoking, hypertension, age and atherosclerosis as key AAD risk factors (8). Smoking is a well-established contributor, as it leads to chronic inflammation and weakening of the aortic wall, significantly increasing the risk of aneurysm formation (9). Hypertension, or high blood pressure, places additional stress on the aortic wall, which not only promotes the growth of aneurysms but also increases the risk of aortic dissection, where a tear in the inner layer of the aorta can occur (10). Age is another crucial factor, with the risk of both conditions increasing as the aorta becomes more fragile over time (11). Atherosclerosis, characterized by the accumulation of plaque in the arteries, can cause the stiffening and narrowing of the aorta, which further elevates the risk of aneurysm rupture and dissection by weakening the structural integrity of the arterial wall (12). Additionally, increasing evidence implicates diabetes and obesity in AAD development (13, 14). Insulin resistance (IR), a hallmark of diabetes and obesity, emerges as a pivotal contributor to various cardiovascular diseases (CVDs) (15). Furthermore, studies link higher IR markers with larger aneurysm diameters (16). IR disrupts metabolic processes and fuels inflammation, underscoring its potential significance in AAD onset and progression (17).
While the hyperinsulinemic-euglycemic clamp serves as the gold standard for IR measurement, its complexity including the need for specialized equipment, prolonged testing time, and skilled personnel limits its feasibility for routine clinical application (18). The triglyceride-glucose (TyG) emerges as a simpler, efficient alternative for early IR identification (19). Ahn et al. showed the potential efficacy of TyG in discerning prediabetes from diabetes in the general population (20). Moreover, it serves as a reliable indicator for various metabolic diseases, including stroke, CVD and metabolic syndrome (21–23). Furthermore, combining the TyG index with obesity indicators enhances diagnostic accuracy compared to TyG alone (24, 25).
To date, no study has explored the relationship between the TyG index, its combination with obesity indicators, and the risk of AAD. In summary, IR has been shown to increase the risk of AAD, and both the TyG index and obesity-related parameters hold promise as potential surrogates for IR. Therefore, we hypothesize that higher levels of the TyG index and its combinations with obesity parameters (TyG-BMI, TyG-WC, TyG-WHtR) are associated with an increased risk of AAD occurrence. In the present study, our aim was to investigate the associations between the TyG index, its combinations with obesity metrics, and the risk of AAD, as well as to compare the ability of these IR surrogates in predicting AAD occurrence.
The UKB constitutes a large-scale, prospective, community-based cohort study aimed at advancing biomedical research and informing public health policies. Between 2006 and 2010, the project recruited over 500,000 participants from 22 centers across the United Kingdom. All participants were registered with the National Health Service (NHS), the publicly funded healthcare system in the United Kingdom, ensuring they had comprehensive health records available for long-term follow-up and research purposes. At baseline, participants completed detailed touchscreen questionnaires covering demographics, health and lifestyle factors, alongside undergoing physical examinations, functional assessments and providing blood, urine and saliva samples. Comprehensive study protocols and descriptions have been previously reported (26), and all data collection and research in the UKB adhere to strict ethical and privacy standards, with participants providing written informed consent before enrolment. The study received approval from the North West Multi-Center Research Ethics Committee and aligns with the Declaration of Helsinki principles.
Upon enrolment in the UKB, blood samples were randomly collected from participants with fasting times recorded prior to blood sampling. Given the logistic challenges of collecting fasting blood samples from a large, geographically dispersed population (27), biochemical measurements were conducted within 24 h on non-fasting serum samples, including triglycerides (TG), glucose, total cholesterol (TC), high (HDL)- and low-density lipoprotein cholesterol (LDL). The coefficients of variation for TG and glucose concentrations were both less than 3%. Physical measurements such as height, weight and WC were also ontained during baseline examinations. WHtR was computed as the ratio of WC to height (28). Four indices were calculated using the following formulas: TyG = ln [triglycerides (mg/dL) × glucose (mg/dL) / 2]; TyG-BMI = TyG * BMI; TyG-WC = TyG * WC; TyG-WHtR = TyG * WHtR (29, 30).
The diagnosis of AAD relied on the International Classification of Diseases, Tenth Revision (ICD-10) codes I71.0-I71.9, with data sourced from hospital admissions and death registries within the UKB. Participants were followed from the date of their recruitment into the study until the first of the following events occurred: a confirmed AAD event, death, or the study cutoff date of 26 October 2022. The follow-up period ended at whichever of these events happened first for each individual.
Baseline sociodemographic data encompassed sex, age, ethnicity, physical activity, smoking and drinking status, dietary habits, Townsend Deprivation Index (TDI), family history of CVD, medication usage and baseline history of chronic diseases, primarily cancer, heart diseases, hypertension and diabetes. Physical activity levels were quantified using weekly metabolic equivalent (MET) minutes (31). TDI reflected participants’ socioeconomic status at baseline (32). Dietary scores were derived from participants’ reports of consumption of nine food items, with detailed scoring information reported elsewhere (32, 33). Family history of CVD herein referred to parental heart disease history collected through self-reports at baseline. Medication history primarily encompassed antihypertensive drugs, lipid-lowering drugs and insulin.
We initially included 502,357 participants from UK Biobank. We then excluded the participants with any missing TyG, TyG-BMI, TyG-WC and TyG-WHtR data (n = 75,063). Subsequently, we excluded two participants with missing recruitment time records. Additionally, to mitigate confounding effects, participants with baseline CVDs including heart valve disease, cardiomyopathy, arrhythmias, heart failure or coronary artery disease (n = 33,420) were further excluded (Supplementary Table S1). Consequently, a total of 387,483 participants were retained for subsequent analysis (Figure 1).
Missing covariate values were imputed using multiple imputations via random forests, with one set of imputed data selected for analysis. Kolmogorov–Smirnov test was used to assess the distribution type of continuous variables. All continuous variables exhibited a skewed distribution. Baseline characteristics were stratified according to AAD and non-AAD groups, with continuous variables expressed as medians (interquartile ranges) and categorical variables presented as numbers and proportions (N, %). Comparisons between the two groups for continuous and categorical variables were conducted using the Mann–Whitney U test and Chi-square test, respectively Incidence of AAD across quartiles of TyG, TyG-BMI, TyG-WC and TyG-WHtR during the follow-up period was assessed using Kaplan–Meier (KM) curves, with significance evaluated by log-rank test. Cox proportional hazard models were employed to assess the association between TyG and its combination with obesity metrics and AAD risk across three Cox multivariable regression models. Model 1 lacked adjustments for any variables, while Model 2 adjusted for age, sex and race. Model 3 further adjusted for physical activity, smoking and drinking habits, diet score, TDI, fasting time, family history of CVD, usage of antihypertensive drugs, lipid-lowering drugs or insulin and baseline chronic diseases including cancer, hypertension and diabetes. The selection of confounders was determined using a directed acyclic graph (DAG)1 (34), with the results depicted in Supplementary Figure S1. Each model categorized TyG, TyG-BMI, TyG-WC and TyG-WHtR into quartiles, with the first quartile (Q1) serving as a reference to evaluate AAD risk trends and calculate p-values. Subsequently, these four metrics were standardized using Z-scores to assess AAD risk changes per one standard deviation (SD) increase.
Restricted cubic spline (RCS) analysis with three knots (10, 50, 90th) were employed to evaluate the non-linear association between these four indicators and AAD risk, adjusting for Model 3 covariates, with nonlinearity assessed using the log-likelihood ratio test. Subsequently, the accelerated failure time (AFT) model investigated the impact of TyG, TyG-BMI, TyG-WC and TyG-WHtR levels on AAD event timings (35). Using the lowest quartile group (Q1) as the reference, we assessed the effect of increases in these indices on the timing of AAD onset. Receiver operating characteristic (ROC) curves and area under the curve (AUC) analyses evaluated the diagnostic and predictive capabilities of the four indicators in predicting the risk of AAD. To assess the stability of the model, we randomly split the dataset into 70% training and 30% testing sets. We then plotted ROC curves for both sets to evaluate the model’s generalization ability on unseen data.
Additionally, subgroup analyses were conducted based on sex, age, BMI, smoking and alcohol consumption, fasting time, diet score, diabetes, hypertension, cancer, medication use and family history of CVD, with p-values for between-group interactions calculated via likelihood ratio tests. Finally, several sensitivity analyses were conducted to assess the robustness of our findings. (1) Participants who developed AAD within 2 years of the follow-up period were excluded to mitigate potential reverse causal effects. (2) Participants with any missing covariate values at baseline were excluded, and the main analysis was repeated. (3) To address the significant differences in sample sizes between the AAD and non-AAD groups, as well as differences in baseline characteristics, and avoid potential selection bias, propensity score matching (PSM) was employed in a 1:1 manner based on all Model 3 covariates. After calculating propensity scores, matching was performed using the nearest-neighbor matching algorithm with a caliper of 0.2 pooled SD (36). All analyses were performed using R (version 4.2.1), with statistical significance set at a two-sided p-value less than 0.05.
A total of 387,483 AAD-free participants, with a median age of 57 years and 44.6% males, were included. Table 1 illustrates baseline characteristics, categorized by AAD status. Compared to the non-AAD group, the AAD group exhibited higher age, BMI, WC, weight and height, alongside a higher proportion of male and white participants, and a higher prevalence of chronic diseases (all p < 0.001). Additionally, levels of TyG, TyG-BMI, TyG-WC and TyG-WHtR were significantly elevated in the AAD group compared to the non-AAD group (all p < 0.001).
During a median follow-up of 13.7 years, 3,041 AAD cases were identified. KM curves illustrated an escalating risk of AAD with increasing quartiles of TyG, TyG-BMI, TyG-WC and TyG-WHtR (all p-values <0.001; Figure 2). Consistent findings emerged from Cox models. In Model 1, lacking adjustments, there was an upward trend in the relative risk of AAD occurrence with increasing quartiles of TyG, TyG-BMI, TyG-WC and TyG-WHtR (all P for trend <0.001; Table 2). For each SD increase, the risk of AAD occurrence increased by 33% (HR: 1.33, 95%CI: 1.29–1.38), 25% (HR: 1.25, 95%CI: 1.21–1.29), 61% (HR: 1.61, 95%CI: 1.56–1.66) and 44% (HR: 1.44, 95%CI: 1.39–1.49) for TyG, TyG-BMI, TyG-WC and TyG-WHtR, respectively. These associations persisted in Model 2 after adjusting for age, sex and race. Furthermore, in Model 3, adjusting for additional covariates, the increased quartiles of these four indicators enhanced the risk of AAD occurrence compared to the Q1 group, especially in the Q4 group. Meanwhile, each SD increase in these four indicators increased the risk of AAD occurrence by 10% (HR: 1.10, 95%CI: 1.05–1.14), 13% (HR: 1.13, 95%CI: 1.09–1.18), 21% (HR: 1.21, 95%CI: 1.16–1.26) and 15% (HR: 1.15, 95%CI: 1.10–1.19), respectively (Table 2).
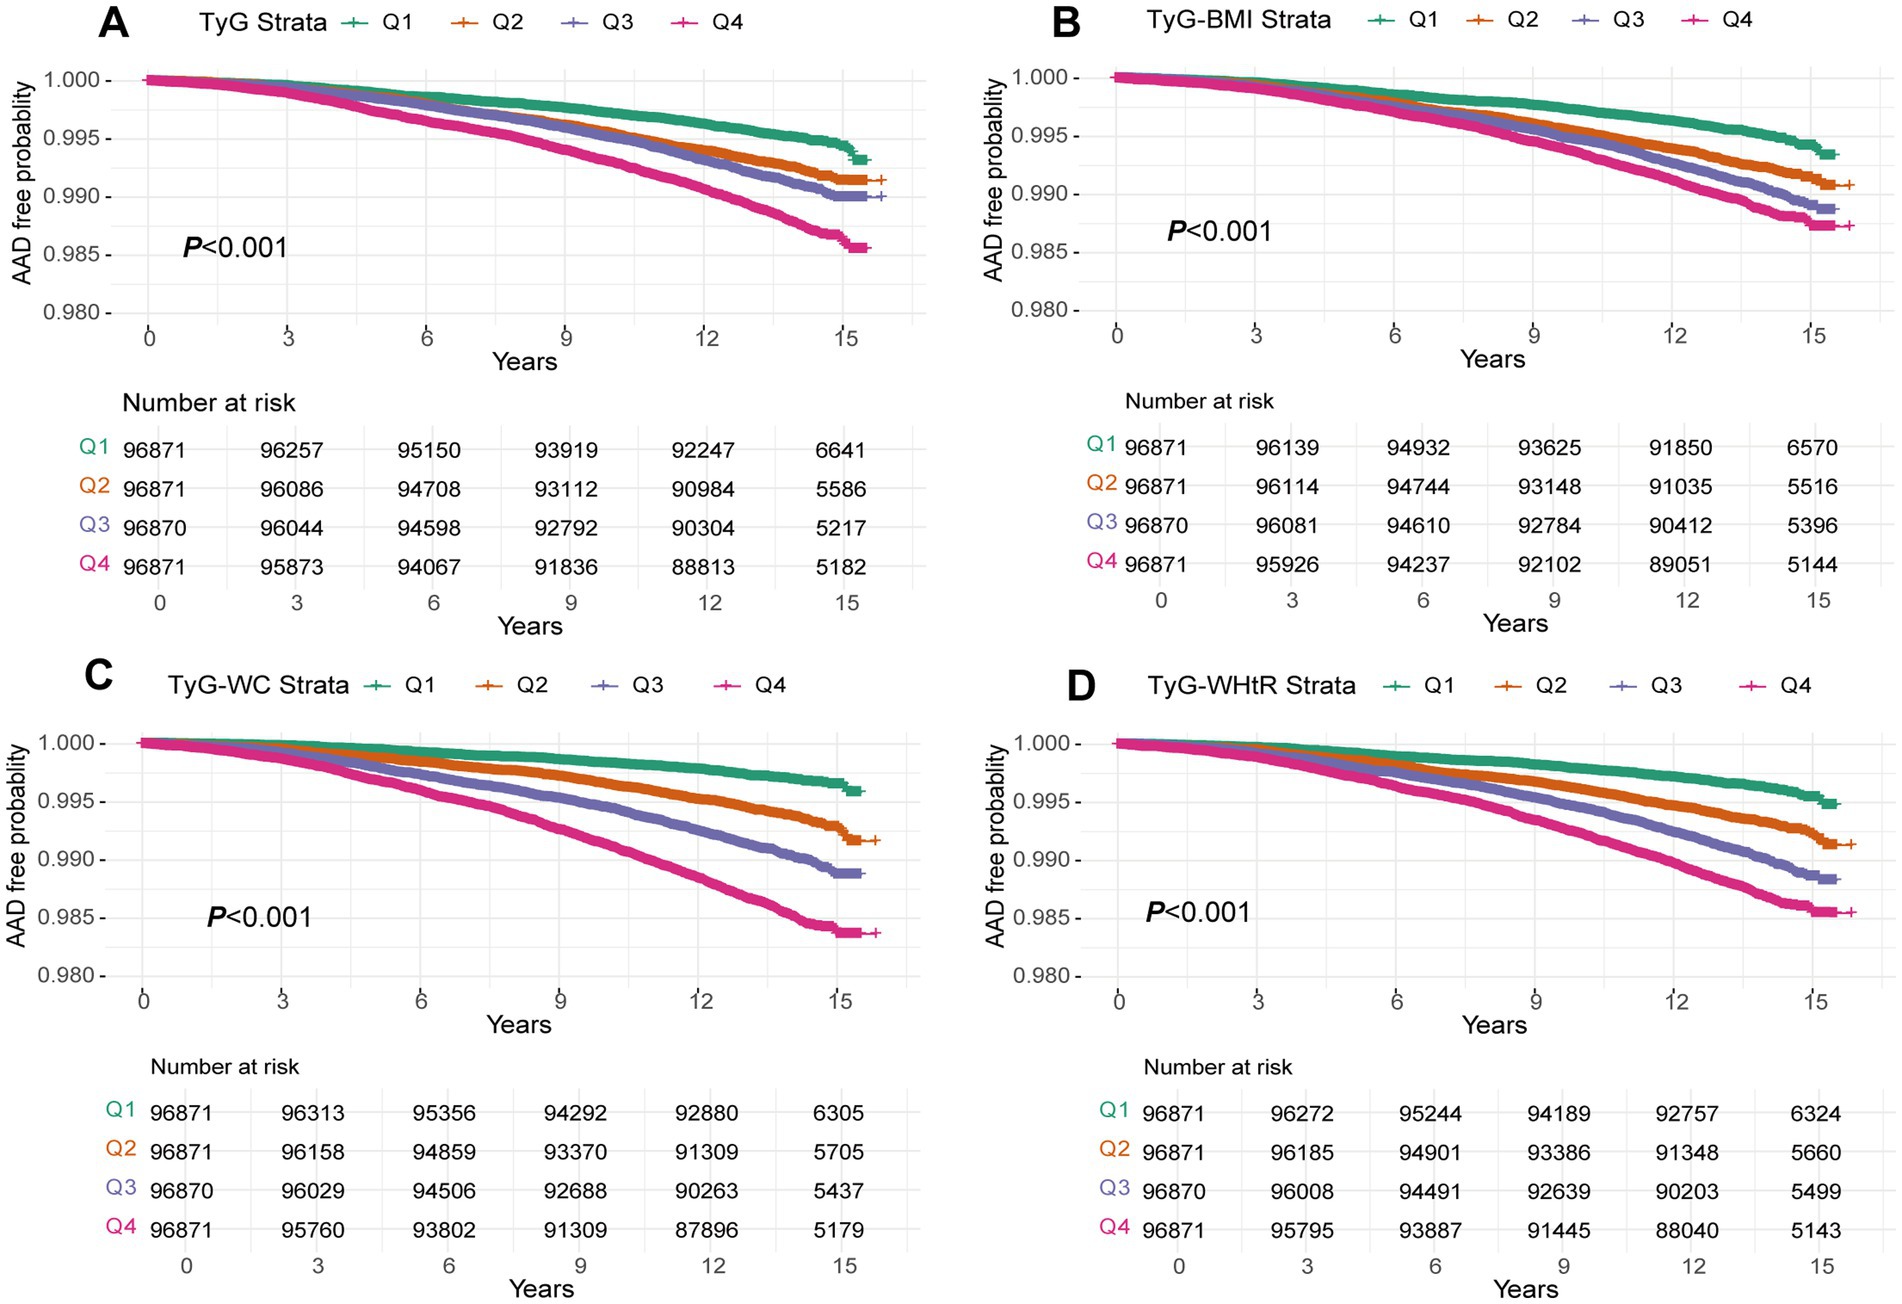
Figure 2. A Kaplan–Meier curves for AAD events in the TyG index (A), TyG-BMI (B), TyG-WC (C) and TyG-WHtR (D) quintile group. TyG index, triglyceride glucose index; TyG-BMI, triglyceride glucose index–body mass index; TyG-WC, triglyceride glucose index-waist circumference; TyG-WHtR, triglyceride glucose index-waist height ratio.
Subsequent RCS exhibited a linear dose-dependent relationship between all four indicators and AAD risk (all P for nonlinear >0.05; Figure 3).
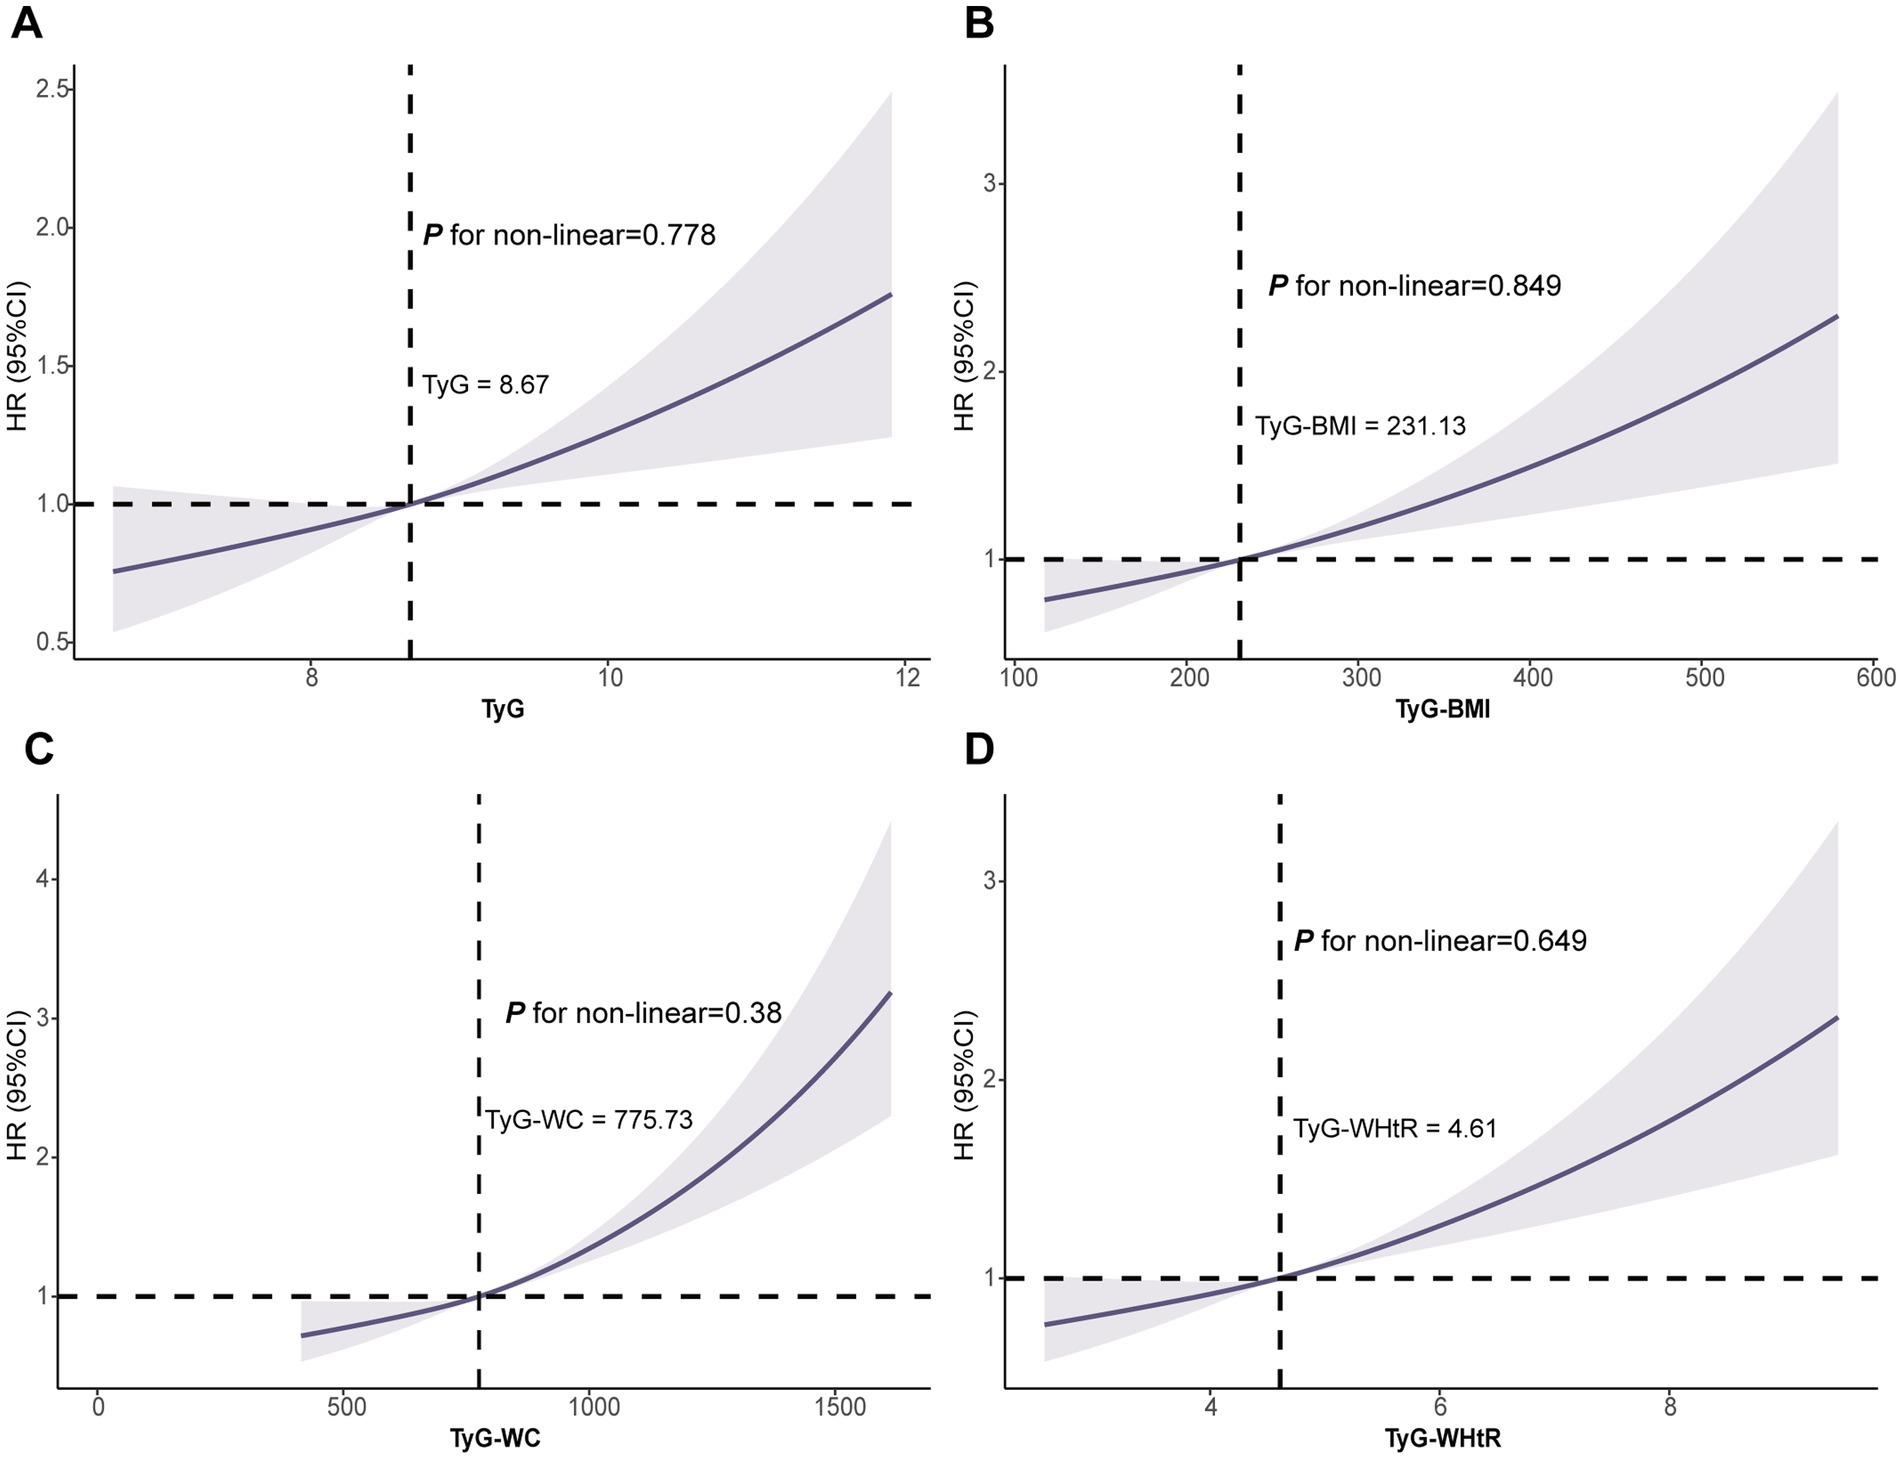
Figure 3. Association of the TyG (A), TyG-BMI (B), TyG-WC (C) and TyG-WHtR (D) with AAD using RCS. Models were fully adjusted with the maximum covariates in Model2. AAD, aortic aneurysm and dissection; RCS, Restricted cubic splines.
AFT analysis revealed a decreasing time to AAD onset with increasing quartiles of TyG, TyG-BMI, TyG-WC and TyG-WHtR (all P for trend <0.05; Figure 4). Specifically, compared to the Q1 group, the median time to AAD onset in the Q2 to Q4 groups of the TyG index was advanced by 25.2 months, 54.6 months and 69.5 months, respectively. Similar trends were observed for TyG-BMI, TyG-WC and TyG-WHtR, particularly for TyG-WC, with the median time to AAD onset in the Q2 to Q4 groups advanced by 31.9 months, 58.2 months and 121.4 months, respectively (all P for trend <0.05; Figure 4; Supplementary Table S2).
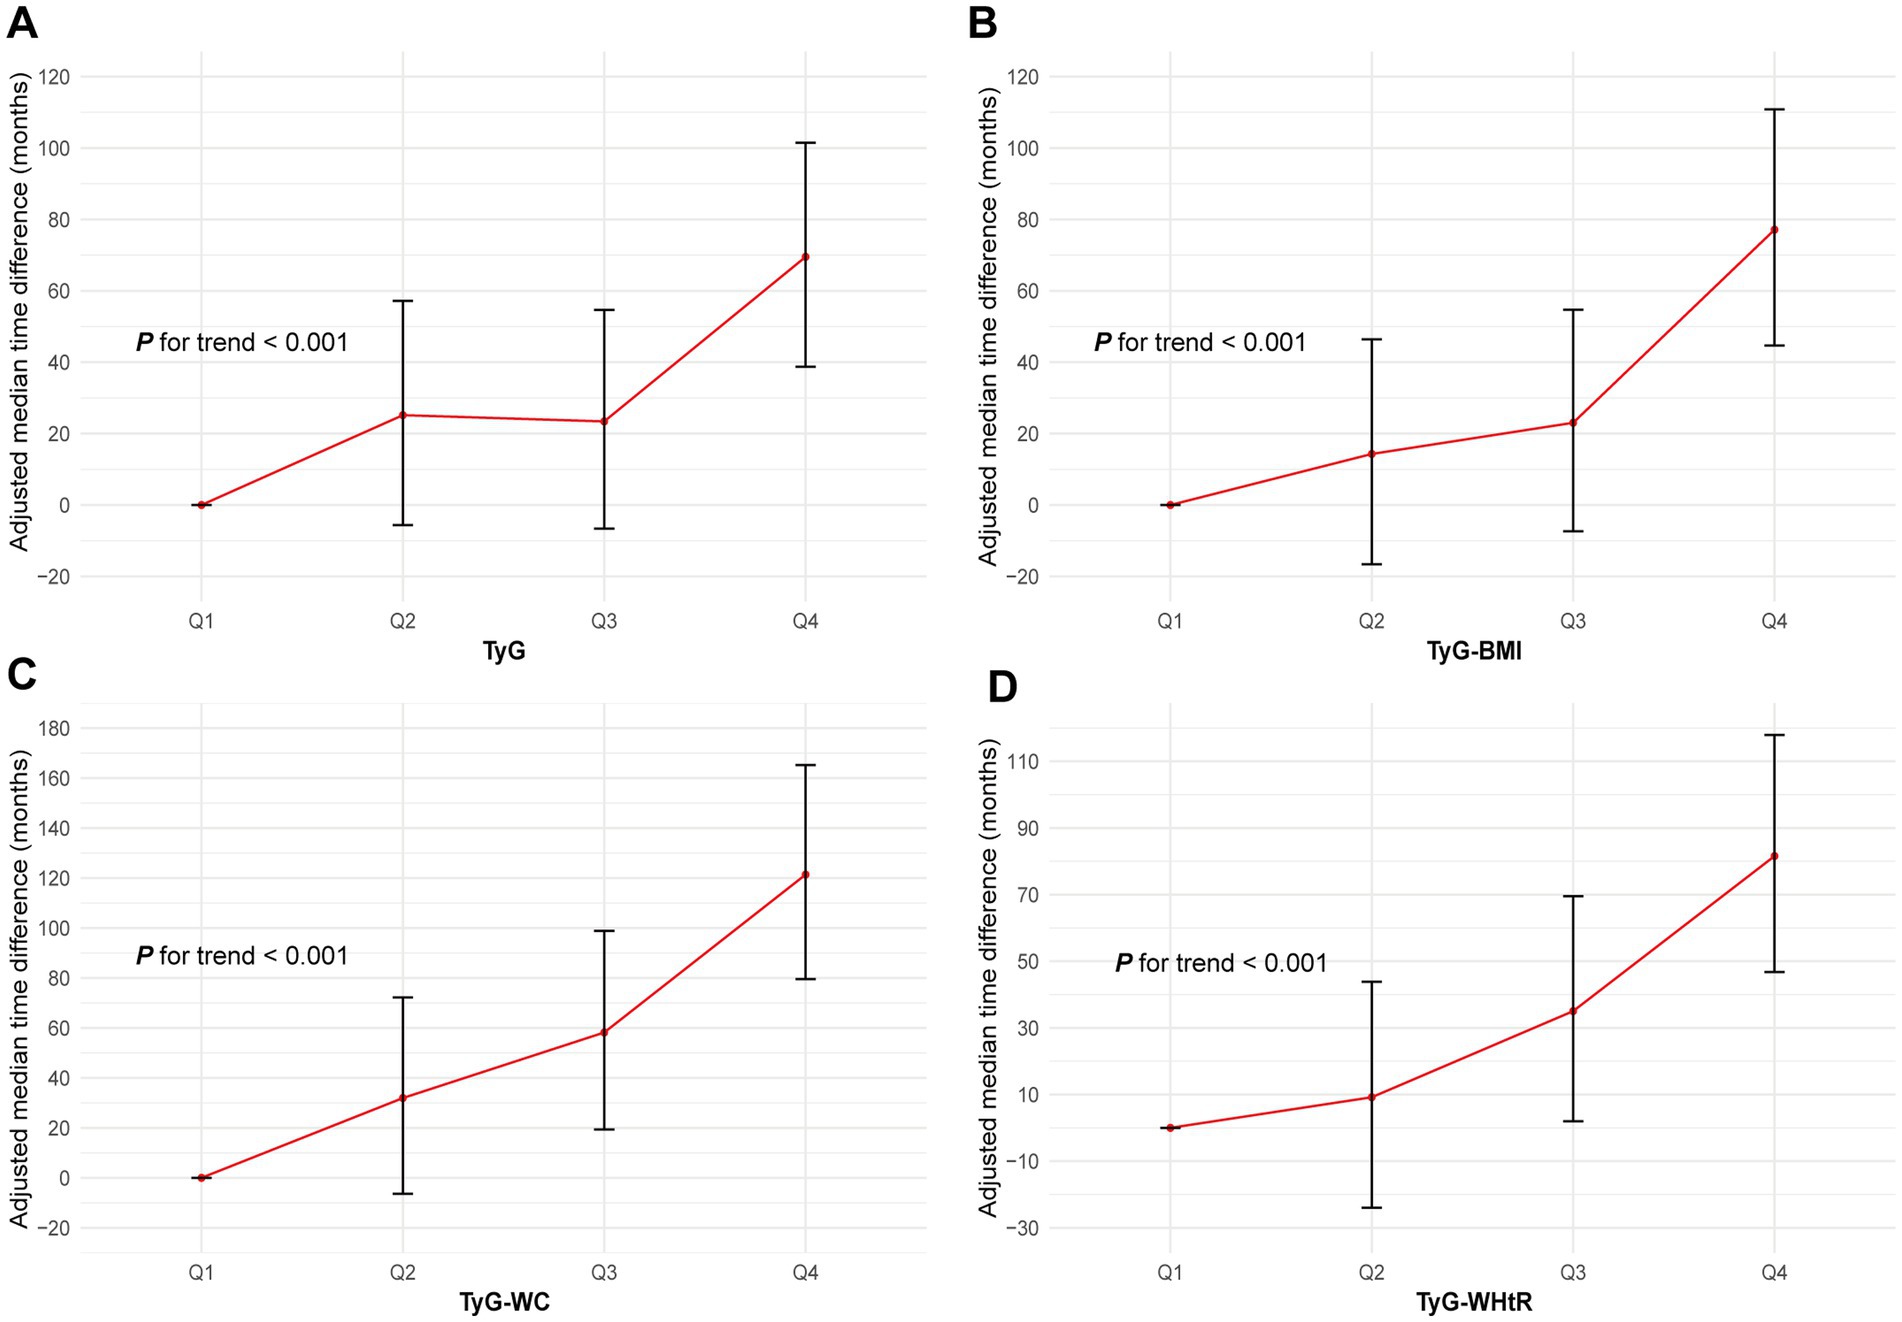
Figure 4. Association of the TyG (A), TyG-BMI (B), TyG-WC (C) and TyG-WHtR (D) with AAD using AFT. Models were fully adjusted with the maximum covariates in Model2. AAD, aortic aneurysm and dissection; TyG index, triglyceride glucose index; TyG-BMI, triglyceride glucose index–body mass index; TyG-WC, triglyceride glucose index-waist circumference; TyG-WHtR, triglyceride glucose index-waist height ratio; AFT, accelerated failure time.
Additionally, the ROC curve highlighted TyG-WC as the strongest predictor of AAD risk, with the highest AUC (AUC = 0.65, 95%CI: 0.64–0.66), followed by TyG-WHtR (AUC = 0.62, 95%CI: 0.61–0.63), TyG index (AUC = 0.59, 95%CI: 0.58–0.60) and TyG-BMI (AUC = 0.58, 95%CI: 0.57–0.59; Supplementary Figure S2). Notably, these results remained consistent across both the training and testing sets.
Stratified analyses upheld the positive correlation between TyG, TyG-BMI, TyG-WC, TyG-WHtR and AAD risk across various subgroups, including age, medication use, diet score, family history of CVD and hypertension (Figures 5–8). Additionally, the association was more pronounced in male participants, individuals with BMI < 30 kg/m2, Caucasians, current smokers, alcohol consumers, and those without a history of cancer. Furthermore, significant interactions were noted between TyG indices and AAD risk, particularly in relation to smoking status for TyG (P for interaction = 0.003; Figure 5) and gender for TyG-BMI (P for interaction = 0.004; Figure 6).
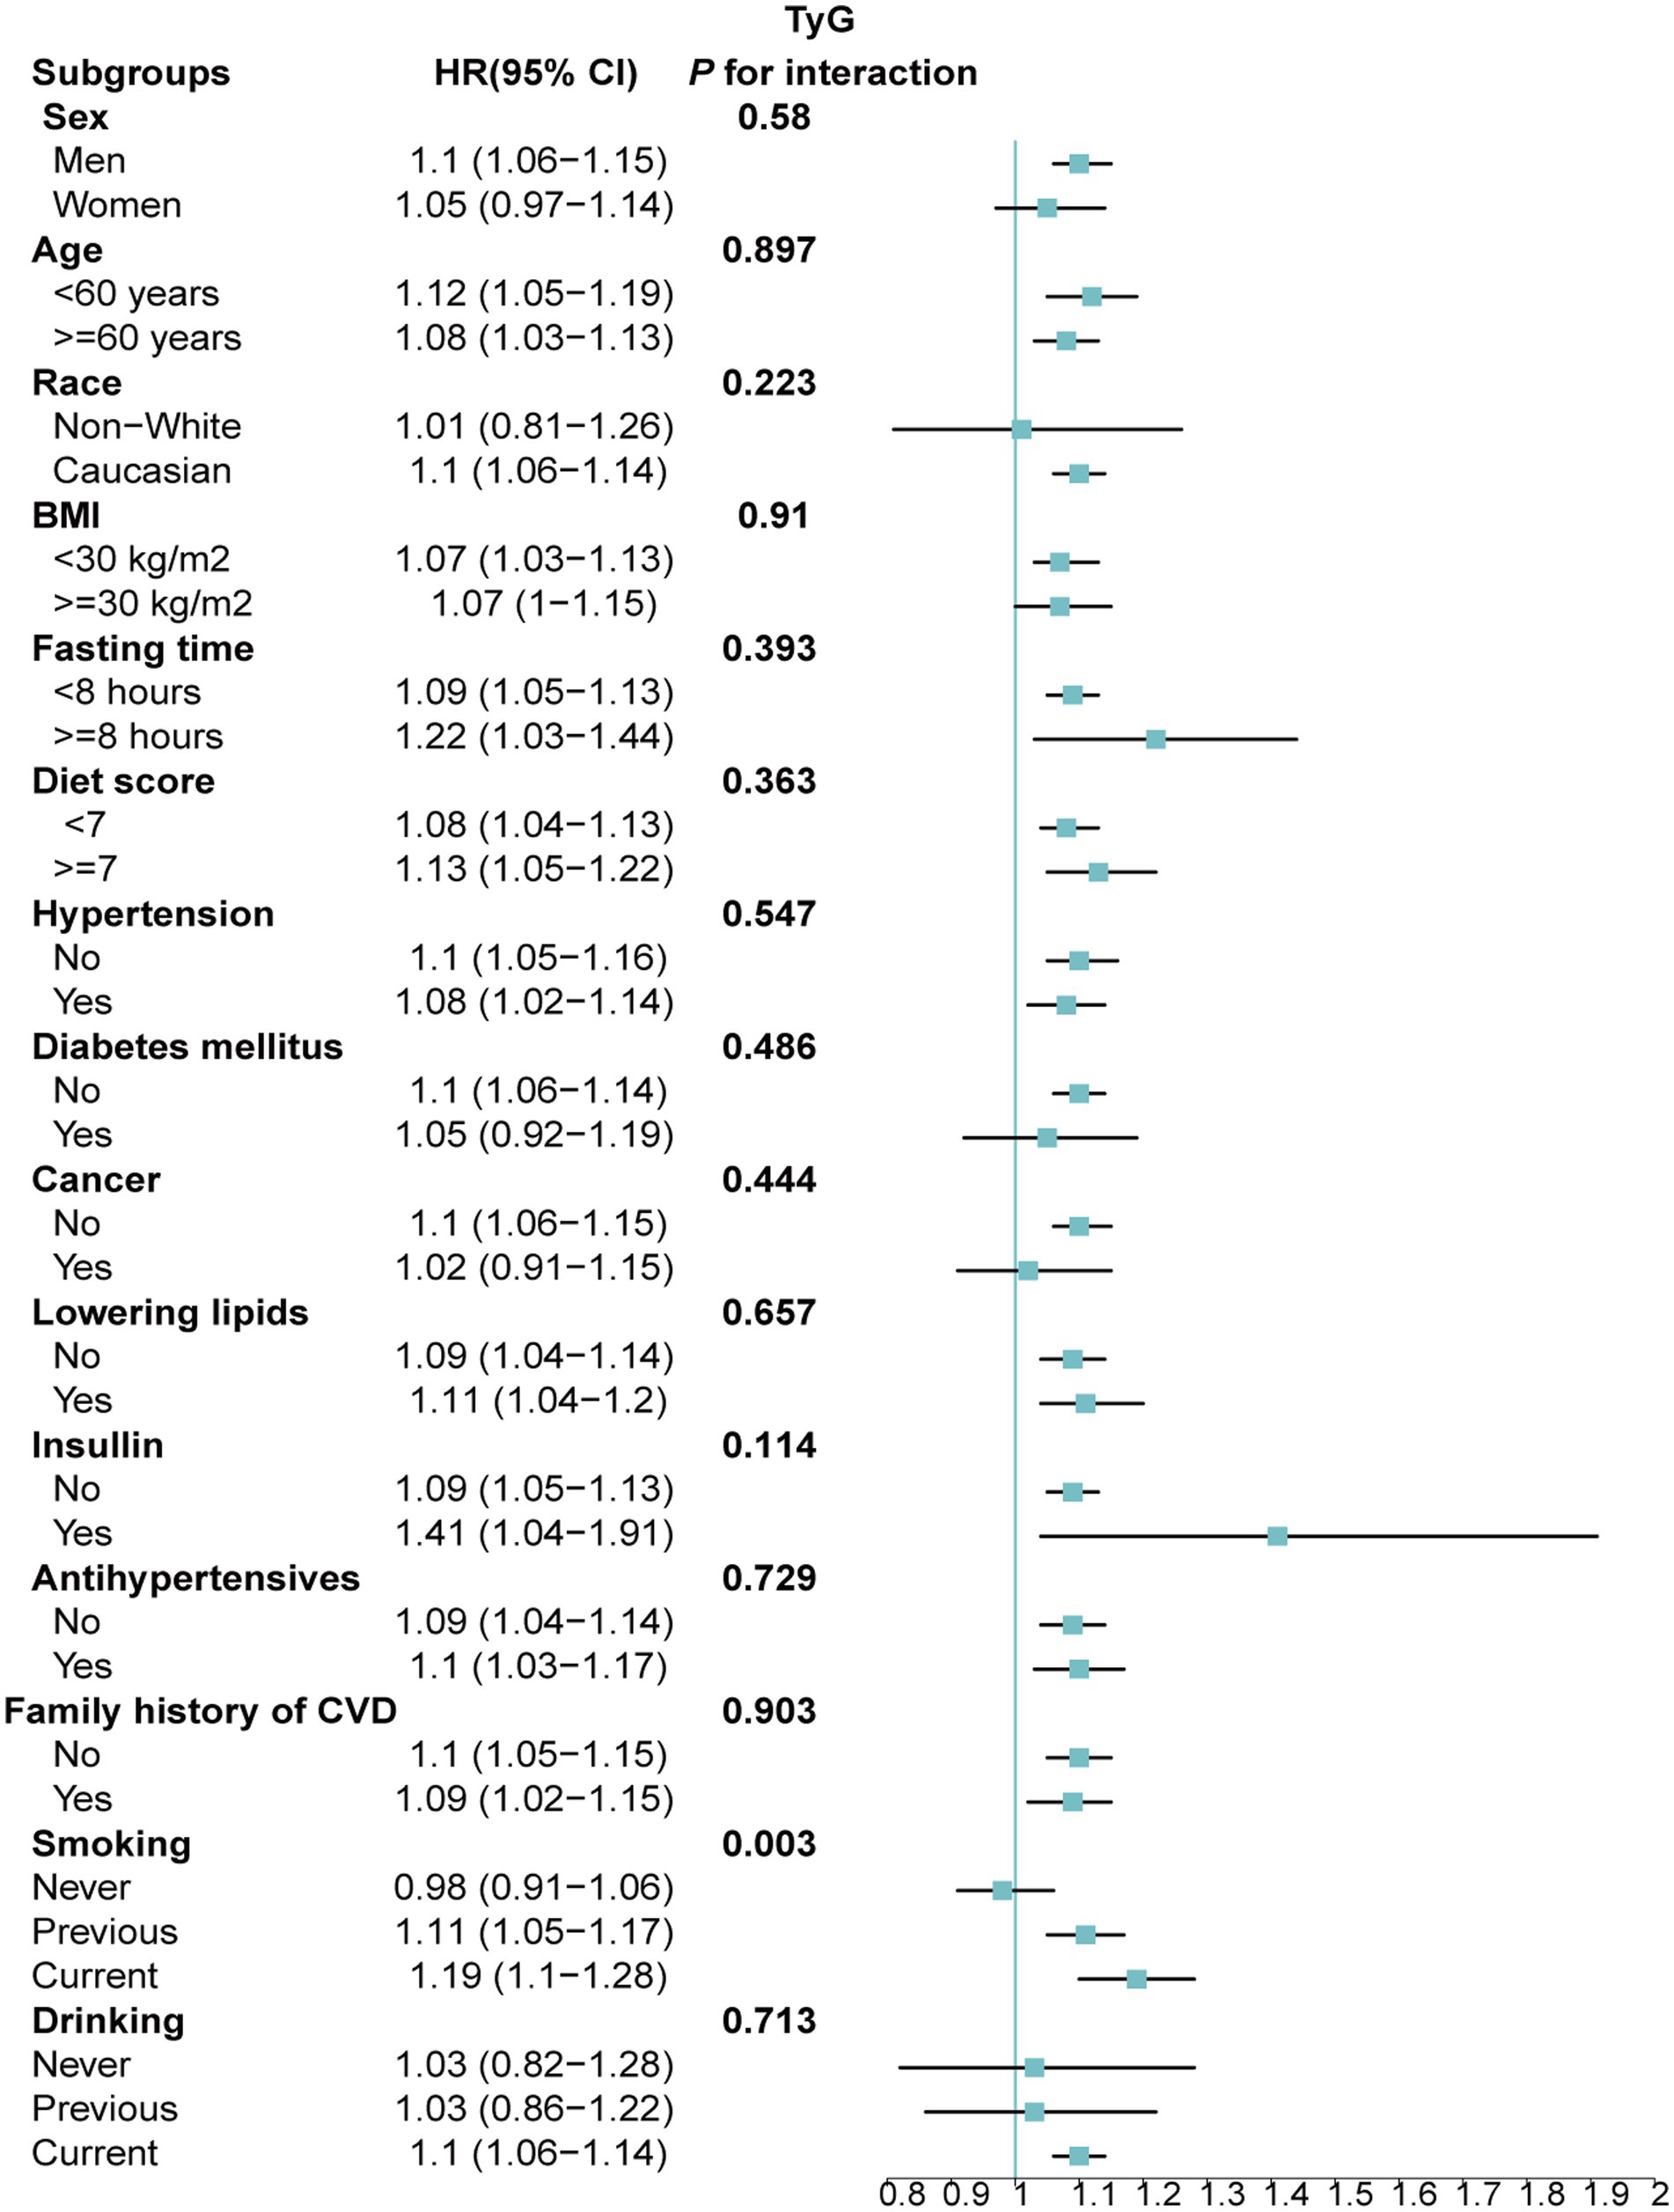
Figure 5. Association between each standard deviation increase in TyG and the risk of AAD stratified by different clinical characteristics. AAD, aortic aneurysm and dissection; TyG index, triglyceride glucose index.
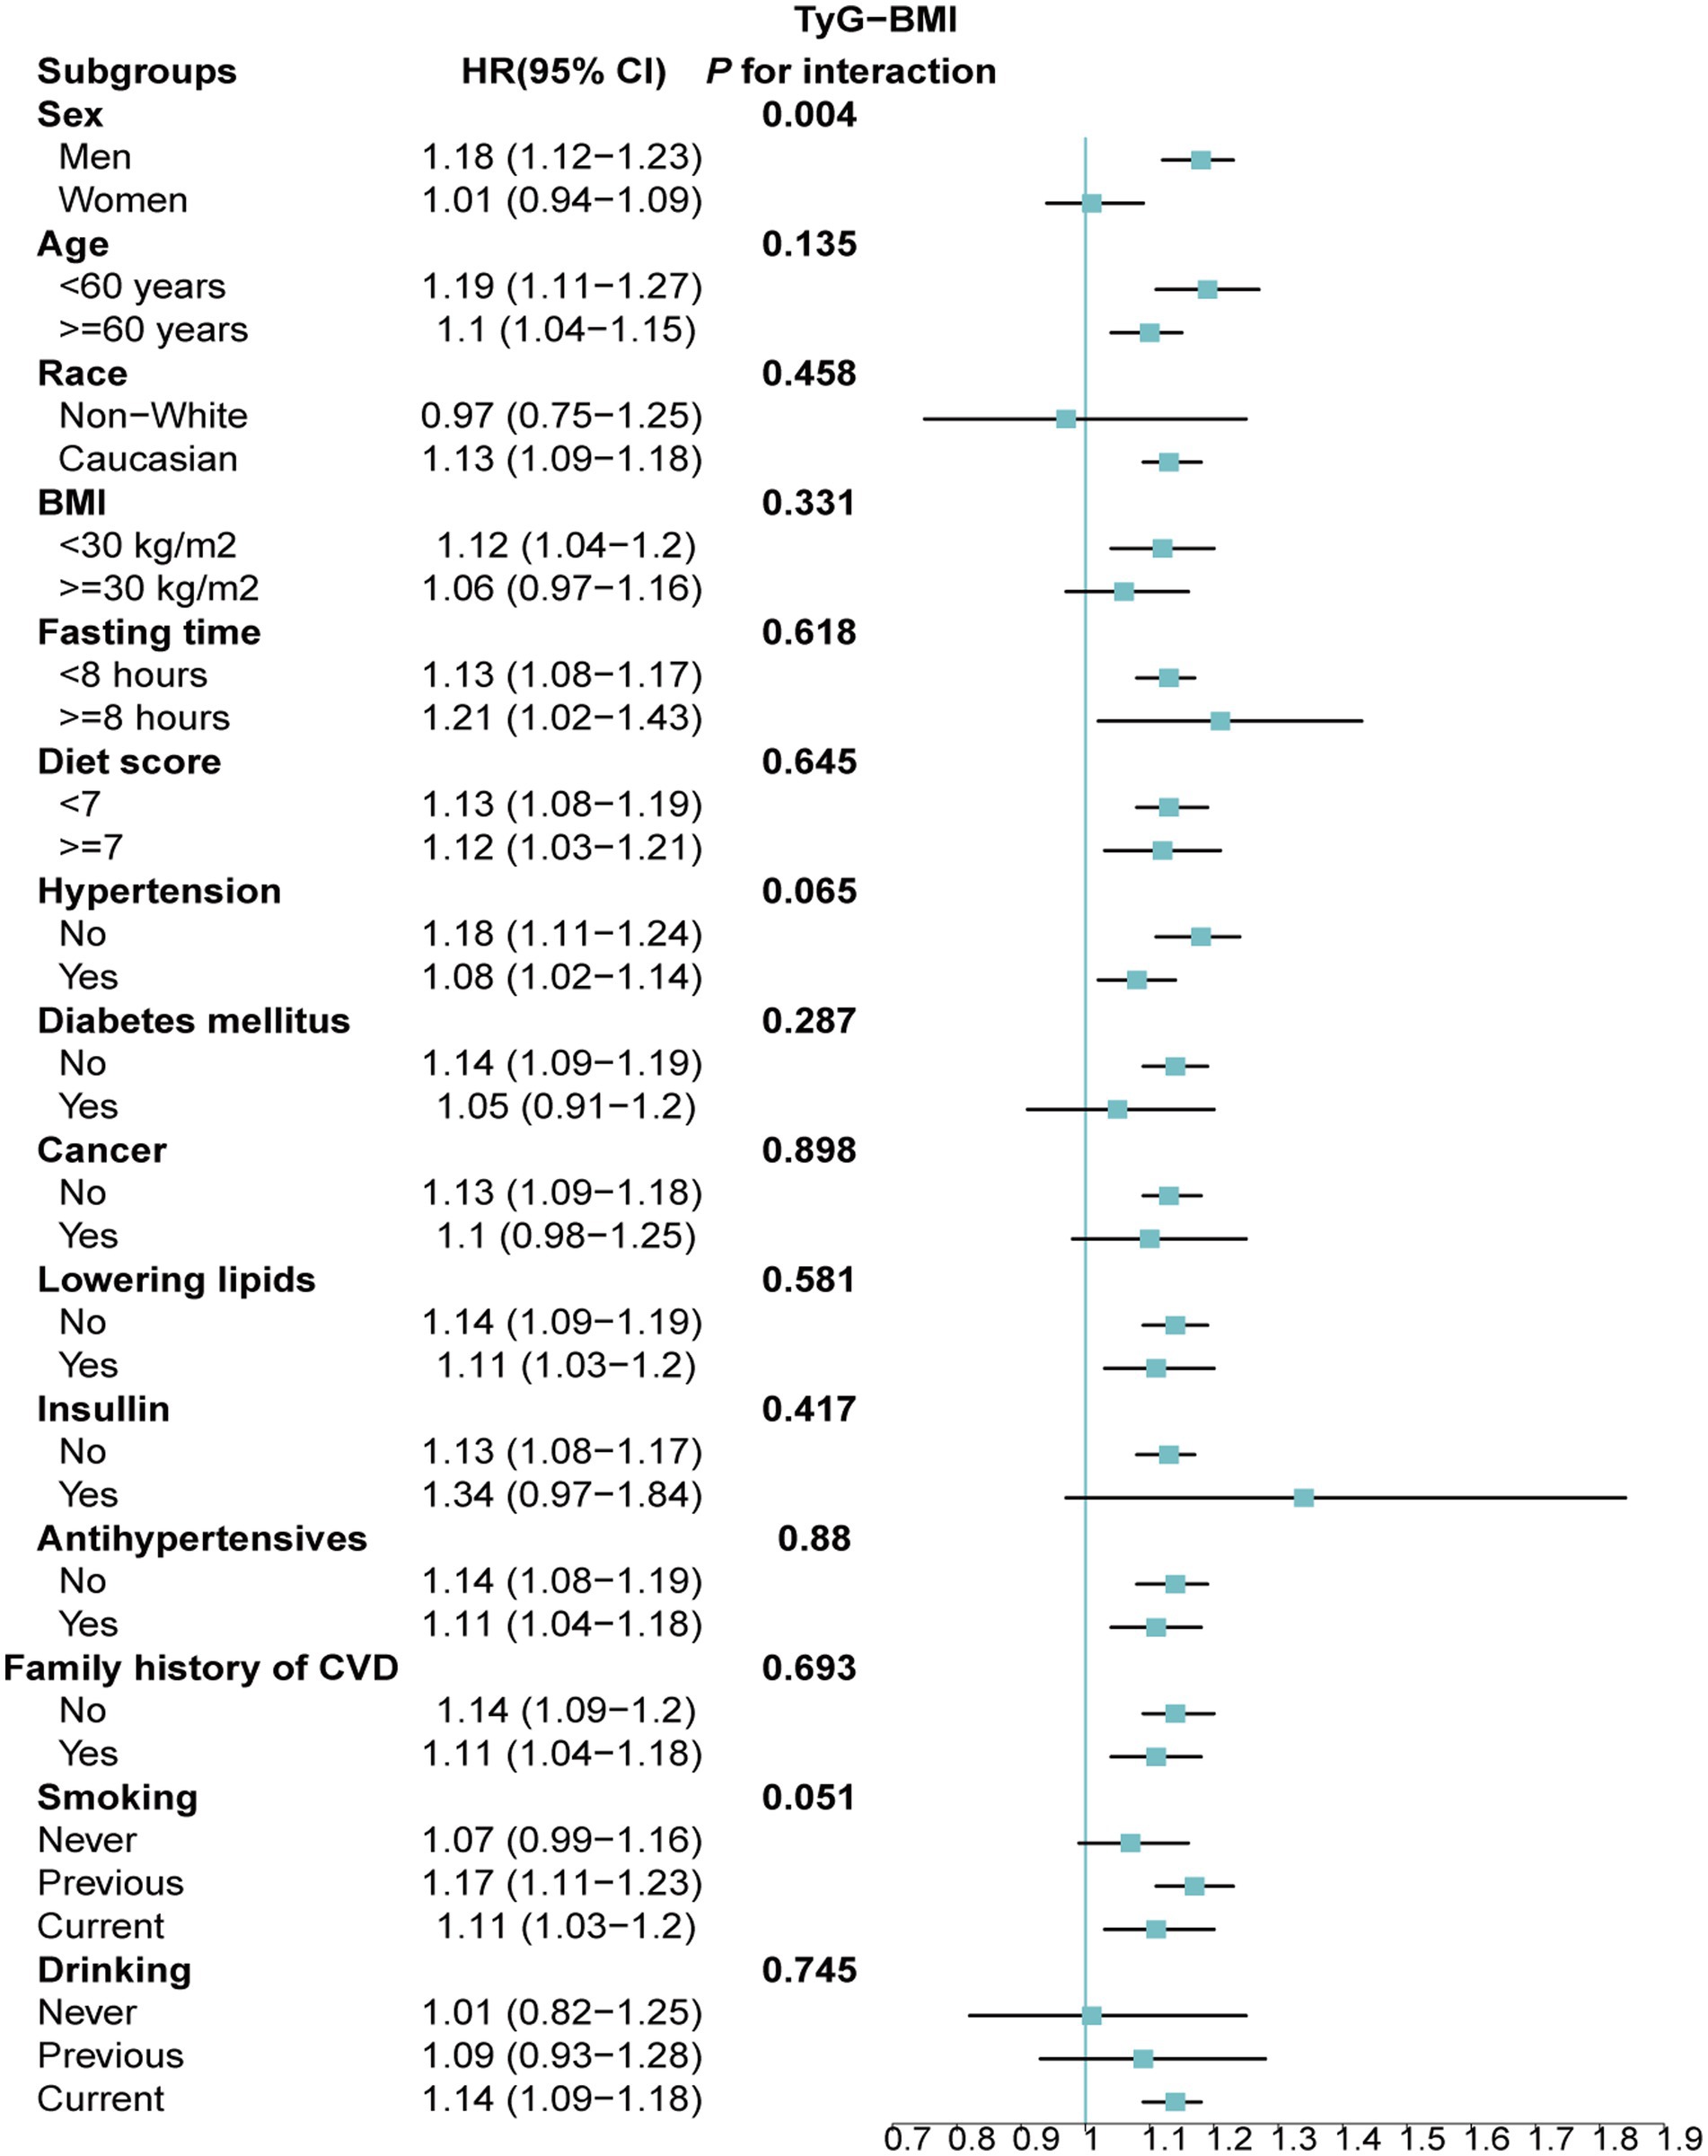
Figure 6. Association between each standard deviation increase in TyG-BMI and the risk of AAD stratified by different clinical characteristics. AAD, aortic aneurysm and dissection; TyG-BMI, triglyceride glucose index–body mass index.
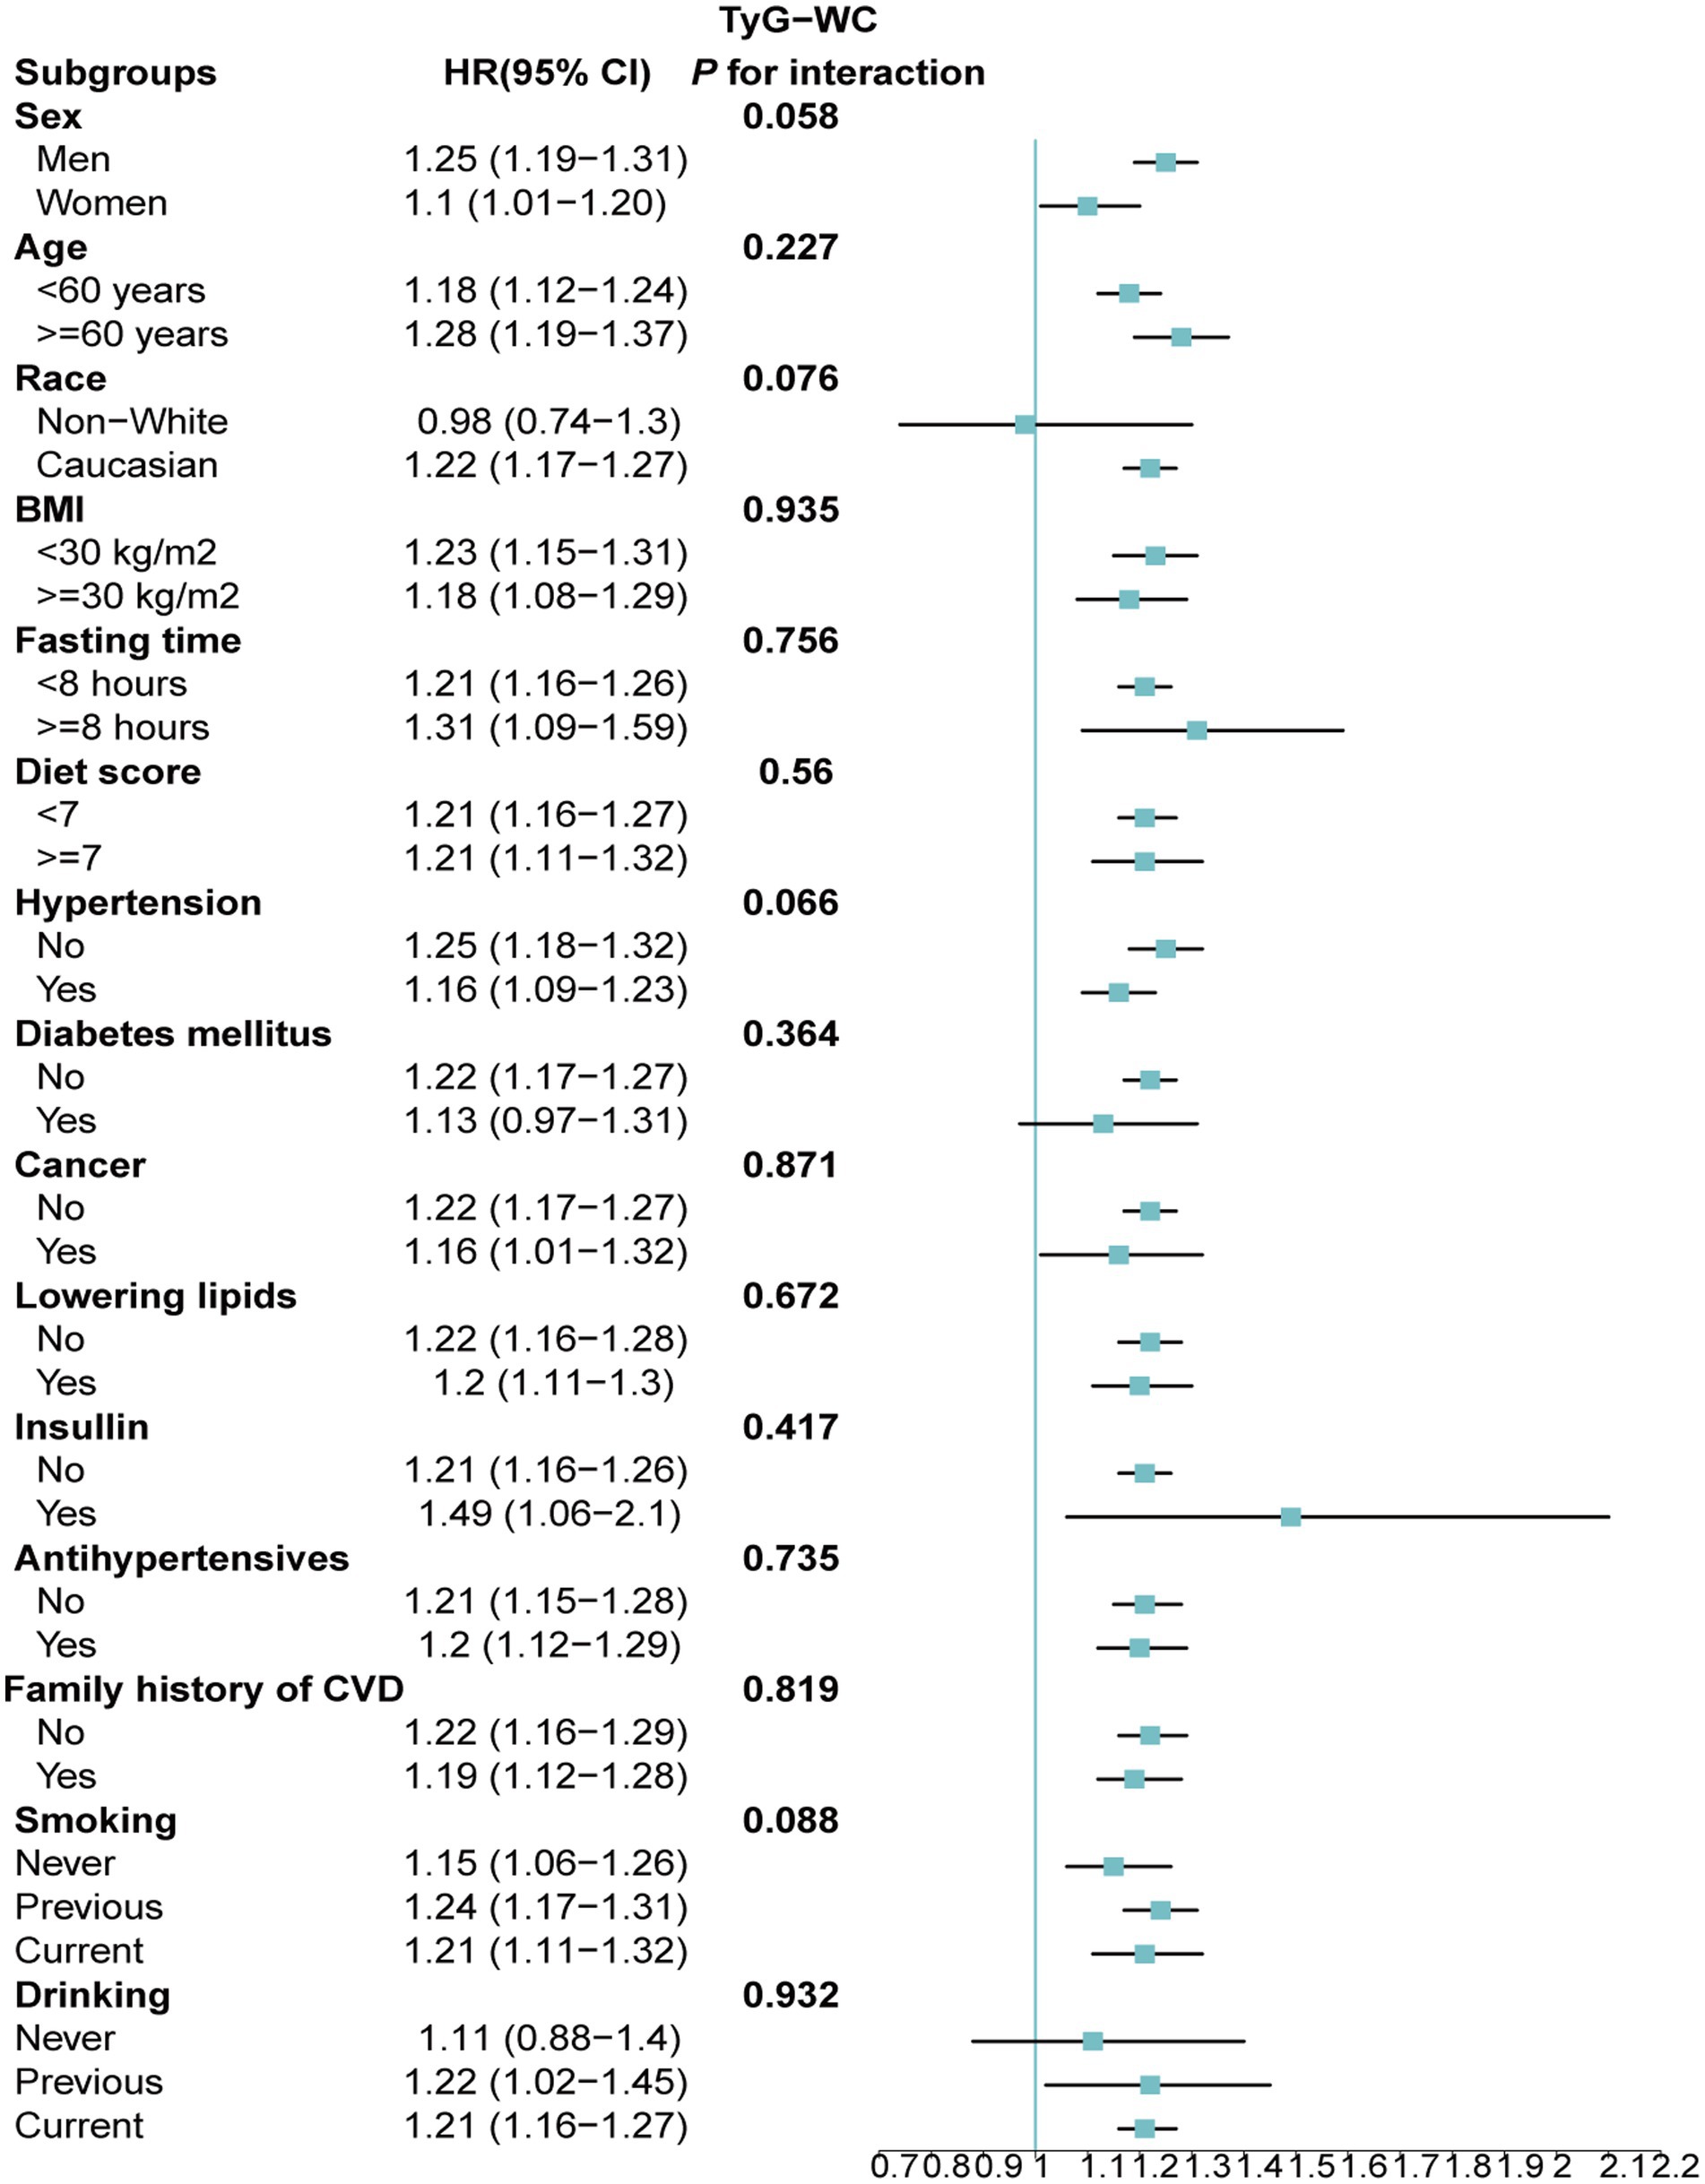
Figure 7. Association between each standard deviation increase in TyG-WC and the risk of AAD stratified by different clinical characteristics. AAD, aortic aneurysm and dissection; TyG-WC, triglyceride glucose index-waist circumference.
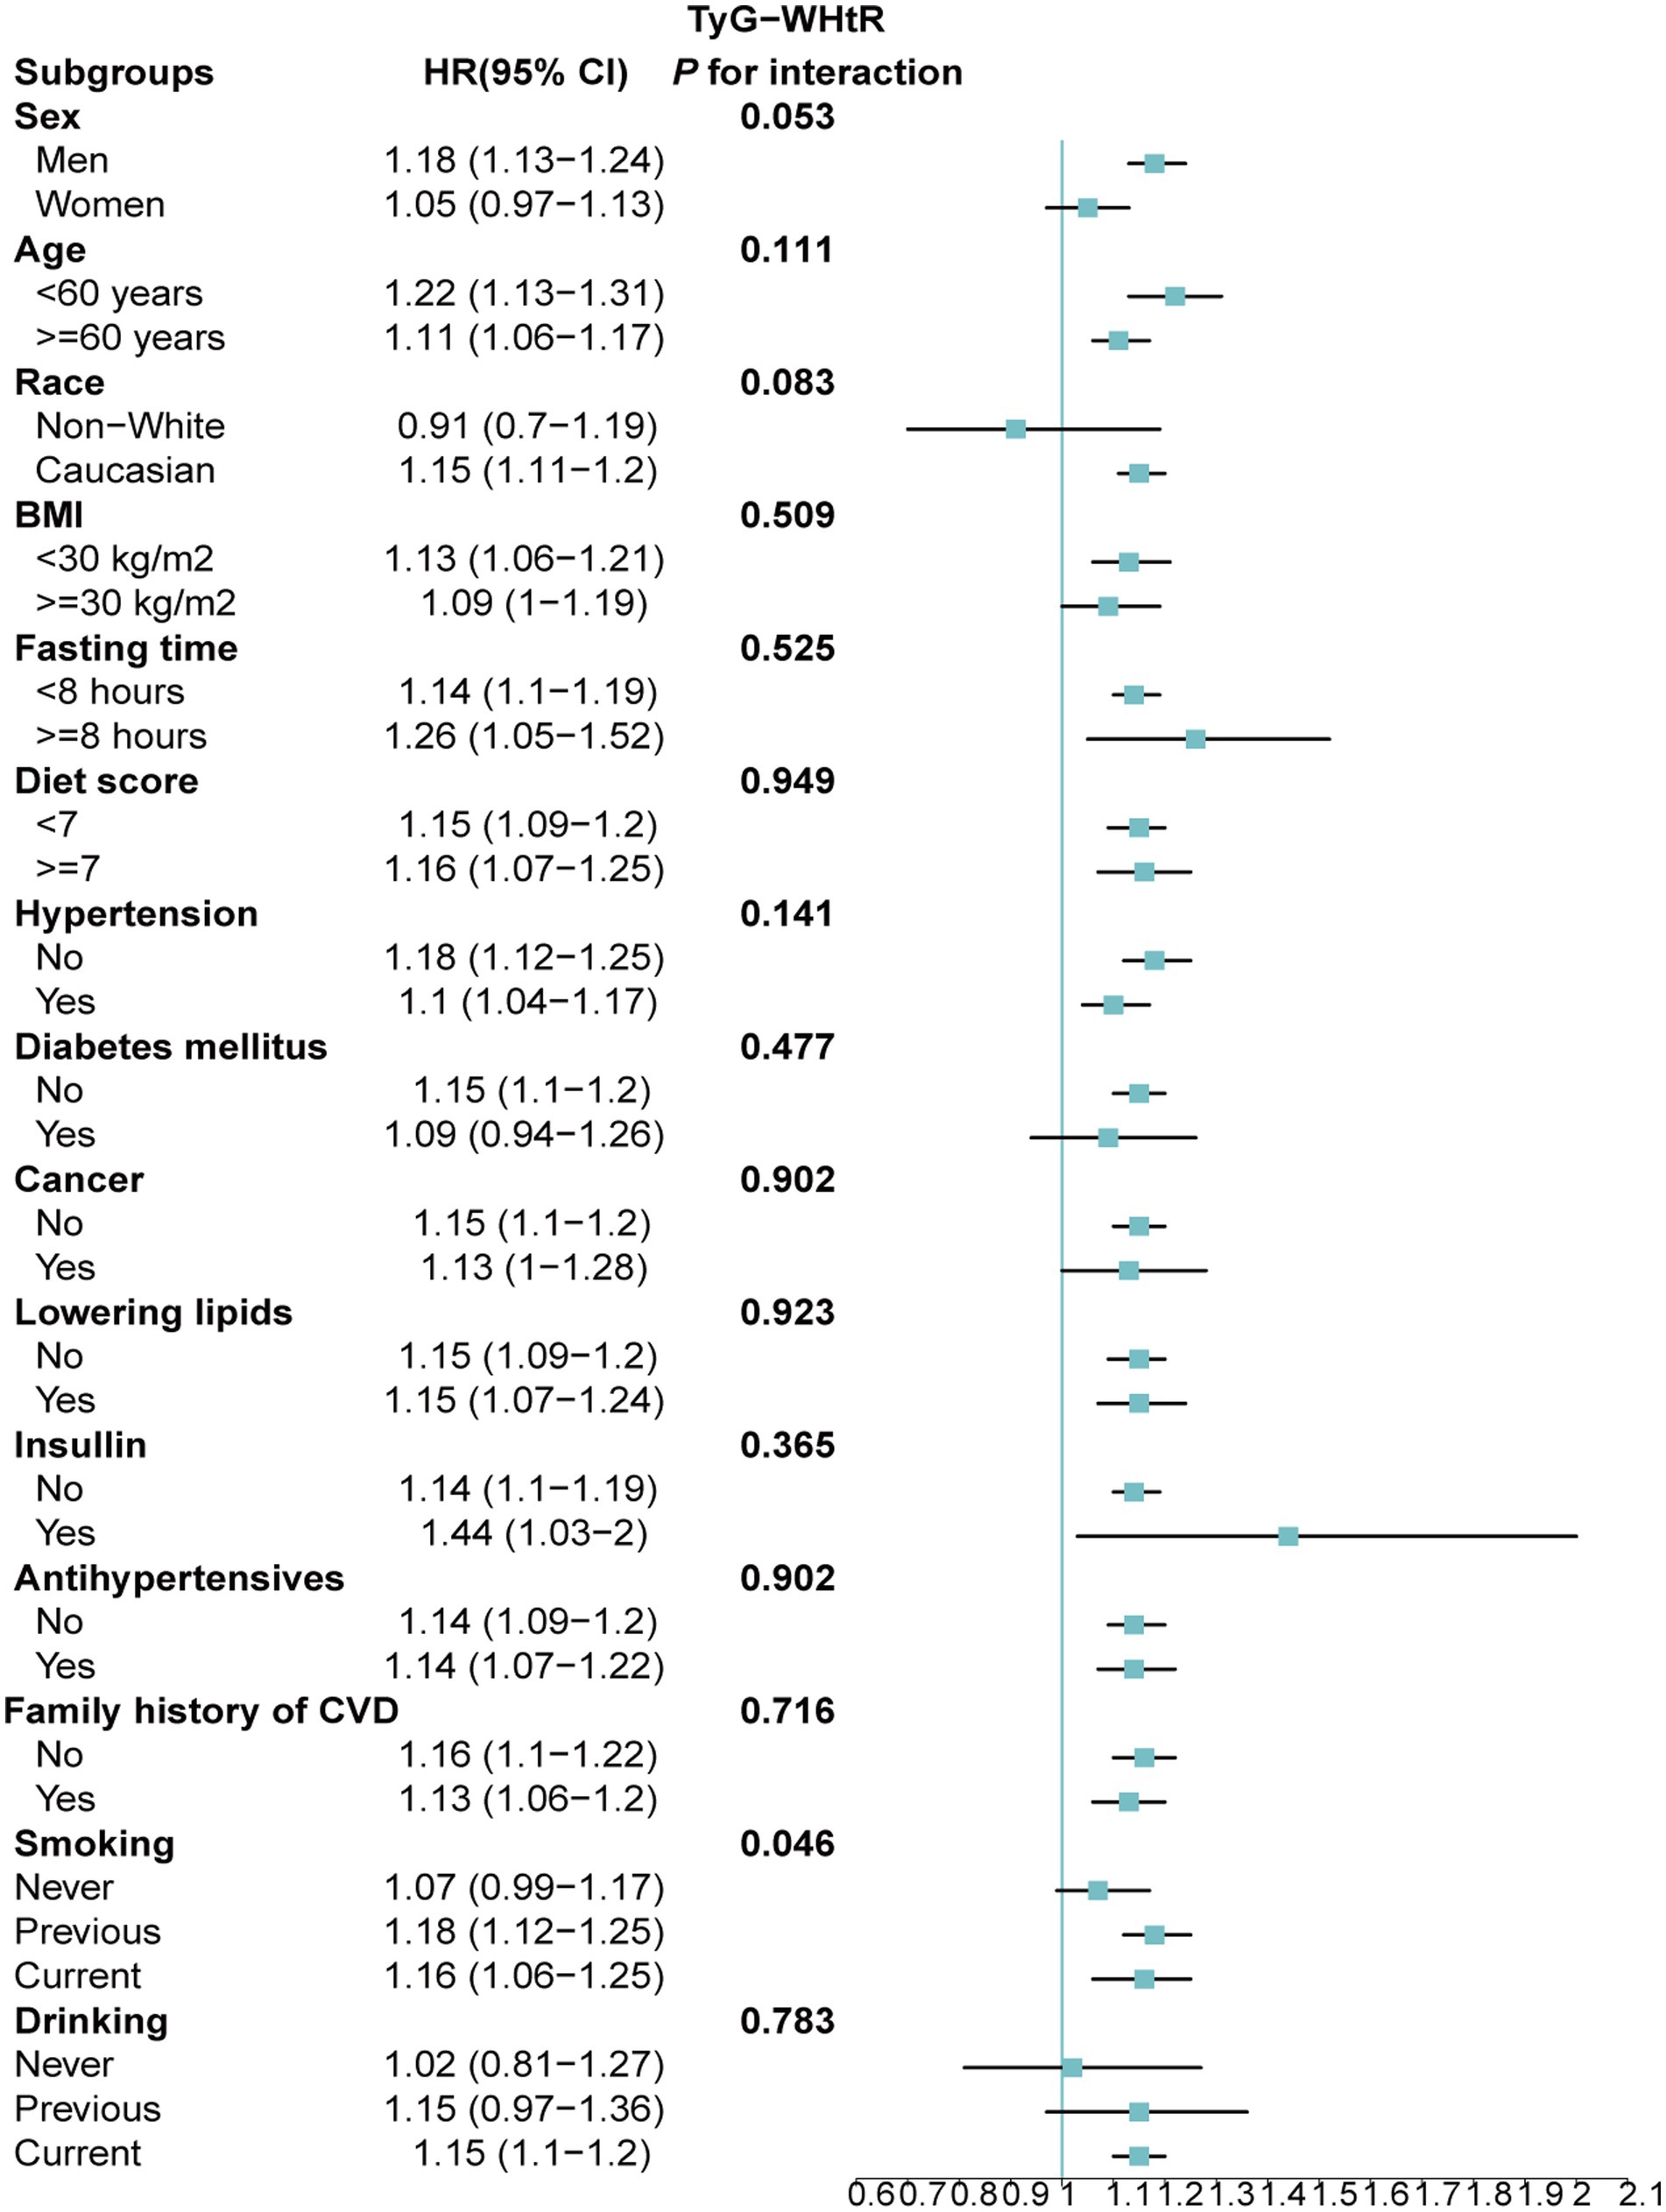
Figure 8. Association between each standard deviation increase in TyG-WHtR and the risk of AAD stratified by different clinical characteristics. AAD, aortic aneurysm and dissection; TyG-WHtR, triglyceride glucose index-waist height ratio.
In sensitivity analyses, the exclusion of participants within 2 years of follow-up and those with missing baseline covariates yielded consistent results with the main findings (Supplementary Tables S3, S4). Additionally, PSM analysis effectively balanced baseline characteristics between AAD and non-AAD groups (Supplementary Table S5). Subsequent Cox proportional hazards models post-PSM adjustment demonstrated consistent results (Supplementary Table S6).
This large-scale prospective cohort study, to the best of our knowledge, represents the first investigation into the interplay between the TyG index, obesity indices and AAD risk. Our findings underscore a significant positive association between TyG, TyG-BMI, TyG-WC, TyG-WHtR and AAD risk, with a linear relationship observed. Furthermore, elevations in these indices significantly accelerated AAD occurrence. Among these indicators, TyG-WC exhibited the strongest association with AAD risk, as indicated by a larger AUC. Furthermore, the associations of the four indicators with AAD were particularly prominent among individuals with BMI < 30 kg/m2, Caucasians, current smokers, alcohol consumers and those without a history of cancer.
The TyG index, serving as a surrogate marker for IR, has garnered attention owing to its convenience and high sensitivity and specificity (37). In a retrospective cohort study of individuals over 40 years old, Hong S et al. reported a 26% increased risk of stroke (HR: 1.26, 95% CI: 1.23–1.29) and a 31% increased risk of myocardial infarction (HR: 1.31, 95% CI: 1.28–1.35) among participants in the TyG Q4 group compared to the Q1 group (37, 38). Similarly, Wan Y et al. demonstrated a linear association between each unit increase in TyG and a 16% increase in CVD risk, consistent with our findings (39). Conversely, Che B et al. identified a nonlinear relationship between TyG and CVD risk (40).
TyG-BMI, TyG-WC and TyG-WHtR represent combinations of TyG with obesity metrics. A prospective cohort study revealed that each SD increase in TyG-BMI correlated with a 17% increase in CVD risk (HR: 1.17, 95% CI: 1.04–1.31). The linear relationship between TyG-BMI and CVD risk observed in this study aligns with our findings (41). Another subgroup cohort study investigating the association between TyG-BMI and prehypertension (pre-HTN) or hypertension (HTN) identified TyG-BMI as an independent risk factor for the development of pre-HTN and HTN, with a linear correlation between TyG-BMI and pre-HTN/HTN risk, particularly showing significant sex interaction (42). Consistent with our study, we also observed a significant sex interaction in the relationship between TyG-BMI and AAD risk.
TyG-WC and TyG-WHtR are two additional indices utilized in CVD identification. Dang K et al. demonstrated that elevated levels of TyG-WC and TyG-WHtR significantly increase the risk of CVD (24, 37). Furthermore, another study indicated that TyG-WC and TyG-WHtR exhibit a linear relationship with developing CVD risk, with TyG-WC (AUC = 0.63) and TyG-WHtR (AUC = 0.65) outperforming TyG (AUC = 0.59) and TyG-BMI (AUC = 0.58) in predicting CVD risk (43). Similarly, Miao H et al. found that TyG-WC and TyG-WHtR surpass TyG and TyG-BMI in predicting CVD, with TyG-WC showing the strongest predictive capability (44). In our study, we similarly observed that TyG-WC and TyG-WHtR were closely associated with AAD risk, displaying a linear relationship. Notably, TyG-WC exhibited the highest predictive performance for AAD, followed by TyG-WHtR, TyG and TyG-BMI. Although the AUC of TyG-WC was 0.65, it should be emphasized that this is only the predictive ability of a single indicator. The clinical symptoms of AAD are highly variable and the etiology of the disease is complex, which poses a diagnostic challenge. The accuracy of any single biomarker in predicting AAD is limited. In the future, the combination of TyG-WC with other markers should be considered to improve the predictive ability of AAD.
AAD represents a challenging medical event to predict in advance (45). Although factors such as male gender, older age, hypertension and a family history of aneurysms are associated with AAD risk, identifying high-risk populations remains difficult due to its low incidence rate (8). The occurrence of AAD may be linked to various cardiovascular-related conditions (46). In our study, to eliminate the potential confounding effects of heart disease on the study results, participants with a history of heart disease at baseline were excluded. Subgroup analysis revealed that TyG, TyG-BMI, TyG-WC and TyG-WHtR demonstrated a stronger impact on AAD occurrence in men, Caucasians, individuals with BMI < 30 kg/m2, those without hypertension, diabetes, a history of cancer, and without a family history of cardiovascular disease.
The mechanisms underlying AAD development in relation to the TyG index and its derivatives, TyG-BMI, TyG-WC and TyG-WHtR, remain incompletely understood but likely involve several aspects. Firstly, the TyG index comprises lipid and glucose components. The lipid portion inhibits insulin secretion, leading to ectopic fat deposition in muscle cells and subsequent IR (47). The glucose component may elevate reactive oxygen species (ROS) levels, exerting toxic effects on pancreatic β-cells and impairing their function, thereby contributing to IR (48). TyG-BMI, TyG-WC and TyG-WHtR combined with obesity indicators, reflect the accumulation of visceral fat, further exacerbating IR and metabolic disturbances, which in turn mediate systemic inflammation, endothelial dysfunction and vascular remodeling, thereby promoting atherosclerosis (49). Previous studies have highlighted a strong correlation between the TyG index and atherosclerosis (50, 51). Atherosclerosis weakens the arterial wall, rendering it more susceptible to AAD under fluctuations in blood pressure or mechanical stress (52). Endothelial injury and inflammatory reactions further weaken the arterial wall, facilitating blood infiltration into the medial layer, ultimately resulting in AAD occurrence (52). Moreover, vascular endothelial secretion of inflammatory factors such as vascular cell adhesion molecule-1 (VCAM-1) and intercellular adhesion molecule-1 (ICAM-1) induces platelet adhesion and aggregation, promoting thrombus formation and vascular endothelial damage and increases the risk of dissection formation and extension (53–55).
Our study boasts certain strengths. First, it is the first to explore the relationship between TyG and obesity-related indicators and the AAD risk using a prospective approach and comprehensive long-term follow-up data. Additionally, subgroup analysis identified high-risk populations for AAD, and sensitivity analysis enhanced the robustness of the results. However, several limitations should also be acknowledged. Firstly, data on TyG, TyG-BMI, TyG-WC and TyG-WHtR were collected only at baseline, preventing observation of dynamic changes during follow-up and their impact on AAD. Secondly, despite adjusting for known confounding factors, unmeasured variables may still influence outcomes due to the observational study design, precluding the establishment of causality. Thirdly, our study’s predominantly middle-aged and older adults, along with a predominantly White population, may limit generalizability to other demographics. Lastly, the likelihood of healthy individuals participating during UKB recruitment may underestimate AAD incidence.
The present study, based on a large prospective cohort design, showed that higher TyG index and its combination with obesity indices were significantly associated with the risk of AAD. Moreover, AFT models further showed that elevation of these indicators significantly advanced the onset of AAD. In addition, RCS analyses demonstrated a linear association between these indicators and the risk of AAD, and the TyG-WC showed higher predictive ability for AAD. These findings emphasize the potential application of the TyG index and its combination with obesity indicators in the early identification of AAD.
The datasets presented in this study can be found in online repositories. The names of the repository/repositories and accession number(s) can be found in the article/Supplementary material.
The studies involving humans were approved by UK Biobank /North West Multi-Center Research Ethics Committee (REC reference: 11/NW/0382). The studies were conducted in accordance with the local legislation and institutional requirements. The participants provided their written informed consent to participate in this study.
WY: Conceptualization, Methodology, Software, Writing – original draft, Writing – review & editing. XW: Conceptualization, Writing – original draft, Writing – review & editing. ZD: Writing – original draft, Writing – review & editing. WC: Investigation, Resources, Supervision, Validation, Visualization, Writing – original draft, Writing – review & editing.
The author(s) declare that financial support was received for the research, authorship, and/or publication of this article. This work was supported by Natural Science Foundation of Zhejiang Province, United Foundation of Beijing Zhongwei (LBY21H270002). WC is funded by China Scholarship Council (CSC No. 202009370095).
We extend our deepest gratitude to the study participants and the members of the UK Biobank cohort. The establishment of the UK Biobank was made possible through the efforts of the Wellcome Trust, Medical Research Council, Department of Health, Scottish Government, and the Northwest Regional Development Agency. We thank my colleague Chuang Yang for censoring the data. This study was conducted using the UK Biobank Resource, Application Number: 107335. Besides, we thank Bullet Edits Limited for the linguistic editing and proofreading of the manuscript.
The authors declare that the research was conducted in the absence of any commercial or financial relationships that could be construed as a potential conflict of interest.
All claims expressed in this article are solely those of the authors and do not necessarily represent those of their affiliated organizations, or those of the publisher, the editors and the reviewers. Any product that may be evaluated in this article, or claim that may be made by its manufacturer, is not guaranteed or endorsed by the publisher.
The Supplementary material for this article can be found online at: https://www.frontiersin.org/articles/10.3389/fnut.2024.1454880/full#supplementary-material
1. Takada, M, Yamagishi, K, Tamakoshi, A, and Iso, H. Height and mortality from aortic aneurysm and dissection. J Atheroscler Thromb. (2022) 29:1166–75. doi: 10.5551/jat.62941
2. Isselbacher, EM, Preventza, O, Augoustides, JG, Beck, AW, Bolen, MA, Braverman, AC, et al. ACC/AHA guideline for the diagnosis and Management of Aortic Disease: A report of the American Heart Association/American College of Cardiology Joint Committee on clinical practice guidelines. Circulation. (2022) 146:e334–482. doi: 10.1161/CIR.0000000000001106
3. Gouveia, E, Melo, R, Mourão, M, Caldeira, D, Alves, M, Lopes, A, et al. A systematic review and meta-analysis of the incidence of acute aortic dissections in population-based studies. J Vasc Surg. (2022) 75:709–20. doi: 10.1016/j.jvs.2021.08.080
4. Aboyans V, Causes of Death Collaborators. Global, regional, and national age-sex specific all-cause and cause-specific mortality for 240 causes of death, 1990–2013: A systematic analysis for the global burden of disease study 2013. Lancet (London, England). (2015) 385:117–71. doi: 10.1016/S0140-6736(14)61682-2
5. Conway, BD, Stamou, SC, Kouchoukos, NT, Lobdell, KW, Khabbaz, KR, Murphy, E, et al. Improved clinical outcomes and survival following repair of acute type A aortic dissection in the current era. Interact Cardiovasc Thorac Surg. (2014) 19:971–6. doi: 10.1093/icvts/ivu268
6. van Dorst, DCH, De, WNP, van der Pluijm, I, Roos-Hesselink, JW, Essers, J, and Danser, AH. Transforming growth factor-β and the renin-angiotensin system in syndromic thoracic aortic aneurysms: implications for treatment. Cardiovasc Drugs Ther. (2021) 35:1233–52. doi: 10.1007/s10557-020-07116-4
7. Xu, B, Xuan, H, Iida, Y, Miyata, M, and Dalman, RL. Pathogenic and therapeutic significance of angiotensin II type I receptor in abdominal aortic aneurysms. Curr Drug Targets. (2018) 19:1318–26. doi: 10.2174/1389450119666180122155642
8. Gawinecka, J, Schönrath, F, and Von, EA. Acute aortic dissection: pathogenesis, risk factors and diagnosis. Swiss Med Wkly. (2017) 147:w14489. doi: 10.4414/smw.2017.14489
9. Wang, H, Wang, L, Wang, J, Zhang, L, and Li, C. The biological effects of smoking on the formation and rupture of intracranial aneurysms: A systematic review and Meta-analysis. Front Neurol. (2022) 13:862916. doi: 10.3389/fneur.2022.862916
10. Hibino, M, Otaki, Y, Kobeissi, E, Pan, H, Hibino, H, Taddese, H, et al. Blood pressure, hypertension, and the risk of aortic dissection incidence and mortality: results from the J-SCH study, the UK biobank study, and a Meta-analysis of cohort studies. Circulation. (2022) 145:633–44. doi: 10.1161/CIRCULATIONAHA.121.056546
11. Liu, Z-L, Li, Y, Lin, Y-J, Shi, M-M, Fu, M-X, Li, Z-Q, et al. Aging aggravates aortic aneurysm and dissection via miR-1204-MYLK signaling axis in mice. Nat Commun. (2024) 15:5985. doi: 10.1038/s41467-024-50036-2
12. Barbetseas, J, Alexopoulos, N, Brili, S, Aggeli, C, Chrysohoou, C, Frogoudaki, A, et al. Atherosclerosis of the aorta in patients with acute thoracic aortic dissection. Circulation J Official J Japanese Circulation Society. (2008) 72:1773–6. doi: 10.1253/circj.cj-08-0433
13. Prakash, SK, Pedroza, C, Khalil, YA, and Milewicz, DM. Diabetes and reduced risk for thoracic aortic aneurysms and dissections: a nationwide case-control study. J Am Heart Assoc. (2012) 1:1. doi: 10.1161/JAHA.111.000323
14. Aizawa, K, Sakano, Y, Ohki, S, Saito, T, Konishi, H, and Misawa, Y. Obesity is a risk factor of young onset of acute aortic dissection and postoperative hypoxemia. Kyobu geka Japanese J Thoracic Surg. (2013) 66:437–44.
15. Hill, MA, Yang, Y, Zhang, L, Sun, Z, Jia, G, Parrish, AR, et al. Insulin resistance, cardiovascular stiffening and cardiovascular disease. Metab Clin Exp. (2021) 119:154766. doi: 10.1016/j.metabol.2021.154766
16. Lareyre, F, Moratal, C, Zereg, E, Carboni, J, Panaïa-Ferrari, P, Bayer, P, et al. Association of abdominal aortic aneurysm diameter with insulin resistance index. Biochem Med. (2018) 28:30702. doi: 10.11613/BM.2018.030702
17. Zheng, H, Qiu, Z, Chai, T, He, J, Zhang, Y, Wang, C, et al. Insulin resistance promotes the formation of aortic dissection by inducing the phenotypic switch of vascular smooth muscle cells. Front Cardiovascular Med. (2021) 8:732122. doi: 10.3389/fcvm.2021.732122
18. Kim, JK . Hyperinsulinemic-euglycemic clamp to assess insulin sensitivity in vivo. Methods Molecular Biol (Clifton, NJ). (2009) 560:221–38. doi: 10.1007/978-1-59745-448-3_15
19. Du, T, Yuan, G, Zhang, M, Zhou, X, Sun, X, and Yu, X. Clinical usefulness of lipid ratios, visceral adiposity indicators, and the triglycerides and glucose index as risk markers of insulin resistance. Cardiovasc Diabetol. (2014) 13:146. doi: 10.1186/s12933-014-0146-3
20. Ahn, N, Baumeister, SE, Amann, U, Rathmann, W, Peters, A, Huth, C, et al. Visceral adiposity index (VAI), lipid accumulation product (LAP), and product of triglycerides and glucose (TyG) to discriminate prediabetes and diabetes. Sci Rep. (2019) 9:9693. doi: 10.1038/s41598-019-46187-8
21. Yang, Y, Huang, X, Wang, Y, Leng, L, Xu, J, Feng, L, et al. The impact of triglyceride-glucose index on ischemic stroke: a systematic review and meta-analysis. Cardiovasc Diabetol. (2023) 22:2. doi: 10.1186/s12933-022-01732-0
22. Tao, L-C, Xu, J-N, Wang, T-T, Hua, F, and Li, J-J. Triglyceride-glucose index as a marker in cardiovascular diseases: landscape and limitations. Cardiovasc Diabetol. (2022) 21:68. doi: 10.1186/s12933-022-01511-x
23. Nabipoorashrafi, SA, Seyedi, SA, Rabizadeh, S, Ebrahimi, M, Ranjbar, SA, Reyhan, SK, et al. The accuracy of triglyceride-glucose (TyG) index for the screening of metabolic syndrome in adults: A systematic review and meta-analysis. Nutr Metab Cardiovasc Dis. (2022) 32:2677–88. doi: 10.1016/j.numecd.2022.07.024
24. Dang, K, Wang, X, Hu, J, Zhang, Y, Cheng, L, Qi, X, et al. The association between triglyceride-glucose index and its combination with obesity indicators and cardiovascular disease: NHANES 2003-2018. Cardiovasc Diabetol. (2024) 23:8. doi: 10.1186/s12933-023-02115-9
25. Zeng, ZY, Liu, SX, Xu, H, Xu, X, Liu, XZ, and Zhao, XX. Association of triglyceride glucose index and its combination of obesity indices with prehypertension in lean individuals: A cross-sectional study of Chinese adults. J Clin Hypertens (Greenwich). (2020) 22:1025–32. doi: 10.1111/jch.13878
26. Sudlow, C, Gallacher, J, Allen, N, Beral, V, Burton, P, Danesh, J, et al. UK biobank: an open access resource for identifying the causes of a wide range of complex diseases of middle and old age. PLoS Med. (2015) 12:e1001779. doi: 10.1371/journal.pmed.1001779
27. Elliott, P, and Peakman, TC. The UK biobank sample handling and storage protocol for the collection, processing and archiving of human blood and urine. Int J Epidemiol. (2008) 37:234–44. doi: 10.1093/ije/dym276
28. Alshamiri, MQ, Mohd A Habbab, F, al-Qahtani, SS, Alghalayini, KA, al-Qattan, OM, and el-shaer, F. Waist-to-height ratio (WHtR) in predicting coronary artery disease compared to body mass index and waist circumference in a single center from Saudi Arabia. Cardiol Res Pract. (2020) 2020:4250793–6. doi: 10.1155/2020/4250793
29. Fritz, J, Bjørge, T, Nagel, G, Manjer, J, Engeland, A, Häggström, C, et al. The triglyceride-glucose index as a measure of insulin resistance and risk of obesity-related cancers. Int J Epidemiol. (2020) 49:193–204. doi: 10.1093/ije/dyz053
30. Xing, Y, Liu, J, Gao, Y, Zhu, Y, Zhang, Y, and Ma, H. Stronger associations of TyG index with diabetes than TyG-obesity-related parameters: more pronounced in Young, middle-aged, and women. Diabetes, metabolic syndrome and obesity targets and therapy. (2023) 16:3795–805. doi: 10.2147/DMSO.S433493
31. Craig, CL, Marshall, AL, Sjöström, M, Bauman, AE, Booth, ML, Ainsworth, BE, et al. International physical activity questionnaire: 12-country reliability and validity. Med Sci Sports Exerc. (2003) 35:1381–95. doi: 10.1249/01.MSS.0000078924.61453.FB
32. Shweikh, Y, Ko, F, Chan, MP, Patel, PJ, Muthy, Z, Khaw, PT, et al. Measures of socioeconomic status and self-reported glaucoma in the U.K. biobank cohort. Eye (Lond). (2015) 29:1360–7. doi: 10.1038/eye.2015.157
33. Petermann-Rocha, F, Ho, FK, Foster, H, Boopor, J, Parra-Soto, S, Gray, SR, et al. Nonlinear associations between cumulative dietary risk factors and cardiovascular diseases, Cancer, and all-cause mortality: A prospective cohort study from UK biobank. Mayo Clin Proc. (2021) 96:2418–31. doi: 10.1016/j.mayocp.2021.01.036
34. Tennant, PW, Murray, EJ, Arnold, KF, Berrie, L, Fox, MP, Gadd, SC, et al. Use of directed acyclic graphs (DAGs) to identify confounders in applied health research: review and recommendations. Int J Epidemiol. (2021) 50:620–32. doi: 10.1093/ije/dyaa213
35. Pang, M, Platt, RW, Schuster, T, and Abrahamowicz, M. Spline-based accelerated failure time model. Stat Med. (2021) 40:481–97. doi: 10.1002/sim.8786
36. Kane, LT, Fang, T, Galetta, MS, Goyal, DK, Nicholson, KJ, Kepler, CK, et al. Propensity score matching: A statistical method. Clin Spine Surg. (2020) 33:120–2. doi: 10.1097/BSD.0000000000000932
37. Guerrero-Romero, F, Simental-Mendía, LE, González-Ortiz, M, Martínez-Abundis, E, Ramos-Zavala, MG, Hernández-González, SO, et al. The product of triglycerides and glucose, a simple measure of insulin sensitivity. Comparison with the euglycemic-hyperinsulinemic clamp. J Clin Endocrinol Metab. (2010) 95:3347–51. doi: 10.1210/jc.2010-0288
38. Hong, S, Han, K, and Park, C-Y. The triglyceride glucose index is a simple and low-cost marker associated with atherosclerotic cardiovascular disease: a population-based study. BMC Med. (2020) 18:361. doi: 10.1186/s12916-020-01824-2
39. Wan, Y, Zhang, Z, Ling, Y, Cui, H, Tao, Z, Pei, J, et al. Association of triglyceride-glucose index with cardiovascular disease among a general population: a prospective cohort study. Diabetol Metab Syndr. (2023) 15:204. doi: 10.1186/s13098-023-01181-z
40. Che, B, Zhong, C, Zhang, R, Pu, L, Zhao, T, Zhang, Y, et al. Triglyceride-glucose index and triglyceride to high-density lipoprotein cholesterol ratio as potential cardiovascular disease risk factors: an analysis of UK biobank data. Cardiovasc Diabetol. (2023) 22:34. doi: 10.1186/s12933-023-01762-2
41. Li, F, Wang, Y, Shi, B, Sun, S, Wang, S, Pang, S, et al. Association between the cumulative average triglyceride glucose-body mass index and cardiovascular disease incidence among the middle-aged and older population: a prospective nationwide cohort study in China. Cardiovasc Diabetol. (2024) 23:16. doi: 10.1186/s12933-023-02114-w
42. Chen, L, He, L, Zheng, W, Liu, Q, Ren, Y, Kong, W, et al. High triglyceride glucose-body mass index correlates with prehypertension and hypertension in east Asian populations: A population-based retrospective study. Front Cardiovascular Med. (2023) 10:1139842. doi: 10.3389/fcvm.2023.1139842
43. Park, H-M, Han, T, Heo, S-J, and Kwon, Y-J. Effectiveness of the triglyceride-glucose index and triglyceride-glucose-related indices in predicting cardiovascular disease in middle-aged and older adults: A prospective cohort study. J Clin Lipidol. (2024) 18:e70–9. doi: 10.1016/j.jacl.2023.11.006
44. Miao, H, Zhou, Z, Yang, S, and Zhang, Y. The association of triglyceride-glucose index and related parameters with hypertension and cardiovascular risk: a cross-sectional study. Hypertension Res Official J Japanese Society of Hypertension. (2024) 47:877–86. doi: 10.1038/s41440-023-01502-9
45. Evangelista, A, Isselbacher, EM, Bossone, E, Gleason, TG, Di Eusanio, M, Sechtem, U, et al. Insights from the international registry of acute aortic dissection: A 20-year experience of collaborative clinical research. Circulation. (2018) 137:1846–60. doi: 10.1161/CIRCULATIONAHA.117.031264
46. Zhou, Z, Cecchi, AC, Prakash, SK, and Milewicz, DM. Risk factors for thoracic aortic dissection. Gene. (2022) 13:13. doi: 10.3390/genes13101814
47. Athyros, VG, Doumas, M, Imprialos, KP, Stavropoulos, K, Georgianou, E, Katsimardou, A, et al. Diabetes and lipid metabolism. Hormones (Athens). (2018) 17:61–7. doi: 10.1007/s42000-018-0014-8
48. Dong, K, Ni, H, Wu, M, Tang, Z, Halim, M, and Shi, D. ROS-mediated glucose metabolic reprogram induces insulin resistance in type 2 diabetes. Biochem Biophys Res Commun. (2016) 476:204–11. doi: 10.1016/j.bbrc.2016.05.087
49. Owusu, J, and Barrett, E. Early microvascular dysfunction: is the vasa Vasorum a "missing link" in insulin resistance and atherosclerosis. Int J Mol Sci. (2021) 22:7574. doi: 10.3390/ijms22147574
50. Zhao, J, Fan, H, Wang, T, Yu, B, Mao, S, Wang, X, et al. TyG index is positively associated with risk of CHD and coronary atherosclerosis severity among NAFLD patients. Cardiovasc Diabetol. (2022) 21:123. doi: 10.1186/s12933-022-01548-y
51. Lambrinoudaki, I, Kazani, MV, Armeni, E, Georgiopoulos, G, Tampakis, K, Rizos, D, et al. The TyG index as a marker of subclinical atherosclerosis and arterial stiffness in lean and overweight postmenopausal women. Heart Lung Circ. (2018) 27:716–24. doi: 10.1016/j.hlc.2017.05.142
52. Skotsimara, G, Antonopoulos, A, Oikonomou, E, Papastamos, C, Siasos, G, and Tousoulis, D. Aortic Wall inflammation in the pathogenesis, diagnosis and treatment of aortic aneurysms. Inflammation. (2022) 45:965–76. doi: 10.1007/s10753-022-01626-z
53. Singh, V, Kaur, R, Kumari, P, Pasricha, C, and Singh, R. ICAM-1 and VCAM-1: gatekeepers in various inflammatory and cardiovascular disorders. Clinica chimica acta; Int J Clin Chem. (2023) 548:117487. doi: 10.1016/j.cca.2023.117487
54. Massberg, S, Brand, K, Grüner, S, Page, S, Müller, E, Müller, I, et al. A critical role of platelet adhesion in the initiation of atherosclerotic lesion formation. J Exp Med. (2002) 196:887–96. doi: 10.1084/jem.20012044
Keywords: TyG, TyG-BMI, TyG-WC, TyG-WHtR, aortic aneurysm and dissection, UK biobank
Citation: Yu W, Wang X, Du Z and Cheng W (2024) Association of triglyceride-glucose index and its combination with obesity indicators in predicting the risk of aortic aneurysm and dissection. Front. Nutr. 11:1454880. doi: 10.3389/fnut.2024.1454880
Received: 25 June 2024; Accepted: 09 October 2024;
Published: 23 October 2024.
Edited by:
Jagannath Misra, Indiana University, Purdue University Indianapolis, United StatesReviewed by:
Mithun Rudrapal, Vignan’s Foundation for Science, Technology and Research, IndiaCopyright © 2024 Yu, Wang, Du and Cheng. This is an open-access article distributed under the terms of the Creative Commons Attribution License (CC BY). The use, distribution or reproduction in other forums is permitted, provided the original author(s) and the copyright owner(s) are credited and that the original publication in this journal is cited, in accordance with accepted academic practice. No use, distribution or reproduction is permitted which does not comply with these terms.
*Correspondence: Wenke Cheng, Y3drMjUxN0AxNjMuY29t
Disclaimer: All claims expressed in this article are solely those of the authors and do not necessarily represent those of their affiliated organizations, or those of the publisher, the editors and the reviewers. Any product that may be evaluated in this article or claim that may be made by its manufacturer is not guaranteed or endorsed by the publisher.
Research integrity at Frontiers

Learn more about the work of our research integrity team to safeguard the quality of each article we publish.