- 1Department of Infectious Diseases, The Second Affiliated Hospital of Chongqing Medical University, Chongqing, China
- 2Department of Infectious Diseases, The Ninth People’s Hospital of Chongqing, Chongqing, China
Background: Although malnutrition is associated with poor prognosis in Pulmonary Tuberculosis (PTB) patients, no nutrition-based prediction model has been established for PTB. Herein, we explored the clinical utility of common nutrition scores in predicting the prognosis of PTB patients.
Methods: We retrospectively collected clinical baseline data from 167 patients with secondary PTB who had not previously received anti-TB treatment. Subsequently, we determined the CONUT score, PNI index, and NPS score and evaluated the treatment efficacy using changes in lung lesions revealed by the chest CT scan. The Area Under the Receiver Operating Characteristic (AUROC) curve was used to quantify the predictive values of CONUT, PNI, and NPS scores for anti-TB efficacy in new-onset PTB patients, and the critical CONUT, PNI, and NPS values were determined using the Youden Index. We also performed univariate and multivariate analyses of prognostic factors in PTB patients to determine the nutrition scores and other clinical factors associated with the prognosis of patients with the new-onset PTB.
Results: The Youden Index revealed that the critical CONUT score value for patients with PTB was 4.5, with a sensitivity of 72.2% and specificity of 96.6%. In contrast, the critical cut-off values of the PNI index and the NPS score were 39.825 and 3.5, respectively. Univariate analysis of the predictors of poor prognosis in PTB patients showed that patients with diabetes, COPD, pneumonia, and hypoproteinemia (which were risk factors) had a poor prognosis (p < 0.05). Multivariate analysis revealed that the CONUT score, PNI, NPS, and NRS-2002 were independent predictors of unfavorable PTB outcomes, with adjusted ORs of 60.419 (95%CI: 16.186–225.524, p < 0.0001), 23.667 (95% CI: 9.317–60.115, p < 0.0001), 8.512 (95% CI: 3.762–19.257, p < 0.0001), 0.612 (95% CI: 4.961–39.161, p < 0.0001), respectively. The Area Under the Curve (AUC) of the CONUT score in predicting poor prognosis of PTB patients was 0.885 (95% CI:0.830–0.940, p < 0.0001), which is comparable to that of the PNI index (0.862, 95% CI: 0.805–0.920, p < 0.0001), but higher than that of NPS (0.774, 95% CI: 0.702–0.846, p < 0.0001), BMI (0.627, 95% CI: 0.541–0.717, p < 0.0001), and NRS-2002 (0.763, 95% CI: 0.688–0.838, p < 0.0001). We discovered that older patients (p < 0.0001), male participants (p < 0.05), and patients with Diabetes Mellitus (DM) (p < 0.0001) and Chronic Obstructive Pulmonary Disease (COPD) (p < 0.05) were more likely to have a high CONUT score.
Conclusion: The poor prognosis of PTB patients was related to a high CONUT score, low PNI index, and high NPS score, of which the specificity and sensitivity of the CONUT score were higher than those of the PNI index and the NPS score.
1 Introduction
Tuberculosis (TB), a chronic disease caused by Mycobacterium tuberculosis (MTB), will continue to be a major global public health problem. In 2022, TB incidence and mortality were reported to be 10.6 million and 1.3 million people, respectively, with a significantly higher prevalence in developing countries than in developed economies (1). The lung is the body organ most susceptible to MTB, with reported lung involvement rates in subjects with active TB ranging between 79 and 87% (2, 3).
In all pathogen infections, a complex interplay between host response and microbial virulence, which regulates the overall metabolic response as well as the extent of tissue damage, prevails. According to research, TB leads to malnutrition, and malnourished patients are highly susceptible to TB (4). Malnutrition is considered an independent risk factor for TB recurrence (5) as well as an important and potentially reversible risk factor for treatment failure (6). Malnutrition can be assessed in various ways, and although BMI and NRS-2002 are readily available and simple to use; hence, they are commonly employed, they mostly focus on macro factors such as patient disease status and body weight (7). According to previous research, albumin levels, lymphocyte count, cholesterol content, and other laboratory results are related to the prognosis of PTB patients (8). Therefore, based on nutritional assessment, more reliable combined scoring systems such as the Controlling Nutritional Status (CONUT) score, the Prognostic Nutritional Index (PNI), and the Naples Prognostic Score (NPS) were developed to accurately predict patient prognoses. Herein, we hope to verify the applicability of these screening systems in patients who are most likely to benefit from nutritional interventions and better inform anti-TB therapy.
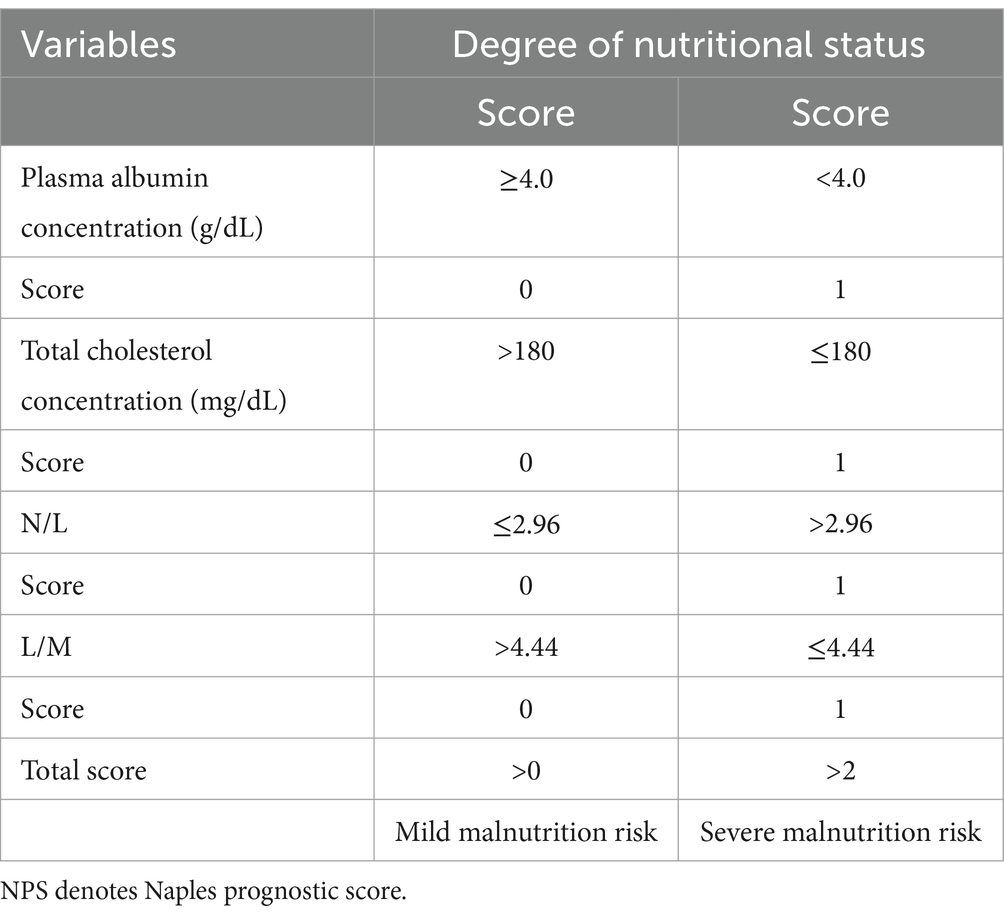
The CONUT score, an objective and easy-to-apply biomarker for predicting the prognosis of cancer patients (9, 10), encompasses serum albumin levels, cholesterol content, and lymphocyte counts (11) (Table 1). On the other hand, the PNI score is determined based on the following formula: (10 × albumin level [g/dL]) + (0.005 × lymphocyte count [number/mm3]) (12). It was originally designed to determine the risk of postoperative complications following Gastrointestinal (GI) surgery. Simple calculations employing experimentally determined formulas can quantify the nutritional status associated with patient outcomes. Finally, Galizia et al. developed a new research method, the NPS Score (Table 2), a scoring system comprising serum albumin content, Total Cholesterol (TC) level, Neutrophyl-to-Lymphocyte Ratio (NLR), and the Lymphocyte-to-Monocyte Ratio (LMR), that can comprehensively reflect patients’ immune and nutritional status (13). These three systems have been demonstrated to predict the prognosis of patients with Non-Small Cell Lung Cancer (NSCLC), breast cancer, and GI tumors (14–16). However, the correlation of the CONUT score, the PNI index, and the NPS score with outcomes in TB patients has not been reported. As a result, this study aims to explore the predictive value of the above-mentioned screening systems in the prognosis of TB patients, and to compare their predictive ability.
2 Methods
2.1 Patients
We retrospectively collected clinical data on patients with new-onset secondary PTB who hospitalized in TB-designated hospitals of Beibei district (the Nine People’s Hospital of Chongqing) between January 2021 and December 2021.
The inclusion criteria were as follows: (1) Patients clearly diagnosed with secondary PTB per the diagnostic criteria for secondary PTB (WS288-2017) (17); (2) Patients positive for MTBC (Mycobacterium tuberculosis Complex) who returned negative results for RIF resistance per the Xpert MTB/RIF (Rifampicin) test; (3) Patients administered with first-line antituberculosis drugs such as rifampicin (R), isoniazid (H), ethambutol (E), and pyrazinamide (Z), and adopted specific treatment courses and plans based on the patient’s weight and comorbidities; and (4) Patients who underwent chest CT scan again at the end of 6 months of anti-TB treatment for evaluating PTB lesions.
The exclusion criteria were as follows: (1) Patients not on drugs or any regular follow-up assessments; (2) Patients who have previously received anti-TB treatment or those with missing data on their TB condition pre-treatment. (3) Patients on long-term use of Glucocorticoids (GCs) or drugs affecting albumin levels and lymphocyte count.
2.2 Data collection
We obtained clinical data on PTB patients before anti-TB treatment from the hospital’s Information Management System (IMS) and used it as the baseline. Specifically, we collected data on general demographics (age, gender, occupation, days of hospital stay, and so on), drug and alcohol use history (such as smoking and drinking), comorbidities [such as hypertension, Diabetes Mellitus (DM), renal insufficiency, hyperlipidemia, Chronic Obstructive Pulmonary Disease (COPD), and Acquired Immunodeficiency Syndrome (AIDS)], laboratory tests (such as blood routine tests, liver function tests, kidney function tests, blood lipids, sputum culture, sputum smear, chest CT, and so on) and complications, (such as respiratory failure, pulmonary infection, and so on).
The efficacy of anti-TB drug treatment was assessed through chest Computed Tomography (CT) scans to observe radiological features per the national guidelines.
(1) Infiltrated lesions
a. Obvious absorption: Lesion absorption ≥1/2 of the original lesion.
b. Absorption: Lesion absorption <1/2 of the original lesion.
c. Unchanged: No significant change in the lesion.
d. Worsening: Lesion expansion or dissemination.
(2) Cavities
a. Closure: Obstructive closure and scar closure or disappearance.
b. Reduction: Cavity reduction ≥ ½ of the original cavity diameter.
c. Unchanged: Cavity reduction or increase < ½ of the original cavity diameter.
d. Increase: Cavity increase ≥ ½ of the original cavity diameter.
This study was approved by the Ethical Review Committee of the Ninth People’s Hospital of Chongqing for the use of clinical data, and was conducted per the 1964 Declaration of Helsinki. All patients gave informed consent before participating herein.
All statistical analyses were performed using SPSS v25.0. Continuous variables were expressed as Mean ± Standard Deviation (SD) and compared using two independent sample t-tests or Mann–Whitney U tests. On the other hand, categorical variables were expressed as counts (N) or percentages (%) and compared using the chi-square test or Fisher’s exact test. The Area under the Receiver Operating Characteristic (AUROC) curve of the six-month anti-TB treatment efficacy was used to quantify the predictive value of CONUT, PNI, NPS, BMI and NRS-2002 for the anti-TB efficacy in treatment-naive new onset PTB patients. The maximum Youden Index value was used as the best cut-off value to classify patients into two groups. Spearman’s correlation was used to evaluate the correlation of the key five parameters (CONUT, PNI, NPS, BMI, and NRS-2002) with prognosis, as well as among the five individual measures. Univariate and multivariate Logistic regression analyses were performed to determine the independent predictors of anti-TB treatment efficacy, and the Odds Ratio (OR) and 95% Confidence Interval (CI) were calculated. Results with p < 0.05 were considered statistically significant.
3 Results
3.1 Clinical features
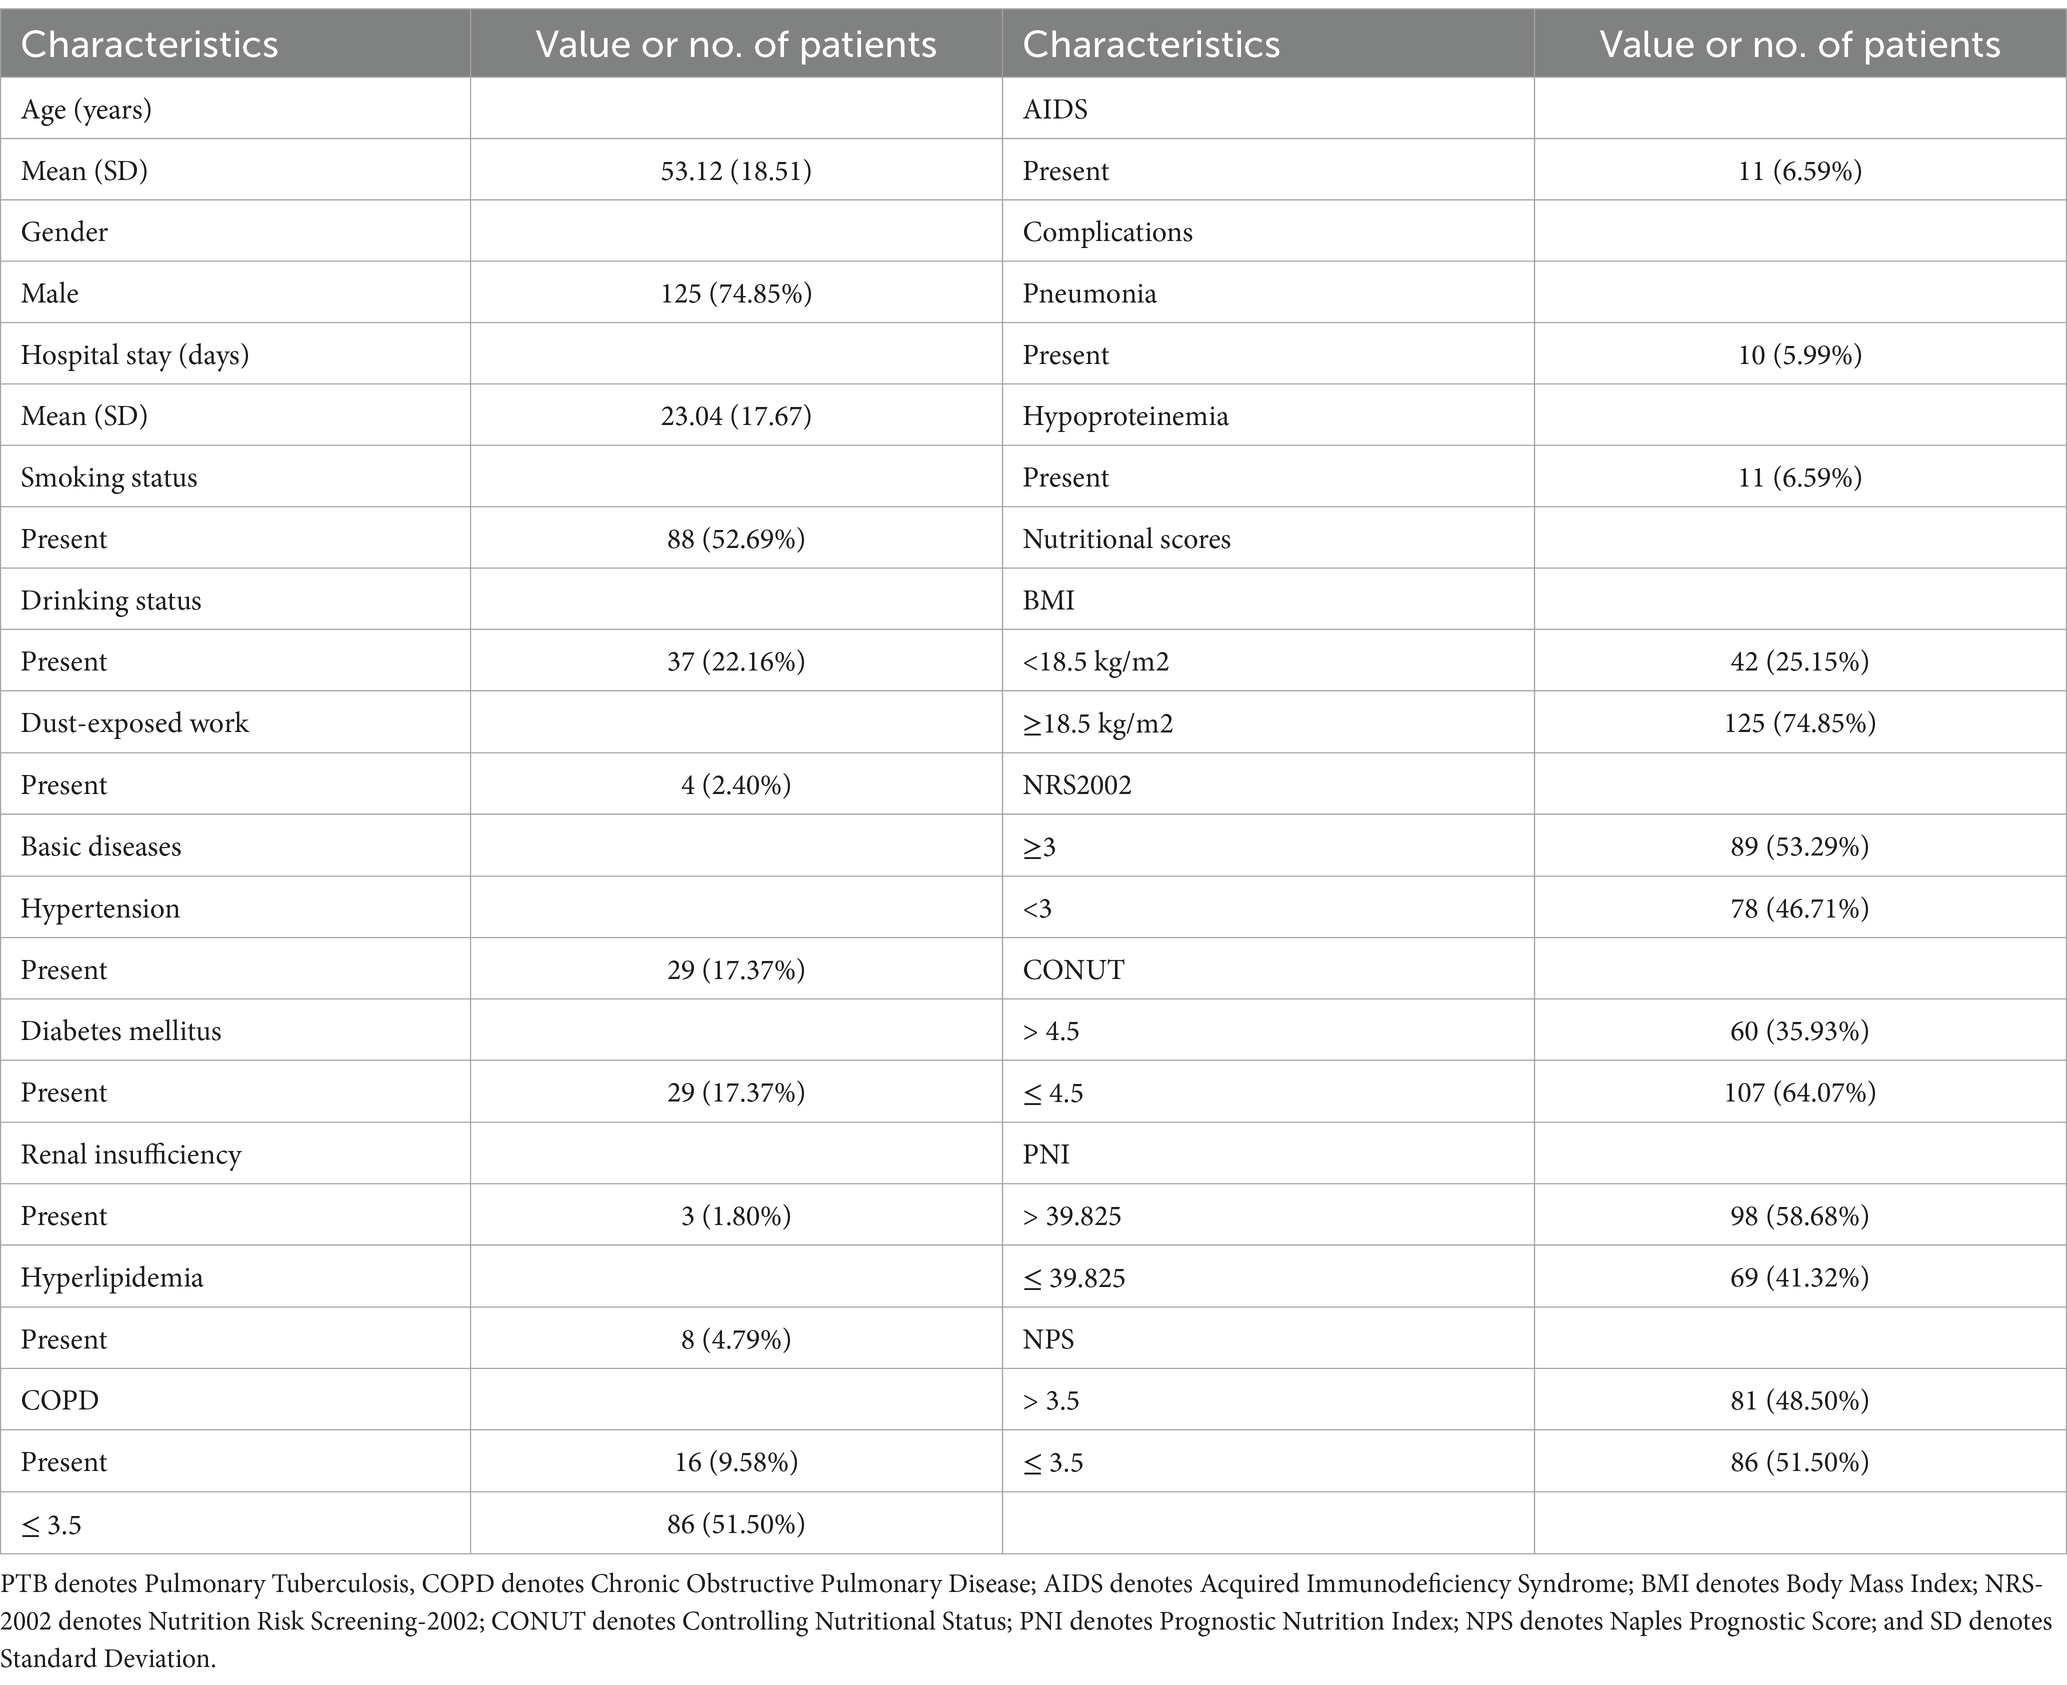
Table 3 summarizes the clinical characteristics of 167 PTB patients before anti-TB treatment. Age ranged between 14 and 85 years, with an average of 53 years. Days of hospital stay ranged between 3 and 122 days, with an average of 23 days. Among the patients enrolled, 88 (52.69%), 37 (22.16%), and 4 (2.40%) had a history of smoking, drinking, and dust work, respectively. Additionally, among the patients, 29 (17.37%), 29 (17.37%), 3 (1.80%), 8 (4.79%), 16 (9.58%), and 11 (6.59%) had hypertension, diabetes, renal insufficiency, hyperlipidemia, COPD, and AIDS, respectively. Major complications included pneumonia and hypoproteinemia in 10 (5.99%) and 11 (6.59%) patients, respectively. Furthermore, among the patients, 42 (25.15%) were underweight (BMI < 18.5 kg/m2), 89 (53.29%) had NRS-2002 scores ≥3 and were at risk of malnutrition, 60 (35.93%) had CONUT scores >4.5, 69 (41.32%) had PNI ≤39.825, and 81 (48.50%) had NPS scores >3.5.
3.2 Univariate analysis of prognosis
Demographics, clinical features, and laboratory test results were subjected to univariate statistical analysis in relation to PTB prognosis (Table 4). Age (p < 0.0001) and days of hospital stay (p < 0.05) were found to be risk factors for the prognosis of PTB patients. Patients with DM (p < 0.05), COPD (p < 0.05), and pneumonia (p < 0.05) were more likely to have adverse outcomes. Among the laboratory test results, TC (p < 0.0001), albumin (p < 0.0001), N/L (p < 0.0001), M/L (p < 0.05), and P/L (p < 0.05) were significantly associated with an unfavorable outcome. On the other hand, nutritional assessment revealed that BMI (p < 0.05), NRS-2002 (p < 0.0001), CONUT (p < 0.0001), PNI (p < 0.0001), and NPS (p < 0.0001) may be prognostic risk factors. All results were statistically significant.
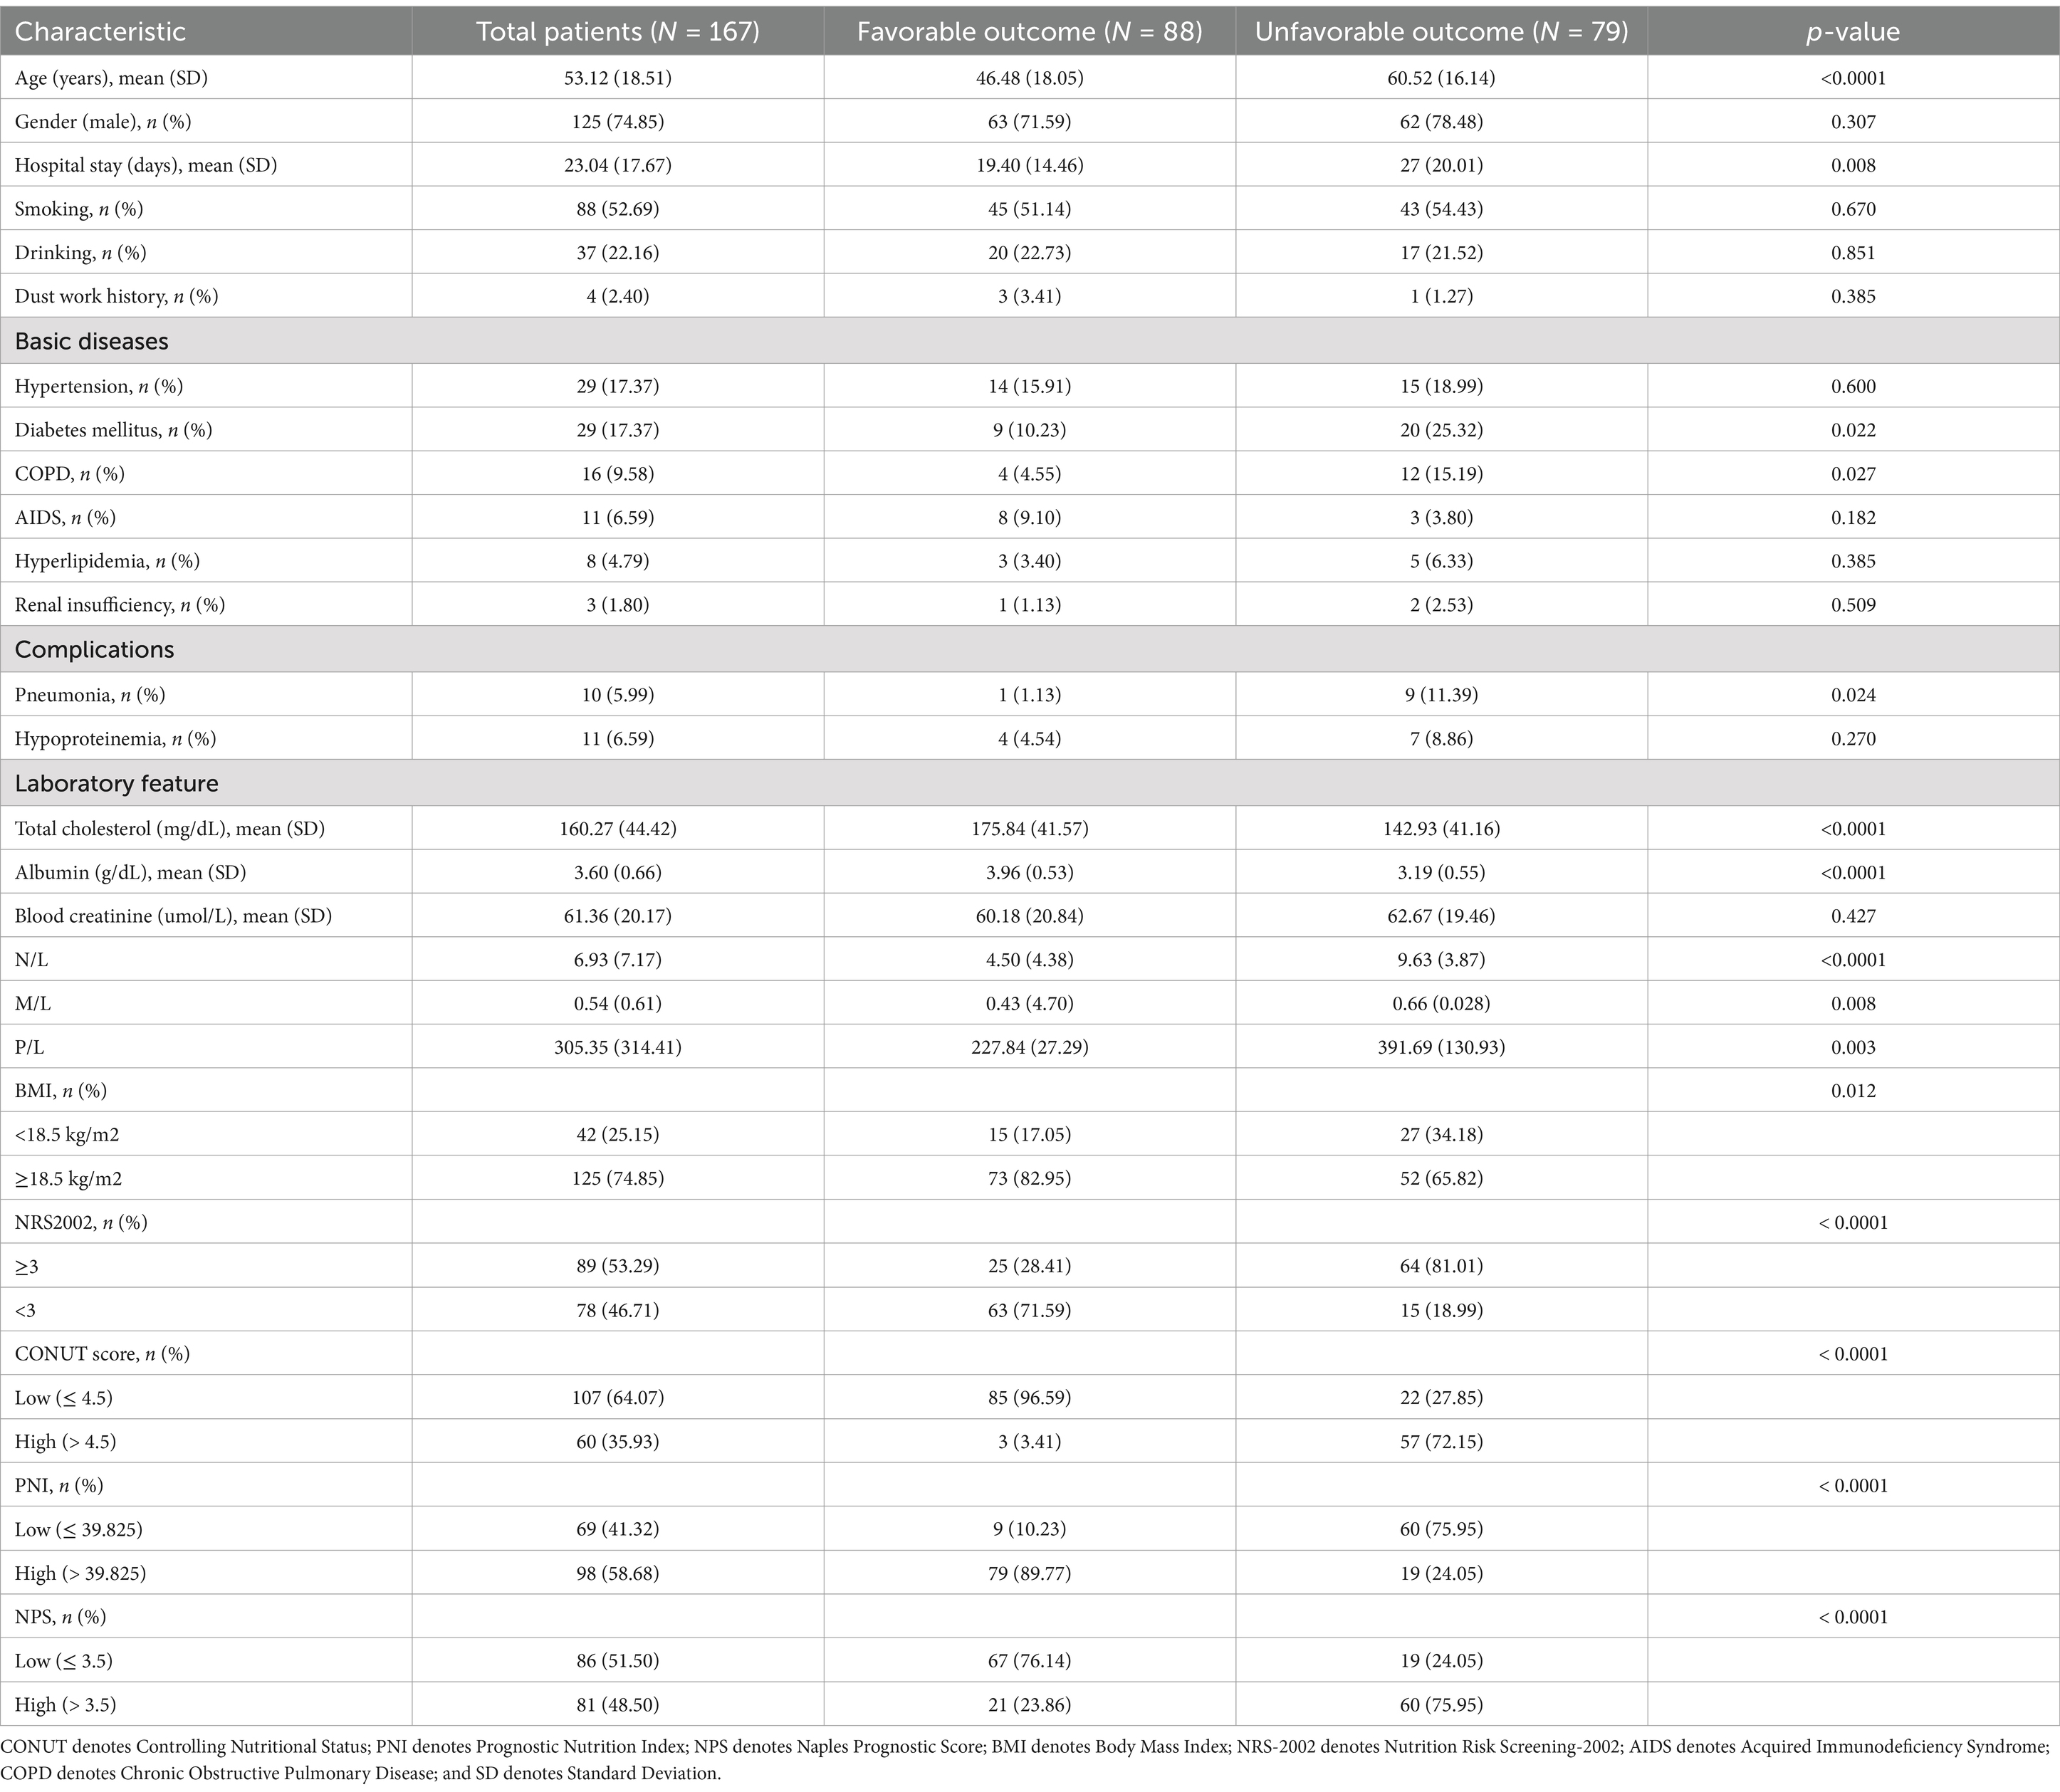
Table 4. Demographic and clinical parameters in the univariate analysis of participating patients by the six-month prognosis outcome.
3.3 Multivariate analysis of prognosis
Table 5 summarizes our conclusions after subjecting the statistically significant indicators in the univariate analysis to multivariate analysis with CONUT, PNI, NPS, and NRS-2002. Age and pneumonia were independent risk factors for prognosis in models 1, 2, 3, and 4. Multivariate analysis results (along with the adjusted ORs) revealed that the CONUT score (OR: 60.419; 95% CI: 16.186–225.524; p < 0.0001), PNI (OR: 23.667; 95% CI: 9.317–60.115; p < 0.0001), NPS (OR: 8.512; 95% CI: 3.762–19.257; p < 0.0001), and NRS-2002 (OR: 0.612; 95% CI: 4.961–39.161; p < 0.0001) were independent predictors of unfavorable PTB outcomes.
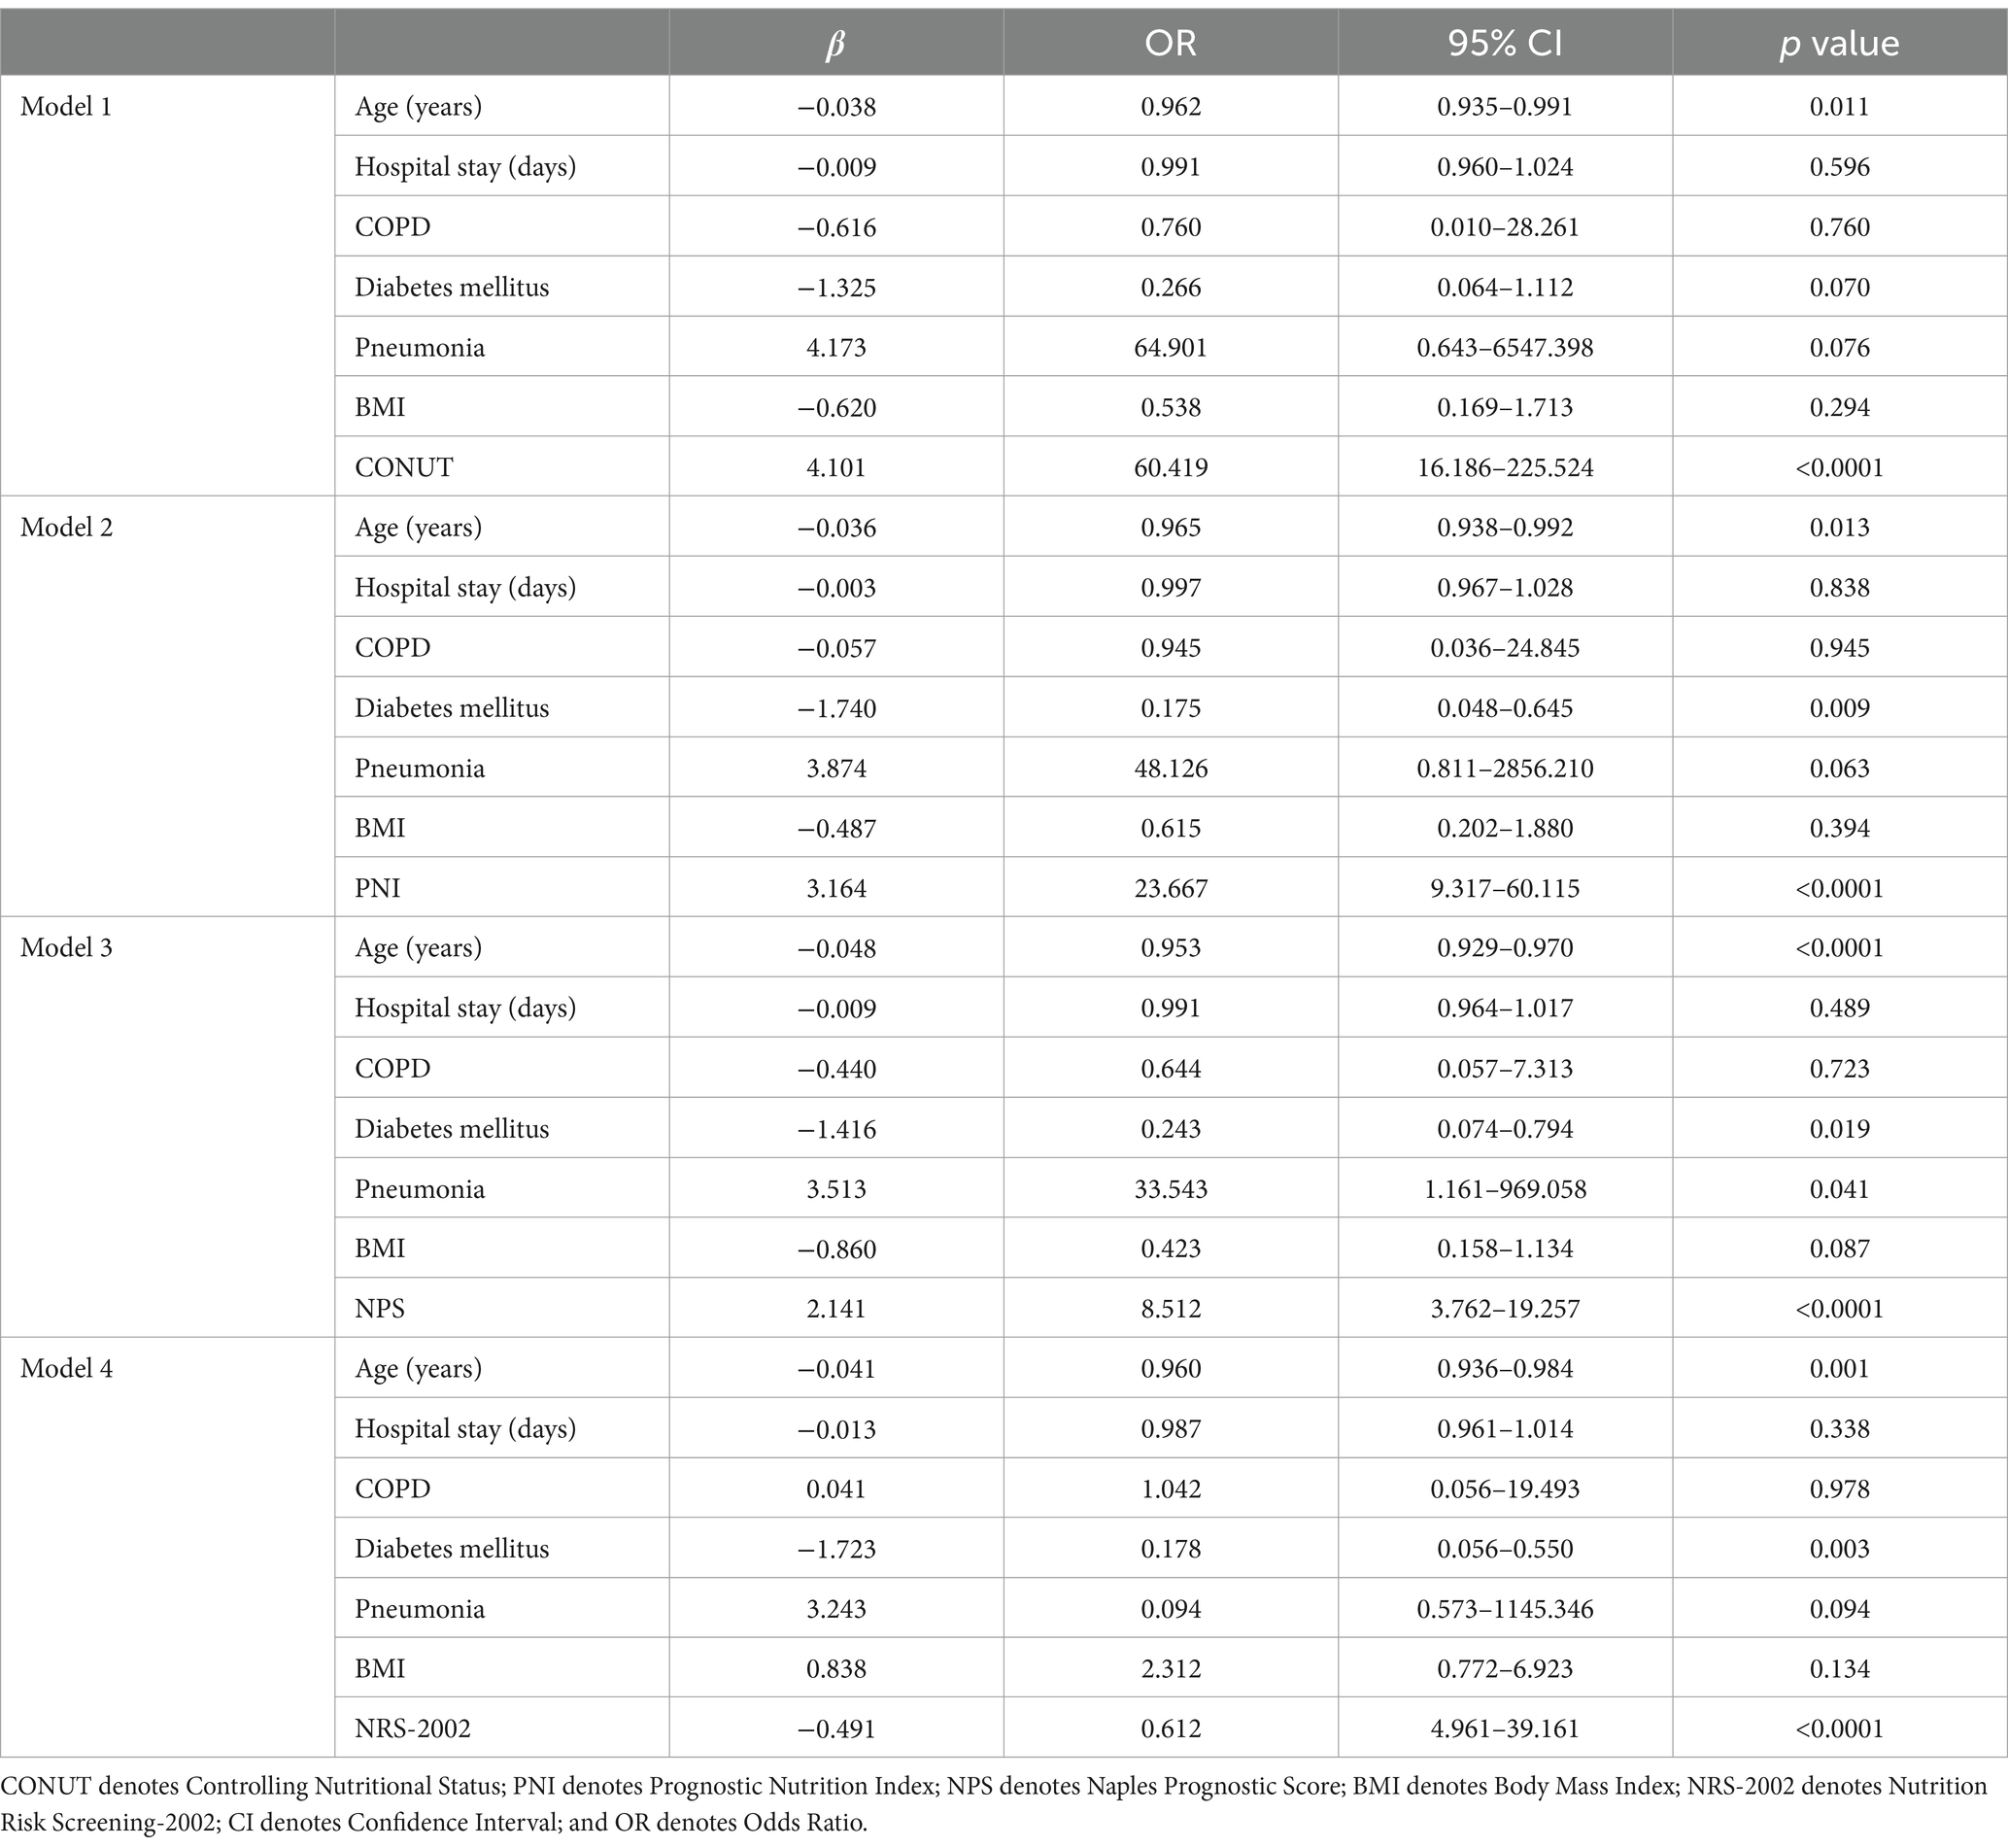
Table 5. Multivariate analyses of the involvement of different variables in PTB patients with poor functional outcomes at 6 months.
3.4 Relationship between the CONUT score, PNI, NPS, BMI, and NRS-2002
Based on the Youden index, the cut-off values for the CONUT score, the PNI index, and the NPS score were determined to be 4.5 [most appropriate for sensitivity (72.2%) and specificity (96.6%)], 39.825 [most appropriate for sensitivity (89.8%) and specificity (75.9%)], and 3.5 [most appropriate for sensitivity (75.9%) and specificity (76.1%)], respectively. The ROC curve analysis results revealed that the CONUT score had the best diagnostic value with the AUC value of 0.885 (95% CI: 0.830–0.940, p < 0.0001), which was comparable to that of the PNI score (AUC: 0.862; 95% CI: 0.805–0.920; p < 0.0001) (Figure 1), but higher than that of the NPS score (AUC: 0.774, 95% CI: 0.702–0.846, p < 0.0001), BMI (AUC: 0.627; 95% CI: 0.541–0.717, p < 0.0001), and NRS-2002 (AUC: 0.763; 95% CI: 0.688–0.838; p < 0.0001).
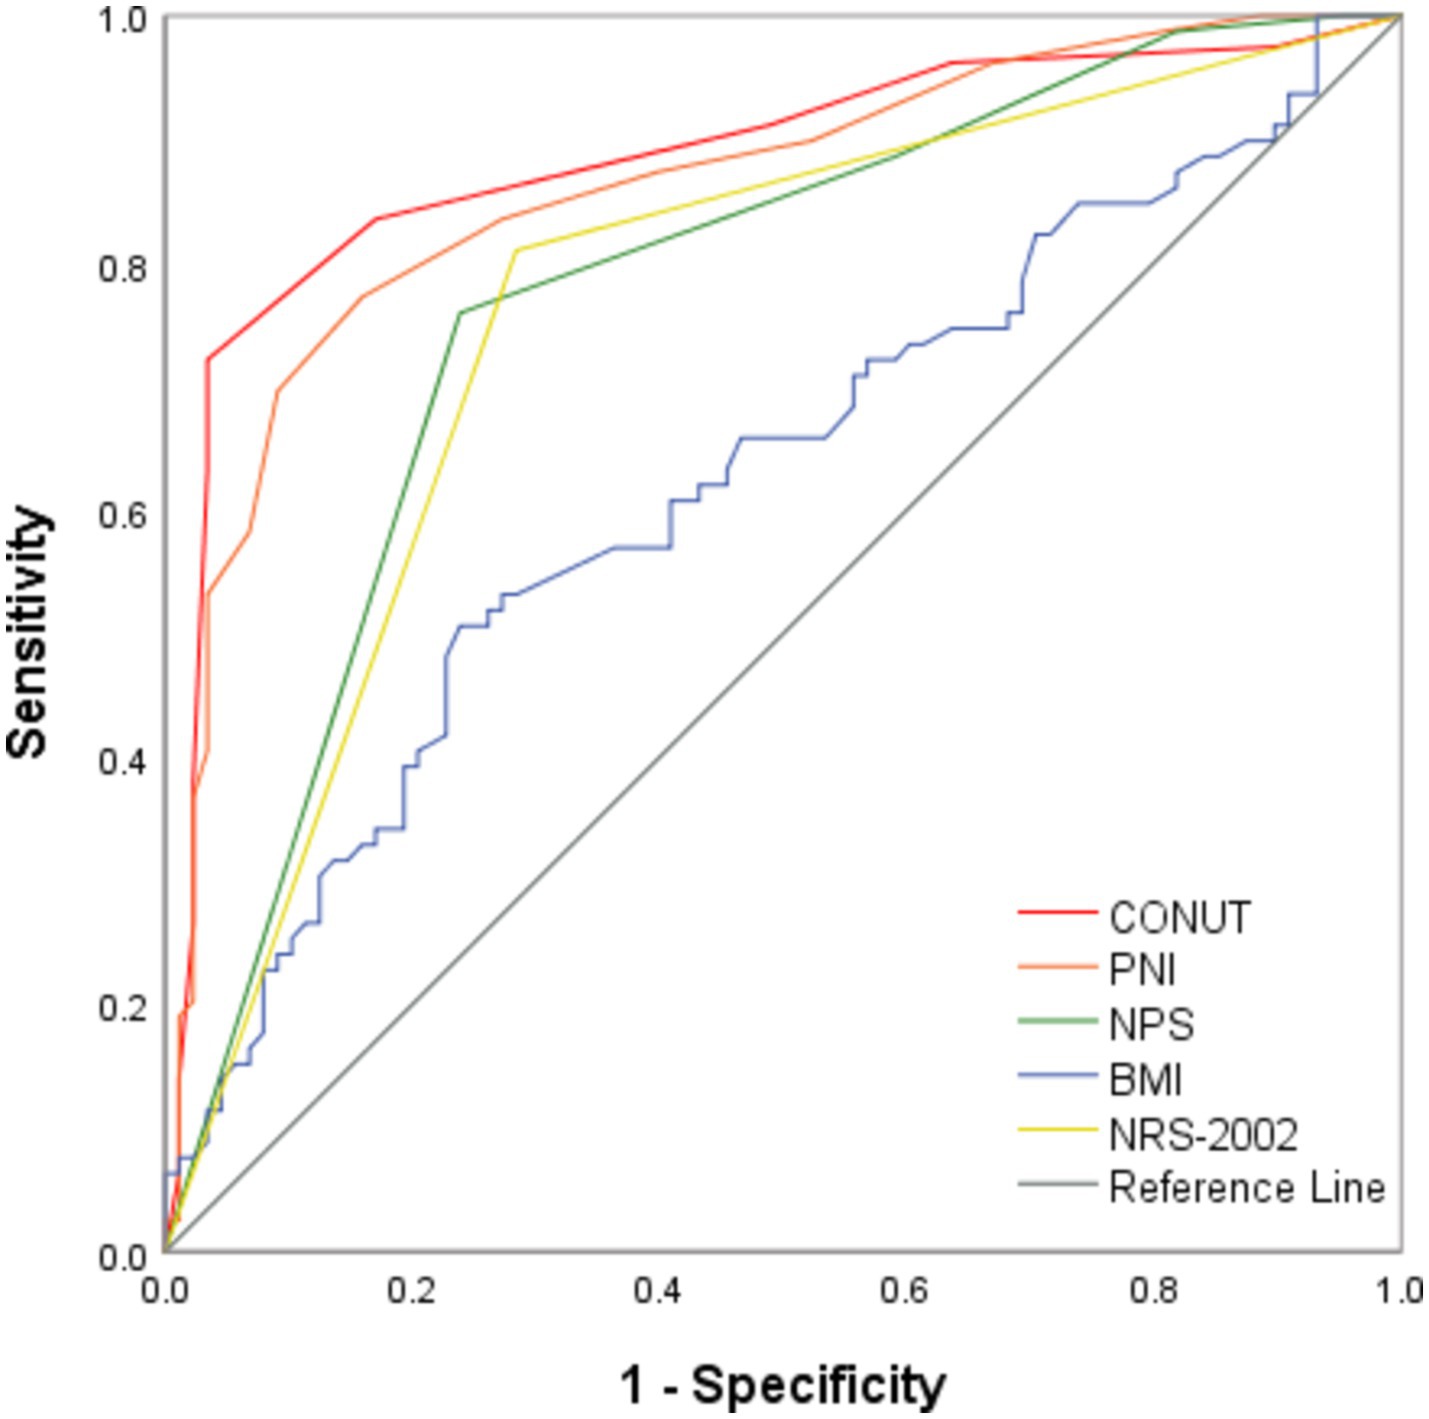
Figure 1. ROC analysis of CONUT, PNI, NPS, BMI, and NRS-2002 in predicting the functional outcome of PTB. CONUT denotes Controlling Nutritional Status; PNI denotes Prognostic Nutrition Index; NPS denotes Naples Prognostic Score; BMI denotes Body Mass Index; NRS-2002 denotes Nutrition Risk Screening 2002; and PTB denotes Pulmonary Tuberculosis.
Among the 167 patients, 88 had a favorable outcome, including 85 with a CONUT score < 4.5, 79 with a PNI index >39.825, 67 with an NPS score ≤ 3.5, 73 with a BMI ≥ 18.5 kg/m2, and 63 with an NRS-2002 score < 3. According to the Spearman’s correlation analysis results, CONUT, PNI, NPS, BMI, and NRS-2002 were correlated with prognosis, with the CONUT score (r = −0.672, p < 0.0001), NPS (r = −0.510, p < 0.0001), and NRS-2002 (r = −0.526, p < 0.0001) having a negative correlation with prognosis, and PNI (r = 0.636, p < 0.0001) and BMI (r = 0.219, p < 0.05) having a positive correlation with prognosis (Tables 6.1–6.4). Therefore, we concluded that the CONUT score was strongly associated with the prognosis of PTB patients.
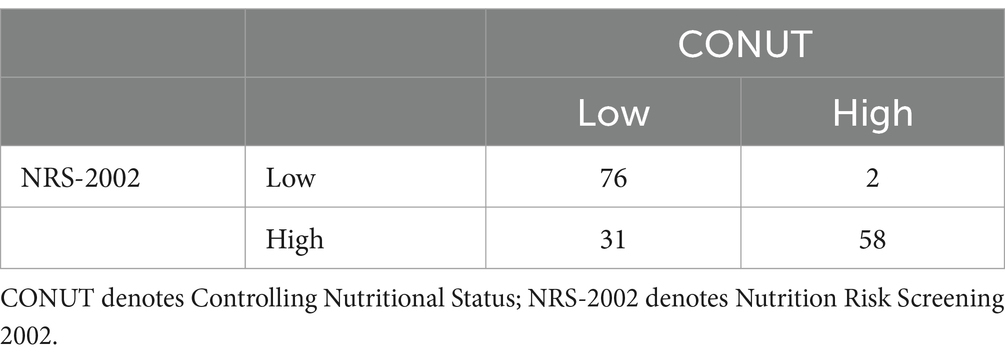
We also performed correlation analysis between the CONUT score and PNI (r = −0.854, p < 0.0001), NPS (r = 0.685, p < 0.0001), BMI (r = −0.295, p < 0.0001), and NRS-2002 (r = 0.647, p < 0.0001) in the context of nutritional parameters. A significant correlation was found between the PNI index and CONUT scores. The low CONUT and high PNI groups were largely overlapping (Figure 2).
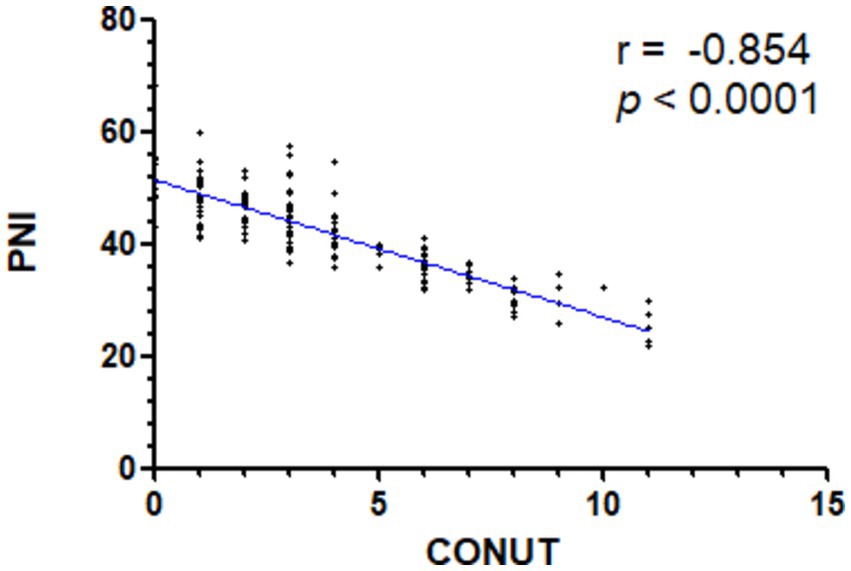
Figure 2. Spearman’s correlation analysis of the CONUT and PNI scores. CONUT denotes Controlling Nutritional Status; PNI denotes Prognostic Nutrition Index.
3.5 Clinical features between HIV and non-HIV patients
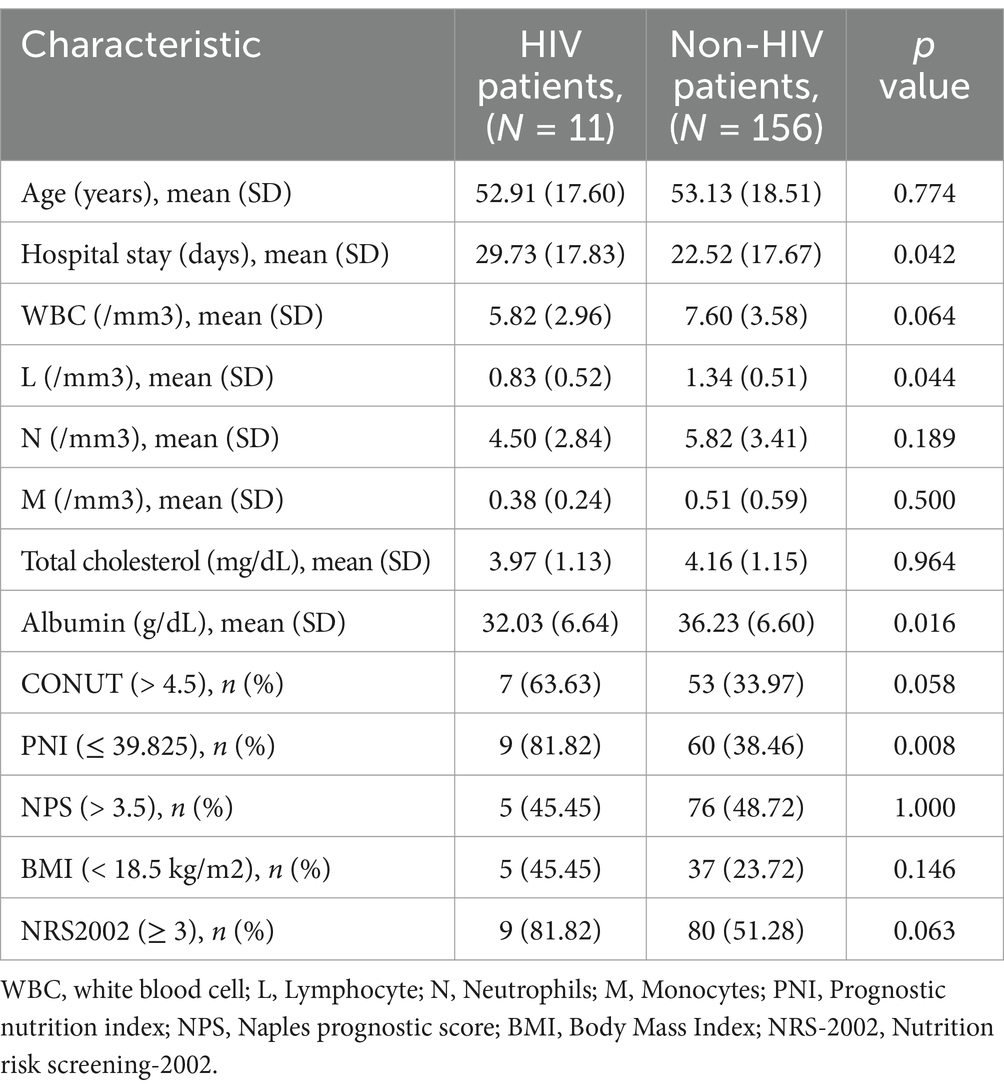
Among the 167 participants in our study, 11 were co-infected with HIV. HIV infection is known to affect the immune and nutritional status of patients. Therefore, we conducted a statistical analysis of the clinical characteristics of HIV-positive and HIV-negative patients, as shown in Table 7. Low L counts and low protein concentrations are commonly detected in HIV patients, which is in agreement with findings from previous. However, there was no significant difference in CONUT scores between the two groups. Therefore, we believe that the CONUT score is well-suited for predicting the prognosis of pulmonary tuberculosis patients with varying nutritional conditions and comorbidities.
3.6 The difference in clinical features between the high CONUT and low CONUT scores
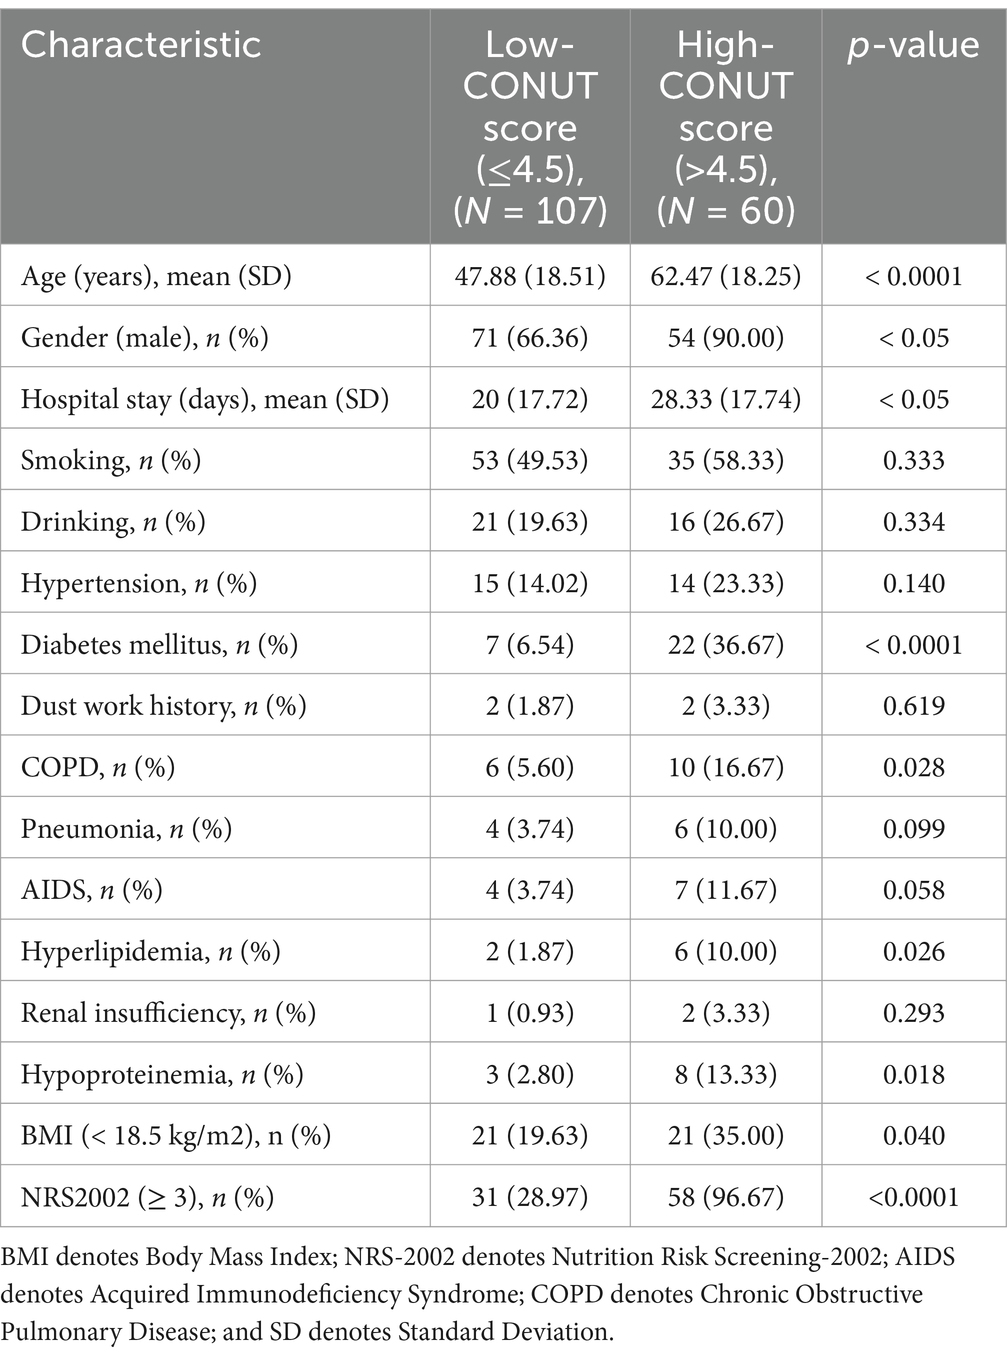
Based on the cut-off value of the CONUT score, patients were divided into two groups: Low CONUT score (≤4.5) and high CONUT score (>4.5). Patients in the high CONUT score group had a significantly higher average age (62 years) than those in the low CONUT score group (48 years) (p < 0.0001), and compared to their female counterparts, male patients were more likely to have a high CONUT score (p < 0.05) (Table 8). Compared to those in the low CONUT score group, patients in the high CONUT score group had a longer hospital stay (28 days on average, p < 0.0001) and a significantly higher prevalence of DM (p < 0.0001) and COPD (p < 0.05), which was more likely to be complicated with hyperlipidemia and hypoproteinemia (p < 0.05). Regarding the laboratory test results, compared to the low CONUT score group, the high CONUT score group had significantly lower albumin and cholesterol levels and significantly higher N/L, M/L, and P/L values. Regarding the nutritional assessment aspects, the low CONUT score group had a significantly better BMI than the high CONUT score group. On the other hand, the high CONUT score group showed significantly higher NRS-2002 scores than the low CONUT score group.
4 Discussion
Malnutrition can weaken the immune system and increase the risk of infections by disrupting the production and secretion of cytokines (18). Severe malnutrition can impair various immune functions in the human body, including phagocytosis, cellular immunity, antibody concentration, and cytokine production, increasing susceptibility to MTB (19). In this, we explored the correlation between the nutritional status scores and outcomes following regular anti-TB treatment in patients diagnosed with new-onset PTB. We found that CONUT, PNI, NPS, and NRS-2002 are independent predictors of prognosis in PTB patients. Among them, CONUT score showed the strongest correlation with prognosis demonstrated the highest predictive value. Therefore, we suggest that high CONUT scores at the time of initial diagnosis are associated with a poor prognosis in anti-TB treatment. Elderly males, along with patients with diabetes and COPD, are more likely to present with higher CONUT scores.
Numerous investigations have demonstrated a two-way relationship between TB and malnutrition (20–22). On the one hand, TB patients have GI dysfunction and decreased appetite, leading to insufficient intake of nutrients, resulting in reduced anabolism (20). On the other hand, MTB uses body proteins for self-metabolism, resulting in physiological changes in individuals (22). The changes include low fever, night sweats, weight loss, and so on, leading to increased body catabolism, reduced fat storage, and loss of lean body tissue, further exposing patients to varying degrees of malnutrition. A nationwide multi-center, large-sample study reported that per the NRS-2002 classification, 55.86% of PTB patients are at risk of malnutrition, with 26.56% having a low BMI (<18.5 kg/m2) (23). These findings are consistent with our results which identified the rates of 53.29 and 25.15%, respectively. Previous studies have documented that cellular immunity is a critical component of the host’s defense mechanism against TB (24). Prolonged malnutrition could impair Cellular Immune Function (CMI), particularly the function of helper T lymphocyte CD4 cells, resulting in increased susceptibility to infections (25). Furthermore, the CD8 ratio of T lymphocytes decreases, which comprises the body’s normal immune function, thereby decreasing its ability to clear MTB, causing repeated TB procrastination, and further complicating PTB treatment (26). In this regard, malnutrition may affect TB prognosis. Consistent with most previous research findings (8, 27), we found that NRS-2002 and BMI were related to prognosis but with low correlation and predictive value. Other studies have shown that malnourished or immunocompromised patients do not experience significant weight loss or low BMI (28, 29). Therefore, besides the general screening factors, TB patients have their specific clinical characteristics, necessitating a more comprehensive and appropriate evaluation model specifically designed for TB.
Novel nutritional scores, e.g., comprising nutritional indicators (such as albumin and cholesterol) and immune indicators (such as lymphocytes) have been proposed. The PNI index includes albumin (nutritional indicator) and lymphocytes (immune indicator). The NPS score, on the other hand, comprises nutritional indicators, including lymphocytes, monocytes, and neutrophils. The combined use of individual nutritional indicators and immune indicators offers improved prognostic accuracy for acute conditions, such as severe traumatic brain injury (30). These indicators allow for quicker, more objective and precise prognostic assessments. However, further research is needed to explore their potential application in chronic diseases. Herein, we used a novel nutritional score for the prognostic assessment of PTB patients. Our findings revealed that CONUT, PNI, and NPS are all independent predictors of PTB prognosis, with the CONUT score having a higher specificity and sensitivity in predicting outcomes.
Serum albumin is widely considered a nutritional status indicator, and reduced serum albumin levels are often associated with inflammatory responses (31). Furthermore, albumin is one of the most sensitive nutritional status indicators in TB patients (32). A multitude of animal experiments have shown that hypoalbuminemia can alter the total number of T lymphocytes as well as the absolute and relative numbers of immune system cell subsets (33), reducing the host’s immunity to MTB (34). Low serum albumin levels, low total lymphocyte counts, and a low PNI index are highly associated with impaired immune function (8). Consistent with previous research, we found that albumin is positively associated with TB prognosis.
Cholesterol on the macrophage membrane is directly involved in MTB phagocytosis (35). The MTB infection dysregulates host lipid biosynthesis, uptake, and sequestration by altering the intracellular environment of macrophages (36). In vivo studies revealed have demonstrated that cholesterol is essential for MTB persistence during the latent phase of infection (37). Cholesterol is essential for efficient MTB internalization by macrophages (38) and is a vital energy source for MTB to maintain persistent infection (37). Lipid metabolism, on the other hand, is critical for TB virulence. Epidemiological studies have revealed a link between patients’ cholesterol levels and TB prognosis. Higher serum cholesterol levels have been shown to reduce TB bacterial load in sputum, increase the rate of sputum culture sterilization, and accelerate the conversion of sputum to negative, suggesting that elevated cholesterol levels are associated with faster bacterial clearance. These biomarkers, being low-cost and widely accessible, are useful for identifying patients with poor prognoses who may benefit from early nutritional interventions. Further prospective studies are needed to validate these findings (39). Similarly, our findings revealed a strong correlation between cholesterol and TB treatment efficacy, with high pre-treatment cholesterol levels potentially predicting a better efficacy.
In summary, the new nutritional score encompassing the serum albumin levels, cholesterol content, and lymphocyte count is more useful in assessing PTB prognosis. After further analyzing the clinical characteristics of the two patient groups (the high and low CONUT score groups), we discovered that the high-scoring group mainly comprised elderly patients, people with underlying illnesses such as diabetes and COPD, and patients in this group may have longer hospital stays. Consequently, more aggressive nutritional measures should be taken to improve the prognosis and shorten the hospitalization duration for patients in the high-scoring group.
In conclusion, a high CONUT score, a low PNI index, and a high NPS score were associated with poor outcomes in PTB patients. These biomarkers are low-cost and widely accessible, making them useful for identifying patients with poor prognoses who may benefit from early nutritional interventions. Further prospective studies are recommended to validate these findings.
Finally, there were some potential limitations to this study. First, we only conducted a nutritional assessment on newly diagnosed patients pre-treatment and did not follow up on their nutritional status. Second, there was limited data on detailed dietary intake during hospitalization as well as other body composition parameters (including body fat or lean body mass). Additionally, this was a retrospective, single-center design study with a relatively small sample size. Moreover, most patients were recruited from Chongqing, and the results may not be extrapolated to other parts of China and the world. Therefore, we intend to conduct additional prospective controlled trials to verify whether nutritional support therapy can improve the prognosis of PTB patients.
Data availability statement
The original contributions presented in the study are included in the article/supplementary material, further inquiries can be directed to the corresponding authors.
Ethics statement
The studies involving humans were approved by the Ethics Committee of the Ninth’s People’s Hospital of Chongqing. The studies were conducted in accordance with the local legislation and institutional requirements. The ethics committee/institutional review board waived the requirement of written informed consent for participation from the participants or the participants’ legal guardians/next of kin because this study is a retrospective analysis, using data collection and other research methods, and there is no harm to patients.
Author contributions
JT: Data curation, Methodology, Writing – original draft, Writing – review & editing, Conceptualization, Software. XS: Supervision, Writing – review & editing. YP: Investigation, Writing – review & editing. MX: Funding acquisition, Investigation, Resources, Writing – review & editing. TL: Funding acquisition, Investigation, Writing – original draft, Writing – review & editing, Methodology.
Funding
The author(s) declare financial support was received for the research, authorship, and/or publication of this article. This work was supported by Chongqing Natural Science Foundation project (No. csts2021jcyj-msmxmX1219).
Conflict of interest
The authors declare that the research was conducted in the absence of any commercial or financial relationships that could be construed as a potential conflict of interest.
Publisher’s note
All claims expressed in this article are solely those of the authors and do not necessarily represent those of their affiliated organizations, or those of the publisher, the editors and the reviewers. Any product that may be evaluated in this article, or claim that may be made by its manufacturer, is not guaranteed or endorsed by the publisher.
Abbreviations
PTB, Pulmonary Tuberculosis; AUROC, The Area Under the Receiver Operating Characteristic; COPD, Chronic Obstructive Pulmonary Disease; DM, Diabetes Mellitus; CONUT, Controlling Nutritional Status; PNI, Prognostic Nutritional Index; NPS, Naples Prognostic Score; BMI, Body Mass Index; NRS-2002, Nutrition Risk Screening-2002; TB, Tuberculosis; MTB, Mycobacterium Tuberculosis; GI, Gastrointestinal; TC, Total Cholesterol; NLR, Neutrophyl-to-Lymphocyte Ratio; LMR, Lymphocyte-to-Monocyte Ratio; NSCLC, Non-Small Cell Lung Cancer; RIF, Rifampicin; H, Isoniazid; R, Rifampicin; Z, Pyrazinamide; E, Ethambutol; 2HRZE, 2-month initial phase; 4HR, 4-month continuation phase; GCs, Glucocorticoids; IMS, Information Management System; AIDS, Acquired Immunodeficiency Syndrome; OR, Odds Ratio; CI, Confidence Interval; CMI, Cellular Immune.
References
1. Bagcchi, S. Who’s global tuberculosis report 2022. Lancet Microbe. (2023) 4:e20. doi: 10.1016/S2666-5247(22)00359-7
2. Farer, LS, Lowell, AM, and Meador, MP. Extrapulmonary tuberculosis in the United States. Am J Epidemiol. (1979) 109:205–17. doi: 10.1093/oxfordjournals.aje.a112675
3. Arango, L, Brewin, AW, and Murray, JF. The spectrum of tuberculosis as currently seen in a metropolitan hospital. Am Rev Respir Dis. (1973) 108:805–12.
4. Macallan, DC. Malnutrition in tuberculosis. Diagn Microbiol Infect Dis. (1999) 34:153–7. doi: 10.1016/S0732-8893(99)00007-3
5. Dheda, K, Barry, CE, and Maartens, G. Tuberculosis. Lancet. (2016) 387:1211–26. doi: 10.1016/S0140-6736(15)00151-8
6. Choi, R, Jeong, BH, Koh, WJ, and Lee, SY. Recommendations for optimizing tuberculosis treatment: therapeutic drug monitoring, pharmacogenetics, and nutritional status considerations. Ann Lab Med. (2017) 37:97–107. doi: 10.3343/alm.2017.37.2.97
7. Ko, Y, Kim, C, Park, YB, Mo, EK, and Moon, JW. Changes in nutritional status in pulmonary tuberculosis: longitudinal changes in Bmi according to acid-fast Bacilli smear positivity. J Clin Med. (2020) 9:24082. doi: 10.3390/jcm9124082
8. Liu, QX, Tang, DY, Xiang, X, and He, JQ. Associations between nutritional and immune status and clinicopathologic factors in patients with tuberculosis: a comprehensive analysis. Front Cell Infect Microbiol. (2022) 12:1013751. doi: 10.3389/fcimb.2022.1013751
9. Casaer, MP, Mesotten, D, Hermans, G, Wouters, PJ, Schetz, M, Meyfroidt, G, et al. Early versus late parenteral nutrition in critically ill adults. N Engl J Med. (2011) 365:506–17. doi: 10.1056/NEJMoa1102662
10. Heidegger, CP, Berger, MM, Graf, S, Zingg, W, Darmon, P, Costanza, MC, et al. Optimisation of energy provision with supplemental parenteral nutrition in critically ill patients: a randomised controlled clinical trial. Lancet. (2013) 381:385–93. doi: 10.1016/S0140-6736(12)61351-8
11. Kuroda, D, Sawayama, H, Kurashige, J, Iwatsuki, M, Eto, T, Tokunaga, R, et al. Controlling nutritional status (Conut) score is a prognostic marker for gastric cancer patients after curative resection. Gastric Cancer. (2018) 21:204–12. doi: 10.1007/s10120-017-0744-3
12. Onodera, T, Goseki, N, and Kosaki, G. Prognostic nutritional index in gastrointestinal surgery of malnourished cancer patients. Nihon Geka Gakkai Zasshi. (1984) 85:1001–5.
13. Galizia, G, Lieto, E, Auricchio, A, Cardella, F, Mabilia, A, Podzemny, V, et al. Naples prognostic score, based on nutritional and inflammatory status, is an independent predictor of long-term outcome in patients undergoing surgery for colorectal Cancer. Dis Colon Rectum. (2017) 60:1273–84. doi: 10.1097/DCR.0000000000000961
14. Chen, S, Liu, S, Xu, S, Cao, S, Han, Z, Kong, L, et al. Naples prognostic score is an independent prognostic factor in patients with small cell lung Cancer and nomogram predictive model established. J Inflamm Res. (2022) 15:3719–31. doi: 10.2147/JIR.S371545
15. Chen, Y, Guan, Z, and Shen, G. Naples prognostic score: a novel predictor of survival in patients with Her2-positive breast cancer. Future Oncol. (2022) 18:2655–65. doi: 10.2217/fon-2022-0212
16. Chen, F, Xie, C, Ren, K, and Xu, X. Prognostic value of the Naples prognostic score in patients with gastrointestinal cancers: a meta-analysis. Nutr Cancer. (2023) 75:1520–30. doi: 10.1080/01635581.2023.2212426
17. Wu, X. Diagnostic criteria for tuberculosis (Ws 288—2017). Electrom J Emerg Infect Dis. (2018) 3:59–61. doi: 10.19983/j.issn.2096-8493.2024022
18. Katona, P, and Katona-Apte, J. The interaction between nutrition and infection. Clin Infect Dis. (2008) 46:1582–8. doi: 10.1086/587658
19. Kant, S, Gupta, H, and Ahluwalia, S. Significance of nutrition in pulmonary tuberculosis. Crit Rev Food Sci Nutr. (2015) 55:955–63. doi: 10.1080/10408398.2012.679500
20. Chang, SW, Pan, WS, Lozano Beltran, D, Oleyda Baldelomar, L, Solano, MA, Tuero, I, et al. Gut hormones, appetite suppression and cachexia in patients with pulmonary Tb. PLoS One. (2013) 8:e54564. doi: 10.1371/journal.pone.0054564
21. Martins, N, Morris, P, and Kelly, PM. Food incentives to improve completion of tuberculosis treatment: randomised controlled trial in Dili, Timor-Leste. BMJ. (2009) 339:b4248. doi: 10.1136/bmj.b4248
22. Delogu, G, Sali, M, and Fadda, G. The biology of Mycobacterium tuberculosis infection [J]. Mediterr J Hematol Infect Dis. (2013) 5:e2013070. doi: 10.4084/mjhid.2013.070
23. Chen, W, Ding, Q, Zhang, SK, Tong, ZW, Ren, F, Hu, CM, et al. Nutritional status in patients with active pulmonary tuberculosis and new nutritional risk screening model for active tuberculosis: a national, multicenter, cross-sectional study in China. J Thorac Dis. (2023) 15:2779–99. doi: 10.21037/jtd-23-623
24. O’Garra, A, Redford, PS, McNab, FW, Bloom, CI, Wilkinson, RJ, and Berry, MPR. The immune response in tuberculosis. Annu Rev Immunol. (2013) 31:475–527. doi: 10.1146/annurev-immunol-032712-095939
25. Alwarawrah, Y, Kiernan, K, and Maciver, NJ. Changes in nutritional status impact immune cell metabolism and function. Front Immunol. (2018) 9:1055. doi: 10.3389/fimmu.2018.01055
26. Lin, PL, and Flynn, JL. Cd8 T cells and Mycobacterium tuberculosis infection. Semin Immunopathol. (2015) 37:239–49. doi: 10.1007/s00281-015-0490-8
27. Li, Y, Yang, F, Zhou, H, Shu, L, Wang, R, and Zhao, C. Clinical application of Nrs-2002 in nutritional risk screening of tuberculosis inpatients. Ann Palliat Med. (2021) 10:5322–8. doi: 10.21037/apm-21-610
28. Pressoir, M, Desné, S, Berchery, D, Rossignol, G, Poiree, B, Meslier, M, et al. Prevalence, risk factors and clinical implications of malnutrition in French comprehensive Cancer Centres. Br J Cancer. (2010) 102:966–71. doi: 10.1038/sj.bjc.6605578
29. Norman, K, Smoliner, C, Kilbert, A, Valentini, L, Lochs, H, and Pirlich, M. Disease-related malnutrition but not underweight by Bmi is reflected by disturbed electric tissue properties in the bioelectrical impedance vector analysis. Br J Nutr. (2008) 100:590–5. doi: 10.1017/S0007114508911545
30. Li, Y, Liu, C, Luo, X, He, Q, Cheng, Y, Shen, W, et al. Controlling nutritional status score and prognostic nutrition index predict the outcome after severe traumatic brain injury. Nutr Neurosci. (2022) 25:690–7. doi: 10.1080/1028415X.2020.1804097
31. Horwich, TB, Kalantar-Zadeh, K, Maclellan, RW, et al. Albumin levels predict survival in patients with systolic heart failure. Am Heart J. (2008) 155:883–9. doi: 10.1016/j.ahj.2007.11.043
32. Karyadi, E, Schultink, W, Nelwan, RH, Gross, R, Amin, Z, Dolmans, WMV, et al. Poor micronutrient status of active pulmonary tuberculosis patients in Indonesia. J Nutr. (2000) 130:2953–8. doi: 10.1093/jn/130.12.2953
33. Cegielski, JP, and Mcmurray, DN. The relationship between malnutrition and tuberculosis: evidence from studies in humans and experimental animals. Int J Tuberc Lung Dis. (2004) 8:286–98.
34. Dai, G, and Mcmurray, DN. Altered cytokine production and impaired antimycobacterial immunity in protein-malnourished guinea pigs. Infect Immun. (1998) 66:3562–8. doi: 10.1128/IAI.66.8.3562-3568.1998
35. Di Pietro, N, Formoso, G, and Pandolfi, A. Physiology and pathophysiology of oxldl uptake by vascular wall cells in atherosclerosis. Vasc Pharmacol. (2016) 84:1–7. doi: 10.1016/j.vph.2016.05.013
36. Wipperman, MF, Sampson, NS, and Thomas, ST. Pathogen roid rage: cholesterol utilization by Mycobacterium tuberculosis. Crit Rev Biochem Mol Biol. (2014) 49:269–93. doi: 10.3109/10409238.2014.895700
37. Pandey, AK, and Sassetti, CM. Mycobacterial persistence requires the utilization of host cholesterol. Proc Natl Acad Sci USA. (2008) 105:4376–80. doi: 10.1073/pnas.0711159105
38. Gatfield, J, and Pieters, J. Essential role for cholesterol in entry of mycobacteria into macrophages. Science. (2000) 288:1647–51. doi: 10.1126/science.288.5471.1647
39. Deniz, O, Gumus, S, Yaman, H, Ciftci, F, Ors, F, Cakir, E, et al. Serum total cholesterol, Hdl-C and Ldl-C concentrations significantly correlate with the radiological extent of disease and the degree of smear positivity in patients with pulmonary tuberculosis. Clin Biochem. (2007) 40:162–6. doi: 10.1016/j.clinbiochem.2006.10.015
Keywords: pulmonary tuberculosis, malnutrition, controlling nutritional status, prognostic nutritional index, Naples prognostic score, body mass index, nutrition risk screening-2002, prognosis
Citation: Tan J, Shi X, Pi Y, Xiang M and Li T (2024) Nutritional scores predict the prognosis of patients with pulmonary tuberculosis. Front. Nutr. 11:1454207. doi: 10.3389/fnut.2024.1454207
Edited by:
Vali Musazadeh, Tabriz University of Medical Sciences, IranReviewed by:
Muthukumar Serva Peddha, Central Food Technological Research Institute (CSIR), IndiaQinghui Ai, Ocean University of China, China
Copyright © 2024 Tan, Shi, Pi, Xiang and Li. This is an open-access article distributed under the terms of the Creative Commons Attribution License (CC BY). The use, distribution or reproduction in other forums is permitted, provided the original author(s) and the copyright owner(s) are credited and that the original publication in this journal is cited, in accordance with accepted academic practice. No use, distribution or reproduction is permitted which does not comply with these terms.
*Correspondence: Mingque Xiang, MjQzNTM3NTU0NUBxcS5jb20=; Tianju Li, dGlhbmp1bGVlQDEyNi5jb20=
 Junyi Tan
 Xiaofeng Shi
 Yinhuan Pi1
 Tianju Li
