
94% of researchers rate our articles as excellent or good
Learn more about the work of our research integrity team to safeguard the quality of each article we publish.
Find out more
ORIGINAL RESEARCH article
Front. Nutr., 30 July 2024
Sec. Clinical Nutrition
Volume 11 - 2024 | https://doi.org/10.3389/fnut.2024.1448834
This article is part of the Research TopicUnderstanding Obesity to Determine the Best Therapeutic Option: From Lifestyle Interventions to TherapiesView all 16 articles
 Rosario Suárez1
 Celina Andrade1*
 Estefania Bautista-Valarezo1
 Yoredy Sarmiento-Andrade1
 Andri Matos2
 Oliver Jimenez1
 Martha Montalvan3Sebastián Chapela4,5
Objective: Diabetes mellitus is a growing disease with severe complications. Various scores predict the risk of developing this pathology. The amount of muscle mass is associated with insulin resistance, yet there is no established evidence linking muscle mass with diabetes risk. This work aims to study that relationship.
Research methods and procedures: This cross-sectional study included 1,388 employees. The FINDRISC score was used to assess type 2 diabetes risk, and bioimpedance was used for body composition analysis. Appendicular skeletal muscle mass adjusted by body mass index (ASM/BMI) was analyzed. Sociodemographic, clinical and anthropometric measures were evaluated, logistic regression models with sex stratification were conducted and ROC curves were calculated to determine the ability of ASM/BMI index to predict T2D risk.
Results: It was observed that patients with higher ASM/BMI had a lower FINDRISC score in both men and women (p < 0.001). A logistic regression model showed and association between ASM/BMI and diabetes risk in women [OR: 0.000 (0.000–0.900), p = 0.048], but not in men [OR: 0.267 (0.038–1.878), p = 0.185]. However, when the body mass index variable was excluded from the model, an association was found between muscle mass adjusted to BMI and diabetes risk in both men [OR: 0.000 (0.000–0.016), p < 0.001], and women [OR:0.001 (0.000–0.034), p < 0.001]. Other risk factors were having a low level of physical activity, waist circumference, age and sedentary lifestyle. A ROC curve was built and the optimal ASM/BMI cut-of value for predicting T2D risk was 0.82 with a sensitivity of 53.71% and specificity of 69.3% [AUC of 0.665 (0.64–0.69; p < 0.0001)].
Conclusion: When quantifying the risk of type 2 diabetes in both women and men, assessing muscle mass can help detect adult individuals with a high risk of developing type 2 diabetes.
Diabetes mellitus is a significant global health issue, with prevalence rates rising dramatically over recent decades (1). Based on data from the International Diabetes Federation (IDF), about 537 million adults had type 2 diabetes (T2D) in 2021, with projections estimating this number will rise to 643 million by 2030 and 783 million by 2045 (2). The burden of T2D is not uniformly distributed, with certain regions, including Latin America, experiencing particularly high prevalence rates. In Latin America, the prevalence of T2D is estimated to affect about 32 million people, accounting for nearly 8.4% of the adult population. This increasing trend highlights the critical need for effective prevention and early detection strategies (2).
Early diagnosis of diabetes is crucial in preventing the onset of complications and enhancing health outcomes (3). Traditional diagnostic methods, such as fasting plasma glucose and oral glucose tolerance tests, are accurate but can be resource-intensive and less accessible, especially in low-resource settings (4). Non-invasive screening tools that can be easily implemented in primary care are vital for improving early detection rates, particularly in areas with limited healthcare access. These tools are essential to ensure that more individuals are identified and managed early, thereby reducing the burden of diabetes-related complications (5).
The Finnish Diabetes Risk Score (FINDRISC) is a commonly utilized non-invasive screening tool designed to estimate the risk of developing T2D (6). FINDRISC consists of a questionnaire covering factors such as age, family history of diabetes, physical activity, waist circumference, and BMI. Research has demonstrated the applicability of FINDRISC in various populations, including those in Latin America, where it has shown promise in early detection and prevention efforts (7, 8). A recent study highlighted the effectiveness of FINDRISC in identifying individuals at high risk for T2D in Latin American and Caribbean populations, emphasizing its potential utility in these regions (9).
Skeletal muscle mass has been increasingly recognized as a crucial factor in diabetes risk. Low muscle mass is associated with insulin resistance and impaired glucose metabolism, both of which are key components in the development of T2D (10). Studies have shown that maintaining adequate muscle mass can enhance insulin sensitivity and lower the risk of diabetes (11). Given the high prevalence of diabetes and muscle mass loss in aging populations, understanding the relationship between skeletal muscle mass and diabetes risk is vital for developing effective prevention strategies (12–14).
This study aims to explore the correlation between skeletal muscle mass and diabetes risk in a Latin American population using the FINDRISC tool. By establishing this correlation, we hope to enhance prevention efforts and improve early detection of diabetes, ultimately reducing the disease burden in this high-risk population. This research offers valuable insights that can provide public health strategies and clinical practices, particularly in regions with limited healthcare resources.
This is a cross-sectional analytical study. The inclusion criteria were affiliation with the Ecuadorian Institute of Social Security (IESS) and age between 18 and 75 years. Of the 1,388 employees working in various local institutions (including educational centers, hospitals, and public and private institutions), 1373 were included. Exclusion criteria were pregnancy, a diagnosis of type 2 diabetes (T2D), and cognitive impairment. The research was approved by the Ethics Committee of San Francisco General Hospital (protocol number 031). Informed consent was obtained, and participant names were replaced with unique codes to ensure anonymity.
The STEPwise 3.2 method adapted to Ecuador by the Public Health Minister (MSP), National Institute of Statistics and Census (INEC), and PAHO/WHO (15), was applied in this research. Following the guidelines of this method, inquiries were made regarding sociodemographic data, tobacco and alcohol consumption. Systolic and diastolic blood pressure were measured with the participant seated using the OMRON HEM-7120 arm monitor with an accuracy of ±3% mmHg/ ± 5% pulse. Height was measured in centimeters with the patient standing erect with the head in the Frankfort plane on a portable stadiometer (Seca-217), calibrated with exact measurements in millimeters. Waist circumference was measured at the level of the navel at the end of expiration with a Cescorf tape, whose resolution is ±1 mm. BMI was calculated by bioimpedance.
Through the IPAQ questionnaire (International Physical Activity Questionnaire), the frequency, duration and intensity of weekly physical activity were measured by MET (Metabolic Equivalent of Task), with 3.3 MET per min indicating low activity, 4 MET per min moderate activity, and 8 MET per min intense activity. The time each participant spent sitting was also recorded (16, 17).
The Latin American LA-FINDRISC score, as suggested in the MSP clinical practice guidelines, was applied. The risk of developing T2D was categorized as low (0–6 points), slightly elevated (7–11 points), moderate (12–14 points), high (15–20 points), or very high (more than 20 points). Following the MSP guideline recommendations, 12 points was the cut-off point to define high risk of T2D (7, 18).
With a multifrequency segmental analyzer that performed 10 impedance measurements (InBody 120) which has a reliability of 98%, we obtained values for weight (kg), BMI, ASM, body fat percentage, body fat mass, and visceral fat level. Additionally, we calculated the (ASM/BMI).
Data were analyzed using IBM SPSS Statistics version 26 and EPIDAT 3.1. After assessing normality and homoscedasticity, qualitative variables were presented in frequencies and percentages, and their associations were tested using the chi-square test. Quantitative variables were expressed as means or medians and their dispersion measures. Furthermore, a one-way ANOVA followed by Bonferroni post-hoc tests was performed for association analysis. A multivariate analysis with logistic regression was conducted, considering the dependent variable as having or not having diabetes risk. In the unadjusted model, the independent variable considered was ASM/BMI, classifying the participants into tertiles as follows: low (0.43–0.87), moderate (0.88–1.32), and high (1.33–1.76). The model was then adjusted for other variables, including age, sedentary hours, categorical physical activity level, BMI, waist circumference, systolic blood pressure, visceral fat level, and muscle mass. Finally, a ROC curve was built to find the cutoff point of ASM/BMI that predicts T2D risk.
The characteristics of the men (n = 557) are summarized in Table 1. Comparative data of the variables are presented according to the ASM/BMI classified into three categories: low, moderate and high. Men with high ASM/BMI are significantly younger (32 years vs. 47 years, p < 0.001) and have a lower risk of T2D (6 vs. 12, p < 0.001). Men with high ASM/BMI have a significantly lower BMI (24.19 vs. 30.4, p < 0.001), smaller waist circumferences (89.4 vs. 103.5, p < 0.001), a significantly lower waist-hip ratio (0.90 vs. 0.97, p < 0.001), significantly lower systolic (121.5 vs. 128, p < 0.02) and diastolic blood pressure (72 vs. 79, p < 0.001), a lower percentage of body fat (19.2 vs. 40.2, p < 0.001), and a lower level of visceral fat (8 vs. 13, p < 0.001). Furthermore, physical activity is significantly related to moderate and high levels of ASM/BMI.
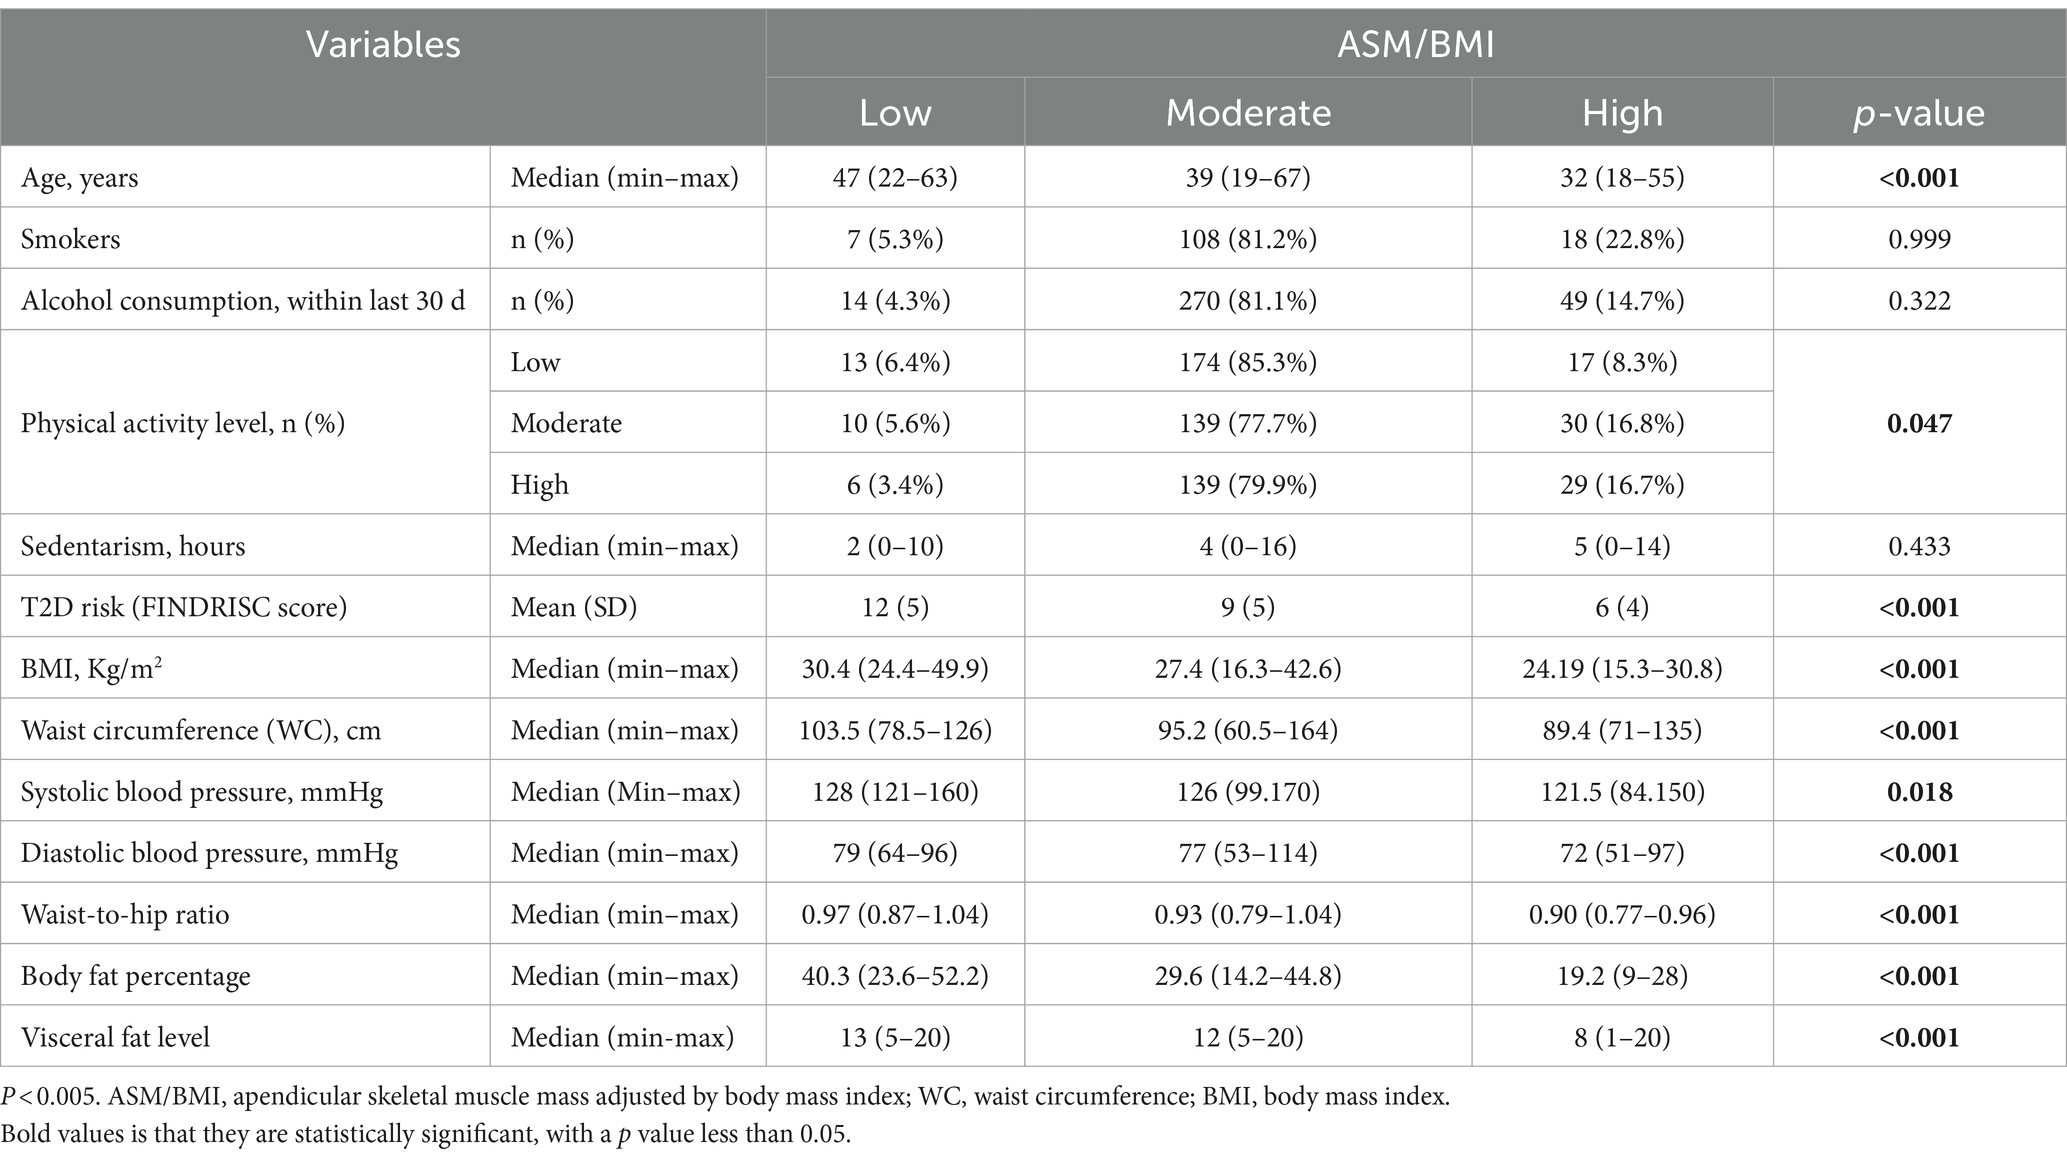
Table 1. Descriptive characteristics by ASM/BMI (males).
Table 2 shows the summary of women (n = 831) according to the proportion of ASM/BMI. In the comparative data, it is observed that women with a high ASM/BMI are significantly younger (25 years vs. 42 years, p < 0.001), consume less alcohol in the last 30 days (3 vs. 279, p < 0.001), and have significantly lower risk of T2D (4 vs. 11, p < 0.001). Women with high ASM/BMI have a significantly lower BMI (24.94 vs. 27.78, p < 0.001), smaller waist circumference (86 vs. 90, p < 0.001), and a significantly lower waist-to-hip ratio (0.90 vs. 0.93), a lower percentage of body fat (17.9 vs. 40.9, p < 0.001) and a significantly lower level of visceral fat (5 vs. 13, p < 0.001). Women with moderate or high ASM/BMI tend to have a greater number of hours of sedentary lifestyle, a lower level of physical activity, and slightly higher blood pressure.
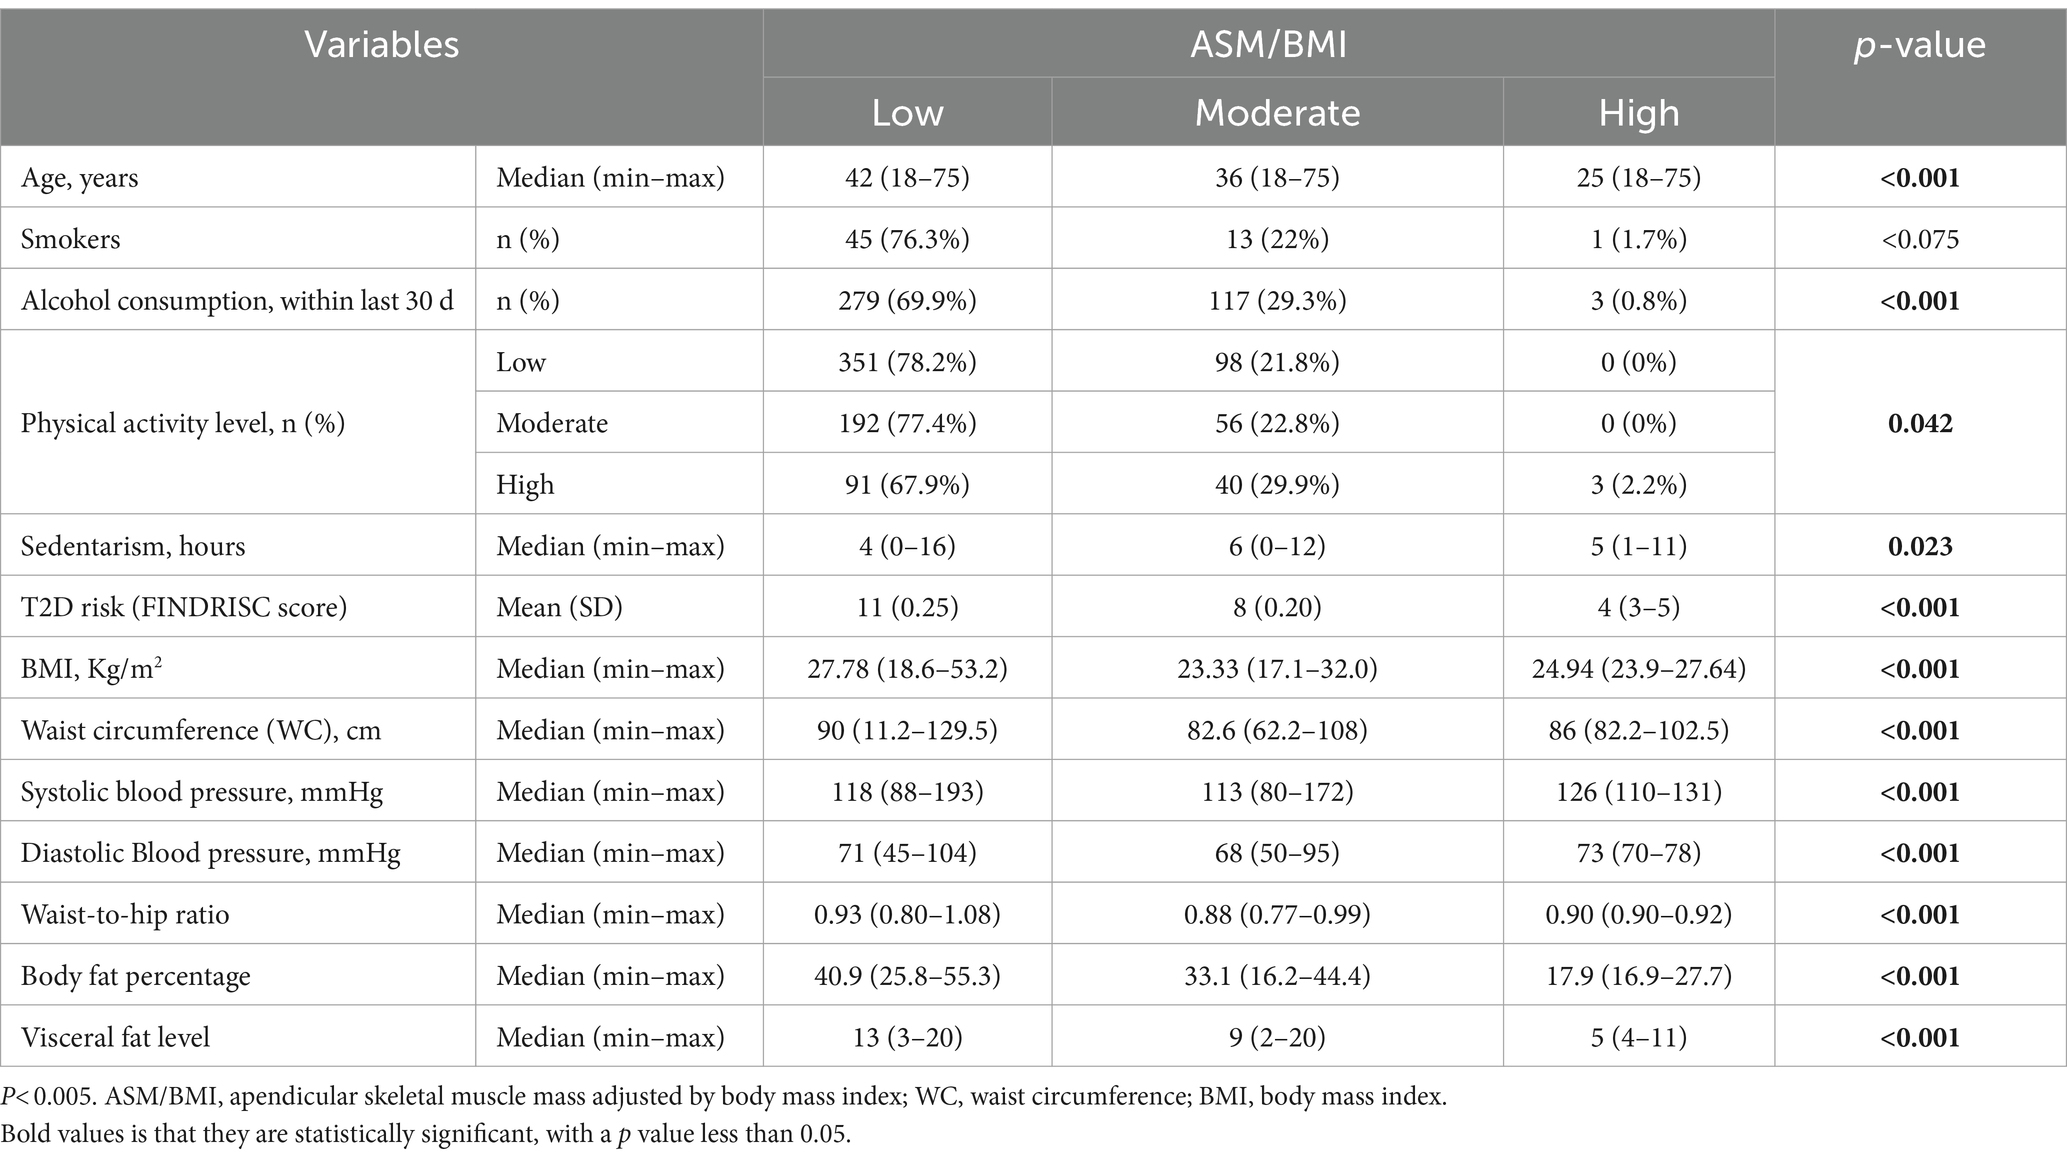
Table 2. Descriptive characteristics by ASM/BMI (females).
In women, the risk of diabetes mellitus was statistically lower by 97% when associated with the proportion of ASM/BMI [OR: 0.003 (0.001–0.010), p < 0.001], while in men it was statistically lower by 94% when associated with ASM/BMI [OR: 0.006 (0.001–0.002), p < 0.001]. After adjusting the model for age, hours of sedentary lifestyle, level of physical activity, BMI, waist circumference, systolic blood pressure, visceral fat level, and muscle mass, no association was observed between the risk of T2D and ASM/BMI in the group of men [OR: 0.267 (0.038–1.878) p = 0.185], while in women it remained statistically significant [OR: 0.000 (0.000–0.900), p = 0.048] (Table 3).
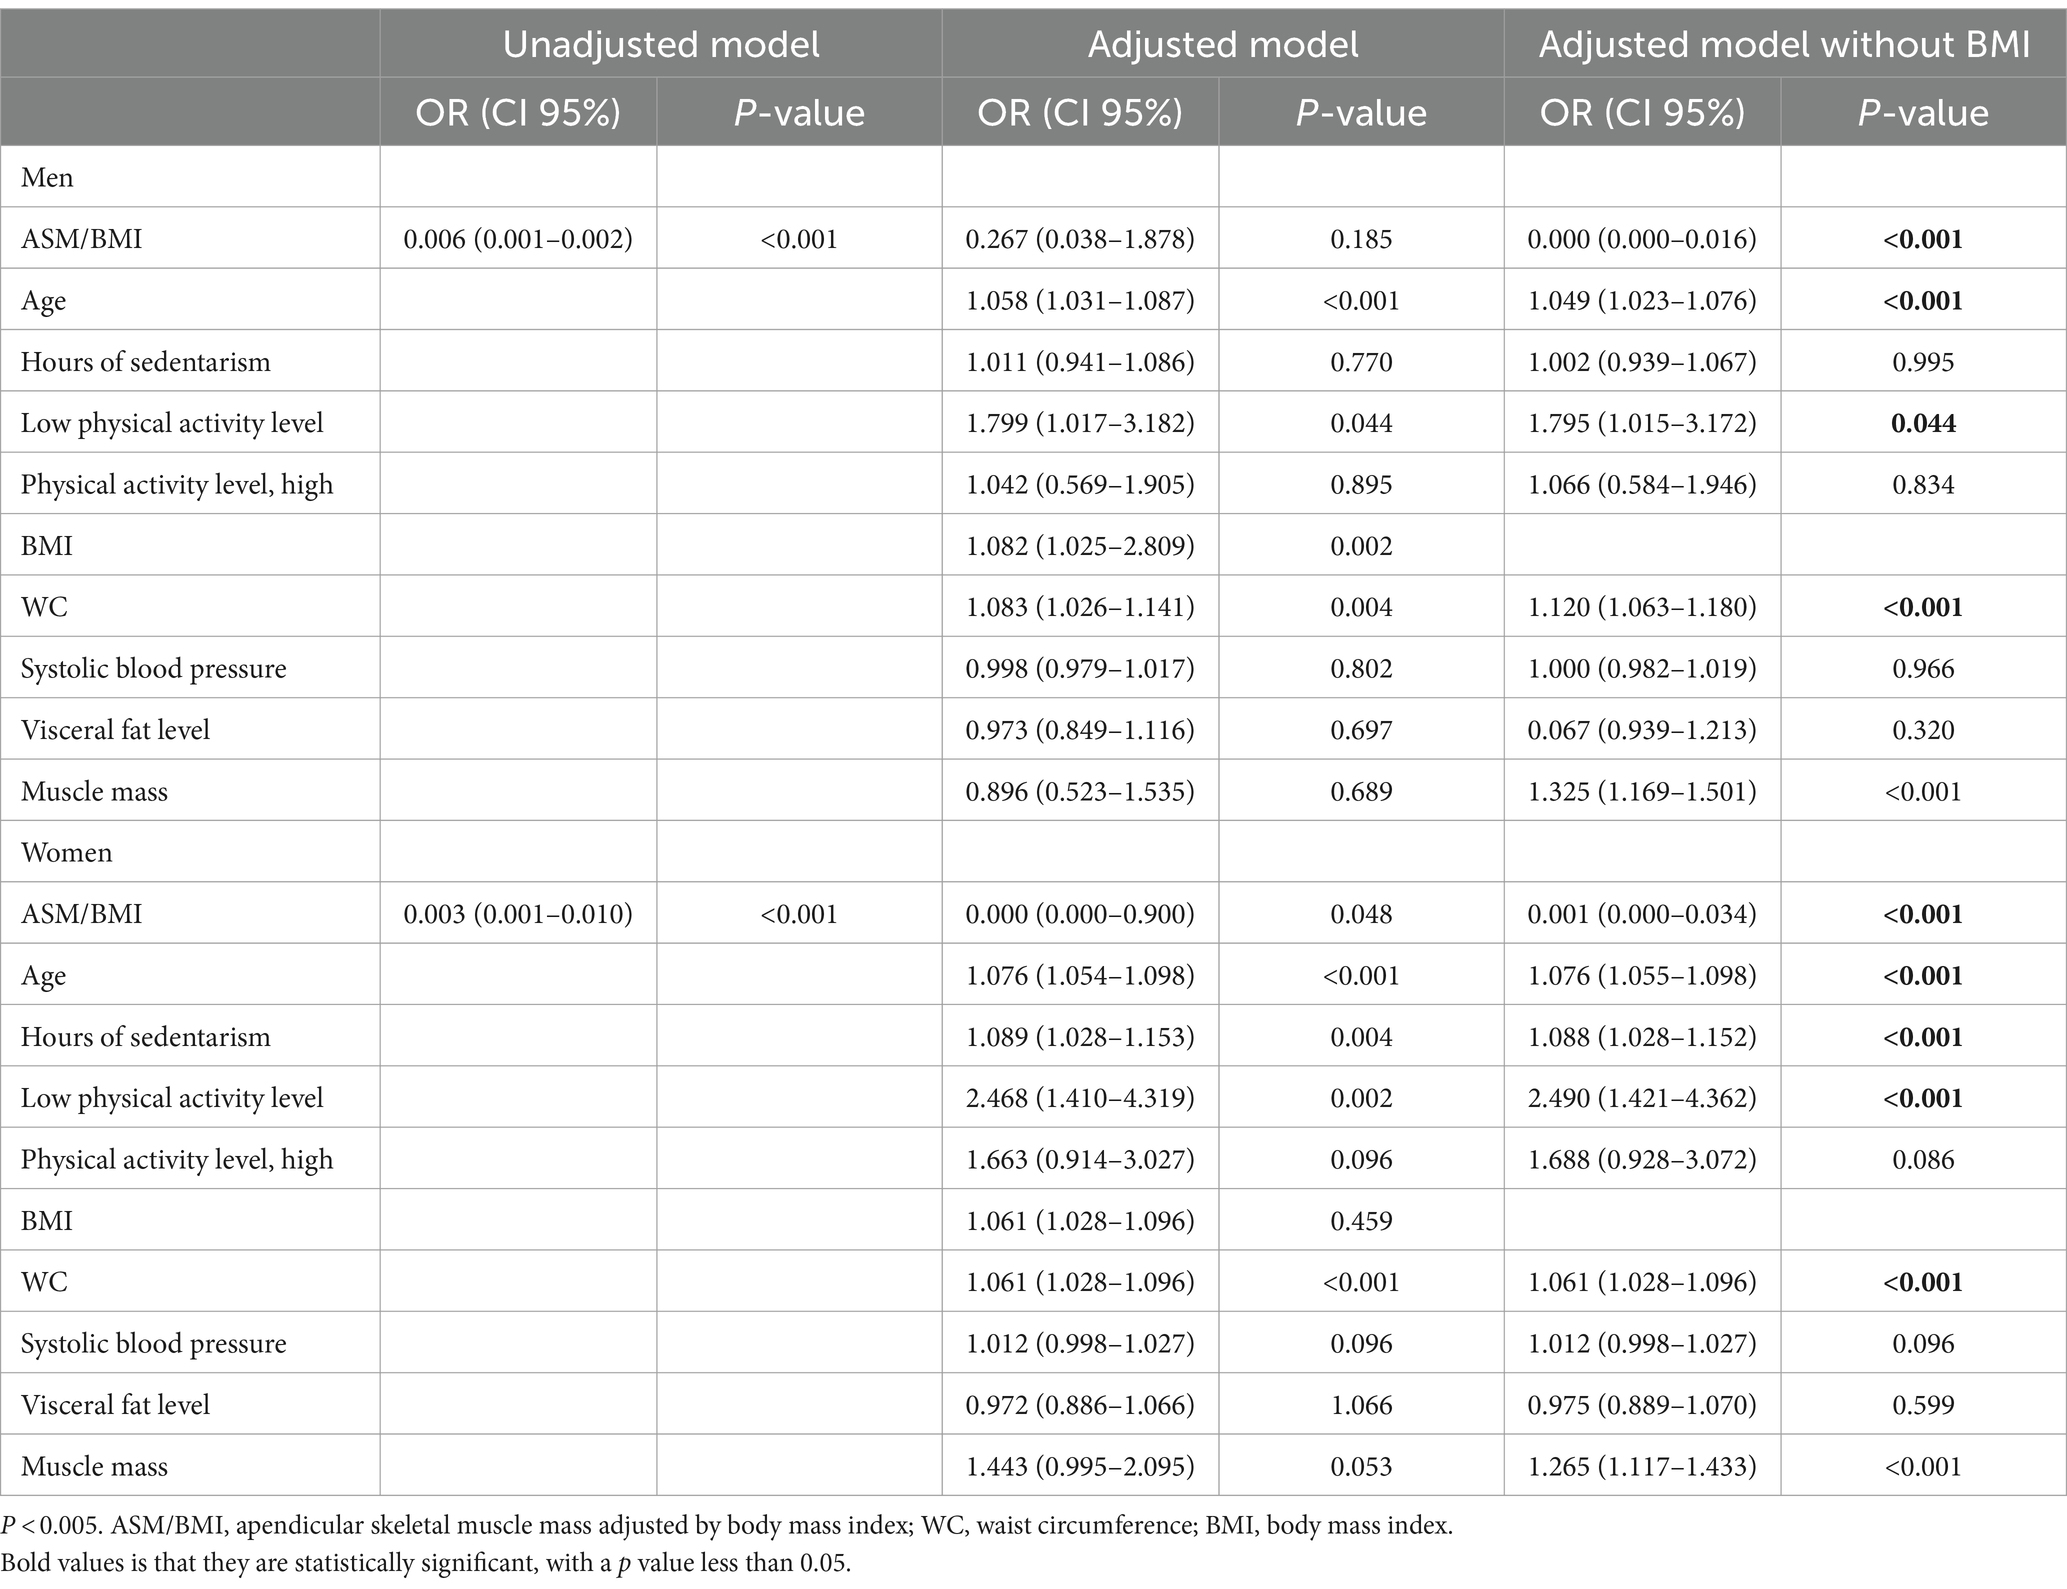
Table 3. Association between diabetes risk and risk factors, by sex.
Secondary analyses were performed in which the variable BMI was eliminated in the group of men, showing a 99% lower risk of diabetes was observed when associated with ASM/BMI in men [OR: 0.000 (0.000–0.016), p < 0.001]. In women, there remained a lower risk of diabetes mellitus associated with ASM/BMI [OR: 0.001 (0.000–0.034) p < 0.001].
Furthermore, in the adjusted model, men have a 4.9% greater risk of diabetes when associated with age [OR: 1.049 (1.023–1.076), p < 0.001], a 12% greater risk of diabetes mellitus when associated with waist circumference [OR: 1.120 (1.063–1.180), p < 0.001] and a 7.9% higher risk of diabetes mellitus when associated with less physical activity [OR: 1.795 (1.015–3.172), p = 0.044]. In the adjusted model, women have a 7.6% higher risk of diabetes when associated with age [OR: 1.076 (1.054–1.098), p < 0.001], an 8.8% higher risk of diabetes when associated with sedentary hours [OR: 1.088 (1.028–1.152), p < 0.001], a 2.49 higher risk of diabetes mellitus when associated with a low level of physical activity [OR: 2.490 (1.421–4.362), p < 0.001], and 6.1% higher risk of diabetes mellitus when associated with abdominal circumference [OR: 1.061 (1.028–1.096), p < 0.001].
Moreover, when the model was not stratified by sex, it was observed that there was a 99.99% lower risk of diabetes mellitus when associated with ASM/BMI in the adjusted model. When adjusted for other variables, a lower risk of diabetes mellitus persisted when associated with ASM/BMI [OR: 0.000 (0.000–0.147), p = 0.010] (Table 4).
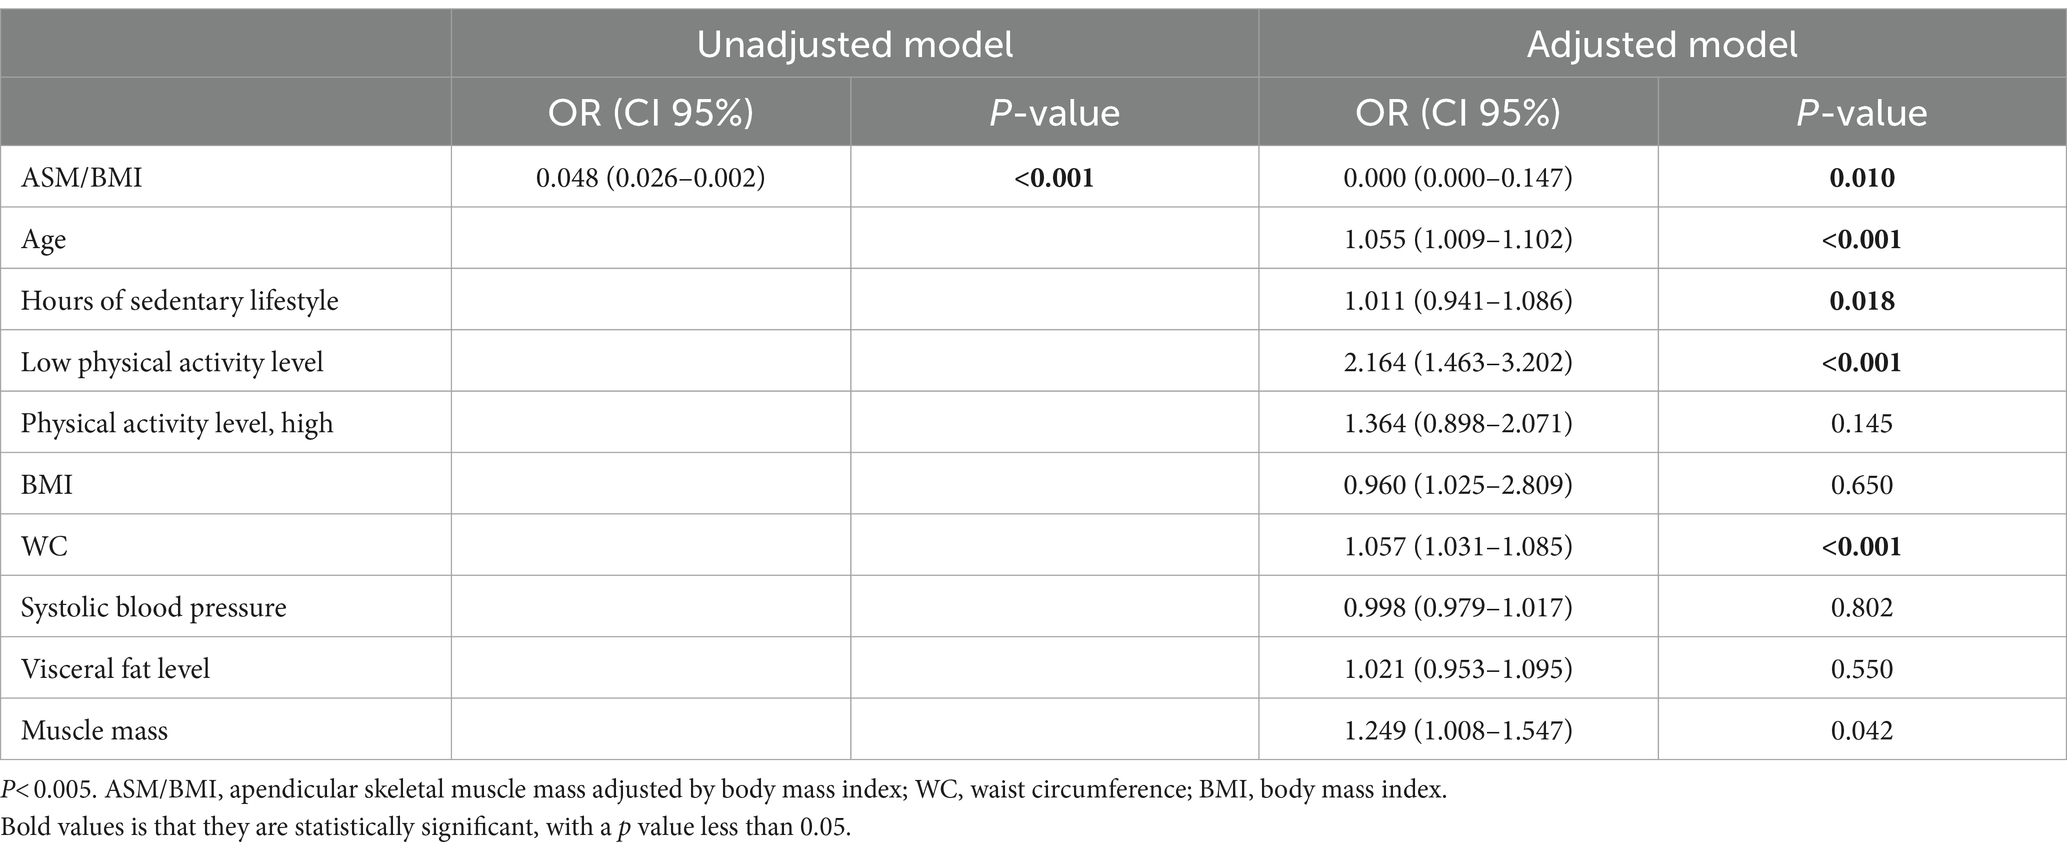
Table 4. Association between FINDRISC score and risk factors (overall).
The result of the FINDRISC score was dichotomized into those with low and slightly elevated risk versus those with moderate, high and very high risk. ROC curve was performed to determine the best ASM/BMI cut-off point that predicts having moderate or high risk in FINDRISC. Area under the curve (AUC) of 0.665 (0.64–0.69; p < 0.0001) was observed. With a cut-off point of 0.82 a sensitivity of 53.71% and specificity of 69.3% is obtained (Figure 1A). In men, the AUC was 0.723 (0.683–0.76; p < 0.0001) with a cut-off point of 1.15 with 82.94% sensitivity and 52.12% specificity. On the other hand, for women the AUC was 0.68 (0.65–0.72; p < 0.0001), with a cut-off point of 0.78, with 64.13% sensitivity and 64.85% specificity (Figure 1B).
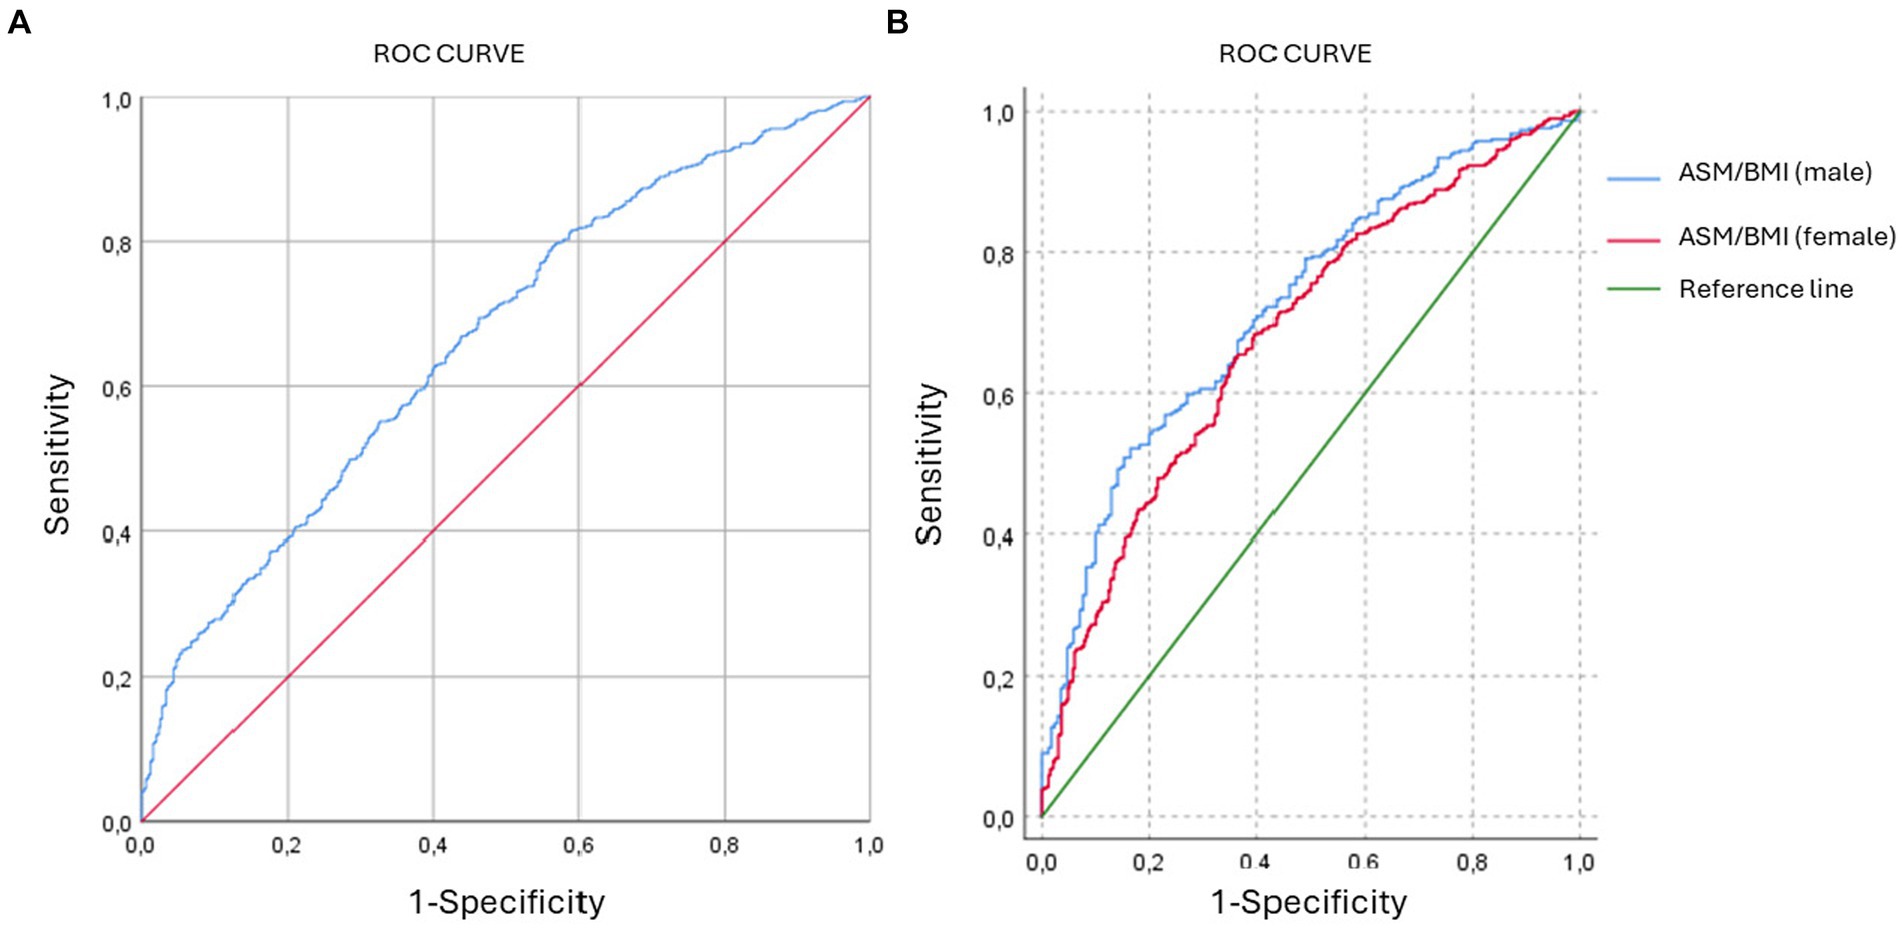
Figure 1. ROC curves. (A) ROC curve of general population. AUC = 0.665. (B) ROC curve of male and females. AUC = 0.723 for males and AUC = 0.684 for females.
This study evaluated the association between clinical, anthropometric, and body composition measures and the diabetes risk assessed by FINDRISC score, in 1373 participants aged 18–75 years (median 40), among whom 499 (36.4%) were at high risk of T2D. The study focused on the influence of muscle mass, as a significant part of the sarcopenia concept. Higher muscle mass, defined by the ASM/BMI index, was associated with better outcomes related to T2D risk, specifically with better BMI, waist circumference (WC), waist-to-hip ratio (WHR), systolic (SBP) and diastolic blood pressure (DBP), body fat percentage (BFP) and visceral fat level (VFL) (p < 0.001) in both sexes. Additionally, physical activity (PA) was significantly related to moderate and high levels of ASM/BMI in men. In women, similar results were observed, but they showed more hours of sedentary lifestyle, a lower level of physical activity, and slightly higher blood pressure.
Muscle mass is a key component in measuring sarcopenia in young adults, although muscle strength and physical performance are also important factors. Most current research has focused on studying the relationship between sarcopenia and T2D in older adults, with less reported about each sarcopenic component in younger people at risk or with risk factors for this prevalent disease (19). Recent research estimating the prevalence of obesity with low lean muscle mass (OLLMM) in adults aged 20 years and older in the US has reported an association between muscle mass and T2D and its related factors. Utilizing data from the National Health and Nutrition Examination Survey (NHANES), the study found a higher prevalence of OLLMM among Mexican-American females over 60 years old. This prevalence increases with age and is higher among individuals with prediabetes, T2D, non-alcoholic fatty liver disease (NAFLD) with fibrosis, or those who have undergone bariatric surgery (20, 21). High prevalence of sarcopenia defined using height-adjusted appendicular skeletal muscle mass (ASM/h2), with ASM calculated as the sum of the lean mass of the arms and legs has also been reported in the US, specifically in Louisiana, where Asians had a higher incidence of low muscle mass, compared to other ethnic groups (22).
Considering all the muscle mass indexes reported in the literature [ASM alone, ASM/height2 (ASM/h2), ASM/BMI, ASM/weight], we did not find an association between ASM/h2 and T2D risk, suggesting a wide divergence between the different muscle indexes. Similar results were reported in a cohort study, where absolute lower ASM was associated with incident T2D in men, but not in women (23). Another study did not find an association when analyzing both absolute ASM or ASM/h2 but did find one when using the ASM/BMI ratio (24). In a study including older adults with hypertension, the prevalence of low lean mass with obesity by the ASM/h2 index (9.8%) was lower relative to the ASM/weight (11.7%) and ASM/BMI indexes (19.6%), with the latter index evaluation being more efficient in showing muscle mass deficiency (25). Our results suggest that muscle mass index evaluation using ASM/BMI, stratified by sex, is useful to predict the risk of T2D in Latin Americans. However, there is little evidence among Latin American middle-aged adults regarding the influence of muscle and fat mass on the risk of developing T2D. Evidence does exist about a negative association between muscle mass and incident T2D (26, 27), for example, in diabetes-free Koreans, decreased skeletal muscle mass was significantly related to an incremented risk of new-onset diabetes in healthy middle-aged people. They found that the lowest sex-specific skeletal muscle mass index (SMI) tertile was significantly linked to an increased risk of developing T2D [adjusted hazard ratio (HR) = 1.31; 95% CI, 1.18–1.45] in a fully adjusted model. Presarcopenic obesity notably heightened the risk of incident diabetes (adjusted HR = 1.57; 95% CI, 1.42–1.73) compared to normal body composition, presarcopenia alone, or abdominal obesity alone. They concluded that low skeletal muscle mass, along with its coexistence with abdominal obesity, collectively incremented the risk of developing T2D, independent of glycometabolic parameters (27).
The prevalence of low muscle mass increases with age in most studies, which was also found in ours, making early detection an important issue for the prevention of T2D and many other diseases. In a recent review about sarcopenia in youth, investigators found that more than 10% of young adults in their 20s and 30s consistently had sarcopenia based on available data. Additionally, youth-onset sarcopenia seems to be more prevalent among Hispanics or Asians compared to white people and is least common in African Americans. Notably, when applying the strength criteria, more cases were identified in youth, underscoring the severity of sarcopenia in younger populations (21).
Research in Latin America related to association between T2D and body composition has been done in Chile. The authors concluded that in individuals with low muscle mass/high adiposity phenotypes showed an OR above 2 for diabetes, 2.7 for hypertension, 4.5 for metabolic syndrome, and over 2 for moderate-to-high cardiovascular risk, although the analysis included older aged participants with osteoarthritis (OAD) (28).
In our study, both males and females in the low tertile of ASM/BMI index had significantly higher T2D risk. When multivariate analyses were performed, the factor that emerged as a protective predictor for the risk of T2D was having a higher ASM/BMI. Conversely, regression models identified age, waist circumference, low physical activity level, and sedentarism as risk factors for T2D. This ASM/BMI index was also reported in a study with female participants with a history of gestational diabetes (24), and in another investigation that found that unadjusted diabetes risk was lowered by 21% in men [HR 0.79 (0.62–0.99), p = 0.04] and 29% in women [HR 0.71 (0.55–0.91), p = 0.008] for higher ASM/BMI. Nevertheless, the association ceased to be significant when age, race, smoking, education, physical activity, and waist circumference were taken into account (29).
Other authors have published a synergistic effect of low-fat mass and low muscle mass together, related to T2D, expressed in exacerbation of A1C. Interesting research among females with T2D and with overweight or obesity was reported by Terada et al., in a secondary analysis of the Look AHEAD trial, that recruited participants from 16 clinical sites across the US. This study suggests that low muscle mass has a negative effect on A1C only when combined with low-fat mass in women, which is different for men, as the latter did not show a significant effect of muscle mass on A1C and high fat mass was significantly associated with higher A1C (30).
Regarding sociodemographic factors and habits, we found that among smokers, mostly men, there was no significant association with the ASM/BMI index, even though studies reinforce the relationship of tobacco use and muscle mass loss (31). In this same bivariate analysis, alcohol consumption (in women), BMI, waist-to-hip ratio, visceral fat and fat percentage were significantly higher in people with low ASM/BMI index. Nonetheless, the association of alcohol intake with T2D risk disappeared in the regression analysis. One study reported that alcohol has no relationship with loss of muscle mass. This seems to be influenced by other factors that may intervene in the loss of muscle mass in women, such as hormonal factors (32). Furthermore, BMI has been generally reported in studies of patients with sarcopenic obesity, strengthening the relationship found in these studies, which claim that low muscle mass in populations with obesity is associated with diseases such as T2D and hypertension (33).
It is widely recognized that physical activity offers several health benefits and contributes to preventing prevalent chronic diseases while increasing muscle mass (34, 35). In this study, we identified a significant association with T2D risk, in both sexes, related to increased muscle mass. More than half of the women studied with low physical activity had low muscle mass, and in men with moderate and high physical activity levels, there was a predominance of moderate muscle mass.
In an Asian population cohort study, the authors found that predicted high lean body mass (LBM) and low fat mass (FM) were linked to a reduced risk of T2D according to anthropometric equations (36). When including patients who already have the disease, there are different analysis regarding the influence of body composition and better metabolic profiles. For example, it has been described that different combinations of fat and muscle components are associated with different outcomes, reporting that high fat and low muscle may be synergistically related to higher glycosylated hemoglobin (HbA1c) in T2D. Even with an exercise program, in participants with this profile (high fat mass, low muscle mass), exercise-induced improvements in certain cardiometabolic risk factors may be diminished (37).
In our study, higher waist circumference values are related to lower muscle mass, a result that was consistent in both sexes. Moreover, regarding body fat, we found significance in both the percentage of body fat and visceral fat in both sexes. Studies report the joint relationship of both factors with cardiovascular and other chronic diseases such as diabetes mellitus, in addition to increased mortality (38). One impact as age advances is that adipose inflammation leads to fat being redistributed toward the abdomen, infiltrating the skeletal muscles, and associated with a decrease in muscle strength, ultimately causing insulin resistance. In turn, muscle-secreted cytokines can exacerbate adipose tissue atrophy, promote chronic low-grade inflammation, and establish a vicious cycle of local hyperlipidemia, insulin resistance, and inflammation that spreads systemically, thus promoting the development of sarcopenic obesity (14, 39–41).
Additionally, the cutoff points of ASM/BMI index in identifying the risk of T2D, were higher in males than in females, with higher sensitivity in men but more specificity in women. Some previous research has developed ROC curve analysis to determine cut-off points of various anthropometric variables to predict metabolic diseases, such as type 2 diabetes mellitus, gestational diabetes or metabolic syndrome (42–44), and also using indices such as the fat-muscle ratio (FMR), among others. One of the studies that evaluated this FMR in women tried to predict the risk of gestational diabetes with a cut-off value of 1.305 (45). Another study described different anthropometric indices such as Body Roundness Index (BRI), body shape index (ABSI), and lipid accumulation product to predict metabolic syndrome among industrial workers in Russia (46). However, no cut-off points have been reported for the ASM/BMI for either sexes related to diabetes risk, as in our study, so it could be suggested as a possible anthropometric marker to predict this risk.
Finally, the ASM/BMI may serve as a convenient parameter for screening individuals at high risk for T2D, especially among males.
This study has several limitations. First, although we utilized BIA to evaluate body composition, which is not the gold standard method, it has been validated as a non-invasive method that offers precise estimates of skeletal muscle mass, which closely align with measurements obtained through DXA and magnetic resonance imaging across different ages, volume statuses, and BMI ranges (47, 48). Second, we could not assess the role of muscle strength or quality and laboratory variables such as glycemia and lipid profile to T2D risk. Additional research is needed to elucidate the connection between muscle strength, laboratory parameters, and metabolic risk in young Latin American adults. Third, because this study is observational in nature, the cross-over design does not favor causal relationships. Therefore, prospective studies would be needed for internal and external validation of ASM/BMI index and to be able to use it routinely, in that case, it would be a proposal that could contribute to the early detection of people at risk of diabetes mellitus based on novel indicators.
In summary, muscle mass determined by the ASM/BMI index was associated with the risk of type 2 diabetes in middle-aged Ecuadorian men and women, and exercise appeared to be the best parameter to reduce this risk. The strongest factor associated with this risk was having a low level of physical activity, followed by waist circumference, age and sedentarism.
When quantifying the risk of type 2 diabetes in women and men, doctors may find that assessing muscle mass will help detect adults at an incremented risk of developing type 2 diabetes. Aerobic and resistance exercise can contribute to preventing diabetes by increasing muscle mass, which should be further investigated in interventional studies.
The raw data supporting the conclusions of this article will be made available by the authors, without undue reservation.
The studies involving humans were approved by the Human Research Ethics Committee of the San Francisco Hospital in Quito. The studies were conducted in accordance with the local legislation and institutional requirements. The participants provided their written informed consent to participate in this study.
RS: Conceptualization, Formal analysis, Writing – original draft, Writing – review & editing, Data curation, Supervision, Validation. CA: Conceptualization, Formal analysis, Writing – review & editing, Validation. EB-V: Conceptualization, Data curation, Formal analysis, Validation, Writing – review & editing. YS-A: Conceptualization, Methodology, Validation, Writing – review & editing. AM: Formal analysis, Validation, Writing – review & editing. OJ: Methodology, Validation, Writing – review & editing. MM: Supervision, Validation, Writing – review & editing. SC: Formal analysis, Supervision, Validation, Writing – review & editing.
The author(s) declare that financial support was received for the research, authorship, and/or publication of this article. This research received funding from the Universidad Técnica Particular de Loja, Ecuador.
The assistance of the staff of the “Centro Clínico Quirúrgico Ambulatorio (Hospital del Día) Central Loja,” from the Ecuadorian Institute of Social Security, in the generation of this report, is gratefully appreciated.
The authors declare that the research was conducted in the absence of any commercial or financial relationships that could be construed as a potential conflict of interest.
All claims expressed in this article are solely those of the authors and do not necessarily represent those of their affiliated organizations, or those of the publisher, the editors and the reviewers. Any product that may be evaluated in this article, or claim that may be made by its manufacturer, is not guaranteed or endorsed by the publisher.
1. Lam, DW, and LeRoith, D. The worldwide diabetes epidemic. Curr Opin Endocrinol Diabetes Obes. (2012) 19:93–6. doi: 10.1097/MED.0b013e328350583a
2. International Diabetes Federation . IDF diabetes atlas. 10th ed (2021) Available at: www.diabetesatlas.org.
3. Seidu, S, Alabraba, V, Davies, S, Newland-Jones, P, Fernando, K, Bain, SC, et al. SGLT2 inhibitors– the new standard of Care for Cardiovascular, renal and metabolic protection in type 2 diabetes: a narrative review. Diabetes Therapy Adis. (2024) 15:1099–124. doi: 10.1007/s13300-024-01550-5
4. Owusu, BA, and Doku, DT. Towards an integrated type 1 diabetes management in low-resource settings: barriers faced by patients and their caregivers in healthcare facilities in Ghana. BMC Health Serv Res. (2024) 24:21. doi: 10.1186/s12913-023-10410-0
5. Lazaro-Pacheco, D, Taday, PF, and Paldánius, PM. Exploring in-vivo infrared spectroscopy for nail-based diabetes screening. Biomed Opt Express. (2024) 15:1926–42. doi: 10.1364/BOE.520102
6. Kokkorakis, M, Folkertsma, P, van Dam, S, Sirotin, N, Taheri, S, Chagoury, O, et al. Effective questionnaire-based prediction models for type 2 diabetes across several ethnicities: a model development and validation study. EClinicalMedicine. (2023) 64:102235. doi: 10.1016/j.eclinm.2023.102235
7. Muñoz-González, MC, Lima-Martínez, MM, Nava, A, Trerotola, G, Paoli, M, Cabrera-Rego, JO, et al. FINDRISC modified for Latin America as a screening tool for persons with impaired glucose metabolism in Ciudad Bolívar, Venezuela. Med Princ Pract. (2019) 28:324–32. doi: 10.1159/000499468
8. Suárez, R, Diaz, P, Sarmiento-Andrade, Y, Cadena, M, Alvarez, L, and Frias-Toral, E. Evaluación del estilo de vida con el riesgo de diabetes mellitus tipo 2 entrabajadores universitarios ecuatorianos. Rev Bionat. (2023) 8:1–11. doi: 10.21931/RB/2023.08.02.6
9. Nieto-Martinez, R, Barengo, NC, Restrepo, M, Grinspan, A, Assefi, A, and Mechanick, JI. Large scale application of the Finnish diabetes risk score in Latin American and Caribbean populations: a descriptive study. Front Endocrinol. (2023) 14:14. doi: 10.3389/fendo.2023.1188784
10. Srikanthan, P, and Karlamangla, AS. Relative muscle mass is inversely associated with insulin resistance and prediabetes. Findings from the third National Health and nutrition examination survey. J Clin Endocrinol Metab. (2011) 96:2898–903. doi: 10.1210/jc.2011-0435
11. Muscogiuri, G, Barrea, L, Caprio, M, Ceriani, F, Chavez, AO, El Ghoch, M, et al. Nutritional guidelines for the management of insulin resistance. Crit Rev Food Sci Nutr. (2022) 62:6947–60. doi: 10.1080/10408398.2021.1908223
12. Xu, Y, Hu, T, Shen, Y, Wang, Y, Bao, Y, and Ma, X. Association of skeletal muscle mass and its change with diabetes occurrence: a population-based cohort study. Diabetol Metab Syndr. (2023) 15:53. doi: 10.1186/s13098-023-01027-8
13. Frias-Toral, E, Chapela, S, Carignano, M, Moretti, D, Martinuzzi, A, Rodríguez-Veintimilla, D, et al. Mediterranean diet and physical activity for successful aging: an update for nutritionists and endocrinologists. Endocrine. (2021) 2:366–83. doi: 10.3390/endocrines2040034
14. Chapela, SP, Simancas-Racines, D, Montalvan, M, Frias-Toral, E, Simancas-Racines, A, Muscogiuri, G, et al. Signals for muscular protein turnover and insulin resistance in critically ill patients: a narrative review. Nutrients. (2023) 15:1071. doi: 10.3390/nu15051071
15. Organización Panamericana de la Salud/Organización Mundial de la Salud . Versión Panamericana del Instrumento del método progresivo (STEPS) Cuestionario básico y cuestionario ampliado a aplicarse en Ecuador. Mayo 2018. (2018). Available at: https://www.salud.gob.ec/wp-content/uploads/2020/10/STEPS_Ecuador_Instrumento_v3.2.pdf
16. Saadeddine, D, Itani, L, Kreidieh, D, El Masri, D, Tannir, H, and El Ghoch, M. Association between levels of physical activity, sarcopenia, type 2 diabetes and the quality of life of elderly people in community dwellings in Lebanon. Geriatrics. (2021) 6:28. doi: 10.3390/geriatrics6010028
17. Craig, C, Marshall, A, Sjöström, M, Bauman, AE, Booth, M, Barbara, A, et al. International physical activity questionnaire: 12-country reliability and validity. Med Sci Sports Exerc. (2003) 35:1381–95. doi: 10.1249/01.MSS.0000078924.61453.FB
18. Herrera, M, Mora, E, Solis, C, Iglesias, J, Acosta, W, Oleas, M, et al. Diabetes mellitus tipo 2. Ministerio de Salud Pública del Ecuador. Quito: Dirección Nacional de Normatización (2017) Available at: www.salud.gob.ec.
19. Buscemi, C, Ferro, Y, Pujia, R, Mazza, E, Boragina, G, Sciacqua, A, et al. Sarcopenia and appendicular muscle mass as predictors of impaired fasting glucose/type 2 diabetes in elderly women. Nutrients. (2021) 13:1909. doi: 10.3390/nu13061909
20. Murdock, DJ, Wu, N, Grimsby, JS, Calle, RA, Donahue, S, Glass, DJ, et al. The prevalence of low muscle mass associated with obesity in the USA. Skelet Muscle. (2022) 12:26. doi: 10.1186/s13395-022-00309-5
21. Jung, HN, Jung, CH, and Hwang, YC. Sarcopenia in youth. Metabolism. (2023) 144:155557. doi: 10.1016/j.metabol.2023.155557
22. Jeng, C, Zhao, L, Wu, K, Zhou, Y, Chen, T, and Deng, H. Race and socioeconomic effect on sarcopenia and sarcopenic obesity in the Louisiana osteoporosis study (LOS). JCSM Clin Rep. (2018) 3:1–8. doi: 10.17987/jcsm-cr.v3i2.27
23. Kalyani, RR, Metter, EJ, Xue, QL, Egan, JM, Chia, CW, Studenski, S, et al. The relationship of lean body mass with aging to the development of diabetes. J Endocr Soc. (2020) 4:1–16. doi: 10.1210/jendso/bvaa043
24. Shin, Y, Moon, JH, Oh, TJ, Ahn, CH, Moon, JH, Choi, SH, et al. Higher muscle mass protects women with gestational diabetes mellitus from progression to type 2 diabetes mellitus. Diabetes Metab J. (2022) 46:890–900. doi: 10.4093/dmj.2021.0334
25. Qu, Q, Guo, Q, Sun, J, Lu, X, Cheang, I, Zhu, X, et al. Low lean mass with obesity in older adults with hypertension: prevalence and association with mortality rate. BMC Geriatr. (2023) 23:619. doi: 10.1186/s12877-023-04326-x
26. Park, JH, Lee, MY, Shin, HK, Yoon, KJ, Lee, JY, and Park, JH. Lower skeletal muscle mass is associated with diabetes and insulin resistance: a cross-sectional study. Diabetes Metab Res Rev. (2023) 39:e3681. doi: 10.1002/dmrr.3681
27. Jun, JE, Lee, SE, Bin, LY, Kim, G, Jin, SM, Jee, JH, et al. Low skeletal muscle mass accompanied by abdominal obesity additively increases the risk of incident type 2 diabetes. J Clin Endocrinol Metab. (2023) 108:1173–80. doi: 10.1210/clinem/dgac662
28. Guede-Rojas, F, Ibacache-Saavedra, P, Leal, MI, Tuesta, M, Durán-Marín, C, Carrasco-Marín, F, et al. A higher skeletal muscle mass and lower adiposity phenotype is associated with better Cardiometabolic control in adults with hip and knee osteoarthritis: results from the Chilean National Health Survey 2016-2017. Nutrients. (2023) 15:4263. doi: 10.3390/nu15194263
29. Haines, MS, Leong, A, Porneala, BC, Zhong, VW, Lewis, CE, Schreiner, PJ, et al. More appendicular lean mass relative to body mass index is associated with lower incident diabetes in middle-aged adults in the CARDIA study. Nutr Metab Cardiovasc Dis. (2023) 33:105–11. doi: 10.1016/j.numecd.2022.09.017
30. Terada, T, Reed, JL, Vidal-Almela, S, Mistura, M, Kamiya, K, and Way, KL. Sex-specific associations of fat mass and muscle mass with cardiovascular disease risk factors in adults with type 2 diabetes living with overweight and obesity: secondary analysis of the look AHEAD trial. Cardiovasc Diabetol. (2022) 21:40. doi: 10.1186/s12933-022-01468-x
31. Mason, SE, Moreta-Martinez, R, Labaki, WW, Strand, MJ, Regan, EA, Bon, J, et al. Longitudinal association between muscle loss and mortality in ever smokers. Chest. (2022) 161:960–70. doi: 10.1016/j.chest.2021.10.047
32. Hong, SH, and Bae, YJ. Association between alcohol consumption and the risk of sarcopenia: a systematic review and Meta-analysis. Nutrients. (2022) 14:3266. doi: 10.3390/nu14163266
33. Sizoo, D, de Heide, LJM, Emous, M, van Zutphen, T, Navis, G, and van Beek, AP. Measuring muscle mass and strength in obesity: a review of various methods. Obes Surg. (2021) 31:384–93. doi: 10.1007/s11695-020-05082-2
34. Mcleod, JC, Currier, BS, Lowisz, CV, and Phillips, SM. The influence of resistance exercise training prescription variables on skeletal muscle mass, strength, and physical function in healthy adults: an umbrella review. J Sport Health Sci. (2024) 13:47–60. doi: 10.1016/j.jshs.2023.06.005
35. Kerr, NR, and Booth, FW. Contributions of physical inactivity and sedentary behavior to metabolic and endocrine diseases. Trends Endocrinol Metab. (2022) 33:817–27. doi: 10.1016/j.tem.2022.09.002
36. Kuang, M, Lu, S, Yang, R, Chen, H, Zhang, S, Sheng, G, et al. Association of predicted fat mass and lean body mass with diabetes: a longitudinal cohort study in an Asian population. Front Nutr. (2023) 10:1093438. doi: 10.3389/fnut.2023.1093438
37. Terada, T, Boulé, NG, Forhan, M, Prado, CM, Kenny, GP, Prudhomme, D, et al. Cardiometabolic risk factors in type 2 diabetes with high fat and low muscle mass: at baseline and in response to exercise. Obesity. (2017) 25:881–91. doi: 10.1002/oby.21808
38. Hsu, KJ, De Liao, C, Tsai, MW, and Chen, CN. Effects of exercise and nutritional intervention on body composition, metabolic health, and physical performance in adults with Sarcopenic obesity: a meta-analysis. Nutrients. (2019) 11:2163. doi: 10.3390/nu11092163
39. Li, C, Yu, K, Shyh-Chang, N, Jiang, Z, Liu, T, Ma, S, et al. Pathogenesis of sarcopenia and the relationship with fat mass: descriptive review. J Cachexia Sarcopenia Muscle. (2022) 13:781–94. doi: 10.1002/jcsm.12901
40. Ruiz-Pozo, VA, Tamayo-Trujillo, R, Cadena-Ullauri, S, Frias-Toral, E, Guevara-Ramírez, P, Paz-Cruz, E, et al. The molecular mechanisms of the relationship between insulin resistance and Parkinson’s disease pathogenesis. Nutrients. (2023) 15:3585. doi: 10.3390/nu15163585
41. Grosso, G, Laudisio, D, Frias-Toral, E, Barrea, L, Muscogiuri, G, Savastano, S, et al. Anti-inflammatory nutrients and obesity-associated metabolic-inflammation: State of the art and future direction. Nutrients (2022); 14:1137. doi: 10.3390/nu14061137
42. Wang, L, Lin, X, Huang, H, Wang, Y, Liang, X, Zheng, X, et al. Low rectus femoris mass index is closely associated with diabetic peripheral neuropathy. Front Endocrinol. (2023) 14:14. doi: 10.3389/fendo.2023.1148093
43. Liu, D, Zhong, J, Ruan, Y, Zhang, Z, Sun, J, and Chen, H. The association between fat-to-muscle ratio and metabolic disorders in type 2 diabetes. Diabetol Metab Syndr. (2021) 13:129. doi: 10.1186/s13098-021-00748-y
44. Wang, J, Lv, B, Chen, X, Pan, Y, Chen, K, Zhang, Y, et al. An early model to predict the risk of gestational diabetes mellitus in the absence of blood examination indexes: application in primary health care centres. BMC Pregnancy Childbirth. (2021) 21:814. doi: 10.1186/s12884-021-04295-2
45. Wang, F, Bao, YY, and Yu, K. The Association of the Triglyceride and Muscle to fat ratio during early pregnancy with the development of gestational diabetes mellitus. Diabetes Metab Syndr Obes. (2023) 16:3187–96. doi: 10.2147/DMSO.S431264
46. Konstantinova, ED, Maslakova, TA, and Ogorodnikova, SY. The predictive capability of several anthropometric indices for identifying the risk of metabolic syndrome and its components among industrial workers. Sci Rep. (2024) 14:15327. doi: 10.1038/s41598-024-66262-z
47. Ling, CHY, de Craen, AJM, Slagboom, PE, Gunn, DA, Stokkel, MPM, Westendorp, RGJ, et al. Accuracy of direct segmental multi-frequency bioimpedance analysis in the assessment of total body and segmental body composition in middle-aged adult population. Clin Nutr. (2011) 30:610–5. doi: 10.1016/j.clnu.2011.04.001
48. Bosy-Westphal, A, Jensen, B, Braun, W, Pourhassan, M, Gallagher, D, and Müller, MJ. Quantification of whole-body and segmental skeletal muscle mass using phase-sensitive 8-electrode medical bioelectrical impedance devices. Eur J Clin Nutr. (2017) 71:1061–7. doi: 10.1038/ejcn.2017.27
Keywords: diabetes mellitus, type 2, lean body mass, low muscle mass, sarcopenia, body mass index
Citation: Suárez R, Andrade C, Bautista-Valarezo E, Sarmiento-Andrade Y, Matos A, Jimenez O, Montalvan M and Chapela S (2024) Low muscle mass index is associated with type 2 diabetes risk in a Latin-American population: a cross-sectional study. Front. Nutr. 11:1448834. doi: 10.3389/fnut.2024.1448834
Edited by:
Jorge Carriel Mancilla, Catholic University of Santiago de Guayaquil, EcuadorReviewed by:
Giuseppe Annunziata, Pegaso University, ItalyCopyright © 2024 Suárez, Andrade, Bautista-Valarezo, Sarmiento-Andrade, Matos, Jimenez, Montalvan and Chapela. This is an open-access article distributed under the terms of the Creative Commons Attribution License (CC BY). The use, distribution or reproduction in other forums is permitted, provided the original author(s) and the copyright owner(s) are credited and that the original publication in this journal is cited, in accordance with accepted academic practice. No use, distribution or reproduction is permitted which does not comply with these terms.
*Correspondence: Celina Andrade, Y2VhbmRyYWRlMTNAdXRwbC5lZHUuZWM=
Disclaimer: All claims expressed in this article are solely those of the authors and do not necessarily represent those of their affiliated organizations, or those of the publisher, the editors and the reviewers. Any product that may be evaluated in this article or claim that may be made by its manufacturer is not guaranteed or endorsed by the publisher.
Research integrity at Frontiers
Learn more about the work of our research integrity team to safeguard the quality of each article we publish.