 Jing Tian1,2†
 Jinfeng Wei
 Changyang Ma
 Wenyi Kang
- 1National R&D Center for Edible Fungus Processing Technology, Henan University, Kaifeng, China
- 2The First Affiliated Hospital of Henan University, Kaifeng, China
- 3Huaihe Hospital of Henan University, Kaifeng, China
- 4College of Agriculture, Henan University, Kaifeng, China
- 5Functional Food Engineering Technology Research Center, Kaifeng, China
- 6Joint International Research Laboratory of Food and Medicine Resource Function, Kaifeng, China
Introduction: Ganoderma lucidum is one well known functional food resource. The triterpenes, such as Ganoderic acid A and Ganoderic acid D, as well as the sensory characteristics could reflect the quality of G. lucidum.
Methods: In order to find rapid methods to evaluate the Ganoderma lucidum from different origins, Electronic tongue and High performance liquid chromatography (HPLC) were used in this paper.
Results: The Electronic tongue results combined with PCA and LDA analysis showed that the taste of different batches of G. lucidum from the same producing area was similar, but quite different from different producing areas. The overall taste of G. lucidum from Anhui was obviously different from that from Shandong and Sichuan. Meanwhile, the concentrations of two main triterpenes of G. lucidum, Ganoderic acid A and Ganoderic acid D were detected by using HPLC, and the variability of different origins were consistent with that from Electronic tongue. Moreover, the triterpenoid acids content in G. lucidum from Shandong was about 1.04 mg/g, which is the highest of the three origins, followed by Sichuan and Anhui.
Discussion: Both the Electronic tongue and HPLC could efficiently distinguish the different origins of G. lucidum from taste property or content of key triterpenes, and provide new technical support for the quality evaluation of G. lucidum.
1 Introduction
Ganoderma lucidum is usually known as “Glossy Ganoderma grass,” “Ruicao,” “Revival Grass,” which is also named as “Ten Thousand Year mushroom” in Japan (1, 2). G. lucidum contains abundant bioactive compounds, such as triterpenes, polysaccharides, sterols, etc. (3, 4), which can effectively inhibit tumors, improve immunity, improve sleep, etc. (2, 5–7) as well as prolonging lifespan (8). With the people’s pursuit of high-level living and in-depth knowledge about G. lucidum, the demand for this functional food resource and derivatives has also sharply increased.
Ganoderic acid A and Ganoderic acid D are reported as two representative bioactive components of G. lucidum (9). Many researches have shown that Ganoderic acid A could inhibit tumor growth (10), protect nerve cells (11), combat depression (12), regulate lipid metabolism (13), improve osteoarthritis (14), promote myelin sheath regeneration (15), etc. Ganoderic acid D could prevent oxidative stress-induced aging by regulating the CaM/CaMKll/NRF2 signaling pathway in stem cells (16). This compound can also be used for the treatment of esophageal squamous cell carcinoma through promoting ESCC cell apoptosis and autophagy cell death (17). In our previous study, Ganoderic acid A and Ganoderic acid D were found to be the key components with immunomodulatory activity, and had obvious enhanced immune activity (9).
For quality management of G. lucidum, many technologies were used. According to relevant literature reports, HPLC is a commonly used analytical technique for component content determination (18), with strong operability, high resolution, wide applicability, and high safety (19, 20). The standard HPLC method for determination of Ganoderic acid A and Ganoderic acid D is available. Moreover, these critical triterpenoid acids are not only the bioactive compounds of G. lucidum, but also strongly associated with the taste of this material (21), indicating that it would be possible to detect the taste properties to evaluate the quality of G. lucidum. However, since the strong subjectivity of artificial taste and the weak stability, repeatability, and reliability of human sensor organ, sensor analysis method was greatly limited in the quality control on functional materials, until the application of electronic tongues (22, 23). Electronic tongue technology can simulate human perception of taste through sensor array, so as to detect non-volatile compounds in sample solution (24). The characteristics of electronic tongue technology enable the detection of a specific type of substance rapidly, while HPLC method allows for the identification of particular components. The combination of these two techniques is more conducive to comprehensive analysis of specific substances and there results could be confirmed mutually. In the research of Zabada et al. (25), Electronic tongue technology and HPLC combined with PLSR method were used to detect the concentration of 2-phenylethanol and glucose in yeast culture medium. This method can rapid monitor the yeast fermentation processes with some specific analytes.
On this basis, this study would use Electronic tongue technology combined with chemometrics to identify the origins of G. lucidum simply, accurately and quickly. HPLC technology was also used to determine the content of Ganoderic acid A and Ganoderic acid D in G. lucidum, and study the differences in the content of triterpenoids in G. lucidum from different regions. Partial least squares regression (PLSR) model was adopted to study the correlation between sensory quality parameters and characteristic flavor substances of G. lucidum, in order to provide scientific basis for quality control and reasonable application of G. lucidum.
2 Materials and methods
2.1 Materials
2.1.1 Samples
A total of 20 dried samples were collected from the three major producing areas of G. lucidum with large yield and good quality, including the provinces of Shandong, Anhui and Sichuan in China and labelled as L1 to W20. L1 ~ L7 samples were from Shandong province, S8 ~ S12 samples were from Sichuan province, and W13 ~ W20 samples were from Anhui province.
2.1.2 Instruments and equipment
The LC-20AT HPLC system was pursued from Shimadzu, Kyoto in Japan; 2,908,008 Electronic tongues with 6 sensors (C1-C6) was produced by Shanghai Ruisun Intelligent Technology Co., Ltd. in China, and the Unscrambler X10.4 statistical analysis software was developed by CAMO Inc. in Norway.
Acetonitrile and methanol were chromatographic grade, while Glacial acetic acid was analytical grade. The standard Ganoderic acid A (JOT-10947) and Ganoderic acid D (JOT-11170) were purchased from Chengdu Pufeide Biotechnology Co., Ltd. in China.
2.2 Experimental methods
2.2.1 Preparation of test solution
After grinding of G. lucidum into powder, 2.00 g of each sample powder was accurately weighed, and dissolved in 20 mL methanol. Ultrasonic extraction was performed for 1 h, followed by centrifugation for 10 min. Supernatant was taken and filtered through 0.22 μm microporous filter membrane. The subsequent filtrate was collected as the test solution.
2.2.2 Electron tongue detection
At first, the 6 electronic tongue sensors should be activated and preheated for 30 min. And then, clean the sensors with distilled water for 120 s and put them into the test solution for 180 s to test the sample. Each sample was tested 3 times in parallel, and take their average value as the test result for analysis.
2.2.3 Preparation of standard solution
Weigh the reference materials of Ganoderic acid A and Ganoderic acid D accurately and prepare the two standard solutions at the concentration of 2 mg/mL with methanol. Then, the two standard solutions were diluted into a series of solutions with concentration gradient.
2.2.4 Detection of compounds by HPLC
2.2.4.1 HPLC chromatographic conditions
In the HPLC analysis, chromatographic column was the SHIMADZU Shim-pack GIST C18 (4.6 mm × 250 mm, 5 μm), detection wavelength was set at 254 nm, column temperature was 30°C, injection volume was 20 μL, and the flow rate was 0.8 mL/min. The mobile phases were acetonitrile (A) and 0.2% acetic acid aqueous solution (B), according to the gradient elution program shown in Table 1.
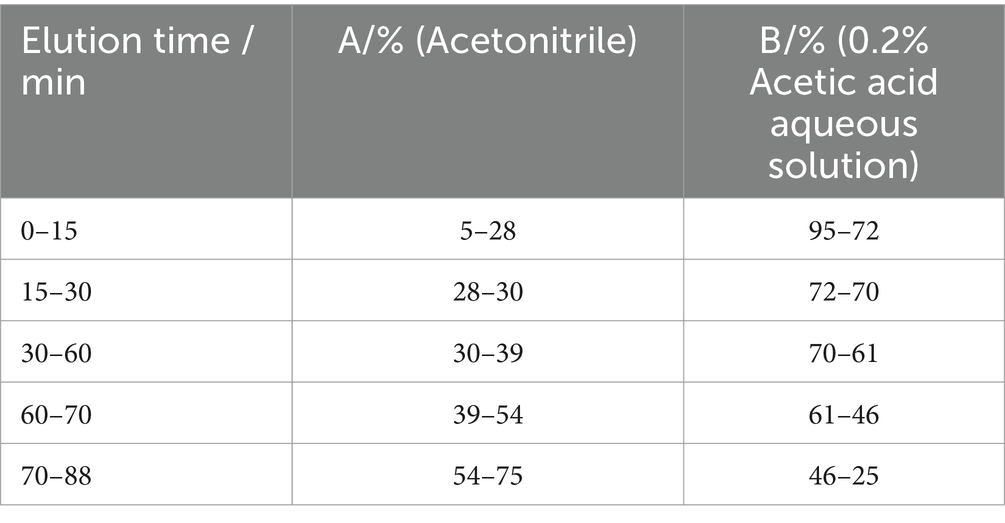
Table 1. The elution program.
According to the above chromatographic conditions, the HPLC chromatogram was recorded as Figure 1. It could be found that the peaks of Ganoderic acid A and Ganoderic acid D were noticeable in G. lucidum samples, and the chromatographic peak separation was good, without obvious interference by other components.
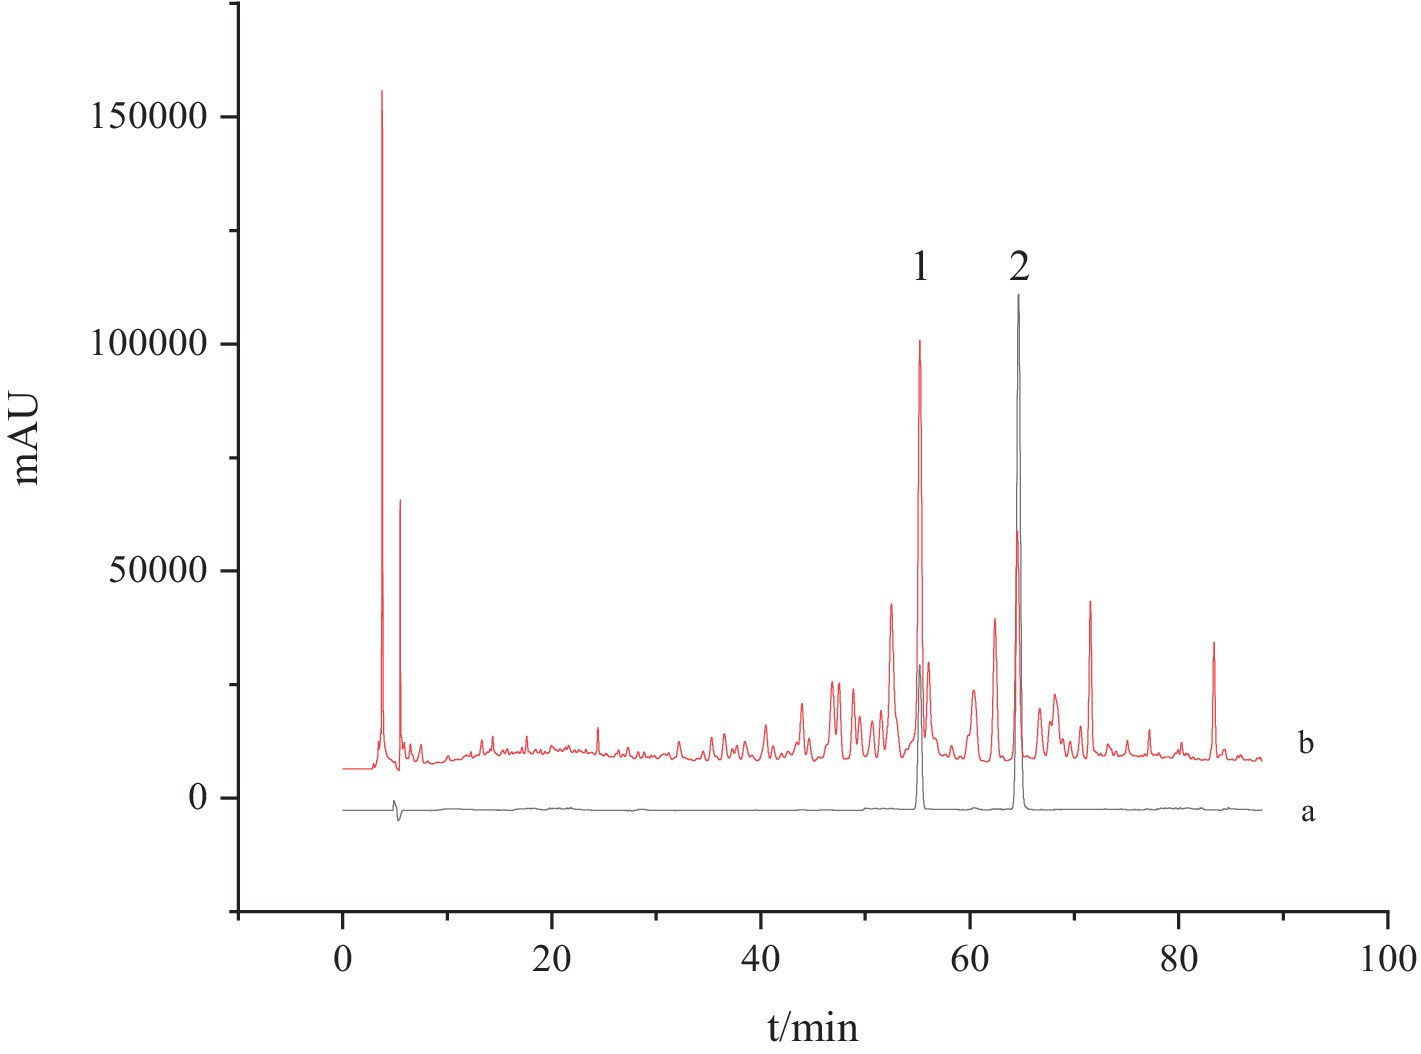
Figure 1. HPLC chromatogram of G. lucidum and standard solution. a: The standard solution and b: the test solution; 1: Ganoderic acid A and 2: Ganoderic acid D.
2.2.4.2 Methodological investigation
Investigation of linear relationship. The standard solution of Ganoderic acid A and Ganoderic acid D were diluted to 6 gradient concentrations and performed according to the chromatographic conditions under “2.2.4.” Take the injection mass concentration (X, mg/mL) as the argument and peak area (Y) as the dependent variable, and obtain the linear regression equations shown in Table 2.
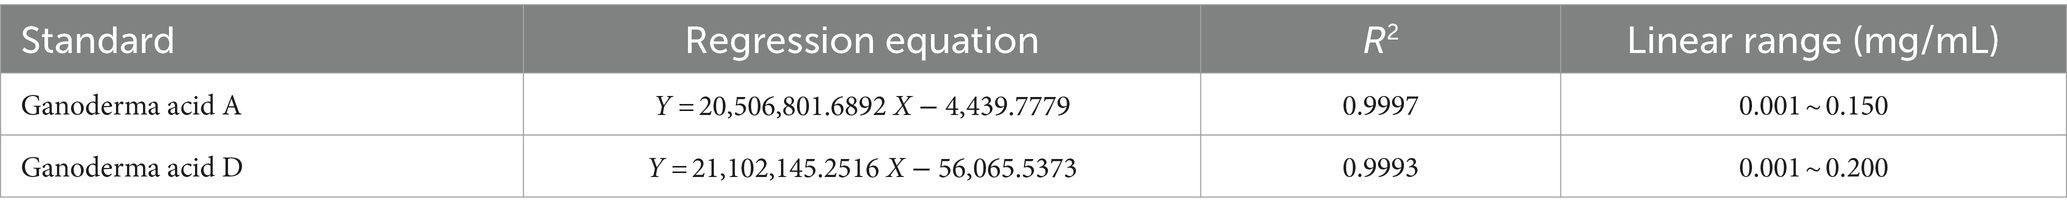
Table 2. Regression equations and linear relationships.
Specificity test. One part of blank solvent (methanol) and one part of G. lucidum test solution was taken and determined according to the chromatographic conditions under “2.2.4.” It was found that the blank solvent did not interfere with the determination, indicating that the method has well specificity (Figure 2).
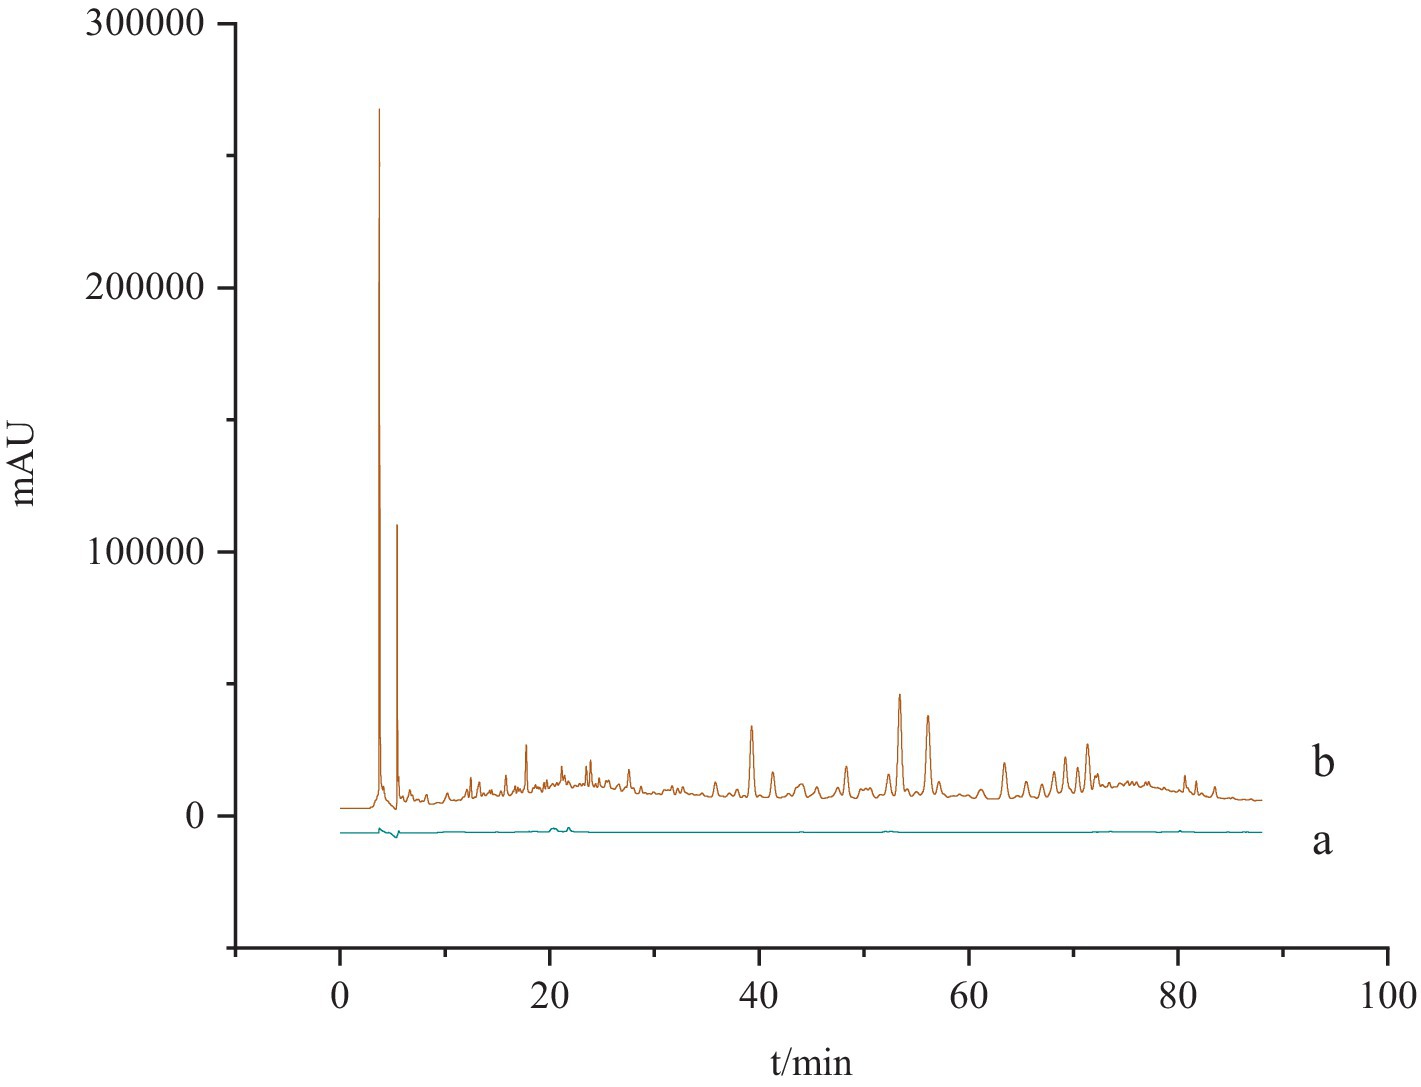
Figure 2. The specificity test of HPLC chromatogram for Ganoderma acid A and Ganoderma acid D. a: The blank solution; b: the test solution.
Precision test. The mixed reference solution was precisely measured, and the peak area was measured by 6 consecutive samples according to the above chromatographic conditions. The RSD values of Ganoderic acid A and Ganoderic acid D were 0.13 and 0.11%, respectively, and RSD values of relative peak area were 1.25 and 1.05%, respectively, indicating good precision of the HPLC instrument.
Repeatability test. 6 samples were accurately weighed, the test solution was prepared according to the method under “2.2.1,” and its peak area was determined according to the above chromatographic conditions. RSD of Ganoderic acid A and Ganoderic acid D were 0.24 and 0.21%, respectively, and RSD of relative peak area were 1.18 and 1.20%, respectively. The reproducibility of the method was good.
Stability test. The same sample solution was precisely measured, and the peak area of the target component was measured at 0, 2, 6, 12, 18 and 24 h according to the above chromatographic conditions. The RSD values of the relative retention time of Ganoderic acid A and Ganoderic acid D were 0.28 and 0.25%, and the RSD values of the relative peak area were 1.45 and 1.74%, respectively, indicating that the test solution was basically stable within 24 h.
Recovery rate test. 6 samples of the same test product with known content were accurately weighed, appropriate amount of standard solution was added, and treated according to the method under “2.2.1.” Peak area was determined according to the above chromatographic conditions. After calculation, the average recovery rates of Ganoderic acid A and Ganoderic acid D were 100.03 and 100.44%, respectively, with RSDs of 0.92 and 0.54%.
2.3 Data processing
The content of different batches of G. lucidum were statistically analyzed and plotted using Microsoft Excel 2010 and Origin 2019b 64Bit software. The Unscrambler X 10.4 software was used for PCA and LDA analysis, and PLSR model was adopted to analyze the correlation between sensory data of G. lucidum and the content of flavoring substances.
3 Results and analysis
3.1 The sensory characteristics of G. lucidum from different regions based on electronic tongue
Different batches of G. lucidum solution were immersed in the Electronic tongue sensor for determination, and the sensory data were shown in Table 3.
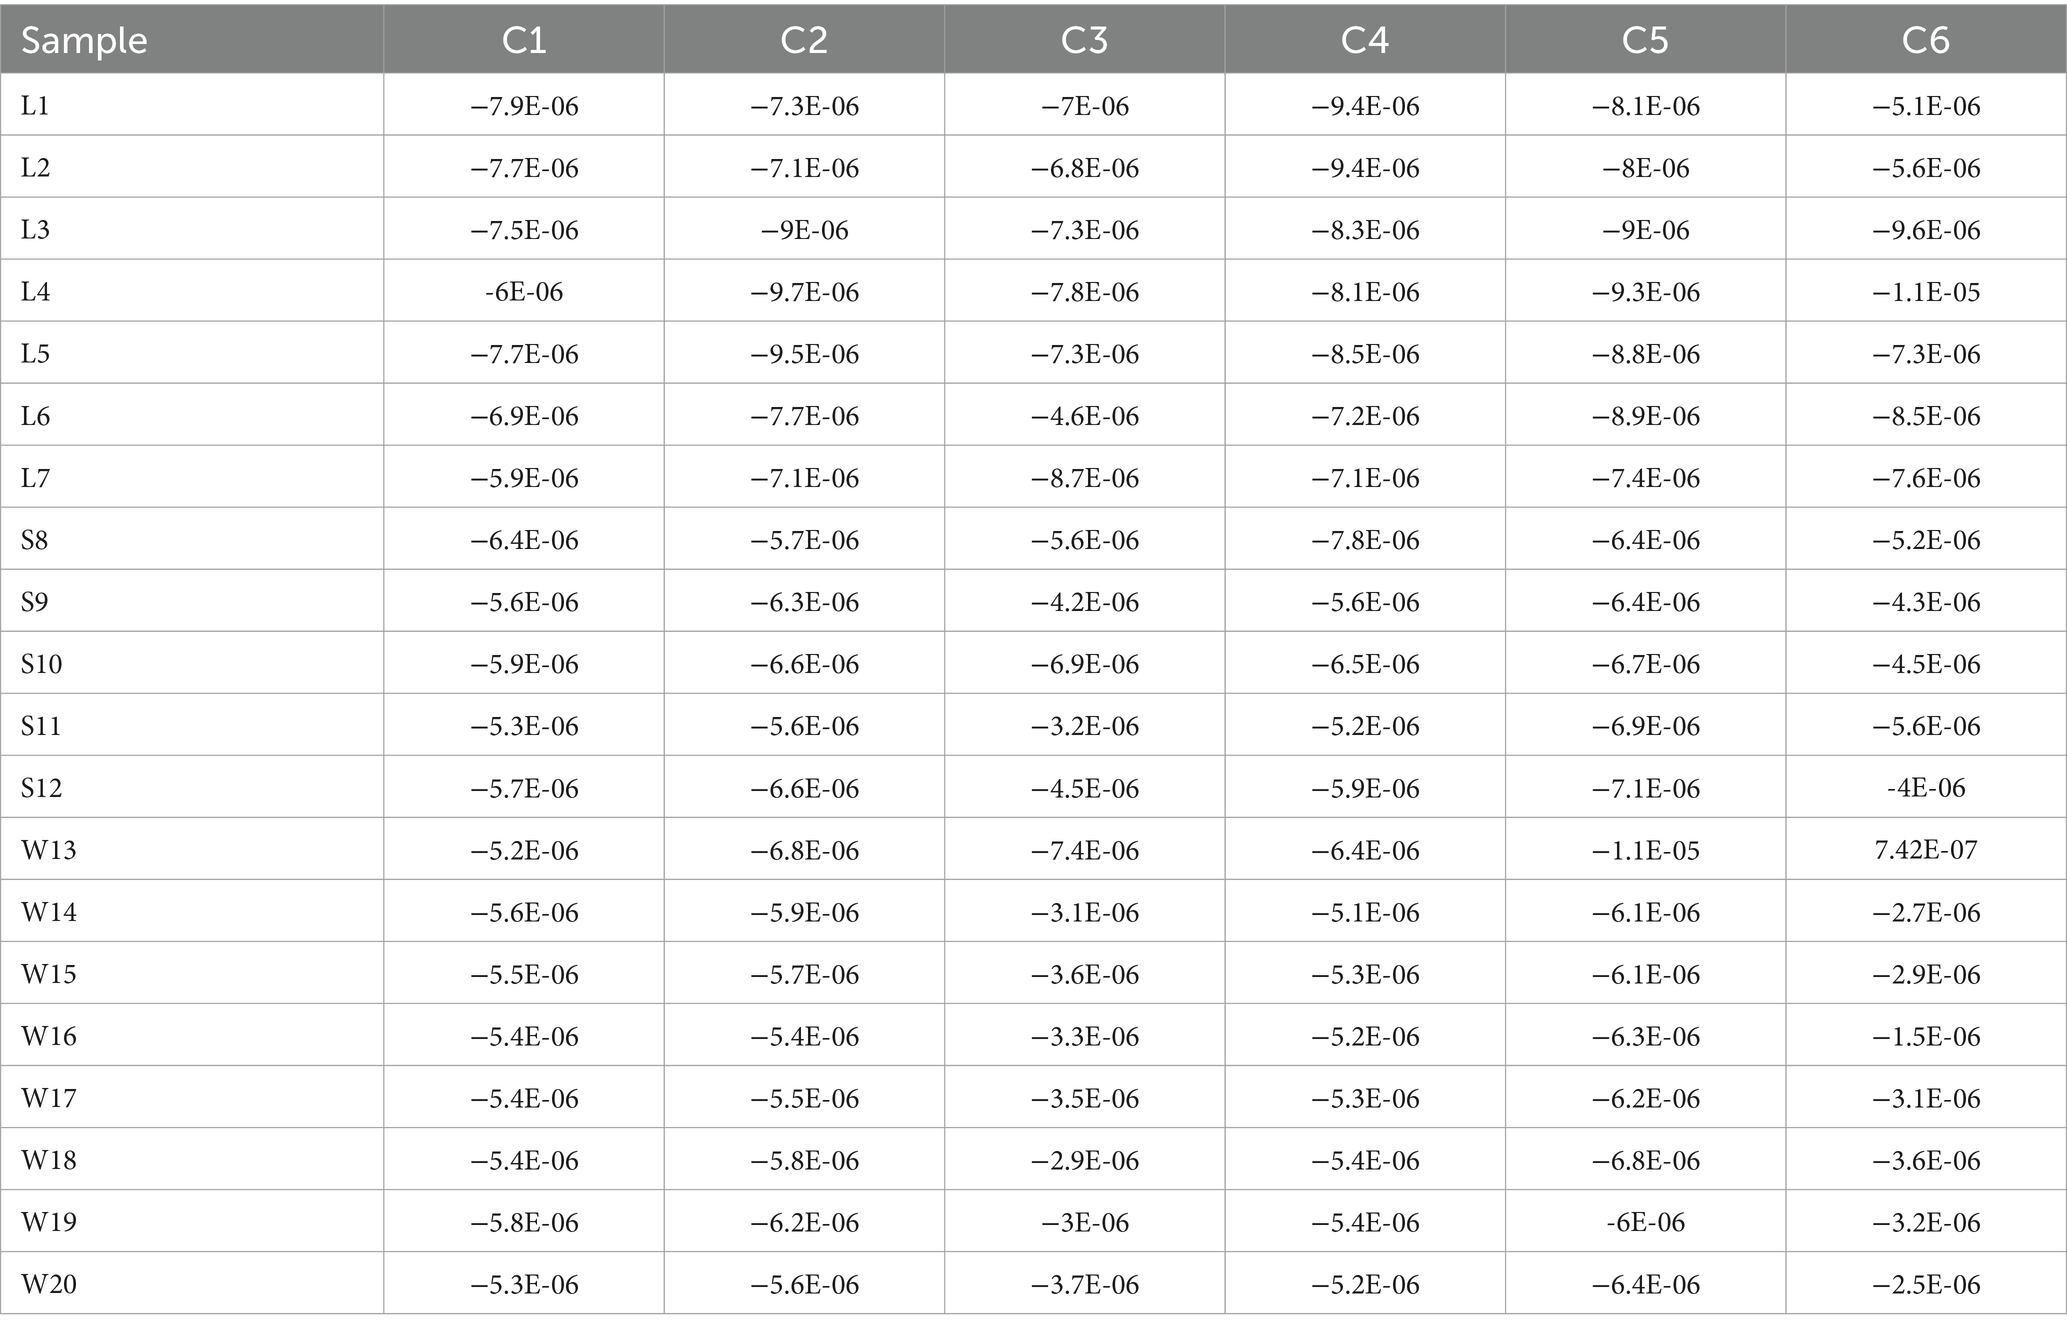
Table 3. Sensory data of G. lucidum by Electronic tongue.
The PCA and LDA analysis of Electronic tongue taste data of the 20 batches of G. lucidum were shown in Figure 3. In Figure 3a, the first principal component (PC-1) accounted for 82% of the overall information content, and the second principal component (PC-2) accounted for 11%. The total contribution rates of PC-1 and PC-2 were 93%, which could basically represent all the information of the G. lucidum samples. The specimens from different producing areas were distributed in different areas without cross coincide between each other, indicating that there were obvious differences in sensory quality of G. lucidum exponents from its’ productions. From Figure 3a, it could also be perceived that the spatial distribution sites of the swatchs from Sichuan and Shandong regions were relatively proximity, but farther away from Anhui. This showed that the sensory organ of G. lucidum from Sichuan and Shandong was relatively close, but significant discrepancy with G. lucidum from Anhui. As LDA results the shown in Figure 3b, the accuracy of the linear discriminant analysis model was 100%. The first two principal components by LDA algorithm could cluster 20 batches of G. lucidum samples into 3 categories, which could well distinguish G. lucidum from different origins. Meanwhile, the samples from Sichuan province located in medial position, which was similar to the results of PCA analysis. In summary, the Electronic tongue technology combined with PCA or LDA method could effectively distinguish the G. lucidum from different regions.
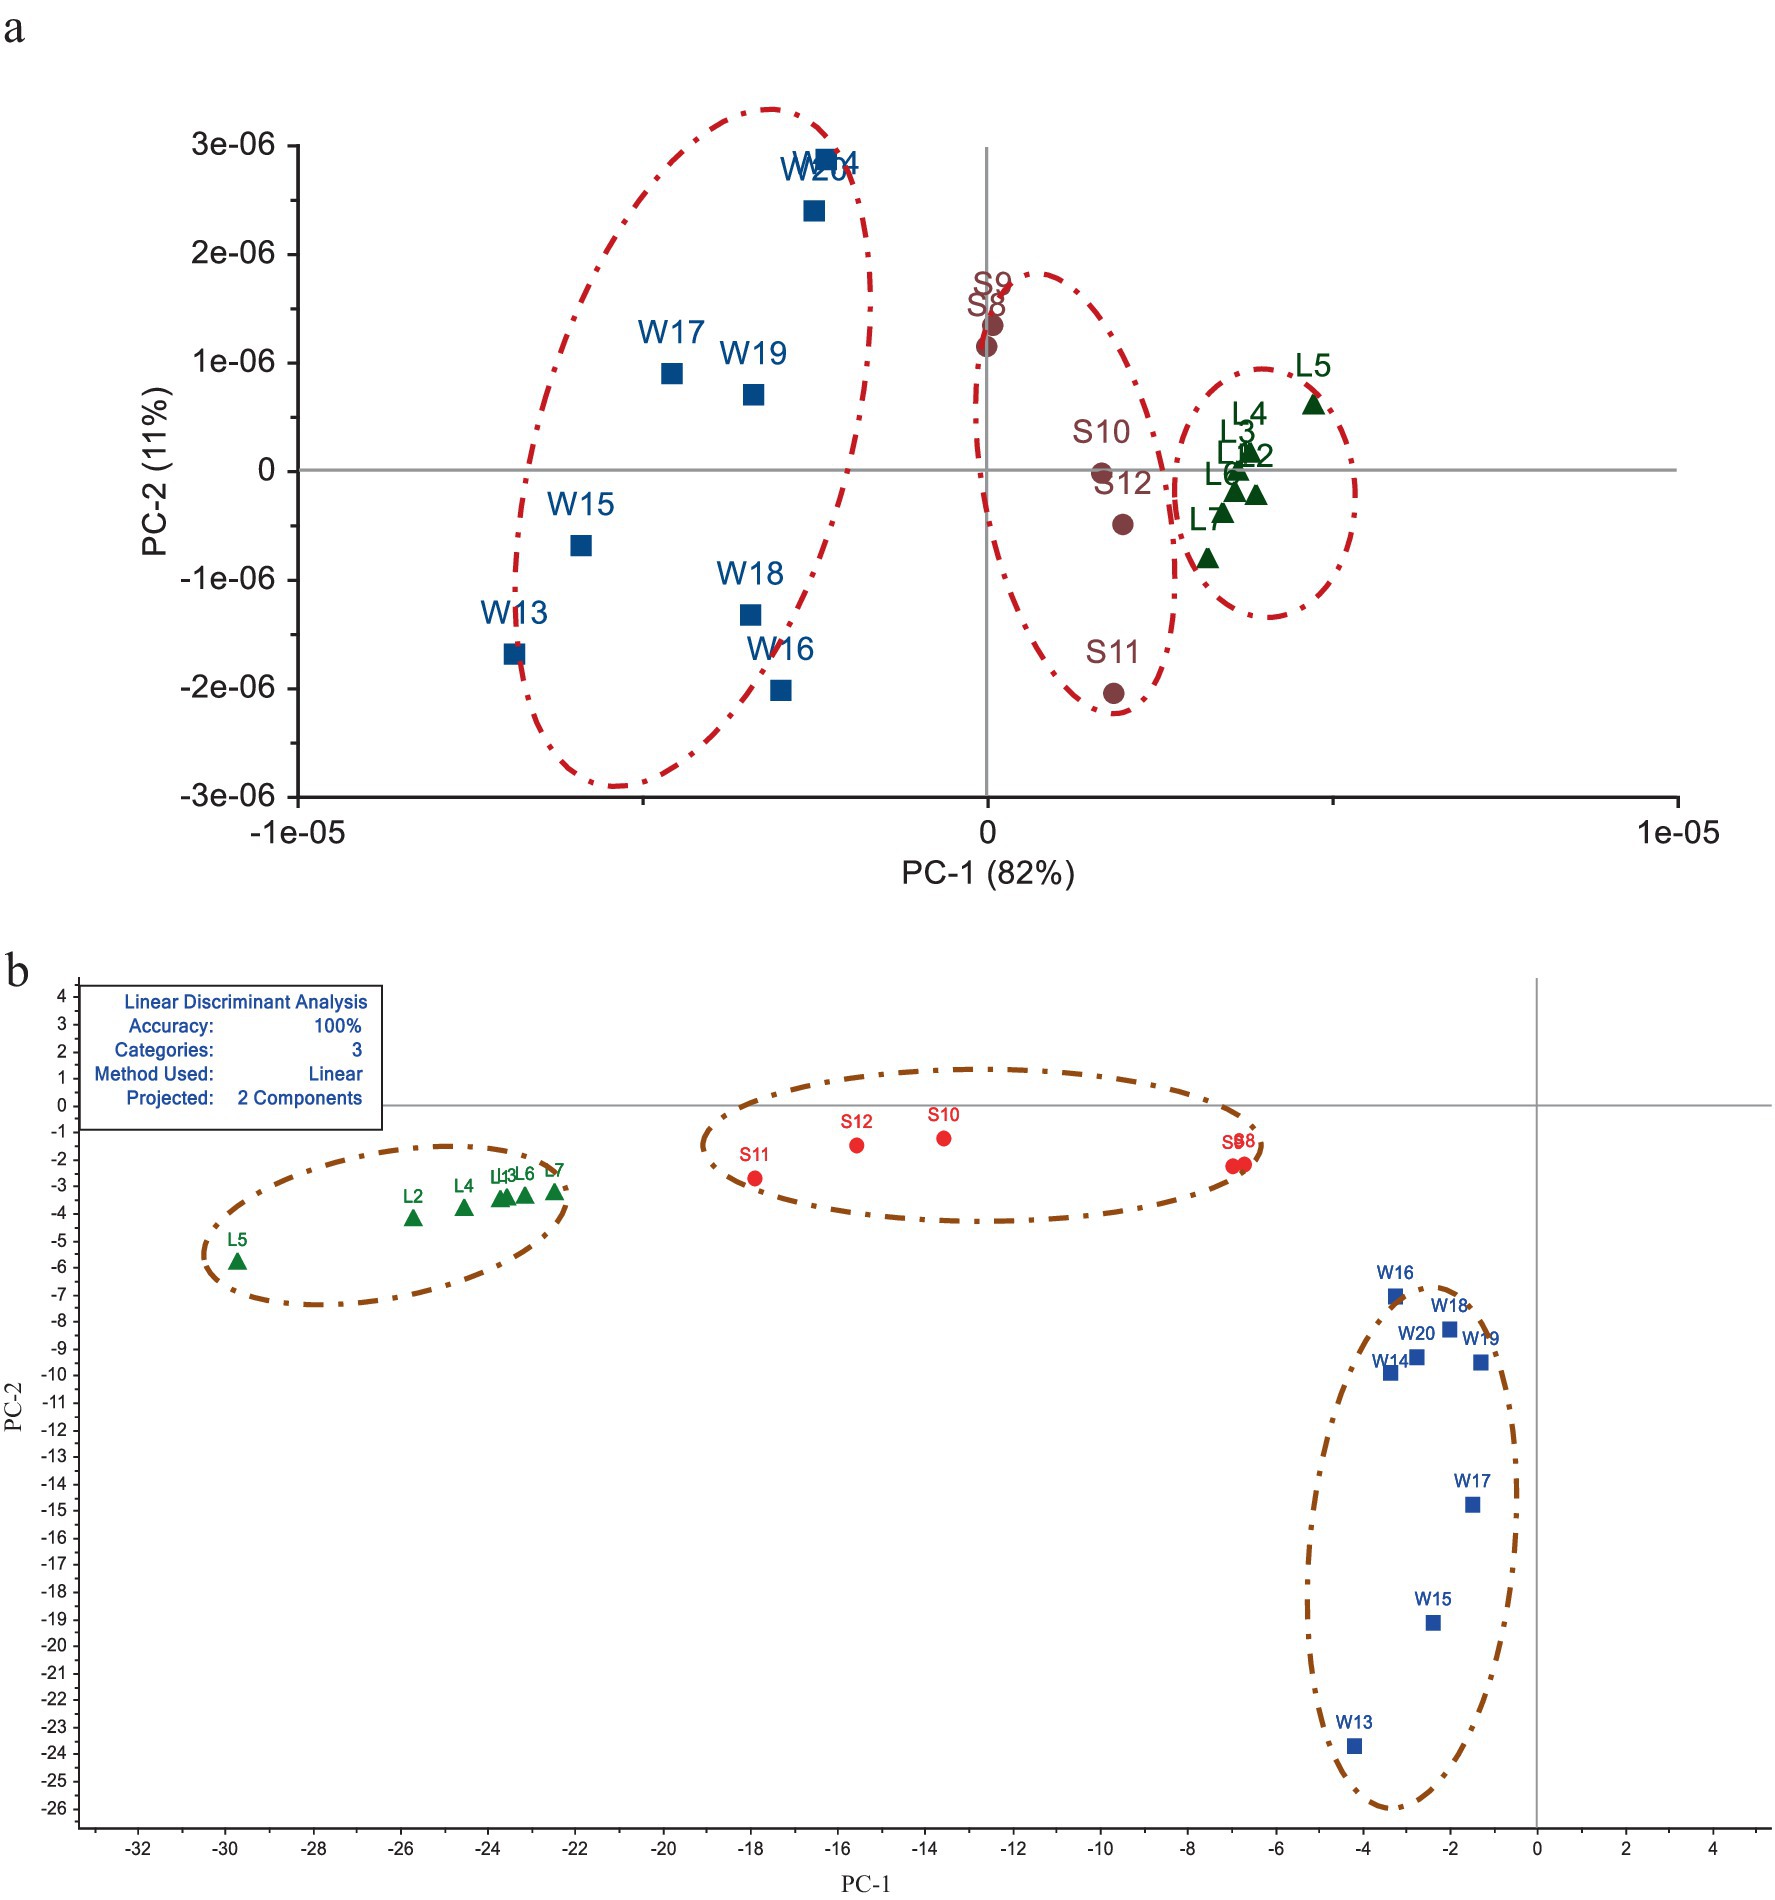
Figure 3. Analysis of G. lucidum sensory characteristics among different origins by PCA and LDA methods. (a) The result based on PCA analysis. (b) The result based on LDA distribution.
3.2 Content determination and methodology investigation by HPLC
The contents of Ganoderic acid A and Ganoderic acid D in 20 batches of G. lucidum were shown in Table 4. From this, among the three grow areas of G. lucidum, the content of Ganoderic acid A and Ganoderic acid D in G. lucidum produced in Shandong is the highest, with an average of 1.04 mg/g, which is about 2 times that of Sichuan G. lucidum and 5 times of that from Anhui province. Through PCA and LDA analysis, the two PCs of G. lucidum samples were shown visually in Figure 4. It could be intuitively observed that the content of triterpenoid acids varies significantly among different regions. The boundaries among the samples from different regions without crossing each other, indicating the two triterpenoid acids could distinguish the G. lucidum from different regions. Compared with PCA analysis (Figure 4a), in LDA analysis results (Figure 4b), the scattered points of G. lucidum from the same origin were more concentrated, while those from different origins have longer scatter distances. The results of HPLC were consistent with those of Electronic tongue, indicating that Electronic tongue would be alternative methods to replace HPLC to distinguish the G. lucidum samples from different places, accurately and quickly. And sense organ could mirror the markers of G. lucidum, to a certain extend.
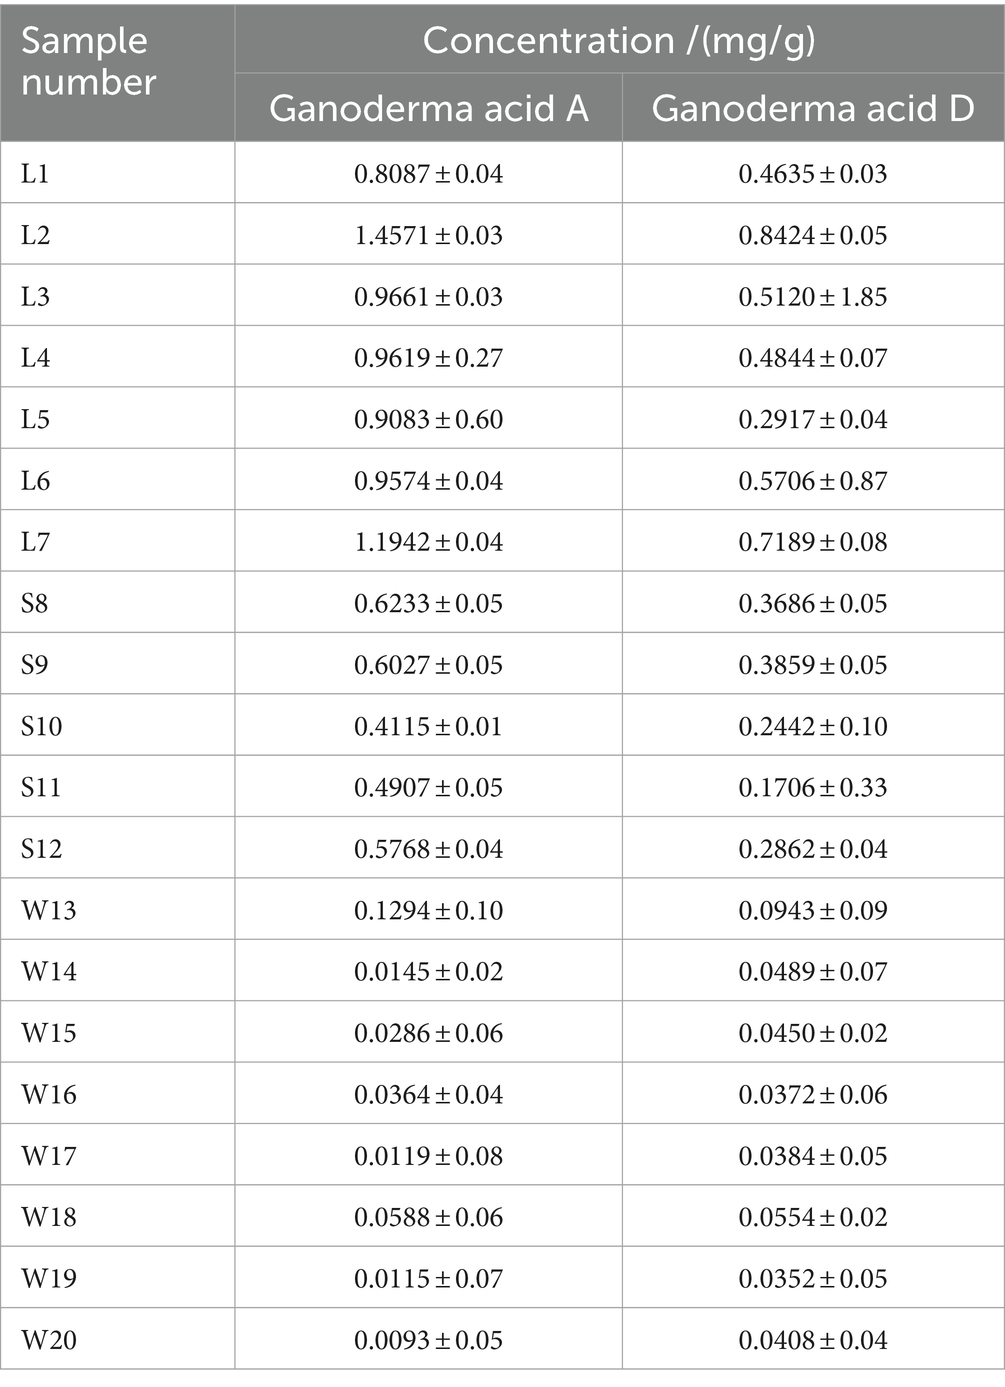
Table 4. The contents of Ganoderma acid A and Ganoderma acid D in 20 batches of G. lucidum.
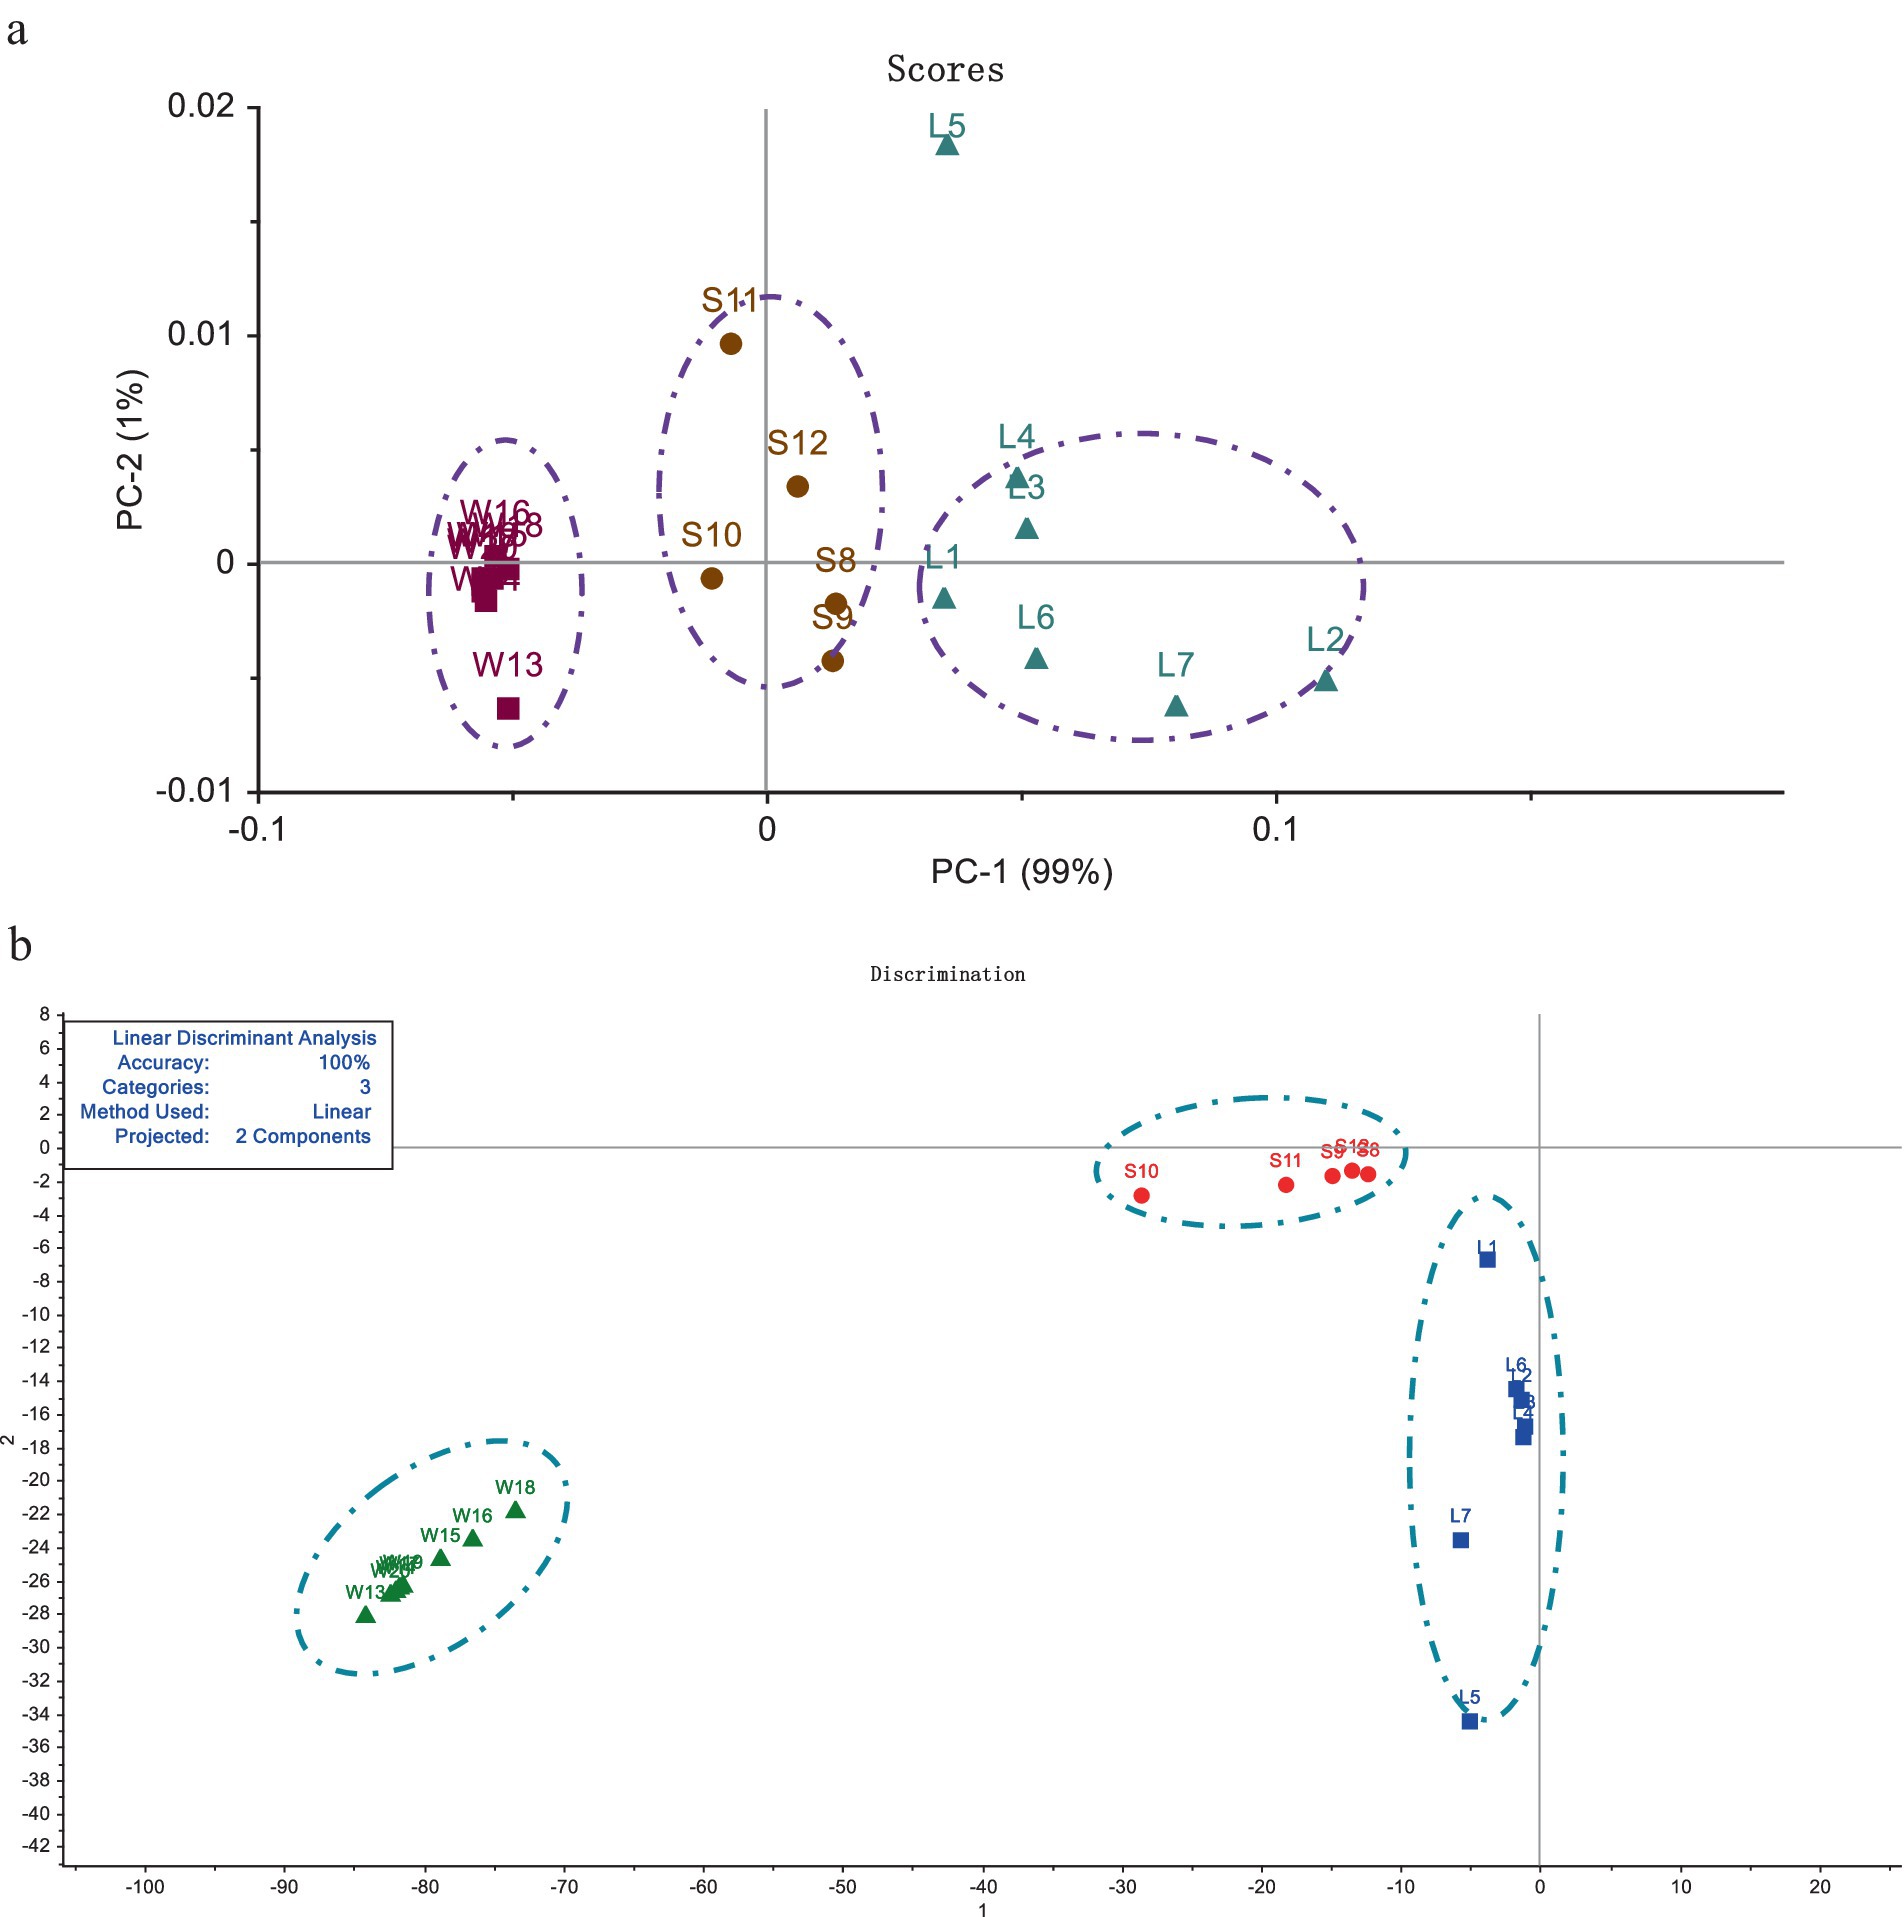
Figure 4. Analysis of Ganoderma acid A and Ganoderma acid D among different origins by PCA and LDA methods. (a) The result of PCA analysis. (b) The result of LDA distribution.
3.3 Correlation analysis of triterpenoid acids and sensory properties of G. lucidum
The correlation between the sensory properties of G. lucidum by electronic tongue and the content of 2 key triterpenoids by HPLC was analyzed by PLSR. Multi-independent and multi-dependent variable analysis was conducted with the flavor characteristic data as X variables and the contents of Ganoderic acid A and Ganoderic acid D as Y variables, and the results were shown in Figure 5. Figure 5a was the comparison chart of PLSR model prediction. Four indexes including Slope, Offset, RMSE and R-Square were used to evaluate the performance of the model. Generally, the smaller of the Offset and RMSE and the closer distance of the Slope and R-Square to 1, the better the prediction effect of the model (26). In this model, blue was the correction set and red was the verification set. Slope and R-Square were greater than 0.80, Offset and RMSE are close to zero, sample points were scattered around the straight line as y = x. The less fluctuation range between predicted and measured values declared that the model has high prognosis accuracy.
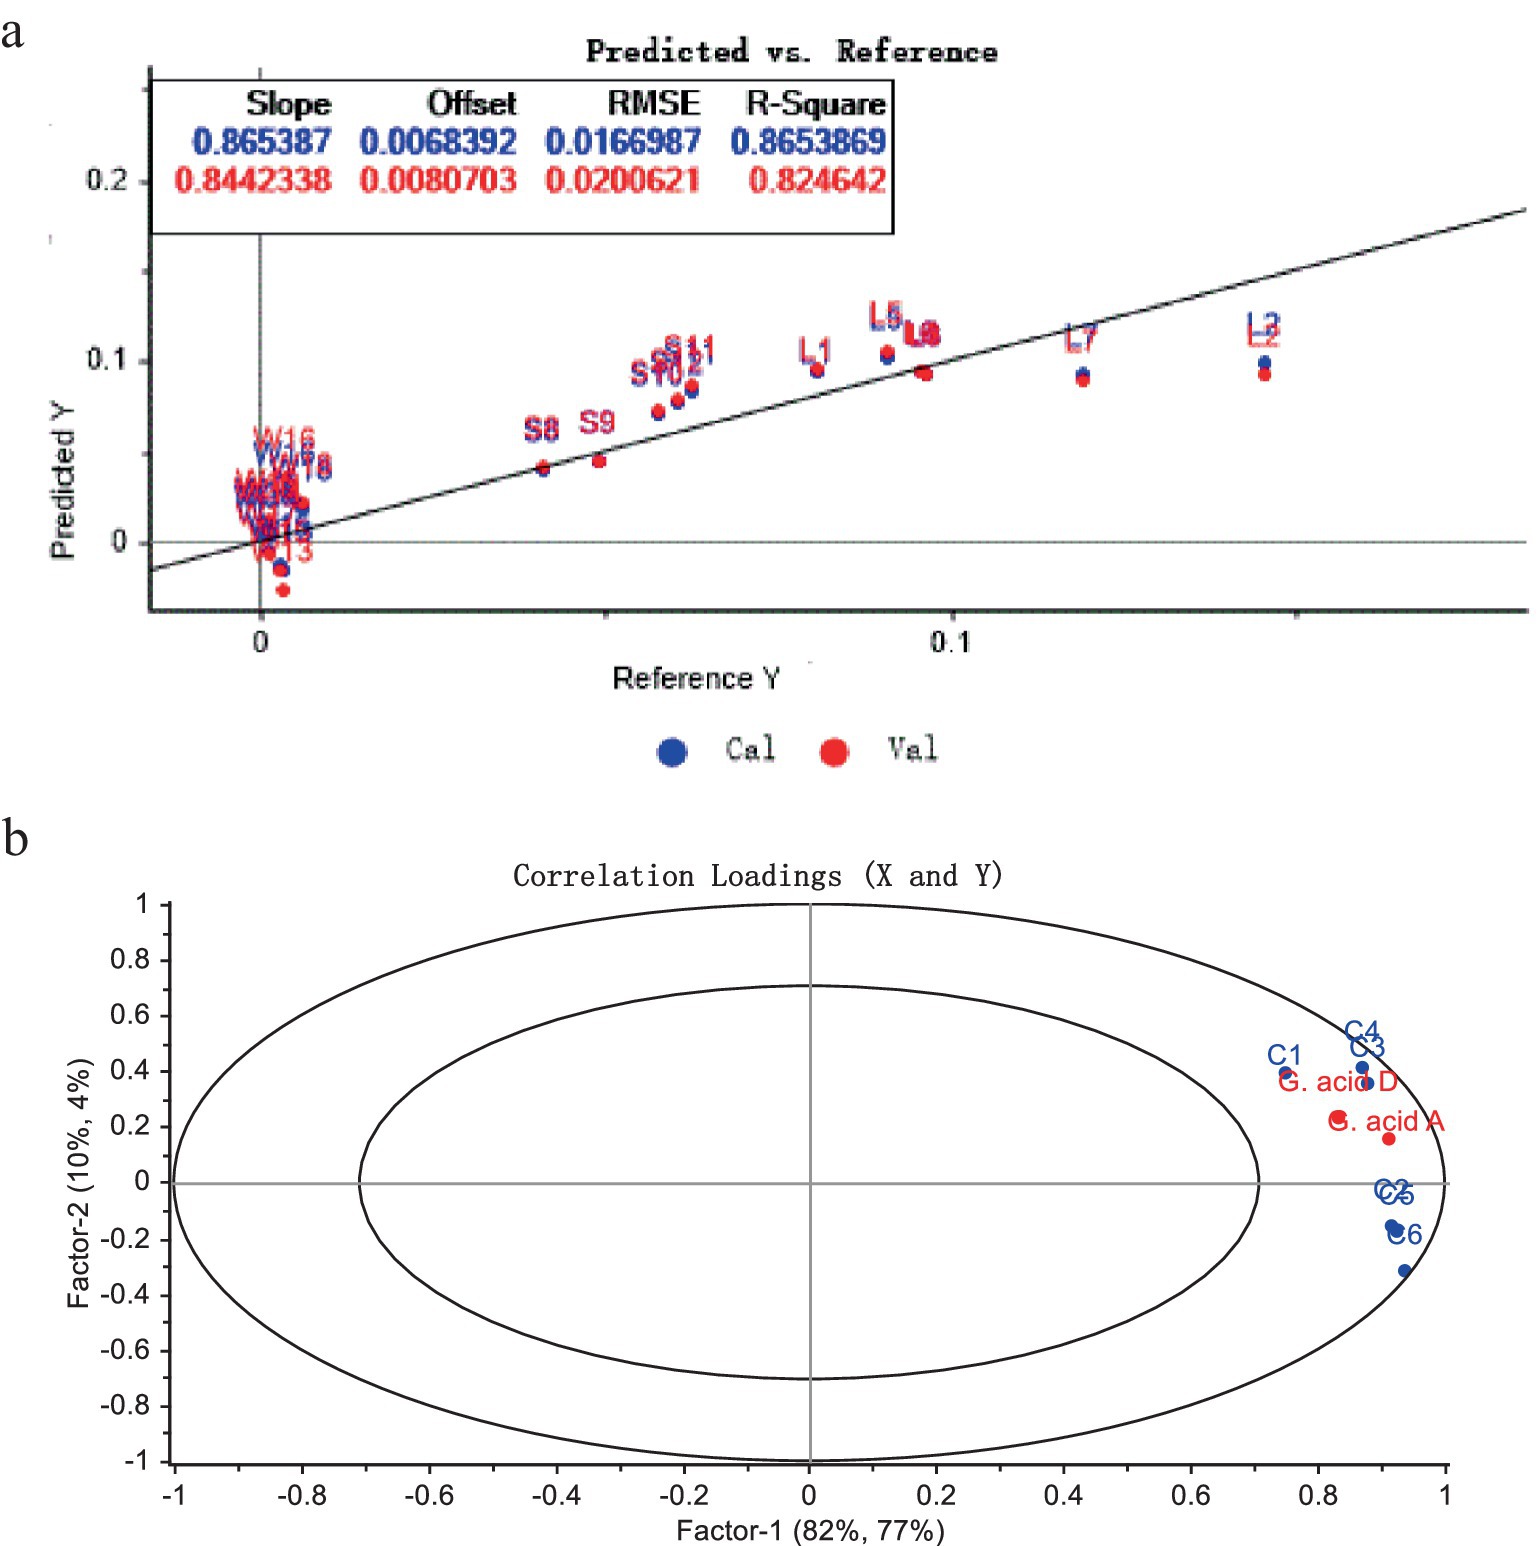
Figure 5. PLSR correlation analysis of Ganodermic acid A and D with sensory quality characteristics of G. lucidum. (a) Linear graph of model predicted value vs reference data. (b) Related load distribution diagram.
The correlation load diagram between the triterpenoid components of G. lucidum and their sensory characteristics of taste were shown in Figure 5b. The two principal components (Factor-1 and Factor-2) of the established PLSR regression model explained 95% of the cross-validation variance, expressing that the model could successfully reflect the overall information of G. lucidum samples. The two ellipses in the figure ertr R2 = 0.5 (small ellipse) and R2 = 1.0 (large ellipse), respectively, representing 50 and 100% interpretation variance (27). In Figure 5b, all variables fell between two ellipses, indicated that these variables could be commendably guided by the PLSR mold. Ganoderic acid A, Ganoderic acid D and 6 electronic tongue sensors were located on the starboard of the biplot, illustrated that Ganoderic acid A, Ganoderic acid D were strikingly positively correlated with the six sensor indicators. The results declared that Ganoderma A and Ganoderma D might proffer much to the taste of G. lucidum. This results also supported that, the electronic tongue technology could preferably identify the taste character of G. lucidum, and could be one rapid method for the origin identification and quality control of G. lucidum.
4 Discussion
The Electronic tongue test results combined with PCA and LDA analysis for origin identification of G. lucidum were basically consistent with the HPLC. All the samples were clustered into 3 categories according origins without overlap. And that results displayed that the taste of different batches of G. lucidum in the same origin was similar, and the difference of G. lucidum in different origin was obvious. The overall taste of G. lucidum produced in Anhui Province is obviously different from that in Shandong Province and Sichuan Province. According to the results of Ganoderic acid A and Ganoderic acid D in G. lucidum by using HPLC, G. lucidum in the three provinces had obviously difference in content of Ganoderic acid ingredients. This might be closely linked with many factors such as genetic characteristics, growth and development stage, temperature, medium and geographical and climatic conditions of G. lucidum (28). Within the two key components of G. lucidum, the content of Ganoderic acid A was generally higher than that of Ganoderic acid D, which was consistent with the analysis results of the triterpenoid content of G. lucidum by HPIC method by Liu et al. (29). Moreover, results of sensory properties presented by Electronic tongue with PLSR were also closely associated with the triterpenoid acids results by HPLC. The absolute coefficients R2 of the correction set and validation set were 0.8654 and 0.8246 respectively, showing a relatively good linear relationship and significant positive correlation. This reflected the Electronic tongue could be used for the quality control of this product, to a certain extent.
Based on the results by Electronic tongue, the overall taste of G. lucidum from different origins were relatively different, especially from Anhui. Similar results were get based on the HPLC. The distribution map based on the content of G. lucidum triterpenoid acids showed the close distance between the samples from Sichuan and Shandong, but relative far between Anhui and the other two producing areas. Specifically, the contents of two triterpenoid acids in G. lucidum were the highest in Shandong province (1.04 mg/g), followed by Sichuan province and Anhui province. Within the two triterpenoids among samples from the 3 provinces, the difference of Ganoderic acid A in G. lucidum were much marked than that of Ganoderic acid D. In addition, the content of Ganoderma A in the G. lucidum was generally higher than that of Ganoderma D, which was consistent with the research by Liu et al. (29) by using HPIC method.
5 Conclusion
In summary, it was feasible to quickly determine G. lucidum from different regions based on Electronic tongue technology and HPLC method. Both the methods could quickly and effectively determine the Ganoderma A and Ganoderma D of G. lucidum. The electronic tongue technology could easily and quickly distinguish the flavor characteristics of G. lucidum from different sources, and provided new technical support for its origin identification and flavor research, and supply the theoretical support for the development of G. lucidum and related products.
Data availability statement
The raw data supporting the conclusions of this article will be made available by the authors, without undue reservation.
Author contributions
JT: Conceptualization, Data curation, Methodology, Writing – original draft. JW: Writing – original draft, Formal analysis, Funding acquisition, Investigation, Resources. YL: Supervision, Writing – review & editing, Data curation, Validation. CL: Supervision, Writing – review & editing, Funding acquisition, Software, Visualization. CM: Project administration, Supervision, Writing – review & editing, Conceptualization, Investigation. WK: Conceptualization, Funding acquisition, Resources, Writing – review & editing.
Funding
The author(s) declare that financial support was received for the research, authorship, and/or publication of this article. This work was supported by Key R&D Project of Henan Province (221111110600 and 231100310200) and Science and Technology Breakthrough Project of Henan Province (232102110156).
Conflict of interest
The authors declare that the research was conducted in the absence of any commercial or financial relationships that could be construed as a potential conflict of interest.
Publisher’s note
All claims expressed in this article are solely those of the authors and do not necessarily represent those of their affiliated organizations, or those of the publisher, the editors and the reviewers. Any product that may be evaluated in this article, or claim that may be made by its manufacturer, is not guaranteed or endorsed by the publisher.
References
1. Wu, S, Zhang, S, Peng, B, Tan, D, Wu, M, Wei, J, et al. Ganoderma lucidum: a comprehensive review of phytochemistry, efficacy, safety and clinical study. Food Sci Human Wellness. (2024) 13:568–96. doi: 10.26599/FSHW.2022.9250051
2. Sheng, F, Wang, SS, Luo, X, Xiao, J, Hu, L, and Li, P. Simultaneous determination of ten nucleosides and bases in Ganoderma by micellar electrokinetic chromatography. Food Sci Human Wellness. (2022) 11:263–8. doi: 10.1016/j.fshw.2021.11.015
3. Wu, M, Shen, C-E, Lin, Q-F, Zhong, JY, Zhou, YF, Liu, BC, et al. Sterols and triterpenoids from Ganoderma lucidum and their reversal activities of tumor multidrug resistance. Nat Prod Res. (2022) 36:1396–9. doi: 10.1080/14786419.2021.1878514
4. Faruque, AM. Ganoderma lucidum: persuasive biologically active constituents and their health endorsement. Biomed Pharmacother. (2018) 107:507–19. doi: 10.1016/j.biopha.2018.08.036
5. Fan, Y, Wang, W, Wang, X, Yu, L, Wei, Y, Wei, L, et al. Ganoderma lucidum polysaccharide inhibits LPS-induced inflammatory injury to mammary epithelial cells. J Future Foods. (2023) 3:49–54. doi: 10.1016/j.jfutfo.2022.09.008
6. Li, Y, Feng, Y, Shang, Y, Xu, H, Xia, R, Hou, Z, et al. Sexual spores in edible mushroom: bioactive components, discharge mechanisms and effects on fruiting bodies quality. Food Sci Human Wellness. (2023) 12:2111–23. doi: 10.1016/j.fshw.2023.03.014
7. Guo, M, Zhang, K, Zhang, D, Zhou, Y, Liu, L, Wu, Y, et al. Ganoderma atrum polysaccharide relieves mitochondrial dysfunction to alleviate hydrogen peroxide-induced senescence via activating autophagy. J Future Foods. (2022) 2:241–52. doi: 10.1016/j.jfutfo.2022.06.005
8. Batra, P, Sharma, AK, and Khajuria, R. Probing Lingzhi or Reishi medicinal mushroom Ganoderma lucidum (higher Basidiomycetes): a bitter mushroom with amazing health benefits. Int J Med Mushrooms. (2013) 15:127–43. doi: 10.1615/intjmedmushr.v15.i2.20
9. Li, C, Cui, Y, Lu, J, Meng, L, Ma, C, Liu, Z, et al. Spectrum-effect relationship of immunologic activity of Ganoderma lucidum by UPLC-MS/MS and component knock-out method. Food Sci Human Wellness. (2021) 10:278–88. doi: 10.1016/j.fshw.2021.02.019
10. das, A, Alshareef, M, Henderson, F, Martinez Santos, JL, Vandergrift, WA III, Lindhorst, SM, et al. Ganoderic acid a/DM-induced NDRG2 over-expression suppresses high-grade meningioma growth. Clin Transl Oncol. (2020) 22:1138–45. doi: 10.1007/s12094-019-02240-6
11. Wang, T, and Lu, H. Ganoderic acid A inhibits ox-LDL-induced THP-1-derived macrophage inflammation and lipid deposition via Notch 1/PPARγ/CD36 signaling. Adv Clin Exp Med. (2021) 30:1031–41. doi: 10.17219/acem/137914
12. Bao, H, Li, H, Jia, Y, Xiao, Y, Luo, S, Zhang, D, et al. Ganoderic acid a exerted antidepressant-like action through FXR modulated NLRP3 inflammasome and synaptic activity. Biochem Pharmacol. (2021) 188:114561. doi: 10.1016/j.bcp.2021.114561
13. Liu, F, Shi, K, Dong, J, Jin, Z, Wu, Y, Cai, Y, et al. Ganoderic acid a attenuates high-fat-diet-induced liver injury in rats by regulating the lipid oxidation and liver inflammation. Arch Pharm Res. (2020) 43:744–54. doi: 10.1007/s12272-020-01256-9
14. Wu, W, Song, K, Chen, G, Liu, N, and Cao, T. Ganoderic acid a improves osteoarthritis by regulating RANKL/OPG ratio. Chem Biol Drug Des. (2022) 100:313–9. doi: 10.1111/cbdd.14101
15. Jia, Y, Zhang, D, Li, H, Luo, S, Xiao, Y, Han, L, et al. Activation of FXR by Ganoderic acid a promotes remyelination in multiple sclerosis via anti-inflammation and regeneration mechanism. Biochem Pharmacol. (2021) 185:114422. doi: 10.1016/j.bcp.2021.114422
16. Yuan, H, Xu, Y, Luo, Y, Zhang, JR, Zhu, XX, and Xiao, JH. Ganoderic acid D prevents oxidative stress-induced senescence by targeting 14-3-3ε to activate CaM/CaMKII/NRF2 signaling pathway in mesenchymal stem cells. Aging Cell. (2022) 21:e13686. doi: 10.1111/acel.13686
17. Shao, C, Zhou, X, Zheng, X, and Huang, Q. Ganoderic acid D induces synergistic autophagic cell death except for apoptosis in ESCC cells. J Ethnopharmacol. (2020) 262:113213. doi: 10.1016/j.jep.2020.113213
18. Chen, Y, Xu, L, Wang, H, Li, Z, Zhou, M, Chen, R, et al. Study on identification technology of Lysimachia christinae and its local common articles and mixed articles based on HPLC fingerprint. Chin Tradit Herb Drug. (2022) 53:4504–11. doi: 10.7501/j.issn.0253-2670.2022.14.029
19. In Seo, J, Yu, JS, Lee, EK, Park, KB, and Yoo, HH. Molecular networking-guided strategy for the pharmacokinetic study of herbal medicines: cudrania tricuspidata leaf extracts. Biomed Pharmacother. (2022) 149:112895. doi: 10.1016/j.biopha.2022.112895
20. Liang, D, Wang, F, Wei, Y, Li, X, Lu, Y, and Tang, G. Simultaneous determination of changes in six active ingredients in Schizophyllum communeh fermented tea by HPLC. Food Ferment Ind. (2020) 46:234–8. doi: 10.13995/j.cnki.11-1802/ts.022589
21. Gao, J, Nakamura, N, Min, B-S, Hirakawa, A, Zuo, F, and Hattori, M. Quantitative determination of bitter principles in specimens of Ganoderma lucidum using high-performance liquid chromatography and its application to the evaluation of Ganoderma products. Chem Pharm Bull. (2004) 52:688–95. doi: 10.1248/cpb.52.688
22. Chai, C, Cao, Y, Mao, M, Wang, JY, Liu, N, Li, XX, et al. Evaluation of taste changes of Scutellariae Radix before and after wine-frying based on electronic ongue technology and its application in identification of Scutellariae Radix pieces. China J Chin. Materia Medica. (2020) 45:2552–9. doi: 10.19540/j.cnki.cjcmm.20200328.303
23. Liu, K, Xie, L, Deng, M, Zhang, X, Luo, J, and Li, X. Zoology, chemical composition, pharmacology, quality control and future perspective of musk (Moschus): a review. Chin Med. (2021) 16:46. doi: 10.1186/s13020-021-00457-8
24. Schlossareck, C, and Ross, CF. Electronic tongue and consumer sensory evaluation of spicy paneer cheese. J Food Sci. (2019) 84:1563–9. doi: 10.1111/1750-3841.14604
25. Zabadaj, M, Ufnalska, I, Chreptowicz, K, Mierzejewska, J, Wróblewski, W, and Ciosek-Skibińska, P. Performance of hybrid electronic tongue and HPLC coupled with chemometric analysis for the monitoring of yeast biotransformation. Chemom Intell Lab Syst. (2017) 167:69–77. doi: 10.1016/j.chemolab.2017.05.003
26. Ma, X, Zhou, K, Wang, J, Cui, S, Zhou, S, Wang, S, et al. Optimal bandwidth selection for retrieving cu content in rock based on hyperspectral remote sensing. J Arid Land. (2022) 14:102–14. doi: 10.1007/s40333-022-0050-8
27. Ma, X, Zhan, P, Tian, H, Wei, Z, and Li, K. Effects of mutton tallow subjected to different treatments on aroma compounds generated from thermal reaction systems as evaluated by gas chromatography-mass spectrometry, descriptive sensory analysis and partial least squares regression. Food Sci. (2020) 41:194–201. doi: 10.7506/spkx1002-6630-20190528-341
28. Lu, J, Qin, J, Chen, P, Chen, X, Zhang, Y, and Zhao, S. Study on the quality differences of Ganoderma lucidum from six different sources. Inf Tradit Chin Med. (2012) 29:17–20. doi: 10.3969/j.issn.1002-2406.2012.02.007
29. Liu, W, Zhang, J, Han, W, Liu, Y, Feng, J, Tang, C, et al. One single standard substance for the simultaneous determination of 17 triterpenes in Ganoderma lingzhi and its related species using high-performance liquid chromatography. J Chromatogr B. (2017) 1068-1069:49–55. doi: 10.1016/j.jchromb.2017.10.010
Keywords: Ganoderma lucidum , Electronic tongue, HPLC, triterpenes, origins
Citation: Tian J, Wei J, Liu Y, Li C, Ma C and Kang W (2024) Application of Electronic tongue and HPLC in rapid determination of functional triterpenes and origins of Ganoderma lucidum. Front. Nutr. 11:1446956. doi: 10.3389/fnut.2024.1446956
Edited by:
Luca Rastrelli, University of Salerno, ItalyReviewed by:
Qin He, Nanjing Agricultural University, ChinaYa-Fang Shang, Hefei University of Technology, China
Copyright © 2024 Tian, Wei, Liu, Li, Ma and Kang. This is an open-access article distributed under the terms of the Creative Commons Attribution License (CC BY). The use, distribution or reproduction in other forums is permitted, provided the original author(s) and the copyright owner(s) are credited and that the original publication in this journal is cited, in accordance with accepted academic practice. No use, distribution or reproduction is permitted which does not comply with these terms.
*Correspondence: Changyang Ma, bWFjYXlhMTAyNEB2aXAuaGVudS5lZHUuY24=; Changqin Li, bGNxQHZpcC5oZW51LmVkdS5jbg==
†These authors have contributed equally to this work and share first authorship