 Taotao Liu
 Miao Yu
- Institute of Chinese Materia Medica, China Academy of Chinese Medical Sciences, Beijing, China
Introduction: Rhubarb is a popular food that relieves constipation and aids with weight loss. The traditional method of preparation, includes steaming and sun-drying rhubarb nine times (SDR-9) to reduce its toxicity and increase efficacy.
Methods: Flavor analysis includes odor analysis by gas chromatography–ion mobility spectrometry and taste characterization using an electronic tongue.
Results: Odor analysis of the samples prepared through SDR-9 identified 61 volatile compounds, including aldehydes, esters, alcohols, ketones, acids, alkenes, and furans. Of these, 13 volatile components were the key substances associated with odor. This enabled the process to be divided into two stages: 1–5 times of steaming and sun-drying and 6–9 times. In the second stage, SDR-6 and SDR-9 were grouped together in terms of odor. Analysis using electronic tongue revealed that the most prominent taste was bitterness. A radar map indicated that the bitterness response was the highest for raw rhubarb, whereas that for processed (steamed and sun-dried) rhubarb decreased. Orthogonal partial least squares discriminant analysis (OPLS-DA) clustering results for SDR-6 and SDR-9 samples indicated that their tastes were similar. Anthraquinones were analyzed via high-performance liquid chromatography; moreover, analysis of the taste and components of the SDR samples revealed a significant correlation.
Discussion: These results indicate that there are similarities between SDR-6 and SDR-9 in terms of smell, taste, and composition, indicating that the steaming and sun-drying cycles can be conducted six times instead of nine.
1 Introduction
Rhubarb (Rhei Radix et Rhizoma), including Rheum palmatum L., Rheum tanguticum Maxim. ex Balf, and Rheum officinale Baill., has a long history of use as a conventional Chinese medicine worldwide (1). It has a variety of pharmacological properties, including antibacterial, anti-inflammatory, antitumor, hepatoprotective, renoprotective, immunoregulatory, free radical scavenging, purgative, and cardiovascular protective properties (2). Rhubarb can be used clinically to treat obesity as it inhibits proinflammatory signaling pathways and modulates glucose–lipid homeostasis (3). Rhein, a crucial component of rhubarb, can inhibit obesity caused by a high-fat diet, decrease fat mass, and reduce the size of white and brown adipocytes. It can also lower the levels of serum cholesterol, low-density lipoprotein cholesterol, and fasting blood glucose in mice (4). Aloe-emodin, emodin, chrysophanol, and physcion in rhubarb are other important chemicals that promote weight loss (5). Europeans and Americans have regarded edible rhubarb as a palatable food since the 19th century (6); however, long-term consumption of raw and processed rhubarb increases the risk of melanosis coli and liver and kidney damage, which are primarily attributed to anthraquinones (7, 8). Compared with raw rhubarb, the processed version has relatively fewer side effects and rarely causes diarrhea (9).
In China, rhubarb is commonly used after processing. Four processes have been recorded in the Chinese Pharmacopeia, which include cleaning, roasting with wine, steaming, and charcoal frying to obtain raw rhubarb, roasted rhubarb with wine, steamed rhubarb with wine, and carbonized rhubarb, respectively (10). Different methods are used throughout the world for various purposes (11). Steaming and sun-drying nine times is one characteristic method of processing Chinese Materia Medica and is commonly used to increase the activity of most traditional Chinese medicines and reduce or avoid side effects. The long-term consumption of raw rhubarb can damage renal function in rats; however, processed rhubarb reduces the risk of renal injury (9). Forty-three traditional Chinese medicines, including rhubarb, are steamed and dried several times, as described in the ancient medical literature (12). Overall, the process of steaming and sun-drying nine times yields good clinical effects and is worthy of further study. However, the pharmacological activities and primary active ingredients of rhubarb have been the main focus of most studies (6). There are few studies on the odor and taste of rhubarb processed by steaming and sun-drying nine times. Moreover, the processing period is long and tedious, this traditional Chinese medicine is subject to rot and mildew during exposure to the climate. Therefore, it is necessary to devise a method to simplify the preparation process.
Based on the above findings, after steaming and sun-drying nine times, the odor and taste of rhubarb change to varying degrees, which is a vital indicator for process control and quality evaluation. However, as traditional evaluation methods primarily rely on sensory identification by humans and other subjective analyses, the results are inevitably affected by sensory differences and the detection environment. As a result, ensuring the objectivity and accuracy of the evaluation is an important issue for the quality evaluation of traditional Chinese medicines. Artificial intelligence is rapidly developing, and electronic tongues and noses have become widely available in recent years. As a modern, intelligent, sensory, qualitative analysis, and testing tool, the electronic tongue consists of an interactive and sensitive sensor array and a signal acquisition circuit that is combined with a data processing method based on pattern recognition. An artificial lipid bilayer membrane with unique and wide selectivity of an area can be used to directly output taste values, including sour, sweet, bitter, astringent, fresh, salty, bitter aftertaste, and richness from a sample solution (13). It may be applied to studies of food (14), beverages (15), tea (16), alcohol discrimination (17), and environmental analysis (18). It can detect overall taste, but not the specific compounds involved (19).
In addition to the electronic tongue, gas chromatography–ion mobility spectrometry (GC–IMS) is a novel technique that can be used to identify ions based on differences in the migration rates of various gas-phase ions in an electric field. In the ionization region, gas molecules are converted into charged ions, which then enter a drift tube. Identification and analysis are performed based on the different migration velocities of gaseous ions in the electric field. GC–IMS is a powerful analytical method that combines the simplicity and rapidity of GC with the high-resolution and accurate analysis of IMS. The advantages of this method are its low detection limit, short analysis time, and ease of operation (20). GC–IMS is increasingly being used for analyzing food flavors (21), discriminating traditional medicines (22, 23), and classifying white wines (24).
The flavor index is a traditional method of evaluating the quality of rhubarb. The effective component is not only the common index of rhubarb quality but also the standard component of quality control in Chinese Pharmacopeia. Thus, it can be used as the standard of evaluation. To simplify the process and improve efficiency, the flavor and components of rhubarb prepared by steaming and sun-drying nine times were analyzed using GC–IMS, the electronic tongue, and high-performance liquid chromatography (HPLC).
2 Materials and methods
2.1 Rhubarb processing and sample preparation
Fresh Rheum palmatum L. was cleaned and prepared based on the Chinese Pharmacopeia (2020 edition) (The State Pharmacopeia Committee of the People’s Republic of China, 2020) to obtain raw rhubarb samples (Shengpian in Chinese). Initially, 2.5 kg of Huangjiu was added to 5.0 kg of Shengpian and mixed well until fully absorbed. Using an induction cooker (1800 w), the raw rhubarb was steamed for 4 h, followed by natural sun-drying. A 0.5-kg sample was used in one cycle of steaming and sun-drying (hereinafter referred to as SDR-1); the remaining sample was repeatedly subjected to the same process, with 0.5-kg sample removed after each cycle. A total of nine samples (SDR-1–9) were obtained and each sample was prepared in triplicate. Finally, the samples were powdered using 40-mesh sieve and a grinder.
2.2 GC–IMS analysis
The FlavourSpec flavor analyzer (G.A.S., Dortmund, Germany) uses GC–IMS technology to measure the volatile headspace components. Rhubarb samples (3.0 g) were incubated in a 20-mL headspace vial for 20 min at 60°C. A 200-μL sample was then injected into an MXT-WAX metal capillary GC column (30 m × 0.53 mm; Restek Corporation, the United States) at 85°C with nitrogen (99.99%) as the carrier gas. Flow rates started at 2 mL/min for 2 min and increased to 10 mL/min for 8 min, then to 100 mL/min for 10 min, and finally to 100 mL/min for 20 min. The sample then entered the ion transfer tube. After the molecules were ionized in the ionization region, they migrated to the Faraday disk for detection by an electric field and reverse drift gas to achieve separation. Nitrogen (99.99%) was used as the drift gas with a flow rate of 150 mL/min. The GC–IMS instrument with software (G.A.S.) was used to obtain the three- and two-dimensional spectra, fingerprints, and principal component analysis (PCA) graph.
2.3 Quantitative analysis of anthraquinones
2.3.1 Reagents and materials
The nine reference components are chrysophanol-8-O-β-D-glucoside, emodin-8-O-β-D-glucoside, aloe-emodin-3-(hydroxymethyl)-O-β-D-glucoside, physcion-8-O-β-D-glucoside, aloe-emodin, rhein, emodin, chrysophanol, and physcion (designated A–I), which were purchased from the National Institutes for Food and Drug Control. The purity of all components was greater than 98%. HPLC-grade solutions, methanol, and reagents were purchased from Thermo Fisher Scientific (United States).
2.3.2 Chromatographic conditions
The HPLC system (Waters, United States) consisted of a Waters 2695 Separations Module and Waters 2998 PDA detector. The output signal of the detector was recorded using an Empower 3 workstation. For the separation of the sample, a Roc C18 column (4.6 mm × 250 mm, 5 μm) was used and the UV detection wavelength was set to 280 and 430 nm. The mobile phase consisted of methanol (A) and 0.1% glacial acetic acid (B) with gradient elution (0–5 min, A 54%; 5–15 min, A 54–64%; 15–20 min, A 64–73%; 20–23 min, A 73–83%; 23–26 min, A 83–90%; 26–27 min, A 90–100%; and 27–33 min, A 100%) at a flow rate of 1.0 mL/min. The injection volume was 10 μL and the column temperature was maintained at 35°C.
2.3.3 Preparation of rhubarb test solution
Raw rhubarb (0.5 g) was placed in a cone bottle with a plug and 25 mL of methanol was added. Ultrasonic extraction lasted for 10 min. After cooling, the solution was filtered through a paper filter prior to HPLC analysis. The sample solution was filtered through a 0.22-μm filter.
2.3.4 Preparation of standard solution
Each standard stock solution comprised nine components, including chrysophanol-8-O-β-D-glucoside (0.0164 mg/mL), emodin-8-O-β-D-glucoside (0.0201 mg/mL), aloe-emodin-3-(hydroxymethyl)-O-β-D-glucoside (0.0097 mg/mL), emodin-8-O-β-D-glucoside (0.0142 mg/mL), aloe-emodin (0.0200 mg/mL), rhein (0.0270 mg/mL), emodin (0.0780 mg/mL), chrysophanol (0.0344 mg/mL), and physcion (0.0222 mg/mL), and was prepared by dissolving in methanol. Six different volumes (1, 5, 10, 15, 20, and 25 μL) of the standard solution were used to establish a calibration curve. A working solution was prepared for each standard. The stock solutions were stored at 4°C.
2.4 Electronic tongue analysis
A TS-5000Z electronic tongue (INSET Inc., Japan) was used to analyze the taste characteristics of rhubarb. An artificial lipid membrane sensor in the electronic tongue simulates the taste perception mechanism of living organisms and evaluates taste by detecting changes in membrane potential generated by the interaction between substances and artificial lipid membranes. The five detective sensors include AAE, CT0, CA0, C00, and AE1, which represent umami (richness), saltiness, sourness, bitterness (aftertaste-A), and astringency (aftertaste-B). The first taste and aftertaste corresponding to each sensor and the specific ingredients that impart these tastes are listed in Table 1. Briefly, 100 mL of pure water was added to 1 g of rhubarb and placed in an ultrasonic cleaning machine for 30 min, followed by centrifugation at 3,000 rpm for 5 min. The supernatant was filtered through filter paper, and the filtrate was tested. Each sample was processed three times. Finally, the detection data were transformed into taste values using the electronic tongue software (the Taste Sensing System and Taste Analyzed System applications).
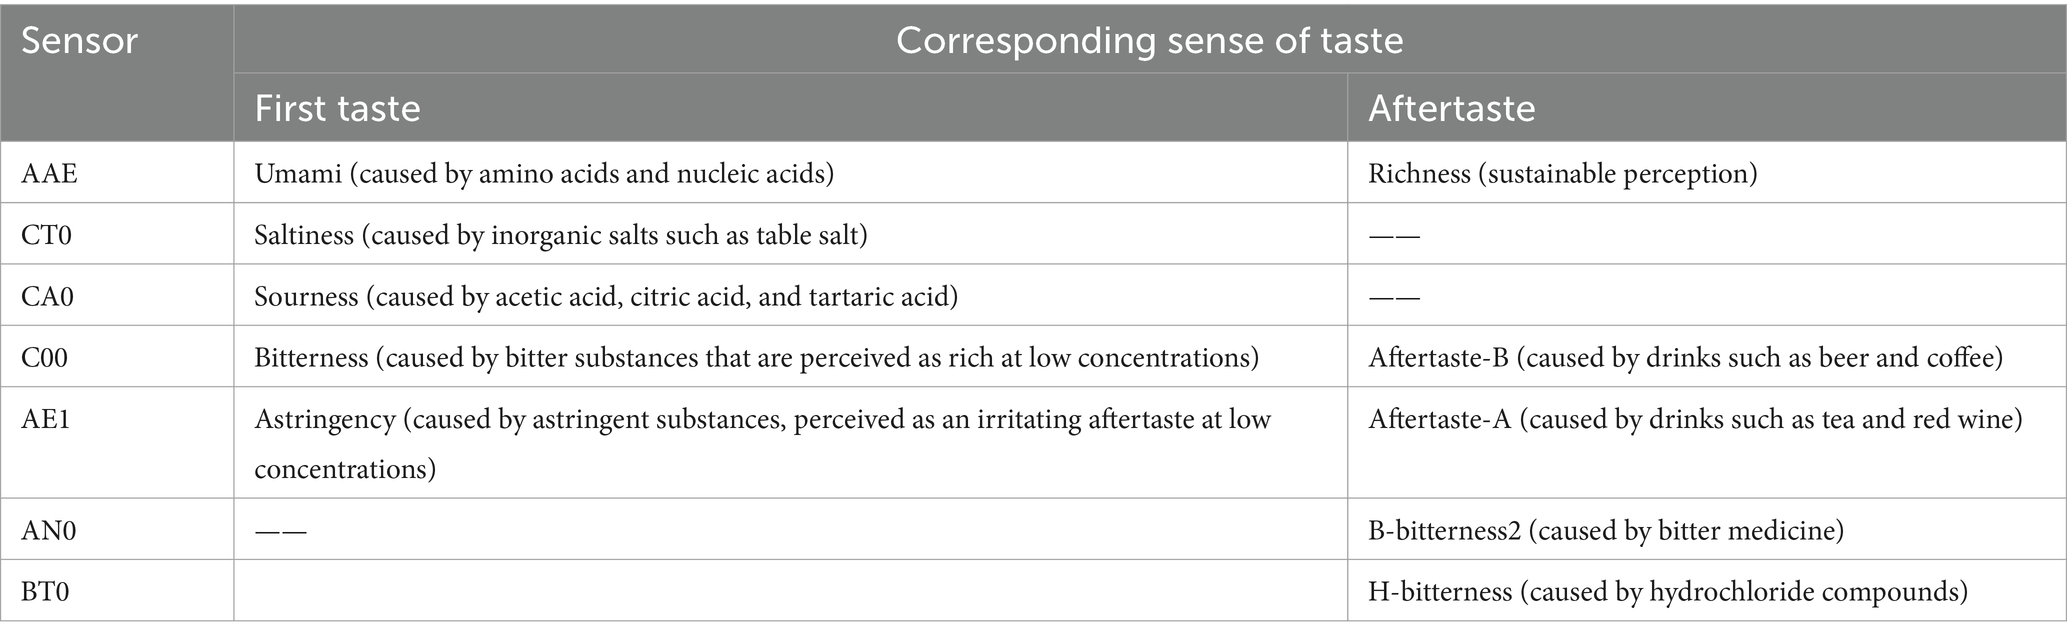
Table 1. First taste and aftertaste corresponding to each sensor and the specific ingredients that impart these tastes.
2.5 Statistical analysis
The VOCal software and three plug-ins supported by GC–IMS were used to analyze the rhubarb samples. The spectrum of qualitative and quantitative analyses and data may be viewed using VOCal software. The three-dimensional spectrum, two-dimensional top view, and difference spectrum were used to directly compare the spectral differences among samples using the Reporter plug-in. The differences in volatile headspace components were compared using the Gallery Plot plug-in visually and quantitatively using fingerprint. GC–IMS was used to detect the peak intensity response value and the Dynamic PCA plug-in was used to analyze the data. A one-way ANOVA for multiple comparisons was performed using GraphPad Prism software (v.6.02, GraphPad Software, San Diego, CA, United States). To determine the correlation of volatile compounds in rhubarb samples for different steaming and sun-drying times, a correction heatmap was generated using the OriginPro 2021 software (v.9.8.0, OriginLab, Northampton, MA, United States). IBM SPSS Statistics software (R26.0.0.0, IBM, United States) was used for Pearson’s correlation analysis. The data obtained from the electronic tongue was analyzed using the Taste Sensing System (v.2.0.0.0, Insent, Japan) and Taste Analyzed System (v.1.0.0.5, Insent) application. Orthogonal partial least squares discriminant analysis (OPLS-DA) of the electronic tongue data was viewed using SIMCA (v.14.1, Umetrics, Sweden).
3 Results
3.1 Odor analysis using GC–IMS
3.1.1 Visual topographic plots of rhubarb samples subjected to different steaming and sun-drying times
The three-dimensional spectrum in Figure 1A presents the differences in the volatile headspace components of the rhubarb samples. The two-dimensional spectrum is presented in Figure 1B. The normalized reaction ion peak occurs at abscissa 1.0, and each point on both sides represents a volatile organic compound. Obvious differences were observed in the volatile organic compounds at different steaming and sun-drying times. SDR-1 was used as the reference sample, and the spectra of the other samples were subtracted from the reference. As indicated in Figure 1C, the background after deduction is white when the two volatile organic compounds (VOCs) are consistent, whereas red and blue backgrounds indicate that the concentrations are higher and lower than those of the reference, respectively. Figure 1C indicates an increase in the content of some volatile components as the number of processing cycles increases. Decreases in the levels of these compounds were also observed.
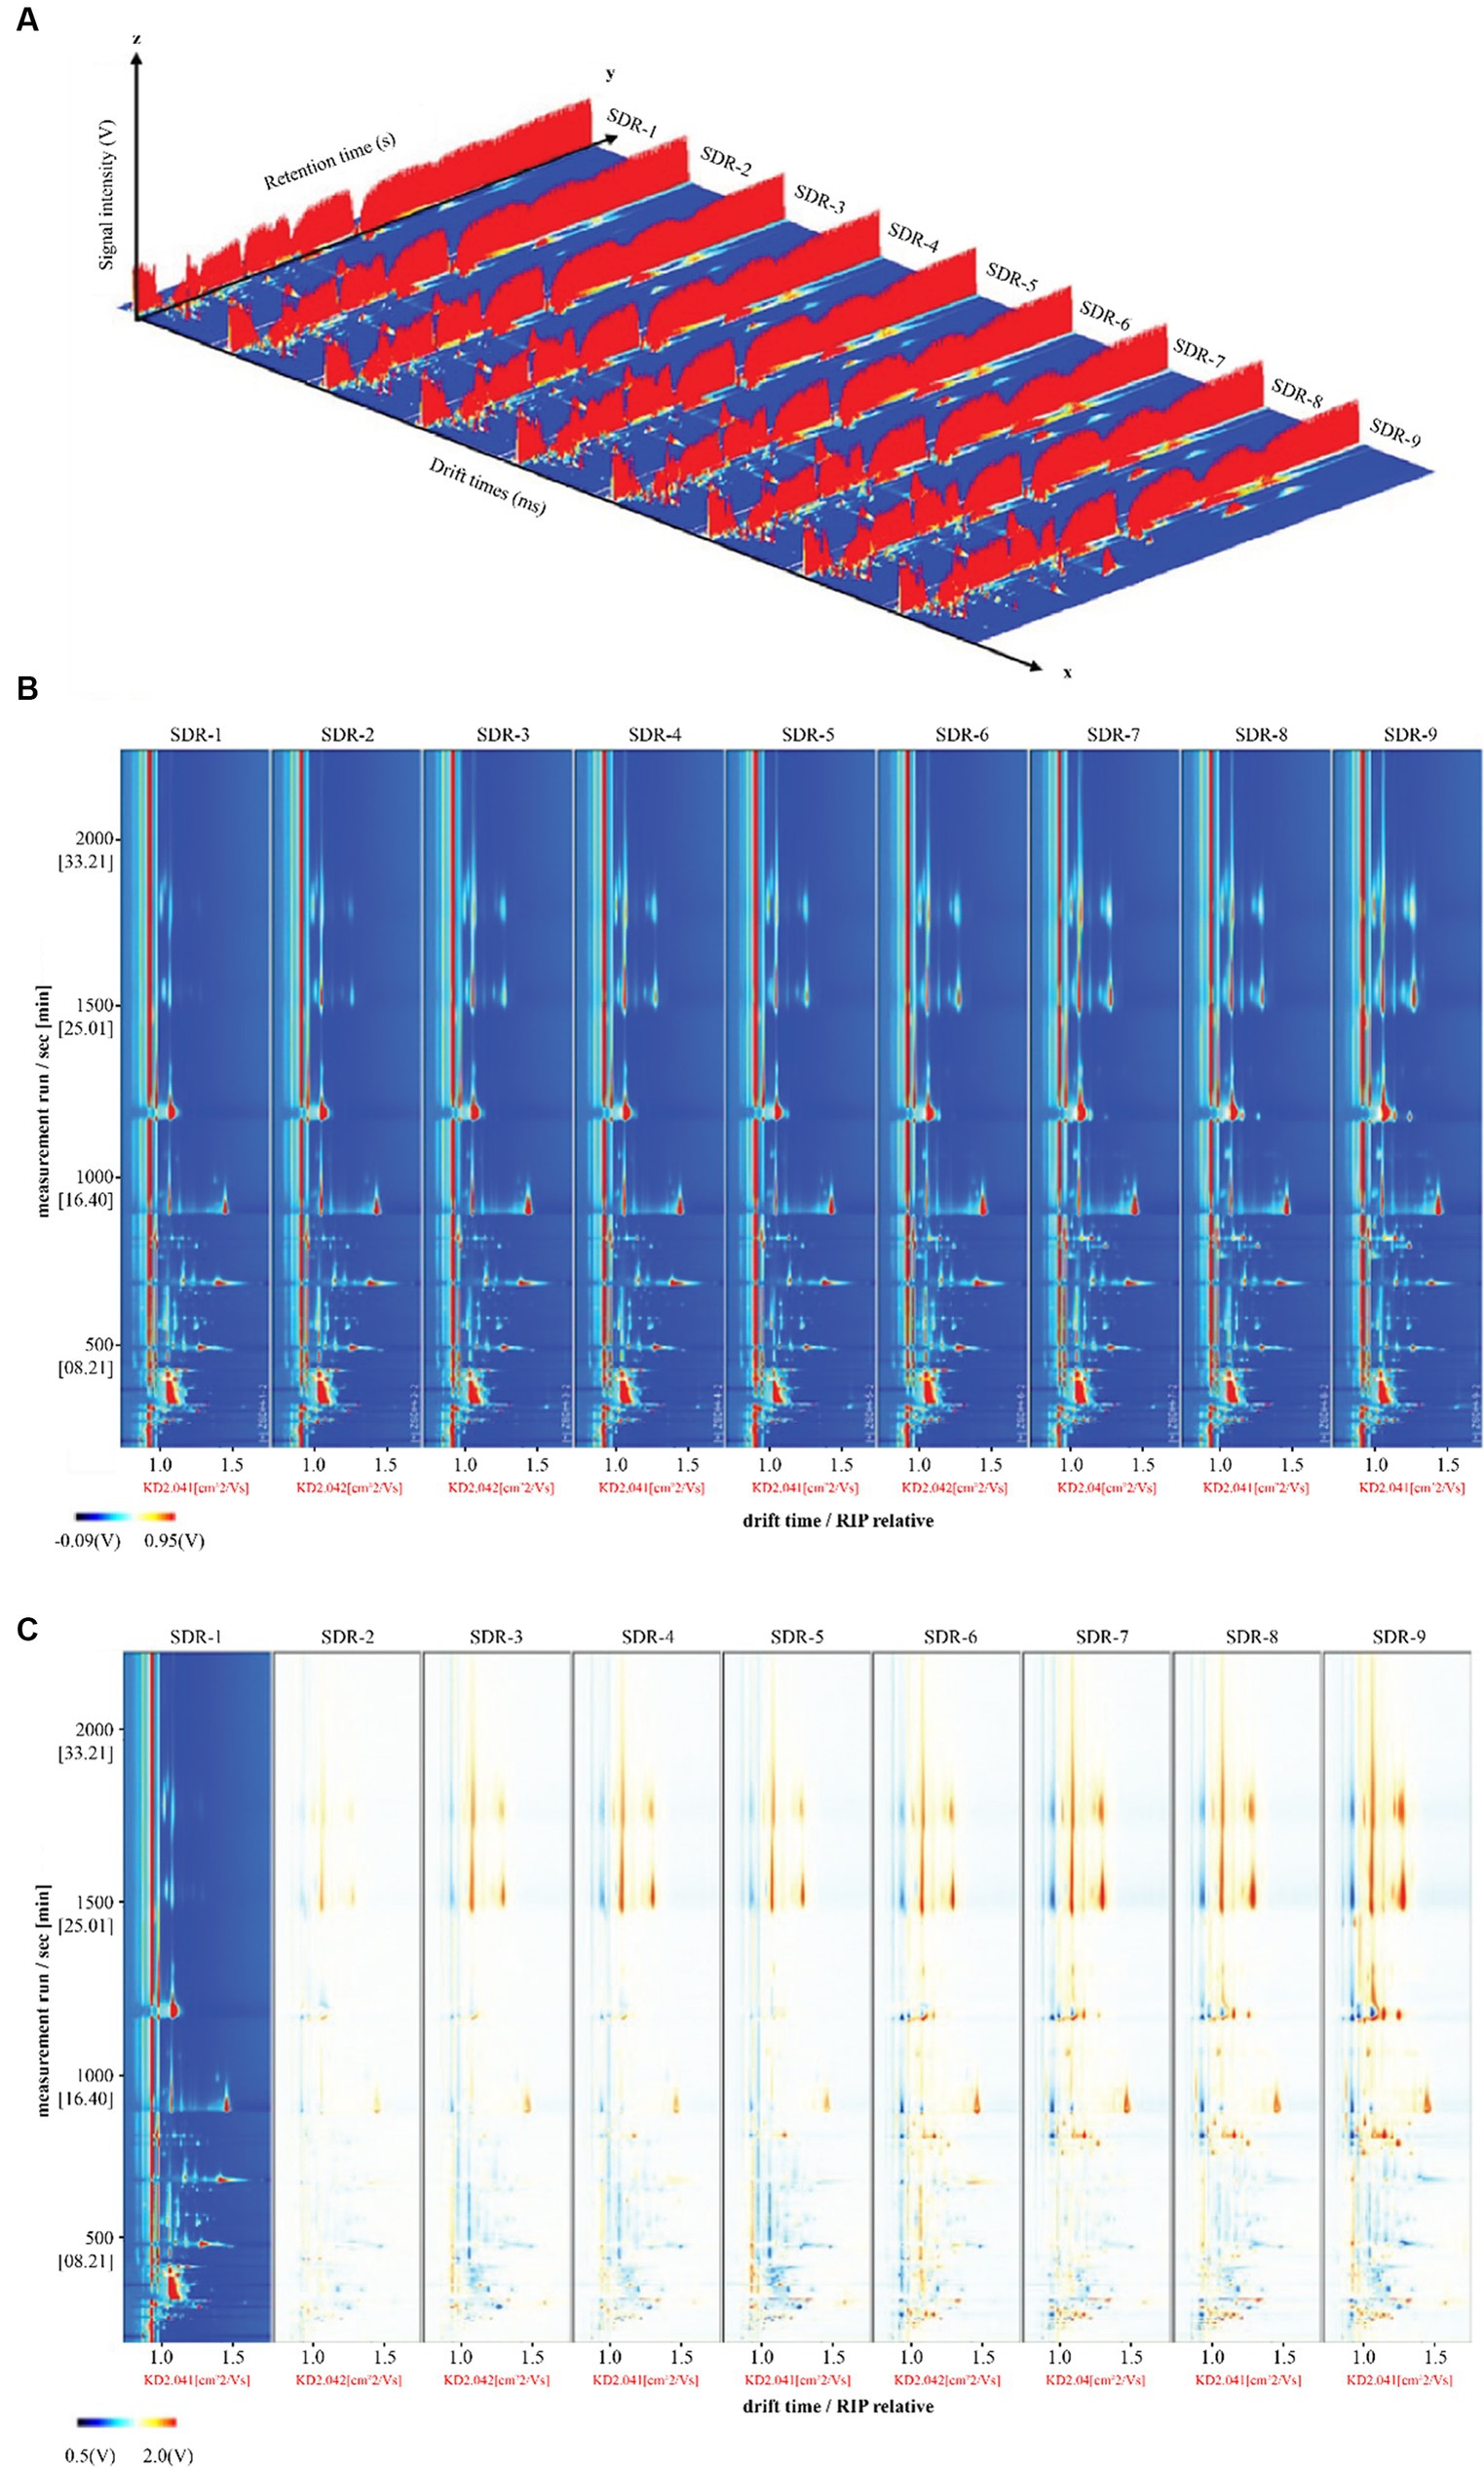
Figure 1. Volatile compounds in rhubarb samples at different steaming and sun-drying times. (A) Three-dimensional topography. (B) Topographic plot of GC–IMS spectra. (C) Comparison of the results from the spectral diagram (SDR-1) with one sample selected as the reference.
3.1.2 Volatile compounds in rhubarb samples subjected to different steaming and sun-drying times
A total of 61 VOCs were identified in the rhubarb samples, including aldehydes, alcohols, ketones, esters, and furans, as previously described (25). Among them, 14 aldehydes, 12 alcohols, 12 ketones, and nine esters were the main VOCs. The details of these VOCs are listed in Table 2.
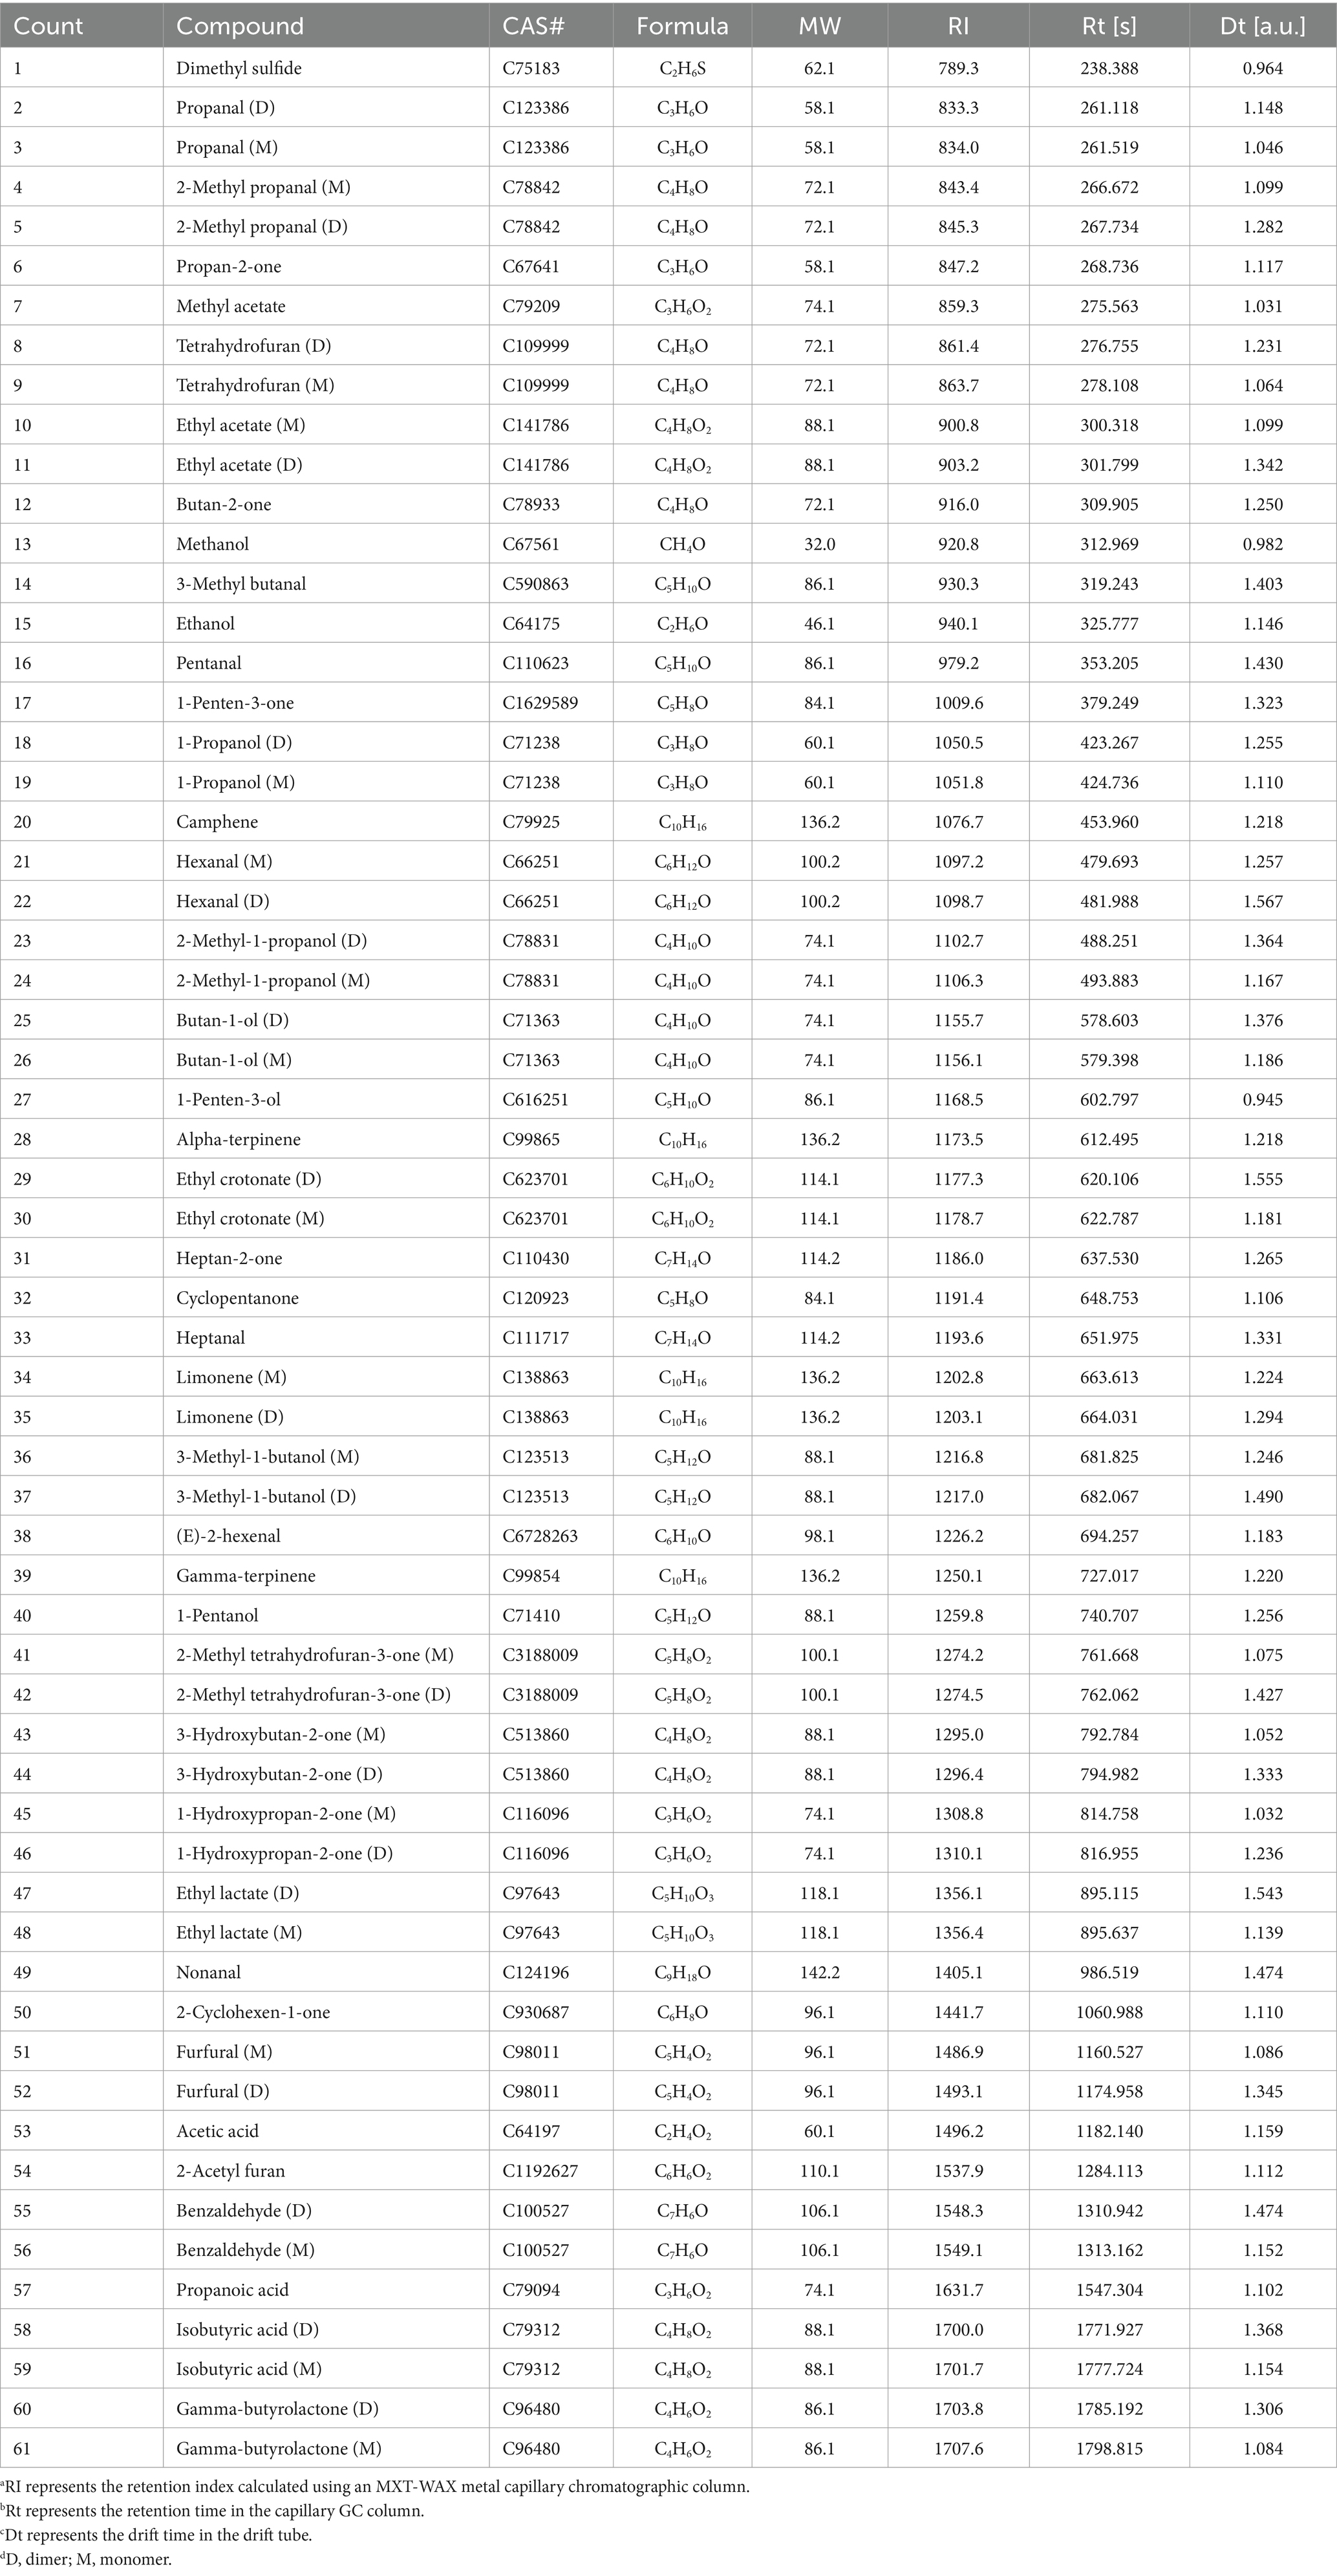
Table 2. Gas chromatography–ion mobility spectrometry global area set integration parameters obtained from the rhubarb samples after different cycles of steaming and sun-drying.
This Maillard reaction, also known as a carbonyl–amino compound reaction, refers to the formation of a dark brown substance because of the rearrangement, dehydration, condensation, and polymerization of carbonyl and amino compounds. Rhubarb contains sugars, amino acids, and polyphenols, which provide conditions for enzymatic browning and facilitate the Maillard reaction during processing (26).
3.2 Complete spectral analysis of rhubarb samples
Complete data on VOCs and their differences among the rhubarb samples are shown in Figure 2. The contents in the areas denoted with yellow, red, and green rectangles significantly increased during steaming and sun-drying. Furfural, 2-acetyl furan, 2-methyl tetrahydrofuran-3-one, 3-hydroxy butan-2-one, and propanal contents in the yellow rectangle were higher in SDR-6–9 than in SDR-1–5, whereas it gradually increased in SDR-6–9. In the red rectangle, tetrahydrofuran, ethyl lactate, and benzaldehyde contents were higher in SDR-6–9 than in SDR-1–5, whereas those in SDR-6–9 were stable. The contents of 2-cyclohexen-1-one, gamma-butyrolactone, isobutyric acid, 1-hydroxy propan-2-one, 3-methyl butanal, and 2-methyl propanal in the green rectangle gradually increased during processing. However, the contents of pentanal, 1-penten-3-one, methyl acetate, heptan-2-one, and cyclopentanone in the orange rectangle significantly decreased during processing. Furthermore, the relative contents of other compounds fluctuated during processing without any significant differences.
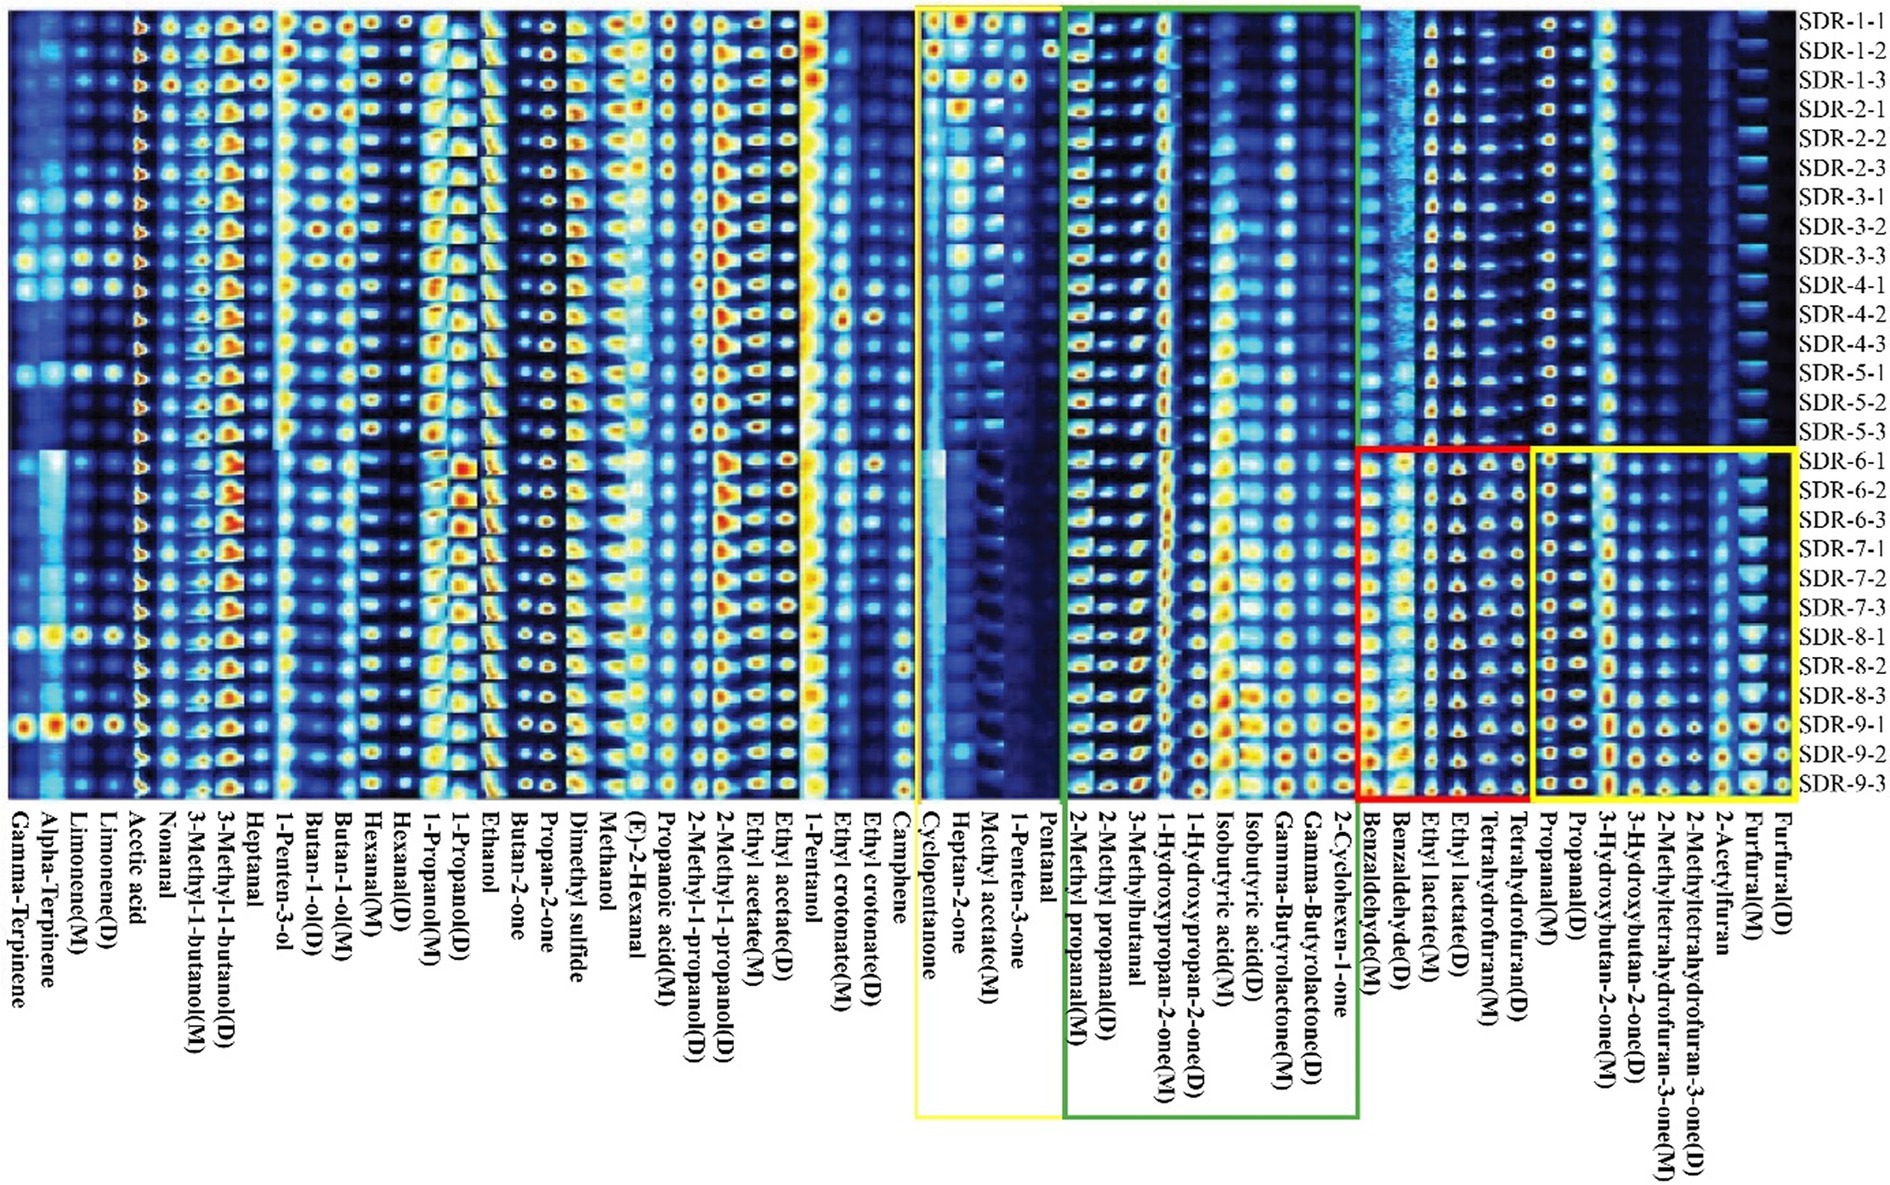
Figure 2. Gallery Plot maps (fingerprints) of the volatile organic compounds in rhubarb samples at different steaming and sun-drying times.
3.3 Cluster analysis of characteristic volatile flavoring compounds in rhubarb samples
The differences in volatile compounds were analyzed using PCA. As shown in Figure 3A, the cumulative variance contribution rate of PC1 (14%) and PC2 (59%) was 73%, indicating that the PCA separation model was effective. The PCA plot indicated that the distance between SDR-1–5 and SDR-6–9 was relatively large, as evidenced by two distinct stages. The distance among SDR-1–5 was relatively close, except for SDR-1, and the differences between the groups were small. The distance interval among SDR-6–9 was similar, and they clustered with one another, indicating little difference in composition; however, each sample could be distinguished from the others.
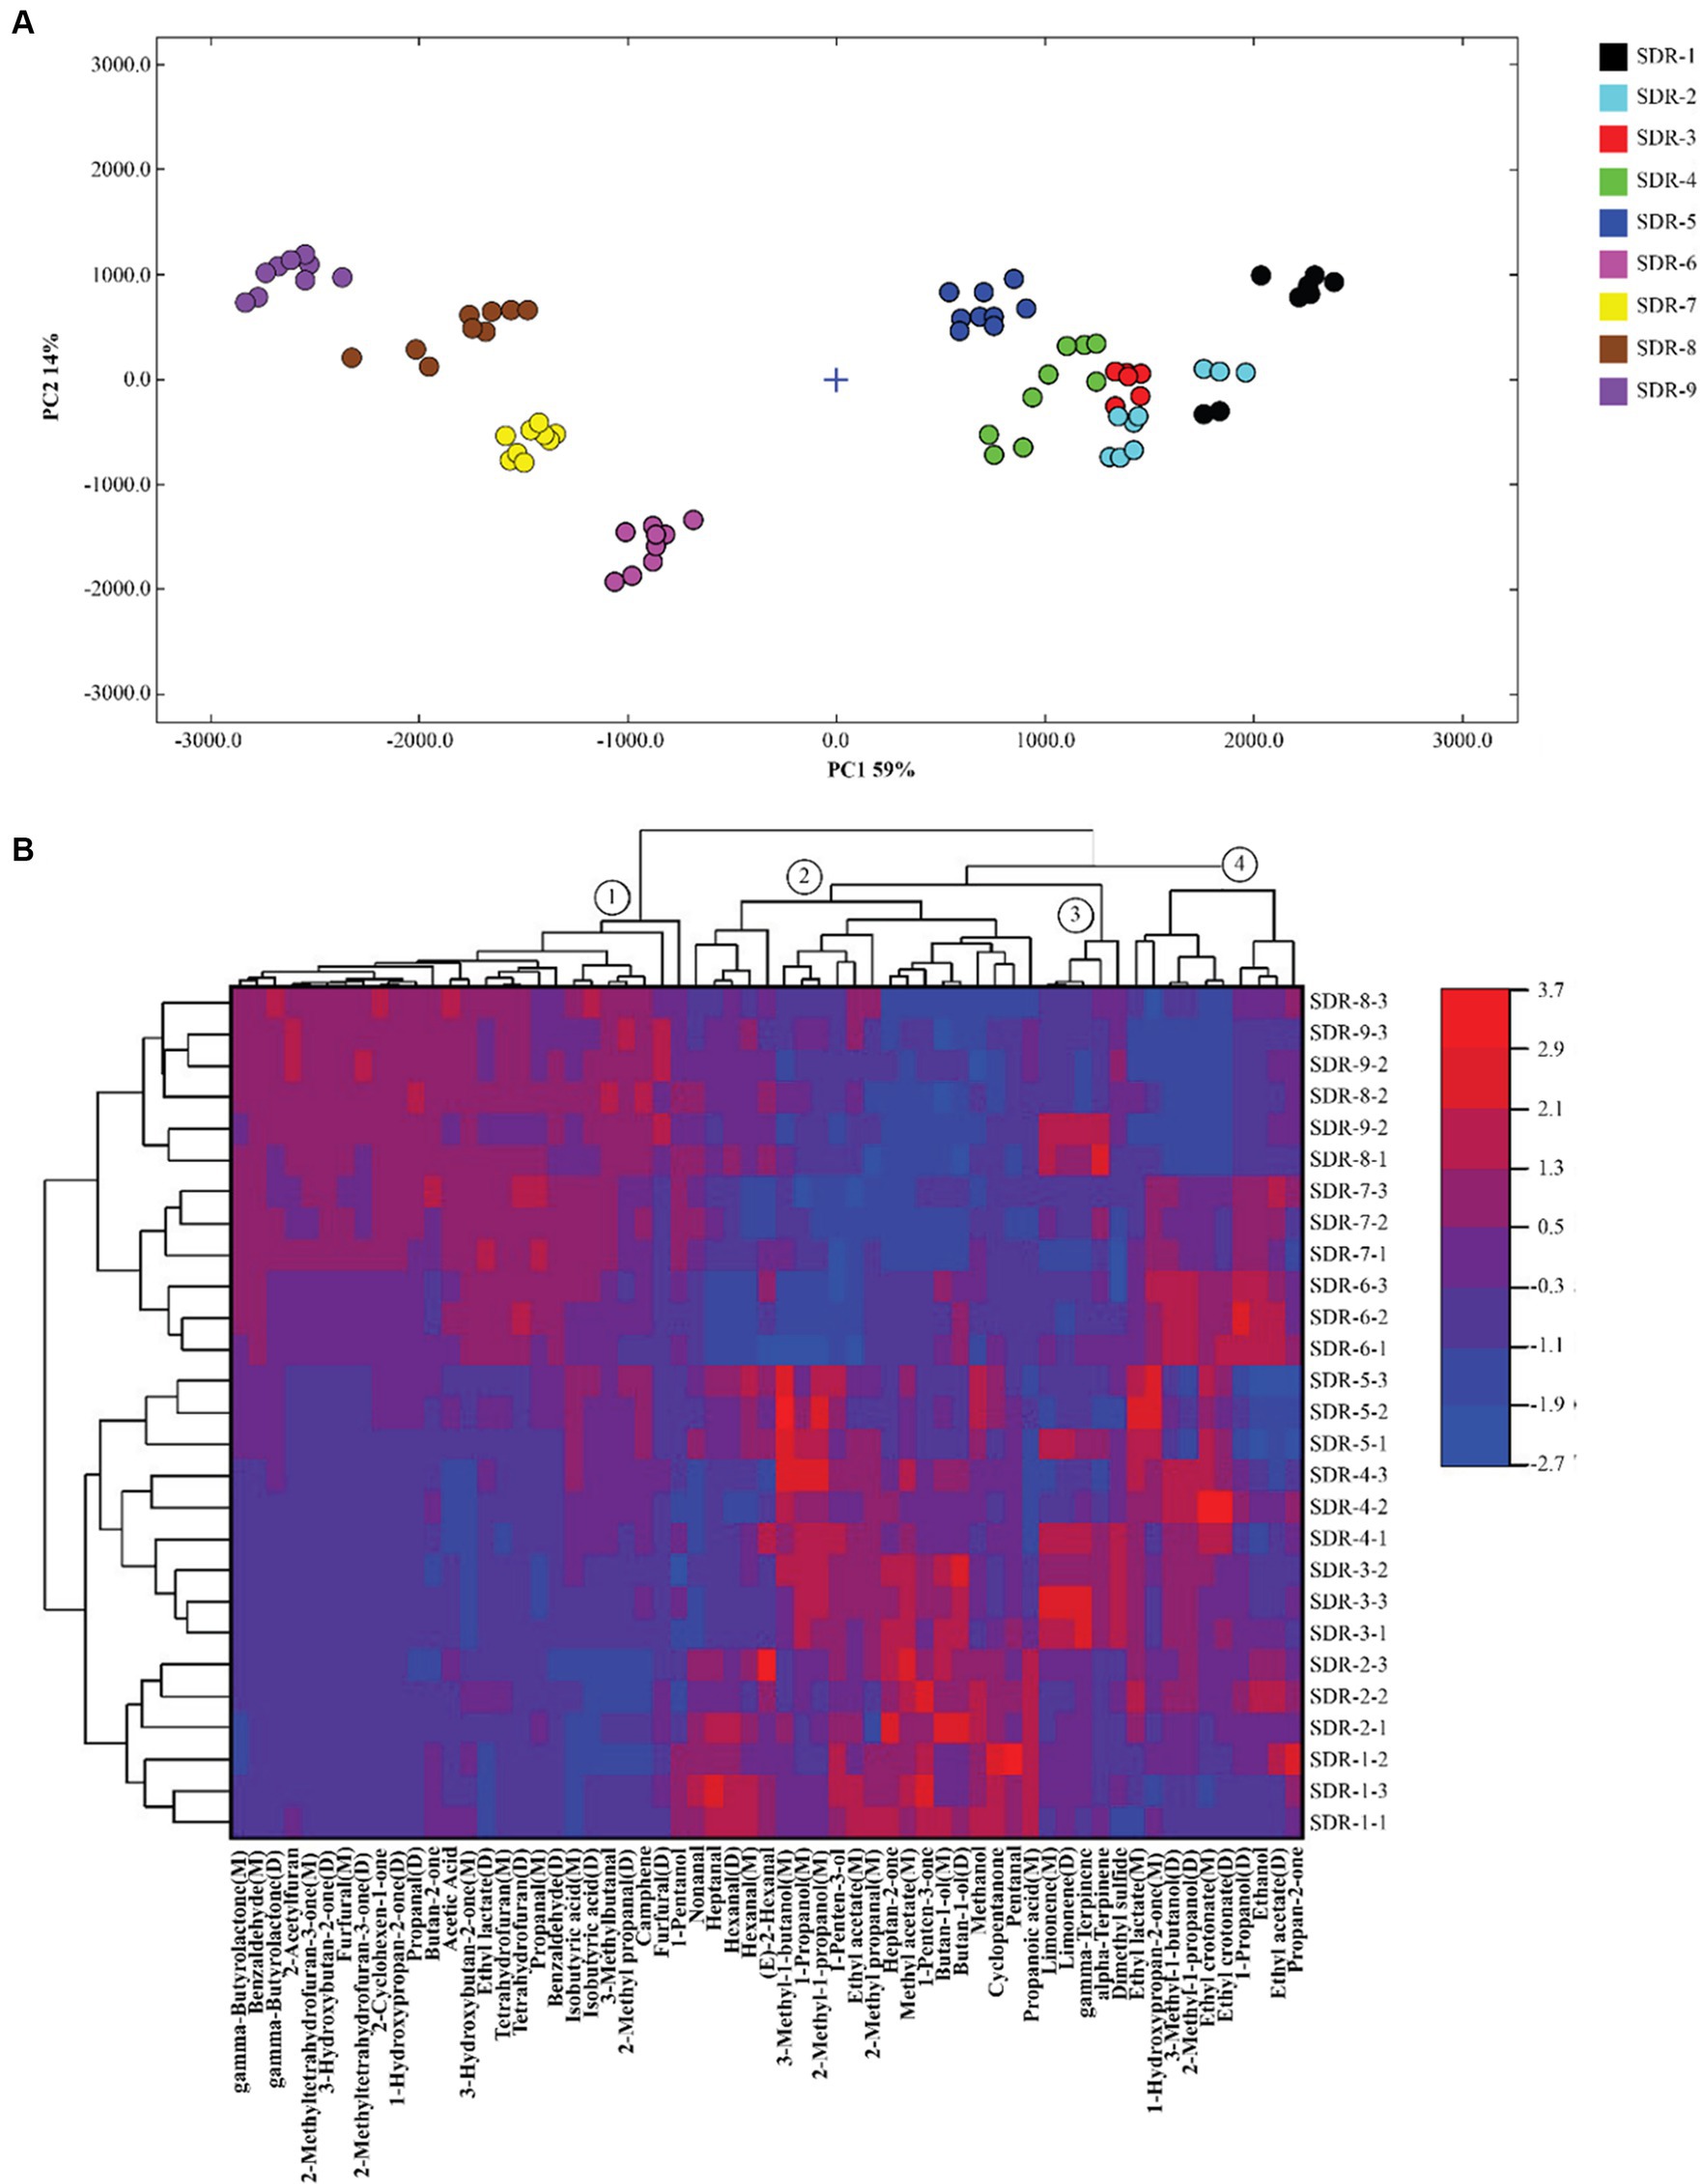
Figure 3. Principal component analysis (A) and cluster heat mapping (B) of the characteristic volatile components in rhubarb samples at different steaming and sun-drying times.
To further assess the changes in the characteristic volatile components of rhubarb after different steaming and sun-drying times, cluster heat maps were generated based on the peak intensities of 61 characteristic markers (Figure 3B). The response value of the compound increased with increasing red intensity and decreased with increasing blue intensity. As shown in the figure, rhubarb processing can be divided into two stages: odor fluctuation and odor stability. In Figure 3B, these odor substances are divided into four categories according to the clustering results, namely, ①, ②, ③, and ④. The composition of the odor substances varied at different stages; among these, ① compounds played a crucial role in distinguishing the different stages. The odor fluctuation stage included SDR-1–5. At this stage, the response value of the ① compounds was low, indicating that no changes occurred in these odor substances during the first to fifth cycles of steaming and sun-drying. The odor-stable stage included SDR-6–9, which formed a clear boundary with the fifth cycle. The response value of ① compounds was significantly increased (p < 0.05) and reached the maximum value, reaching a stable stage of rhubarb odor. A total of 26 volatile odor substances, including the eight aldehydes propanal (M), propanal (D), benzaldehyde (M), benzaldehyde (D), furfural (M), furfural (D), 3-methyl butanal, and 2-methyl propanal (D) were present in the ① compounds. These usually have a low odor threshold and contribute significantly to odor. Furans, such as 2-acetyl furan, tetrahydrofuran (M), tetrahydrofuran (D), 2-methyl tetrahydrofuran-3-one (M), and 2-methyl tetrahydrofuran-3-one (D), are products of the Maillard reaction that occurs during the heat processing of rhubarb. They also have a low threshold and significantly contribute to odor. The Maillard reaction, also known as a carbonyl–amino compound reaction, refers to the formation of a dark brown substance through rearrangement, dehydration, condensation, and polymerization of carbonyl and amino compounds. Rhubarb contains sugars, amino acids, and polyphenols, which provide conditions for enzymatic browning and facilitate the Maillard reaction during processing (26). The proportion of these two types of compounds and their respective high response values are responsible for the primary odor of the SDR-9 samples. As a result, these eight aldehydes and five furans are key odor substances after nine cycles of steaming and sun-drying. Contrary to the ① compounds, ②, ③, and ④ compounds were present in high quantities in SDR-1–5. They exhibited a different pattern from the sixth round of steaming and sun-drying. The volatile components in the ② compounds, such as nonanal, heptanal, hexanal (M, D), 2-methyl propanol (M), (E)-2-hexanal, 3-methyl-1-butanol (M), 1-propanol, 2-methyl-1-propanol (M), 1-penten-3-ol, and ethyl acetate, significantly decreased (p < 0.05) after six to seven cycles of steaming and sun-drying. The other volatile substances in the ② compounds continued to decrease from the sixth to the ninth cycle. The ③ compounds primarily comprised four olefins and one sulfide, which fluctuated during the process. The ④ compounds were mainly alcohols, esters, and ketones, which reached their highest values during the sixth and seventh cycles drying, followed by a decrease in the eighth and ninth cycles.
Taken together, six steaming and sun-drying cycles may be considered a key process point. After six rounds, the rhubarb composition tends to be stable, and there is no significant difference in composition between SDR-6 and SDR-9. Therefore, replacing SDR-9 with SDR-6 is an effective method to streamline the process.
3.4 Quantitative analysis of anthraquinones using HPLC
3.4.1 Separation of nine standard components using HPLC
The standard solution was separated by HPLC. The retention times of chrysophanol-8-O-β-D-glucoside, physcion-8-O-β-D-glucoside, aloe-emodin-3-(hydroxymethyl)-O-β-D-glucoside, emodin-8-O-β-D-glucoside, aloe-emodin, rhein, emodin, chrysophanol, and physcion were 13.60, 13.85, 14.27, 18.14, 21.07, 24.73, 28.86, 30.70, and 31.87 min, respectively (Figures 4A,B). This method was also applied to the prepared rhubarb samples (Figure 4C).
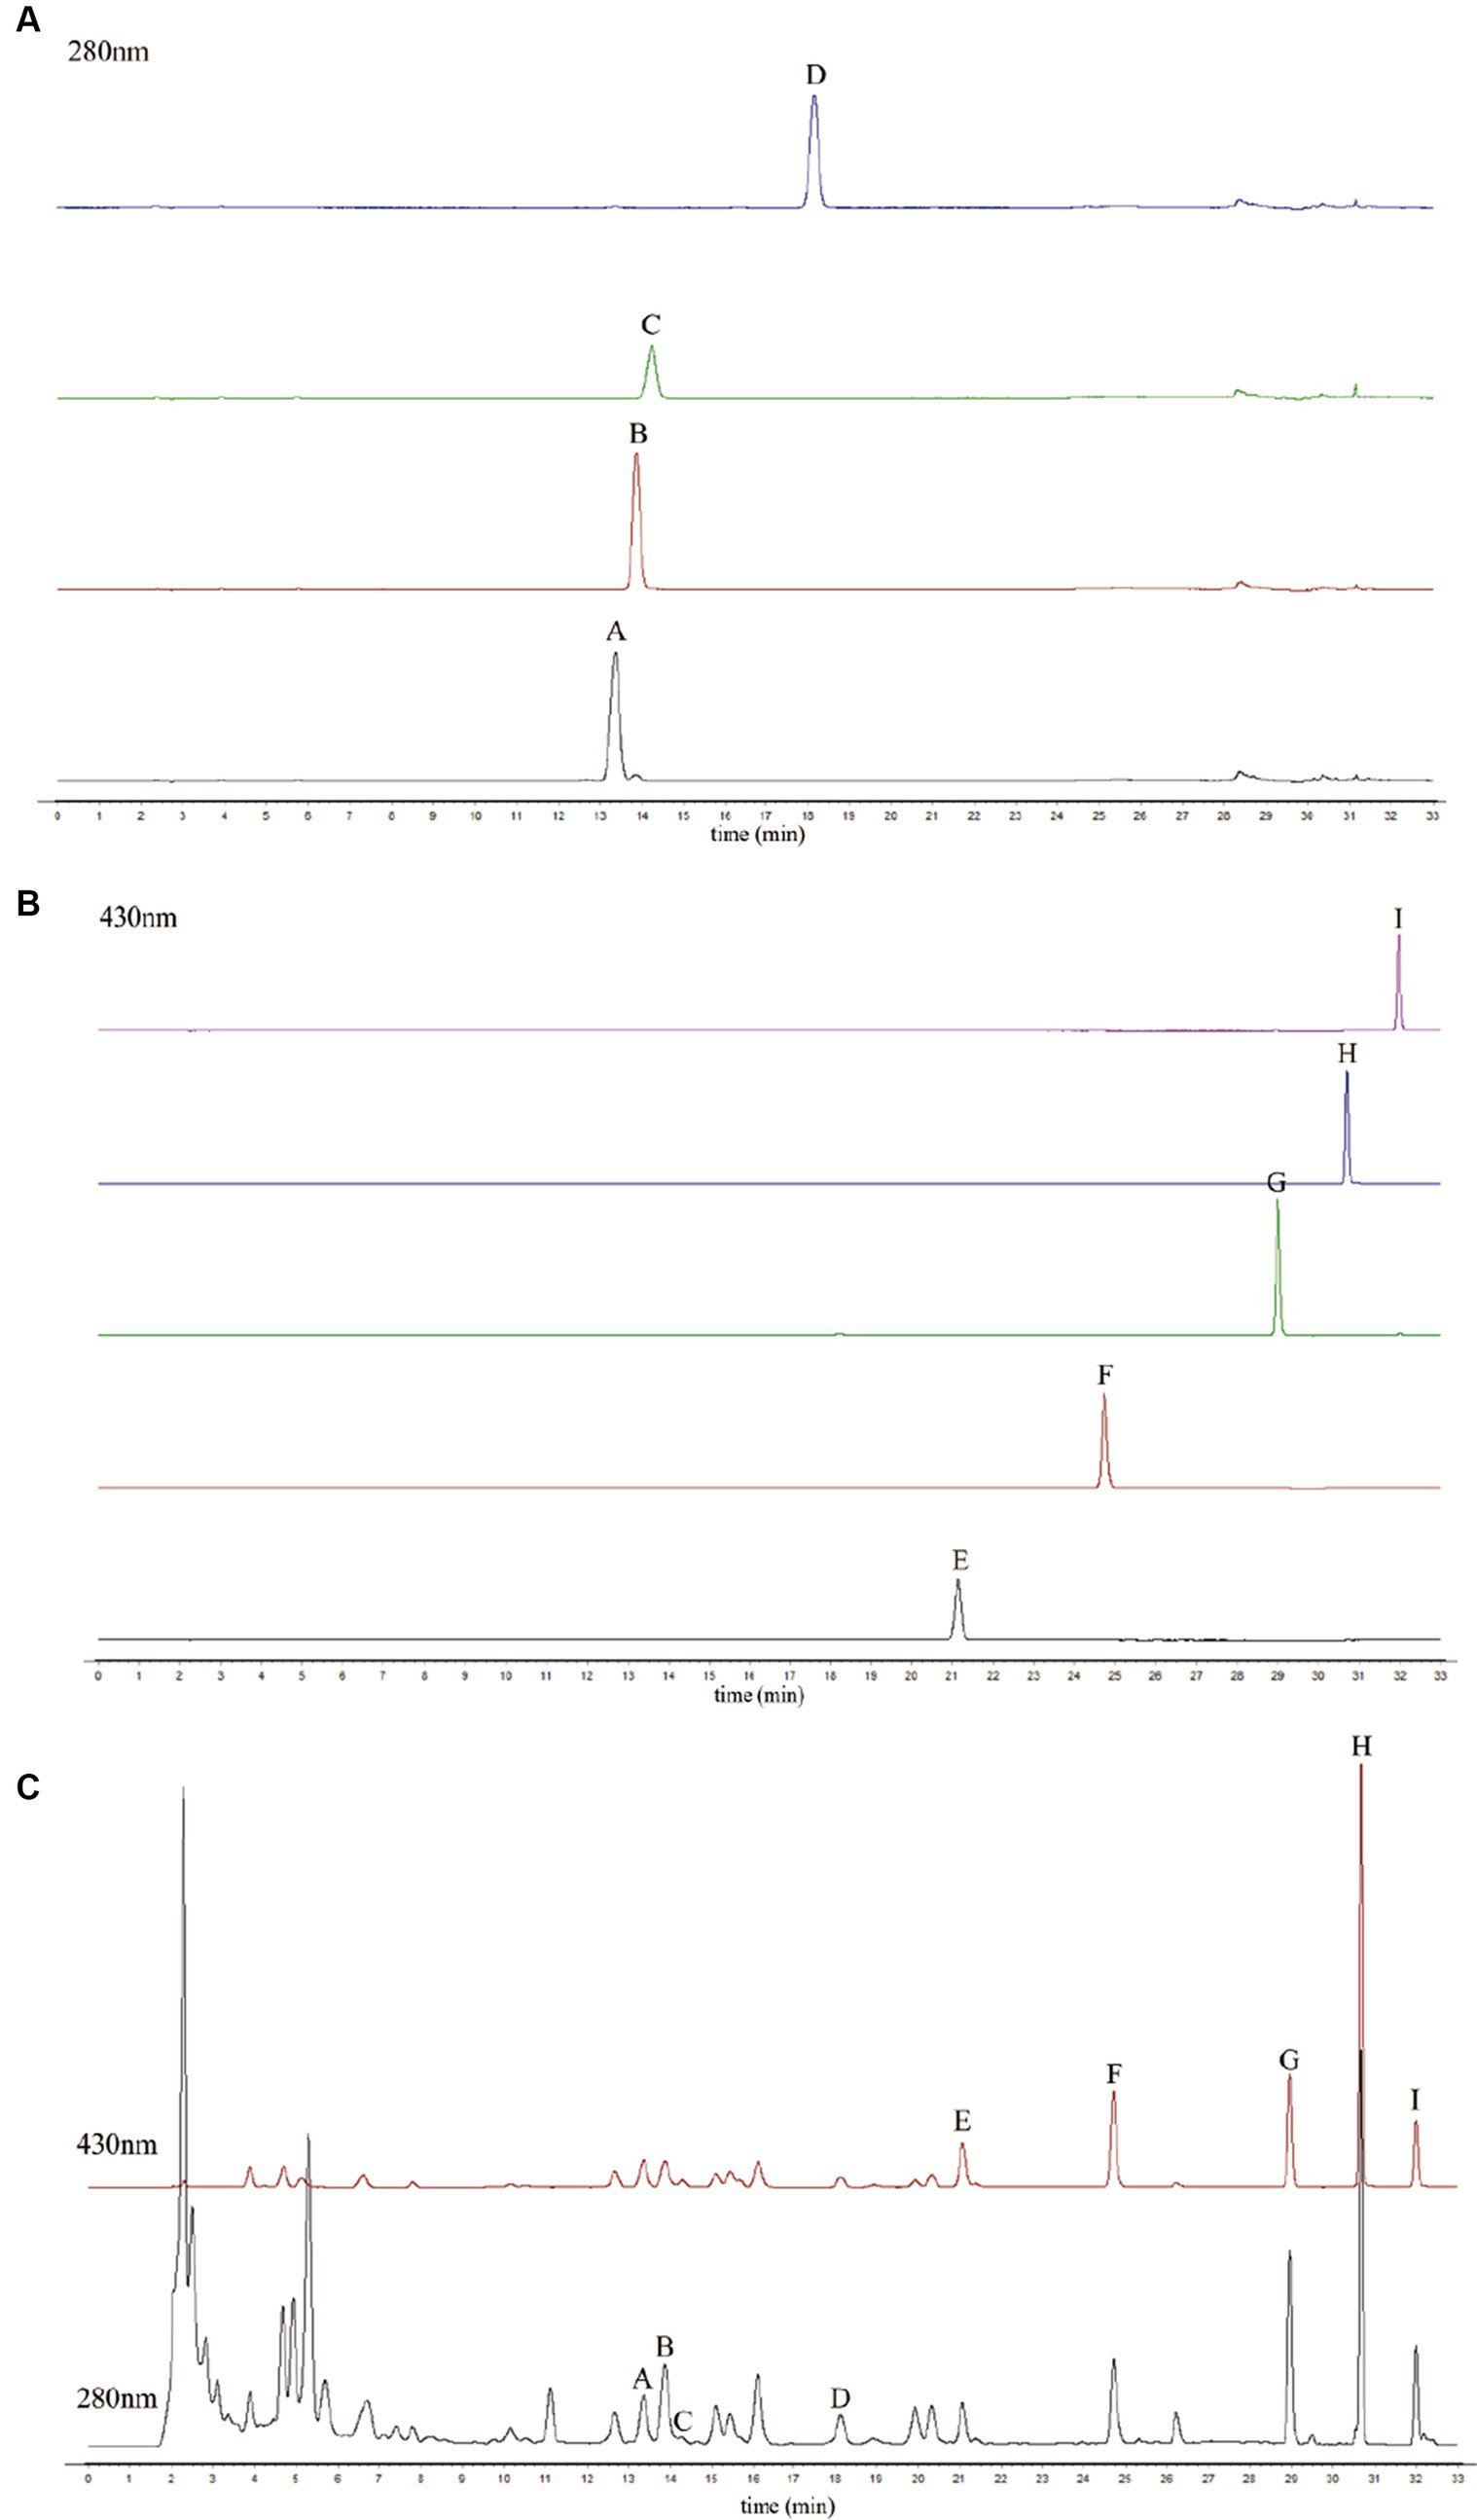
Figure 4. High-performance liquid chromatography (HPLC) chromatogram of the standard components at 280 nm (A), at 430 nm (B), and the raw rhubarb samples (C). (A) Chrysophanol-8-O-β-D-glucoside, (B) emodin-8-O-β-D-glucoside, (C) aloe-emodin-3-(hydroxymethyl)-O-β-D-glucoside, (D) physcion-8-O-β-D-glucoside, (E) aloe-emodin,(F) rhein, (G) emodin, (H) chrysophanol, and (I) physcion.
3.4.2 Linearity, limit of detection, and limit of quantification
Linearity was defined using a calibration curve. Six different volumes (1, 5, 10, 15, 20, and 25 μL) of the standard solution were used to establish a calibration curve. The following linear regression equation was obtained from the calibration curve: Y = a x + b, where a is the slope and b is the intercept of the calibration curve, x is the infection volume of the standard components, and Y is the peak area. The correlation coefficients for all marker components exhibited excellent linearity (R2 > 0.9992). The linear relationship of components A–I was good at 0.0164–0.4100, 0.0201–0.5025, 0.0097–0.2425, 0.0142–0.3550, 0.0200–0.5000, 0.0270–0.6750, 0.0780–1.9500, 0.0344–0.8600, and 0.0222–0.5550 μg, respectively. The limit of detection (LOD) and limit of quantification (LOQ) were calculated based on the standard deviation (SD) and the slope (S) of the calibration curve using the equations: LOD = (3.3 × SD)/S and LOQ = (10 × SD)/S. From the calibration curve of the peak area versus concentration, the SD was the SD of the response. It was estimated by the SD of the intercepts of the regression line in the calibration curve. S was the slope of the calibration curve. Table 3 lists the specific results.
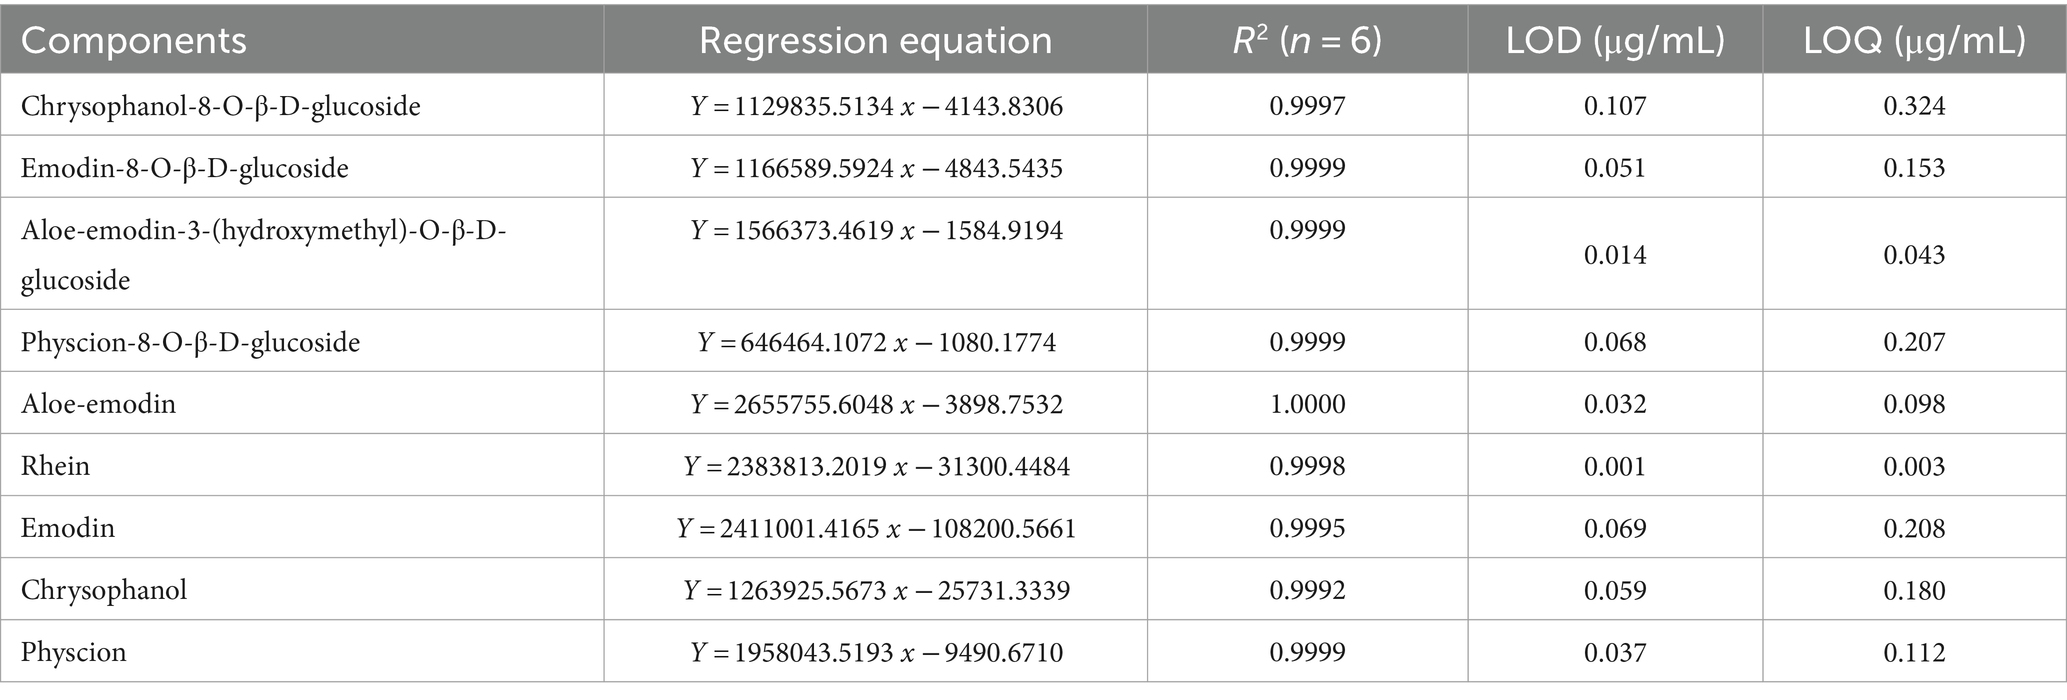
Table 3. Linearity, correlation coefficient (R2), limit of detection (LOD), and limit of quantification (LOQ) of the study compounds.
3.4.3 Precision
The raw rhubarb solution was injected continuously six times based on the chromatographic conditions described in Section 2.2, with an injection volume of 10 μL. The repeatability of the analytical method was considered reliable according to the RSD (1.98 < 2%). The anthraquinone content in the raw rhubarb is listed in Table 4.
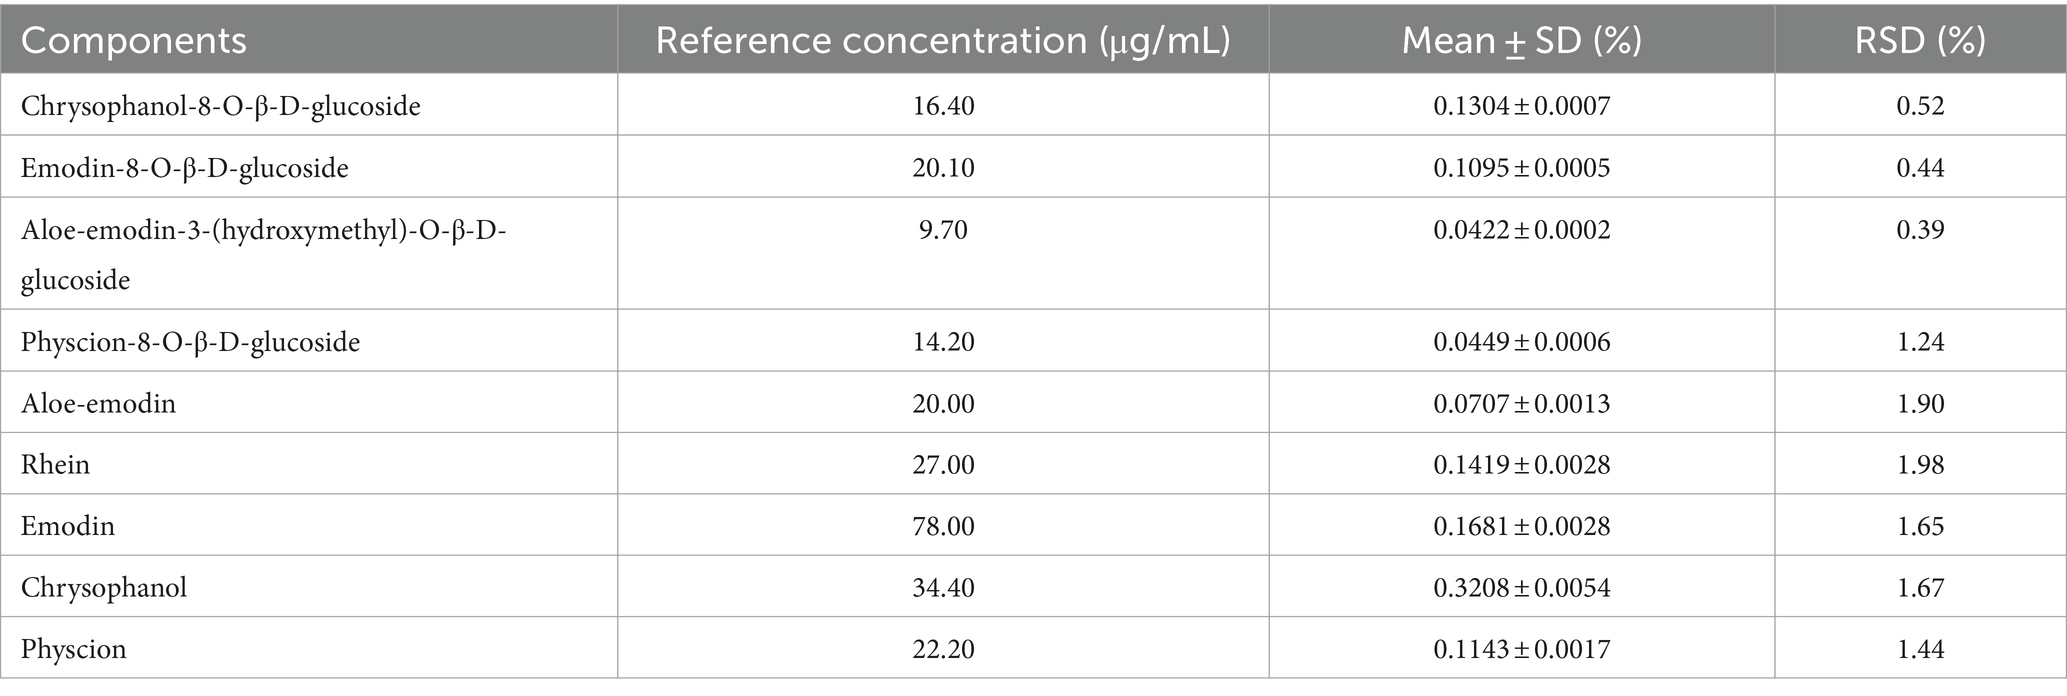
Table 4. Analytical results of the precision tests.
3.4.4 Robustness
The rhubarb sample solution was injected at 0, 2, 4, 8, 12, and 24 h after preparation. Table 5 lists the robustness of the contents. An RSD value of less than 2% indicated that the sample composition was not changed significantly within 24 h; therefore, the method was considered robust.
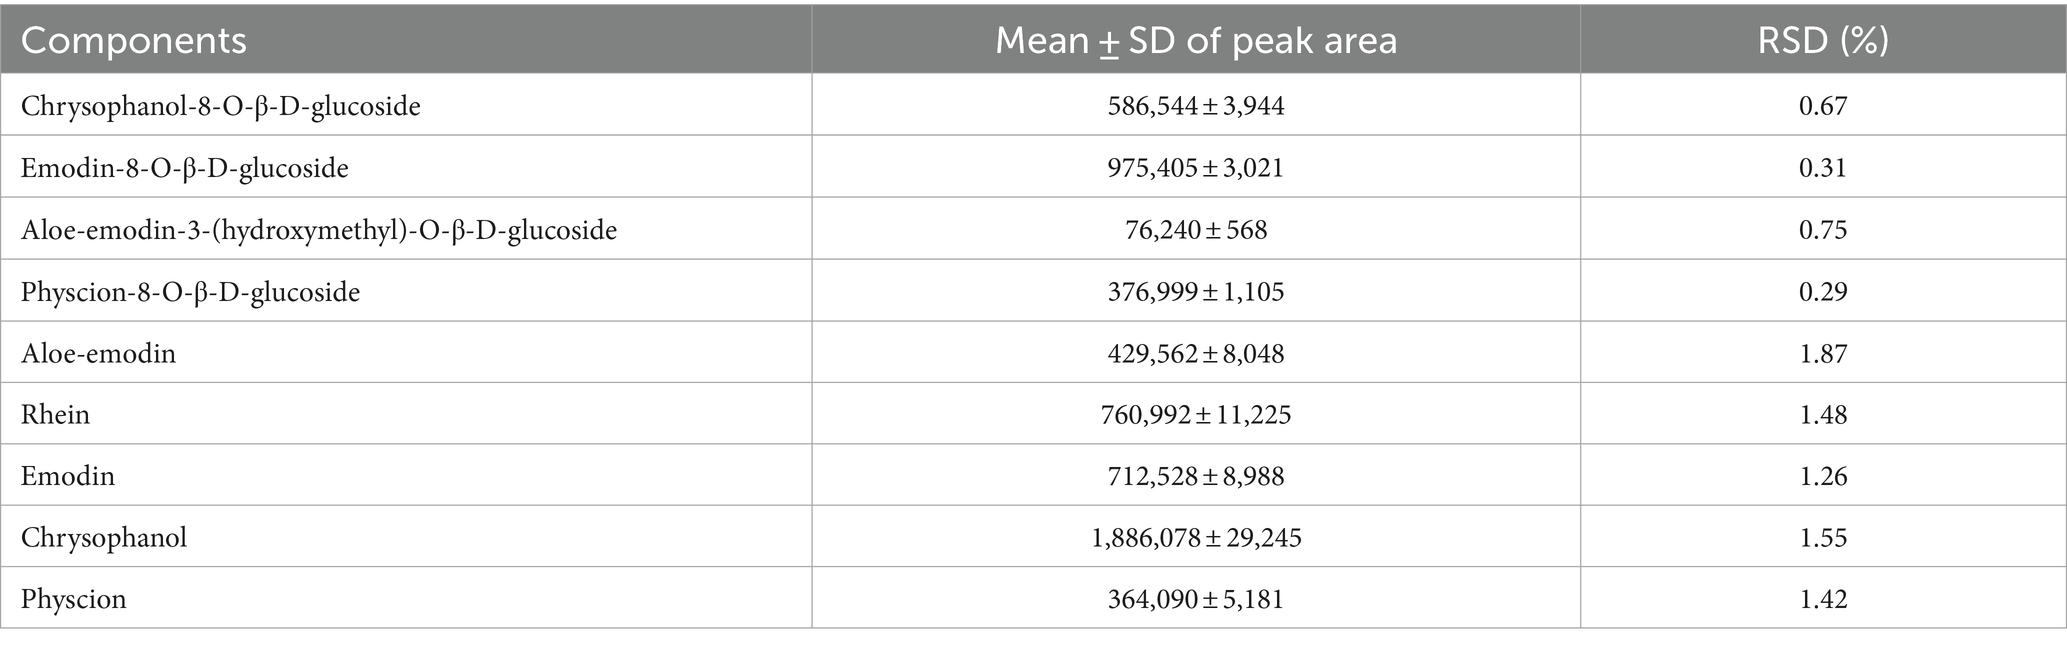
Table 5. Analytical results of the robustness of the method.
3.4.5 Accuracy
The accuracy of the method was verified by a recovery test. The recovery test was done by adding a standard solution to a known quantity of rhubarb sample. The assay was repeated six times. The recovery values of the nine components varied between 97.48 and 104.99% and the RSD values were between 0.50 and 1.76% (Table 6).
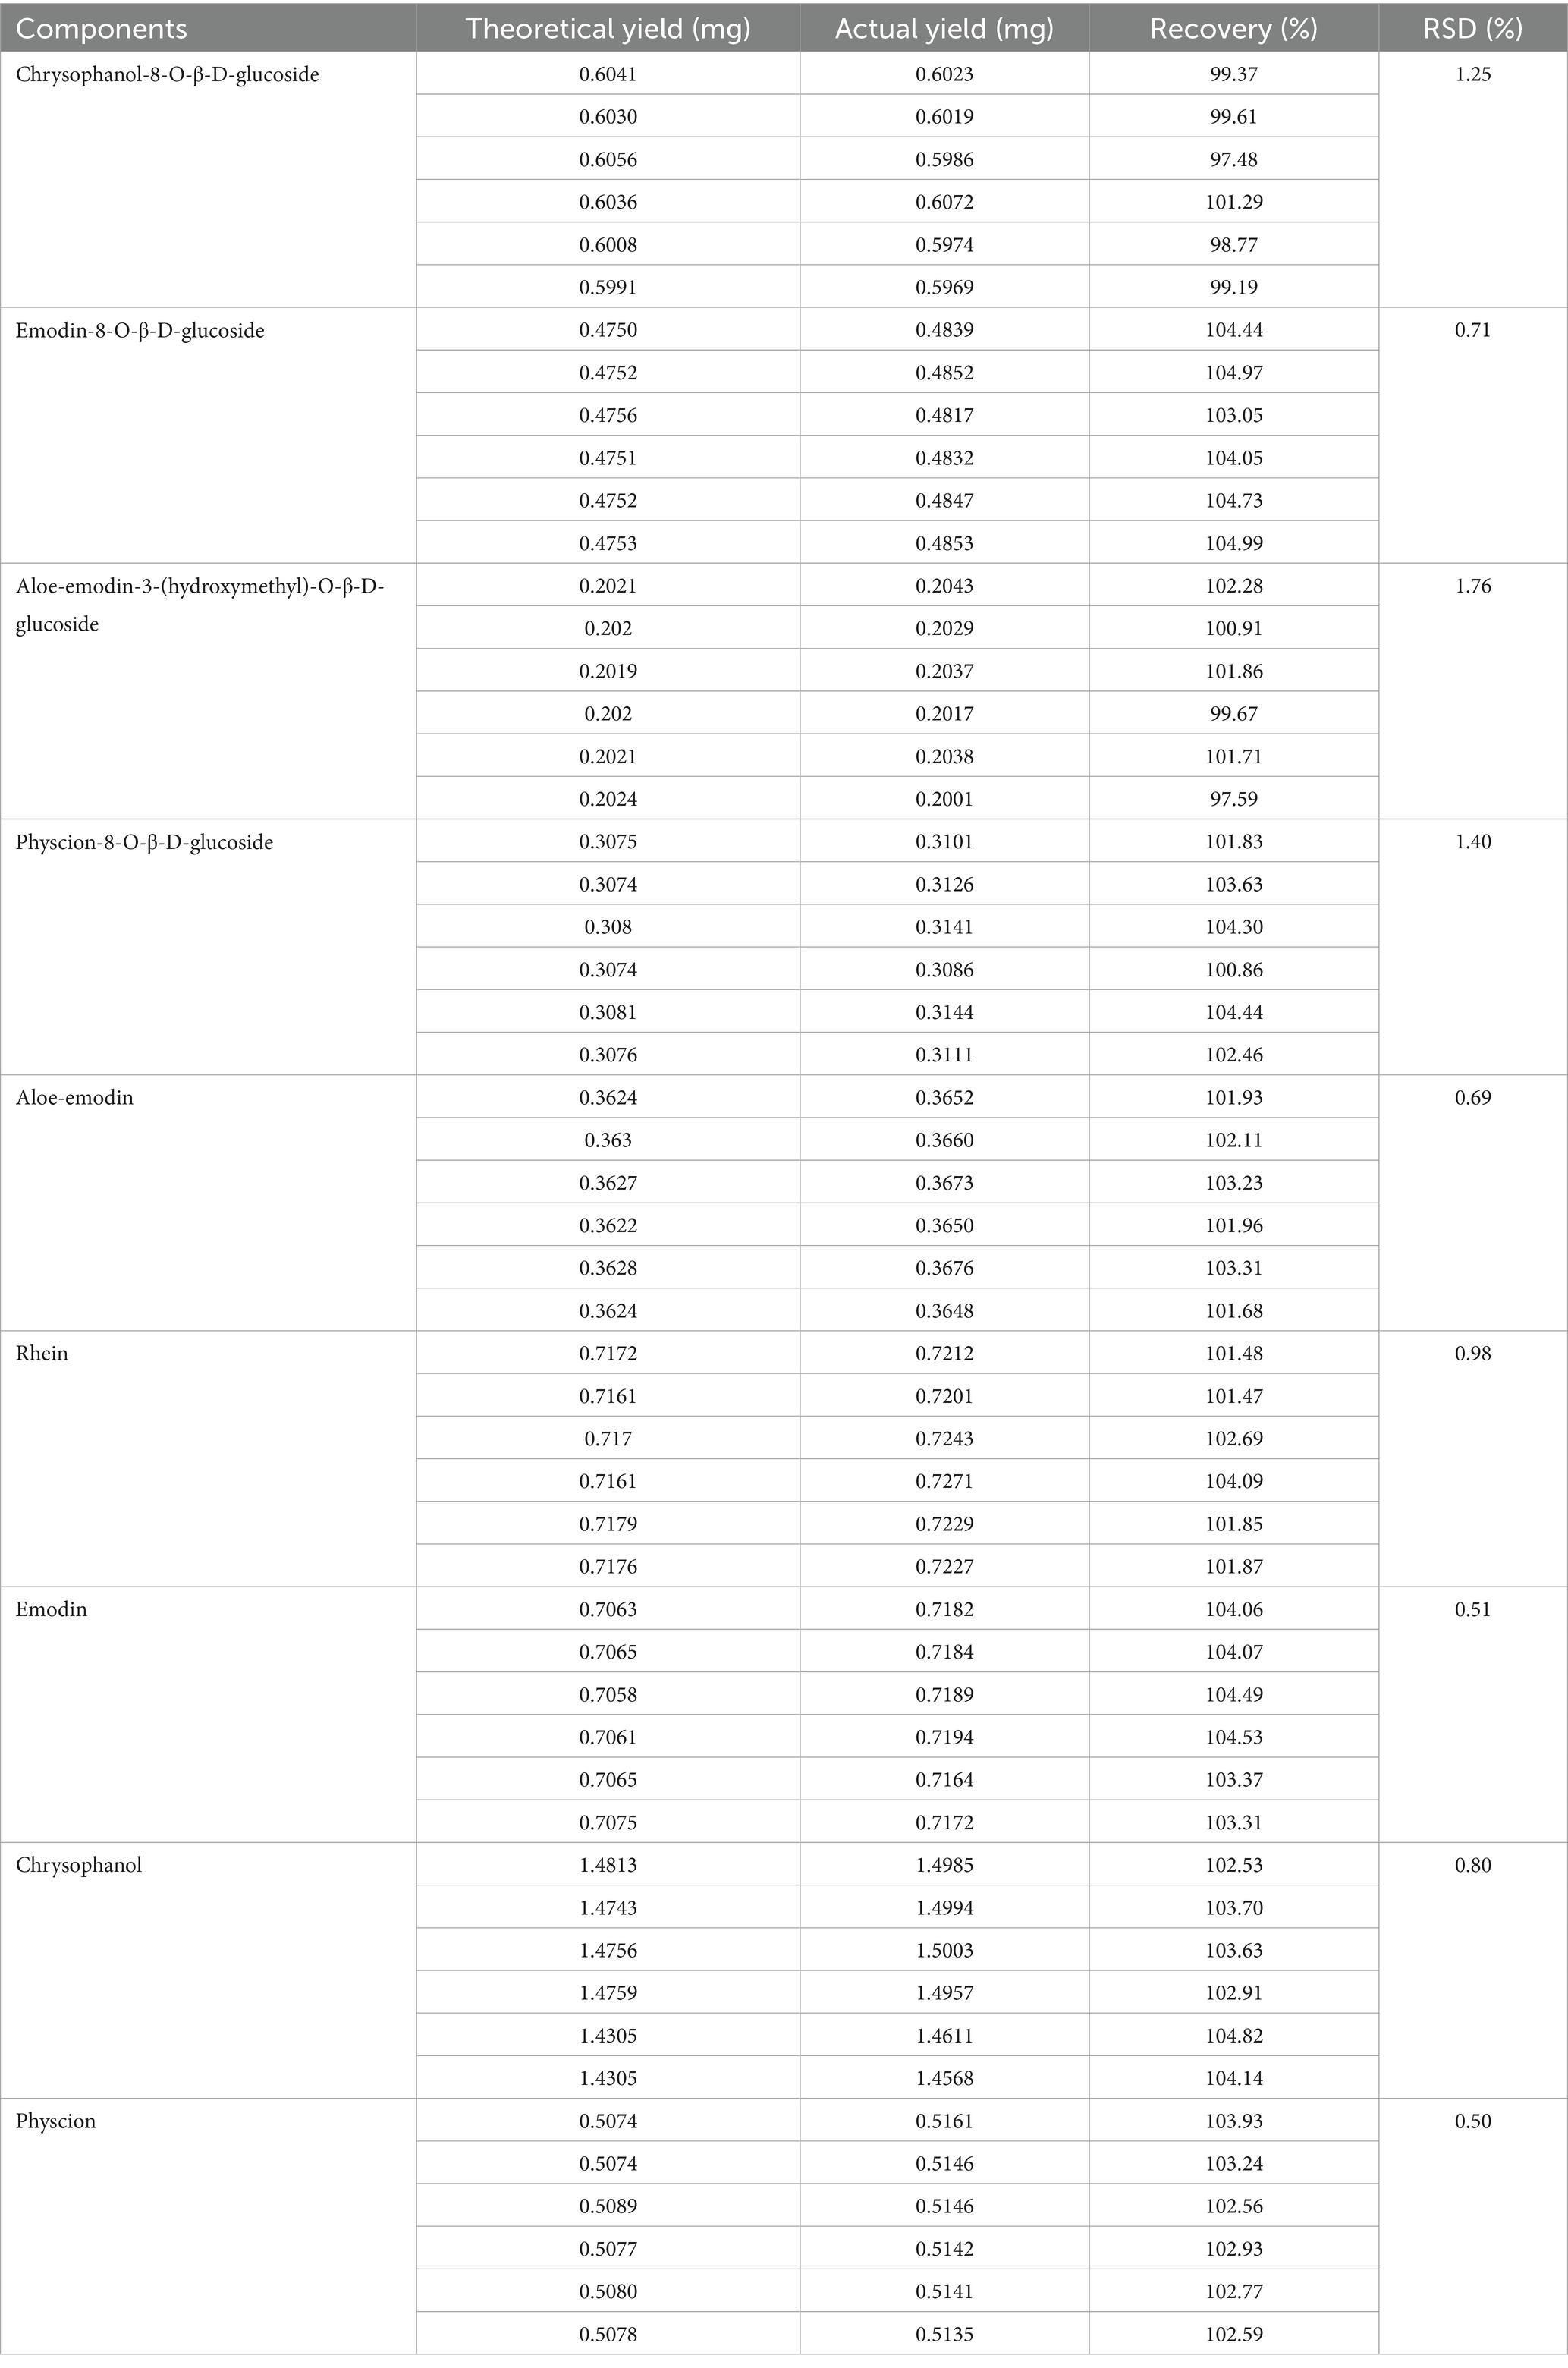
Table 6. Analytical results of the recovery of the method.
3.4.6 Analysis of anthraquinone components in different rhubarb samples
The SDR-9 samples were analyzed by HPLC. The amount of the anthraquinone components was calculated from the calibration curve of the standards. Table 7 lists the content of the nine components in the nine samples.
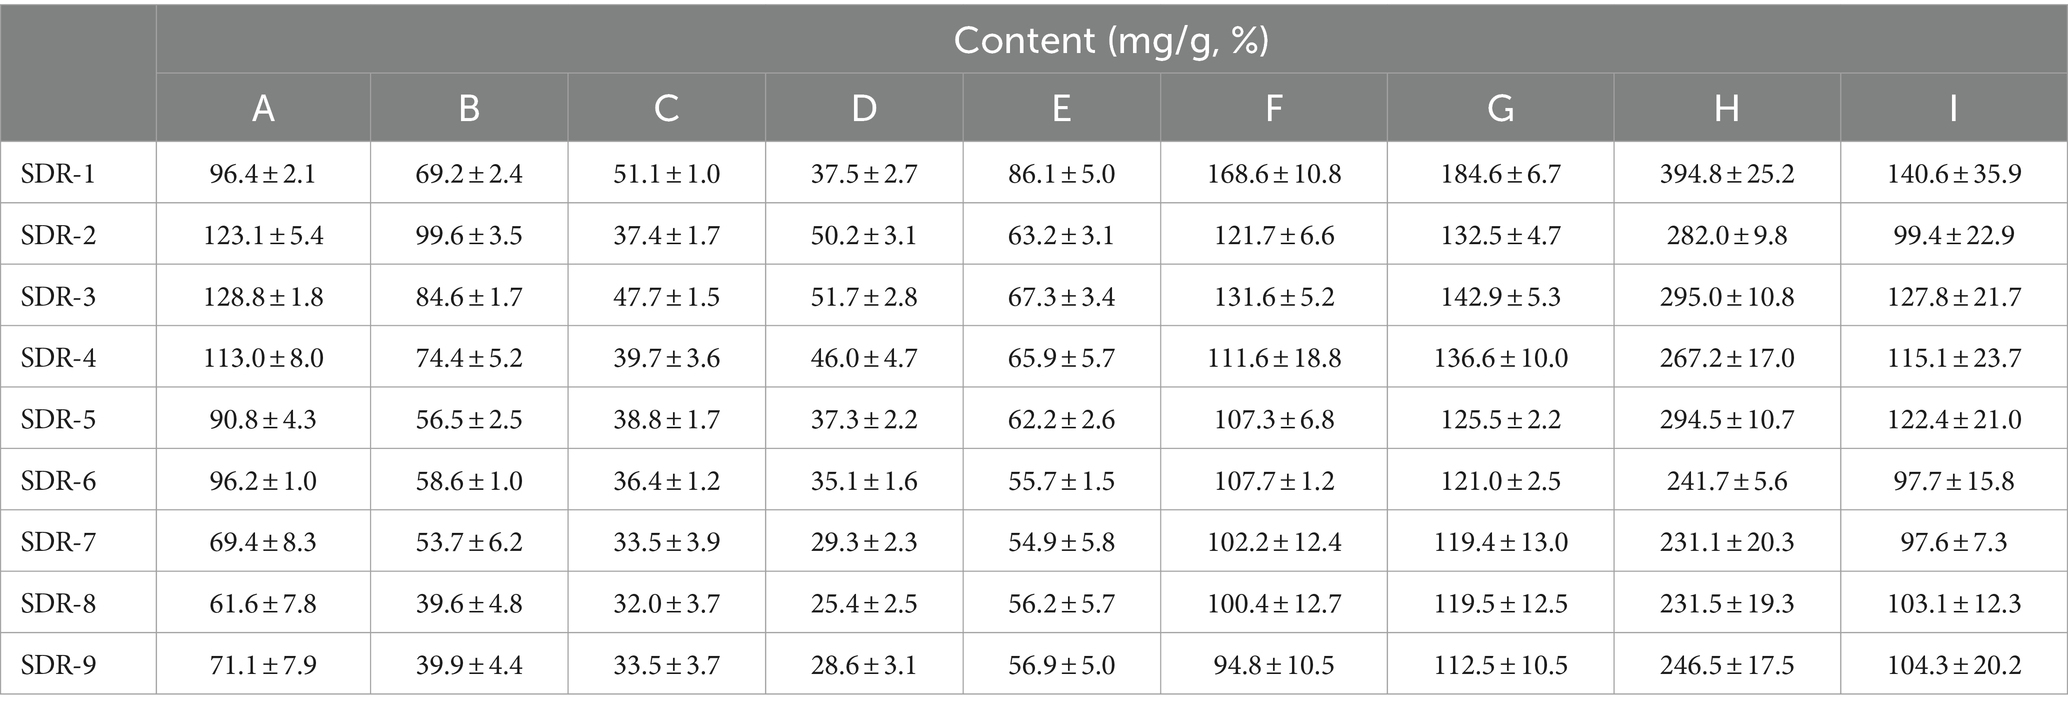
Table 7. Components of nine anthraquinone components in the SDR samples.
3.5 Taste analysis with an electronic tongue
For the electronic tongue analysis, artificial saliva (also called reference solution) was used as the standard output. The state of the artificial saliva tested using the electronic tongue simulates the state of saliva in humans. The tasteless point is the output value of the reference solution. The acid tasteless point of the reference solution (reference) is negative 13, whereas the salty tasteless point is negative 6. When the taste value of the sample is lower than that of the tasteless point, the sample does not have taste, and vice versa. The richness in Table 2 represents the aftertaste of umami and reflects the persistence of the freshness of the sample. A bitter aftertaste (aftertaste-B) reflects the residual degree of bitterness, whereas an astringent aftertaste (aftertaste-A) reflects the residual degree of astringency. The prominent taste characteristics of the rhubarb samples included bitterness, aftertaste-B, B-bitterness2, richness, umami, and aftertaste-A (Figure 5A). The other taste response values were close to or below the tasteless point, and the differences between samples were primarily reflected in richness. Of these, bitterness had the highest response value and contributed the most to the taste of the rhubarb samples.
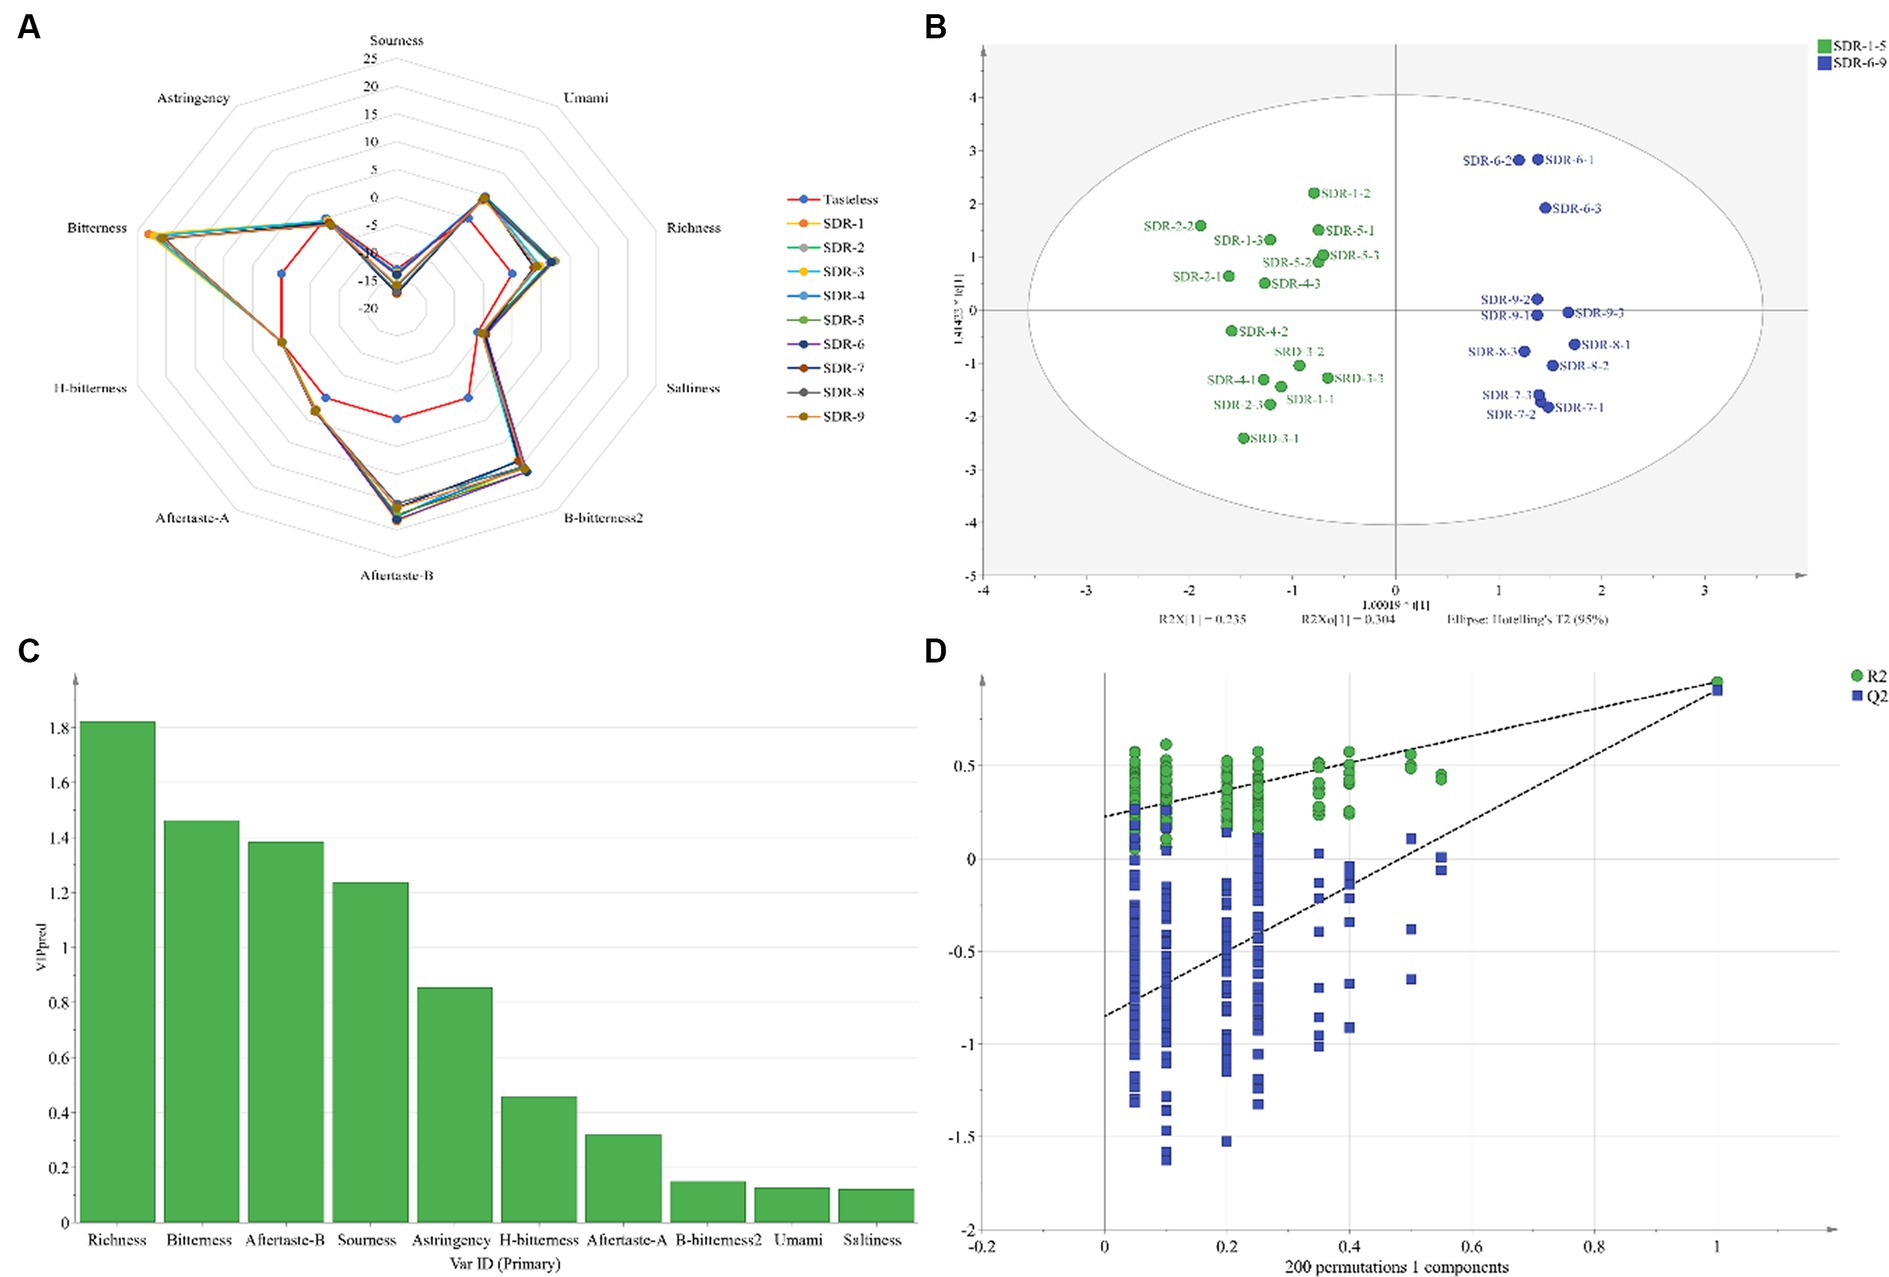
Figure 5. Odor composition (A), score plots of the OPLS-DA model (B), VIP value chart (C), and permutation test plot (D) of rhubarb samples at different steaming and sun-drying times using an electronic tongue.
Orthogonal partial least squares discriminant analysis was used to analyze the data obtained from the electronic tongue. The score plot of the OPLS-DA model is shown in Figure 5B, in which R2X, R2Y, and Q2 were 0.956, 0.951, and 0.908, respectively. The values were all >0.5 and close to 1, indicating that the model had a high goodness-of-fit and prediction ability. The clustering results of SDR-6 and SDR-9 in the figure were close, indicating that their tastes were similar to one another. Rhubarb samples were distributed in different quadrants in Figure 5B, which was divided into two parts: SDR-1–5 and SDR-6–9. This indicates that their respective tastes are similar. The results were similar to those of the GC–IMS analysis. The variable influence on the projection (VIP) value chart (Figure 5C) reflects the contribution of the tastes to model classification, and VIP > 1 was considered the standard for screening the different tastes. Figure 5C shows that the tastes contributing mostly to the model classification were richness, bitterness, aftertaste-B, and sourness. In addition, the OPLS-DA model was verified using permutation tests (Figure 5D), which revealed that R2 and Q2 (n = 200) were 0.225 and − 0.851, respectively, indicating no over-fitting phenomenon in the reliability of the model.
3.6 Correlation analysis between the taste of rhubarb samples and content of nine anthraquinone components
Pearson correlation analysis was conducted using SPSS software (R26.0.0.0, IBM, United States) and the resulting data were imported into OriginPro 2021 software (v.9.8.0, OriginLab, Northampton, MA, United States) to generate a heatmap (Figure 6). The flavors with a significant positive correlation with anthraquinones was richness, aftertaste-B, bitterness, sourness, and astringency, which is similar to the results of the VIP value chart. Umami and H-bitterness were negatively correlated with the anthraquinone glycoside components.
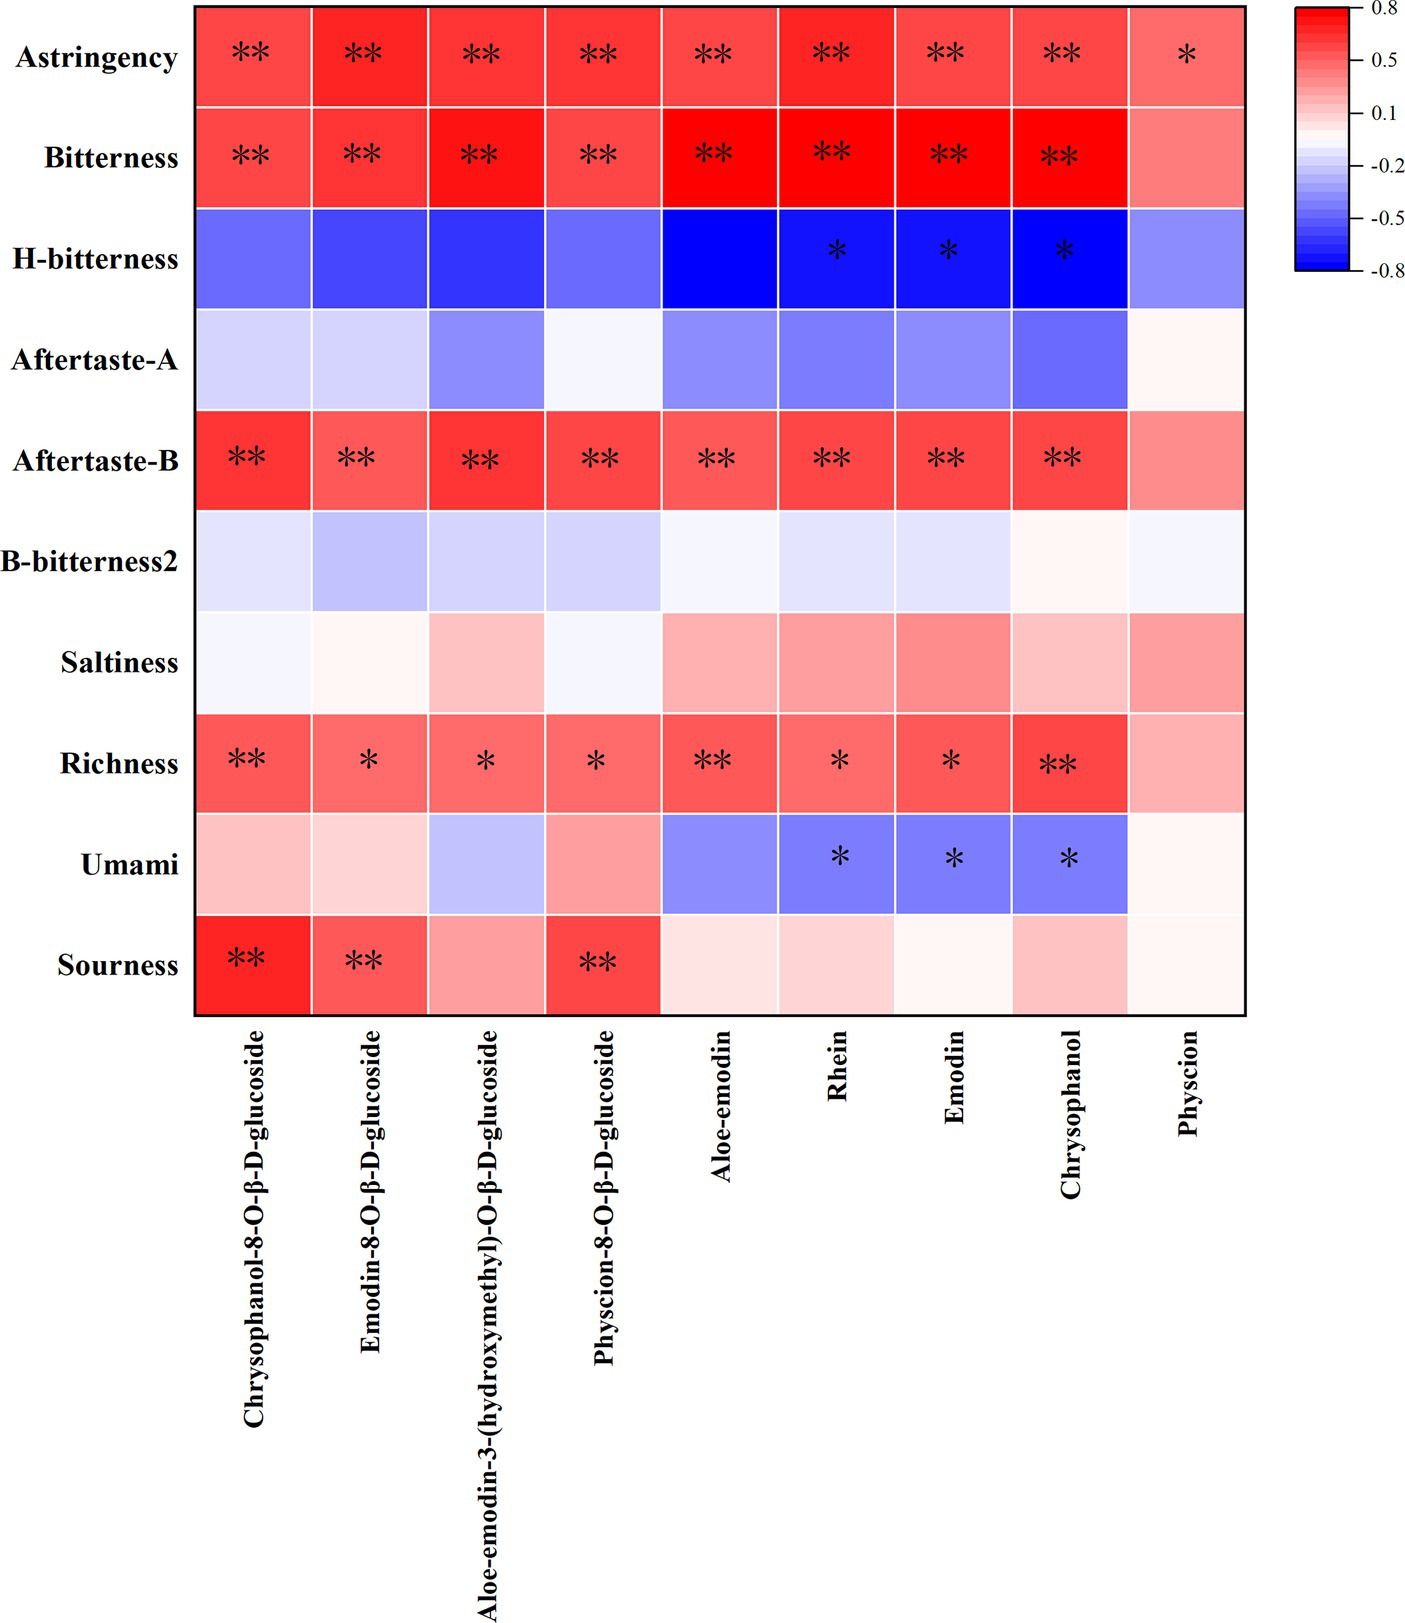
Figure 6. Heatmap of taste and anthraquinones.
4 Conclusion
Flavor analysis includes odor determination using GC–IMS and taste characterization using an electronic tongue. During the odor analysis of SDR-9, 61 volatile compounds, including aldehydes, esters, alcohols, ketones, acids, alkenes, and furans, were identified. Among these, 13 volatile components were the predominant substances for odor, which divided the process into two stages: 1–5 cycles of steaming and sun-drying and 6–9 times. In the second stage, SDR-6 and SDR-9 were grouped in terms of odor. The electronic tongue analysis revealed that the most prominent taste was bitterness. The OPLS-DA clustering results of SDR-6 and SDR-9 were close, indicating that their tastes are similar to one another. Moreover, anthraquinones were determined by HPLC and there was a significant correlation between taste and the components of the SDR samples. Based on the above results, there are similarities in smell, taste, and composition between SDR-6 and SDR-9; thus, the traditional process of steaming and sun-drying nine times can be reduced to six.
Data availability statement
The original contributions presented in the study are included in the article; further inquiries can be directed to the corresponding author.
Ethics statement
The animal study was approved by Experimental Animal Ethics Committee, Institute of Traditional Chinese Medicine, Chinese Academy of Traditional Chinese Medicine; Approval number 2023B109. The study was conducted in accordance with the local legislation and institutional requirements.
Author contributions
TL: Data curation, Writing – original draft, Writing – review & editing. MY: Data curation, Formal analysis, Methodology, Writing – review & editing. YD: Conceptualization, Validation, Writing – review & editing. YX: Project administration, Supervision, Writing – review & editing. LL: Writing – review & editing, Data curation, Funding acquisition, Resources, Software.
Funding
The author(s) declare that financial support was received for the research, authorship, and/or publication of this article. This work was financially supported by the Scientific and Technological Innovation Project of the China Academy of Chinese Medical Sciences (CI2021A04205) and Fundamental Research Funds for the Central Public Welfare Research Institutes (ZXKT23007).
Conflict of interest
TL was employed by Chongqing Taiji Industry (Group) Co., Ltd.
The remaining authors declare that the research was conducted in the absence of any commercial or financial relationships that could be construed as a potential conflict of interest.
Publisher's note
All claims expressed in this article are solely those of the authors and do not necessarily represent those of their affiliated organizations, or those of the publisher, the editors and the reviewers. Any product that may be evaluated in this article, or claim that may be made by its manufacturer, is not guaranteed or endorsed by the publisher.
References
1. Huang, Q, Lu, G, Shen, HM, Chung, MCM, and Ong, CN. Anti-cancer properties of anthraquinones from rhubarb. Med Res Rev. (2007) 27:609–30. doi: 10.1002/med.20094
2. Cao, YJ, Pu, ZJ, Tang, YP, Shen, J, Chen, YY, Kang, A, et al. Advances in bio-active constituents, pharmacology and clinical applications of rhubarb. Chin Med. (2017) 12:36. doi: 10.1186/s13020-017-0158-5
3. Liudvytska, O, and Kolodziejczyk-Czepas, J. A review on rhubarb-derived substances as modulators of cardiovascular risk factors—a special emphasis on anti-obesity action. Nutrients. (2022) 14:2053. doi: 10.3390/nu14102053
4. Zhang, Y, Fan, S, Hu, N, Gu, M, Chu, C, Li, Y, et al. Rhein reduces fat weight in db/db mouse and prevents diet-induced obesity in C57BL/6 mouse through the inhibition of PPAR γ signaling. PPAR Res. (2012) 2012:1–9. doi: 10.1155/2012/374936
5. Shi, Y, Zhong, Y, Sun, A, Gao, B, Sun, C, and Xiong, J. Validation of a rapid and simple high-performance liquid chromatography-electrospray ionization-mass spectrometry method for simultaneous analysis of 15 key chemicals in slimming foods and herbal products. J Chromatogr Sci. (2018) 56:912–9. doi: 10.1093/chromsci/bmy068
6. Yang, L, Yang, L, Pei, W, Dong, L, and Chen, J. Color-reflected chemical regulations of the scorched rhubarb (Rhei Radix et rhizoma) revealed by the integration analysis of visible spectrophotometry, Fourier transform infrared spectroscopy and high performance liquid chromatography. Food Chem. (2022) 367:130730. doi: 10.1016/j.foodchem.2021.130730
7. Wang, JB, Qin, Y, Kong, WJ, Wang, ZW, Zeng, LN, Fang, F, et al. Identification of the antidiarrhoeal components in official rhubarb using liquid chromatography–tandem mass spectrometry. Food Chem. (2011) 129:1737–43. doi: 10.1016/j.foodchem.2011.06.041
8. Zhuang, T, Gu, X, Zhou, N, Ding, L, Yang, L, and Zhou, M. Hepatoprotection and hepatotoxicity of Chinese herb rhubarb (Dahuang): how to properly control the ‘general (Jiang Jun)’ in Chinese medical herb. Biomed Pharmacother. (2020) 127:110224. doi: 10.1016/j.biopha.2020.110224
9. Zhao, L, Hu, CJ, Pan, X, Geng, YY, Cheng, ZM, and Xiong, R. Comparative study on influences of long-term use of raw rhubarb and stewed rhubarb on functions of liver and kidney in rats. Chin J Hosp Pharm. (2015) 35:1384–7. doi: 10.13286/j.cnki.chinhosppharmacyj.2015.15.11
10. Zhang, Q, Chen, YY, Yue, SJ, Wang, WX, Zhang, L, and Tang, YP. Research progress on processing history evolution as well as effect on chemical compositions and traditional pharmacological effects of Rhei Radix et Rhizoma. Zhongguo Zhong Yao Za Zhi. (2021) 46:539–51. doi: 10.19540/j.cnki.cjcmm.20201105.601
11. Liu, Y, Li, L, Xiao, YQ, Yao, JQ, Li, PY, Yu, DR, et al. Global metabolite profiling and diagnostic ion filtering strategy by LC–QTOF ms for rapid identification of raw and processed pieces of Rheum palmatum L. Food Chem. (2016) 192:531–40. doi: 10.1016/j.foodchem.2015.07.013
12. Teng, SS, Sun, Z, Qiu, Y, Yuan, B, and Wang, N. Investigation, optimization and evaluation of the traditional processing technology of nine-time repeatedly steaming and sun-drying. J Changchun Univ Chin Med. (2022) 38:109–13. doi: 10.13463/j.cnki.cczyy.2022.01.026
13. Xie, YN, Shen, SH, Chen, GY, Xie, MZ, Qu, HY, and He, Q. Research on taste masking of five-juice decoction based on technology combined intelligent sensory evaluation of electronic-tongue with artificial sensory evaluation. Chin J Mod Appl Pharm. (2022) 39:772–6. doi: 10.13748/j.cnki.issn1007-7693.2022.06.009
14. Yin, X, Lv, Y, Wen, R, Wang, Y, Chen, Q, and Kong, B. Characterization of selected Harbin red sausages on the basis of their flavour profiles using HS-SPME-GC/MS combined with electronic nose and electronic tongue. Meat Sci. (2021) 172:108345. doi: 10.1016/j.meatsci.2020.108345
15. Immohr, LI, Hedfeld, C, Lang, A, and Pein-Hackelbusch, M. Suitability of E-tongue sensors to assess taste-masking of pediatric liquids by different beverages considering their physico-chemical properties. AAPS PharmSciTech. (2017) 18:330–40. doi: 10.1208/s12249-016-0526-y
16. Xu, M, Wang, J, and Zhu, L. The qualitative and quantitative assessment of tea quality based on E-nose, E-tongue and E-eye combined with chemometrics. Food Chem. (2019) 289:482–9. doi: 10.1016/j.foodchem.2019.03.080
17. Rodriguez-Mendez, ML, Apetrei, C, Gay, M, Medina-Plaza, C, De Saja, JA, Vidal, S, et al. Evaluation of oxygen exposure levels and polyphenolic content of red wines using an electronic panel formed by an electronic nose and an electronic tongue. Food Chem. (2014) 155:91–7. doi: 10.1016/j.foodchem.2014.01.021
18. Facure, MH, Schneider, R, Dos Santos, DM, and Correa, DS. Impedimetric electronic tongue based on molybdenum disulfide and graphene oxide for monitoring antibiotics in liquid media. Talanta. (2020) 217:121039. doi: 10.1016/j.talanta.2020.121039
19. Duan, Z, Dong, S, Dong, Y, and Gao, Q. Geographical origin identification of two salmonid species via flavor compound analysis using headspace-gas chromatography-ion mobility spectrometry combined with electronic nose and tongue. Food Res Int. (2021) 145:110385. doi: 10.1016/j.foodres.2021.110385
20. Wang, S, Chen, H, and Sun, B. Recent progress in food flavor analysis using gas chromatography–ion mobility spectrometry (GC–IMS). Food Chem. (2020) 315:126158. doi: 10.1016/j.foodchem.2019.126158
21. Huang, Q, Dong, K, Wang, Q, Huang, X, Wang, G, An, F, et al. Changes in volatile flavor of yak meat during oxidation based on multi-omics. Food Chem. (2022) 371:131103. doi: 10.1016/j.foodchem.2021.131103
22. He, J, Ye, L, Li, J, Huang, W, Huo, Y, Gao, J, et al. Identification of ophiopogonis radix from different producing areas by headspace-gas chromatography-ion mobility spectrometry analysis. J Food Biochem. (2022) 46:e13850. doi: 10.1111/jfbc.13850
23. Lv, W, Lin, T, Ren, Z, Jiang, Y, Zhang, J, Bi, F, et al. Rapid discrimination of citrus reticulata ‘chachi’ by headspace-gas chromatography-ion mobility spectrometry fingerprints combined with principal component analysis. Food Res Int. (2020) 131:108985. doi: 10.1016/j.foodres.2020.108985
24. Garrido-Delgado, R, Arce, L, Guamán, AV, Pardo, A, Marco, S, and Valcárcel, M. Direct coupling of a gas–liquid separator to an ion mobility spectrometer for the classification of different white wines using chemometrics tools. Talanta. (2011) 84:471–9. doi: 10.1016/j.talanta.2011.01.044
25. Yang, BB, Rong, R, Lyu, QT, Jiang, HQ, Gong, LL, and Yang, Y. Analysis of the volatile components in rhubarb with different extraction methods by GC-MS. Chem Anal Meter. (2013) 22:14–6. doi: 10.3969/j.issn.1008–6145.2013.06.004
Keywords: electronic tongue, gas chromatography-ion mobility spectrometry, rhubarb, taste flavor, high-performance liquid chromatography
Citation: Liu T, Yu M, Dai Y, Xiao Y and Li L (2024) Traditional method of rhubarb processing optimized by combining flavor analysis with anthraquinone content determination. Front. Nutr. 11:1406430. doi: 10.3389/fnut.2024.1406430
Edited by:
Geraldine M. Dowling, Atlantic Technological University, IrelandReviewed by:
Xingran Kou, Shanghai Institute of Technology, ChinaZhaojun Ban, Zhejiang University of Science and Technology, China
†PRESENT ADDRESS:
Taotao Liu, Tongjunge Health,. Chongqing Taiji Industry (Group) Co. Ltd., Chongqing, ChinaCopyright © 2024 Liu, Yu, Dai, Xiao and Li. This is an open-access article distributed under the terms of the Creative Commons Attribution License (CC BY). The use, distribution or reproduction in other forums is permitted, provided the original author(s) and the copyright owner(s) are credited and that the original publication in this journal is cited, in accordance with accepted academic practice. No use, distribution or reproduction is permitted which does not comply with these terms.
*Correspondence: Li Li, bGlsaTc3NTVAMTYzLmNvbQ==