 Dereje Kutafo Meskele1
 Temesgen Lera Abiso2
 Tinsae Bekele Belete3
 Mengistu Meskele Koyira2*
 Samson Kastro Dake2
- 1Maternal, Child and Nutrition Department, Kindo Didaye District Health Office, Halale, Ethiopia
- 2School of Public Health, College of Health Sciences and Medicine, Wolaita Sodo University, Wolaita Sodo, Ethiopia
- 3Department of Public Health, Tarch Campus, Wolaita Sodo University, Dawuro, Ethiopia
Background: Nutritional deficiencies in school-age children are a public health concern, especially in resource-limited countries. A school feeding program involves the provision of food on-site or taken home to reduce hunger. It is implemented in several developing nations; however, little is known about the association of school feeding programs with the nutritional status of school-age children in the study area.
Objectives: The study aimed to determine the magnitudes and associated factors of undernutrition among school-age children with school feeding programs (SFPs) and non-school feeding programs (N-SFPs) in Kindo Didaye woreda, South Ethiopia.
Methods: A school-based comparative cross-sectional study was conducted in Kindo Didaye district from May to June 2023. A total of 612 participants were included in the study. The data were collected from each selected student's parents by using a structured interviewer-administered questionnaire. The weight and height of the children were measured, and a household dietary diversity assessment was conducted. The data were analyzed using SPSS version 25. A binary logistic regression analysis was carried out. A p-value of <0.05 and 95% confidence interval (CI) were used to establish a statistically significant association.
Results: The magnitude of undernutrition among the school-age children was 38.9%: 43.3% in the children from the SFP schools and 34.5% in the children from the N-SFP schools. Stunting was 24.1% among the children in the schools with SFPs and 16% among the children in the N-SFP schools, whereas thinness was 33.8% among the children in the SFP schools and 25.6% among the children in the N-SFP schools. The children who were in the older age group [adjusted odds ratio (AOR) = 4.4, 95%CI; 2.22–8.85], consumed less than three meals per day at home (AOR = 6.03; 95%CI 3.9–9.3), and did not eat breakfast at all before going to school (AOR = 3.5; 95%CI 1.15–10.76) were more likely to become undernourished. The children whose fathers received secondary and above education (AOR = 0.52; 95% CI (0.27–0.971) had lower odds of becoming underweight.
Conclusion: The magnitude of undernutrition was high in the current study. Existing interventions that work to improve the nutritional status of school-age children should be strengthened. Children should consume any type of food as breakfast at home before going to school regardless of the presence of school feeding programs and at least three times a day.
Introduction
Undernutrition results from inadequate intake of energy, protein, and micronutrients. It can also be caused by poor absorption or quick loss of nutrients owing to disease or excessive energy use. It is characterized by low birth weight, stunting, wasting, underweight, and micronutrient deficiencies (1, 2). School age is characterized by dynamic physical growth, mental development, and a high vulnerability stage (3). For a child who is severely malnourished, attending school is less crucial than getting enough food to eat. Children are more likely to participate in school if they are guaranteed at least one healthy meal daily. Human development progresses quickly when nutritional needs increase and dietary habits are established. To prepare for the body's rapid growth during adolescence, it is also the ideal time to increase nutrient storage. Being well-nourished during school age is essential because poor nutrition during childhood can cause malnutrition, growth impairment, decreased work ability, and poor mental and social development (4, 5).
Nutritional deficiencies in school-age children are a public health concern, especially in resource-limited countries. Stunting and thinness, which have severe consequences for survival and health and the development of school-age children, most commonly affect children in low- and middle-income countries. Approximately 52.0% of school-age children in such countries are stunted (5, 6).
According to the Global Education Monitoring Report, more than a quarter of children under the age of 15 living in Sub-Saharan Africa (SSA) were thin. The global prevalence of malnutrition among school-age children (5–15 years old), as indicated by the prevalence of stunting, was approximately 28% (171 million children), with Eastern Africa experiencing a higher rate of 45 % (7, 8).
Malnutrition among school-age children in developing nations, especially in Africa, has been linked with morbidity, hygienic practices, dietary intake, and family socioeconomic status (9–11). It is a major public health problem (12, 13). It is evident that a significant percentage of school-age children experience undernutrition and that there was no nutrition intervention for addressing the problem among school-age children in Ethiopia until 1994 (9). Different strategies, programs, policies, and interventions were adopted at international and national levels to minimize the burdens of children's nutritional status (8).
School feeding is the provision of food either on-site or to take home. In middle- and low-income countries, school feeding programs (SFPs) have two different branches of aims. In the short term, it aims to alleviate hunger, exists as a social safety net for households with very low income, increases enrolment, promotes regular attendance to improve overall performance, and reduces temporary hunger in schools (2, 14). In the long term, it aims to improve the nutritional status, attendance, cognitive development, and retention of school children (15). School-feeding programs (SFPs) have been continuously gaining popularity in developing countries, mainly among those that are severely affected by childhood hunger and malnourishment. Currently, SFPs exist in 70 of the 108 low-income and middle-income countries, and most of them have been initiated and funded by the World Food Programme.
In Ethiopia, a World Food Programme-sponsored school feeding program was started in 1994, with an initial pilot project in the war-affected zones in the Tigray region. Presently, the Ethiopian SFP provides school meals for students in six regions of the country (Afar, Amhara, Oromia, Somali, Tigray, and the Southern Nations, Nationalities, and Peoples' Region). In the country, the target areas for implementing SFPs were woreda (the third-level administrative divisions in the country), with chronic food insecurity, lower school enrolment, and higher gender disparity (14, 16). However, there is no sufficient evidence on the effect of school feeding programs on the nutritional status of school children and its associated factors, especially in Ethiopia, particularly in the study area. Therefore, this study aimed to assess the magnitudes and associated factors of undernutrition among school-age children enrolled in schools with school feeding programs and non-school feeding programs (N-SFP) in Kindo Didaye district, South Ethiopia.
Methods
Study area and period
Kindo Didaye district is one of the 16 districts in Wolaita Zone, South Ethiopia. The district is located 86 km from Wolaita Sodo city, the zonal administration center, and 475 km from Addis Ababa, the capital city of Ethiopia. The district has 19 kebeles (smallest administrative unit), where 17 are rural and two are urban kebeles, with an estimated total population of 96,120. The district has a total area of 38,045.7 hectares (17). The inhabitants of the district are primarily dependent on agriculture, and the typical meals in the district include kocho, which is manufactured from fake bananas (Ensete ventricosum), kita (primarily maize), cassavas, roots, and cereals. Teff, wheat, cassava, barley, and maize are popular crops typically grown between May and July and harvested between September and November (17). The school feeding program has been placed in 8 of the 28 primary schools in the woreda since 2020/21Gc. The total number of primary school children is 20,074; among those, 10,541 are male students and 9,533 are female students (17). The study was conducted from 1st May to 20th June 2023.
Study design
A school-based comparative cross-sectional study design was employed.
Sample population
All school-aged children in all primary schools of the woreda were the source population, all school-age children in the selected primary schools both with SFPs and N-SFPs of the woreda were the study population, and the selected school-age students (5–15 years) in the selected primary schools both with SFPs and with N-SFPs were the sample population.
Inclusion criteria and exclusion criteria
Inclusion criteria
Students aged between 5 and 15 years who attended school during the data collection in the schools with and without school feeding programs were included in this study.
Exclusion criteria
Severely ill children who could not be involved in the data collection due to an illness were excluded during the data collection period.
Sample size determination and sampling technique
The sample size was calculated using G-power software. The required sample size of the study was calculated after comparing the prevalence of stunting, thinness, and the proportion of strongly associated factors such as sex, monthly income, and having a farmland; the proportion that resulted in the maximum sample size was selected. The proportion of stunting was 58.5% among the students who did not take meals at school and 48.3% among the students who took meals at school from a study conducted in the Meket district (18). In addition, the sample size was calculated by considering the following assumptions: 95% confidence interval (CI) and 80% power, a margin of error of 5%, a population allocation ratio of 1:2, a design effect of 1.5, and a 10% non-response rate. The final sample size calculated was 616.
Sampling technique
In Kindo Didaye district, there are 28 primary schools. First, the schools in the woreda are stratified as those implementing SFPs (eight in number) and those not implementing SFPs (20 in number). Then, three from the SFP schools and six from the N-SFP schools, with a ratio of 1:2, were selected using a simple random sampling method. The calculated sample size was proportionally allocated to the selected schools based on the proportion to the size of the students from each school. The students who fulfilled the inclusion criteria were screened by the school administrators before the selection for the study. Then, the screened school-age students were coded with their grades and sections. Finally, using the student list as a sampling frame, the students were selected by the simple random sampling technique from each selected school (Figure 1).
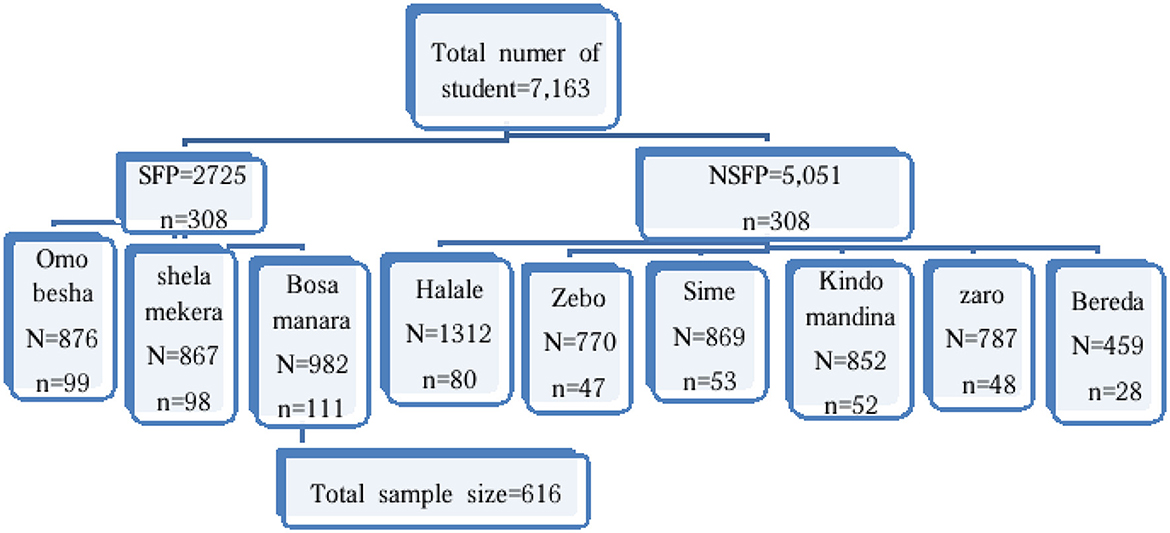
Figure 1. Schematic representation of the sampling procedure both in the SFP and N-SFP schools in Kindo Didaye woreda in 2023.
Study variables
The outcome variable was undernutrition, and the exposure variables included socio-demographic and economic variables, health status, individual dietary intake, and sanitation and hygiene conditions.
Data collection tools and measurements
The questionnaire was adapted after reviewing related previous literature (11, 14, 18–22). The data were collected using a structured interviewer-administered questionnaire via Kobo Collect software 2023.1.2 a. A part of the dietary diversity score (DDS) questionnaire was adapted from the Food and Agriculture Organization of the United Nations and other related literature (11, 23, 24). The children's dietary diversity was assessed according to their mothers' or caregivers' responses regarding whether the children had eaten different food groups from yesterday's sunrise to today's sunrise (24-h recall method) before the survey date. A child with a DDS of four and above was classified as having good dietary diversity; other scores were classified as poor. Consuming food groups within the range of 1–3 suggests lowest dietary diversity, consuming food groups within the range of 4–5 suggests medium dietary diversity, and consuming food groups within the range of 5–7 suggests high dietary diversity (25).
The weight and height of the students were measured using a weighing scale and stadiometer, respectively. A portable digital flat Seca scale (Seca electronic scale, 770 Hamburg) and a Seca body meter (Seca 274 body meter) were used to measure the weight and height, respectively. During the weight measurement, the weighing scales were calibrated each day before the actual data collection using a known weight material. The weight was measured to the nearest 0.1 kg using a digital scale. The scale was adjusted before weighing every student by setting it to zero. The students were lightly dressed while having the weight taken. The height was measured to the nearest 0.1 cm. While measuring the height, each student stood in a normal anatomical position without the shoes, heels, buttocks, shoulder, and back of the head touching the measuring board. Then, the headpiece of the measuring board was moved to touch the top of the head. For both weight and height, two readings were recorded. The z-score values for body mass index (BMI)-for-age and height-for-age were calculated using the WHO AnthroPlus software. The calculated z-scores of the BMI-for-age and height-for-age were used to classify thinness and stunting using the new WHO 2007 reference values.
Operational definition
Undernutrition
This composite outcome or dependent variable was generated by summing up the variables stunting and thinness. It is defined as having stunting, thinness, or both.
Stunting (Chronic malnutrition)
It refers to height-for-age z-score (HAZ) < −2 SD of the median value of the WHO AnthroPlus, 2007, international growth reference (26).
Thinness (Acute malnutrition)
It refers to BMI-for-age z-score (BAZ) < −2 SD of the median value of the WHO AnthroPlus, 2007, international growth reference (26).
Minimum dietary diversity score
It included the proportion of the school-aged children who received foods from four or more food groups of the seven food groups over 24 h before the survey. Consuming food groups within the range of 1–3 suggests lowest dietary diversity, consuming food groups within the range of 4–5 suggests medium dietary diversity, and consuming food groups within the range of 5–7 suggests high dietary diversity (25).
School age
The school age comprised 5–15 years (27).
Absenteeism rate
This was determined as the number of days a child was absent from school in the last 2 weeks of the survey.
Data quality management
The English version of the structured questionnaire was translated into the local language, Wolaitta Doonaa, and back to English by a language expert for ensuring the consistency of the questions. The pretest (5%) was conducted at Bele Awasa and Dinsa primary schools in Kindo Koysha district. To ensure the accuracy and precision of the measurements, the data collectors were trained for 2 days on how to administer the questionnaire, use Kobo Collector version 2023.1.2, and conduct anthropometry in a standardized manner. The weighing scale calibration with a standard weight was performed daily during the data collection. Each day after the data collection, the questionnaires were reviewed to ensure the completeness of the data.
Data analysis
The data were exported to Excel from the KoboCollect tool and then to SPSS version 25 software for analysis. Descriptive statistics such as frequency, proportion, measures of central tendency, and measures of dispersion were computed. A logistic regression model was carried out for both bivariable and multivariable analysis for identifying factors associated with undernutrition. A p-value ≤ 0.25 was taken as the cut-off point for selecting variables for the final model. An adjusted odds ratio (AOR) with its respective 95% CI was used to establish a statistically significant association at a p-value < 0.05. After checking for multicollinearity by using a variance inflation factor, a variance inflation factor of < 10 was considered the minimum threshold for collinearity. The model fitness was checked using the Hosmer and Lemeshow model fitness.
Ethical considerations
Ethical clearance was obtained from the Institutional Review Committee of Wolaita Sodo University, with an ethical review number of CHSM/ERC/01/15, and a permission letter was obtained from the Kindo Didaye district education office for the data collection. From the participants involved, verbal informed consent and assent were taken; the right to not participate was respected, and the obtained information was confidential.
Results
Participants' socio-demographic and socioeconomic characteristics
A total of 612 school children were involved in the study, which made the response rate 99%. Of the 305 students from the schools with SFPs, 188 (53.1%) were male and 117 (46.9%) were female. Of 307 participants from the schools with N-SFPs, 163 (61.6%) were male and 144 (38.4%) were female. The median age of the school children was 12, with an interquartile range of 3 years. The majority of the school children, both male and female, were in the 10–15 age category, 248 (80.8%) and 280 (91.8%), respectively (Table 1).
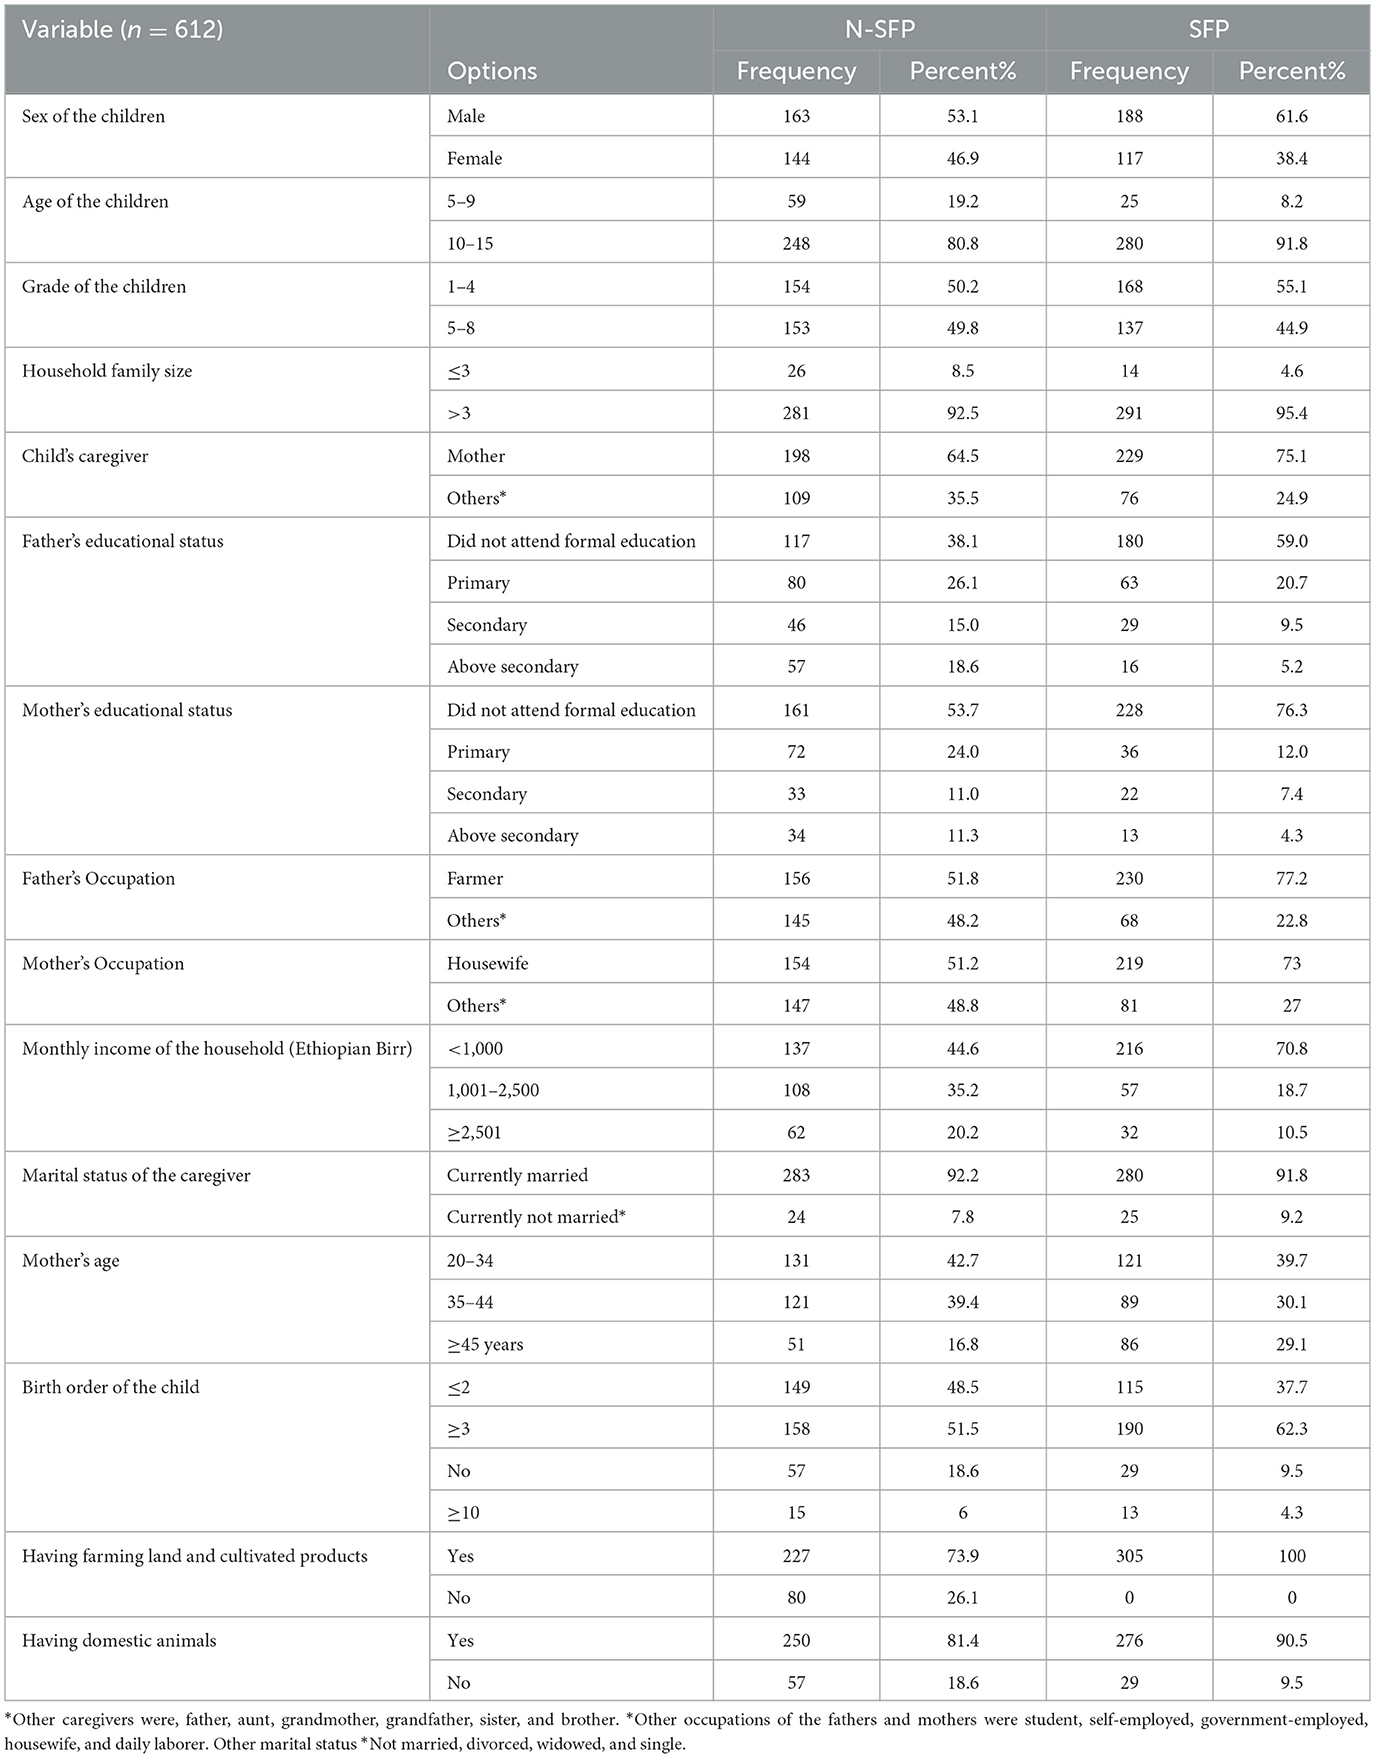
Table 1. Socio-demographic and economic characteristics of the participants in the schools with SFPs and non-SFPs in Kindo Didaye district, 2023.
Dietary history of the participants
All students enrolled in the schools with SFPs ate once in school, and each student got 150 g of a meal prepared from wheat, nifro, kimchi, rice, pasta, and macaroni once a day from Monday to Friday. The majority of the school children on the school feeding program were found to eat < 2 times at home in a day, while those in the schools without a school feeding program were found to eat comparatively less. The majority, 188 (61.2), of the children from the schools without a school feeding program were found to take their breakfast at home every morning before going to school, while nearly a third, 111 (36.3%), of the children from the schools with a school feeding program were found to go to school without eating breakfast (Table 2).
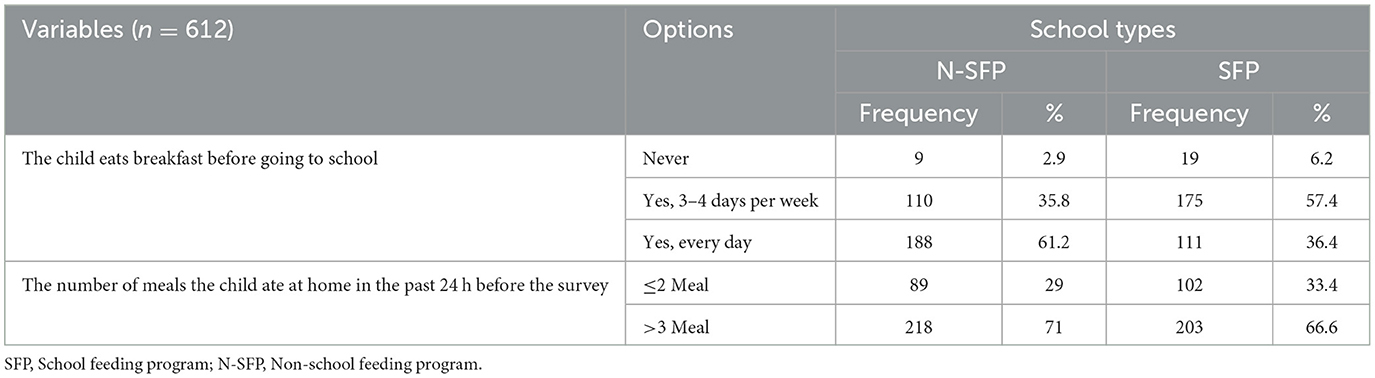
Table 2. Feeding characteristics of the children from both SFP schools and N-SFP schools in Kindo Didaye district, 2023.
According to the 24-h dietary recall, the number of food groups eaten within 24 h before the survey by the majority of the students from the schools with a school feeding program was < 3, approximately 228 (74.8%), while nearly half of the children from the non-school feeding program schools ate more than three food groups within 24 h (Figure 2). The dietary intake of the school children mainly consisted of cereals, pulses, legumes, nuts, roots, tubers, other fruits, and vegetables compared to animal source foods and green leafy vegetables. In the study, the students from both the schools with SFPs and the non-school feeding program schools were less likely to consume food groups such as meats, eggs, and vitamin A-rich fruits and vegetables.
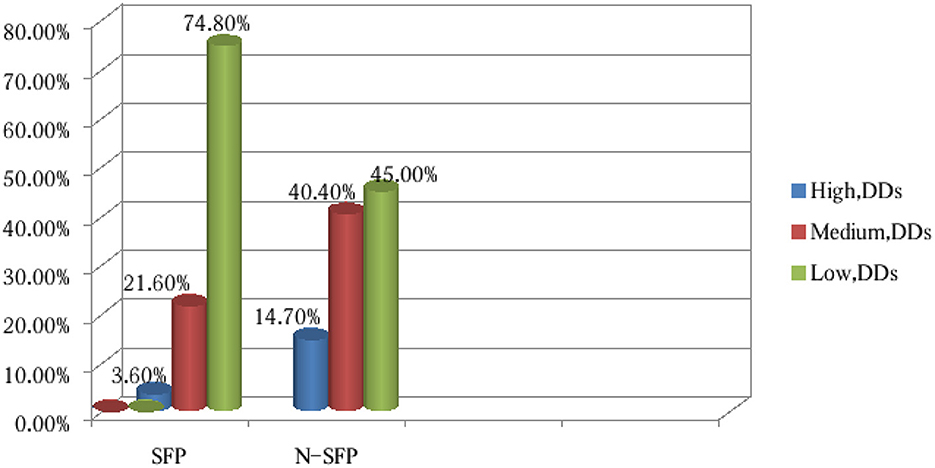
Figure 2. Dietary assessments of the last 24 h before the survey of the children from the SFP schools and N-SFP schools in Kindo Didaye woreda, 2023 (n = 612).
Participants' incidence of ill health
The number of children who had fallen sick within 2 weeks before the data collection, as reported by the caregivers, was 89 (29.2%) from the schools with school feeding programs and 70 (28.2 %) from the non-school feeding program schools. Fifty-one (16.7%) children from the schools with SFPs and 28 (9.1%) children from the non-SFP schools had diarrhea 2 weeks before the data collection. Following episodes of malaria 2 weeks preceding the survey, the parents of 46 (15.1%) children in the schools with a school feeding program and of 34 (11.1 %) children in the N-SFP schools reported that their children had fever (Table 3). Malaria and other infections present symptoms such as fever. Malaria being endemic in these communities could be the reason why both groups mentioned fever as the primary ailment in their children.
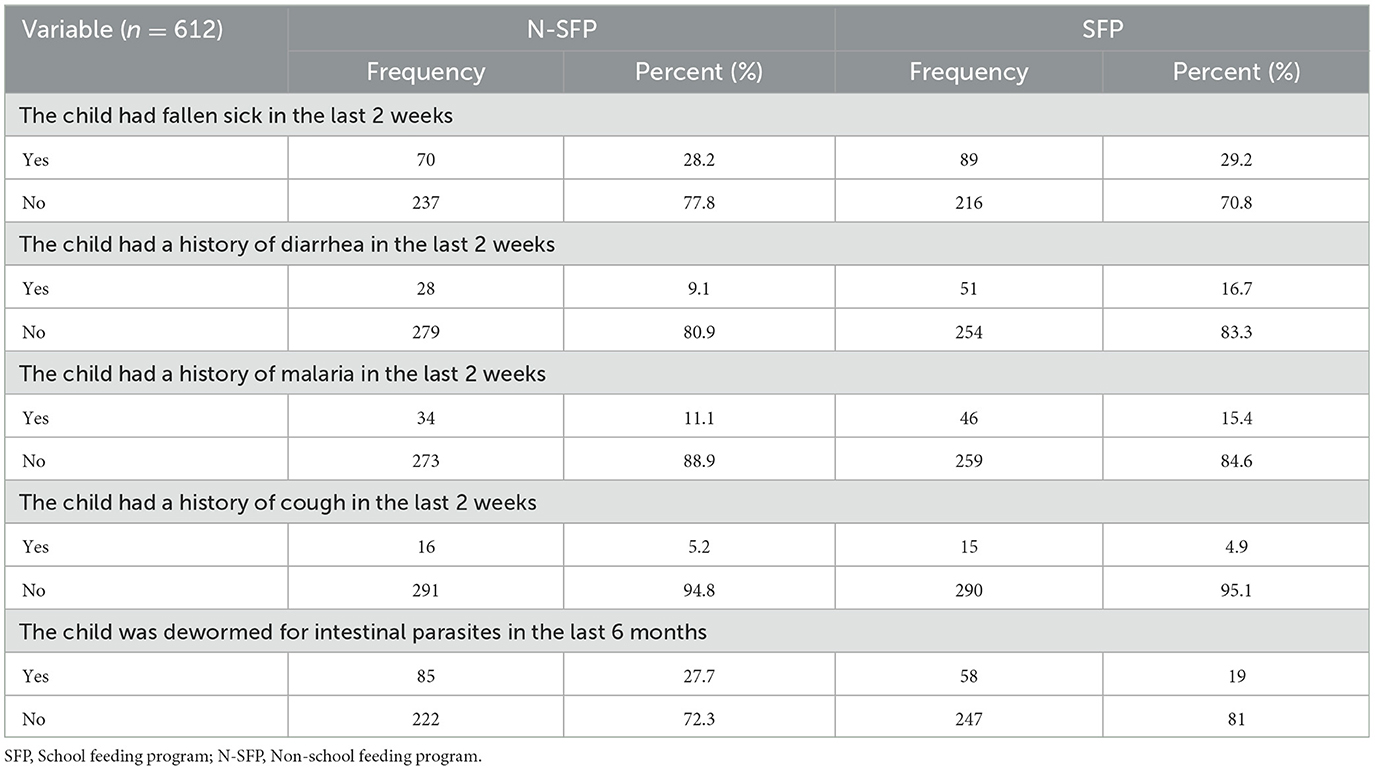
Table 3. The incidence of ill health among the children in the last 2 weeks before the survey in both SFP and N-SFP schools in Kindo Didaye district, 2023.
Participants' sanitation and hygiene
All the schools had latrines, but none of them had hand-washing facilities. The majority of the households of the students from both groups had a latrine (99% and 96.1%), and the type of latrine used in the majority of the households of the students from both groups was a pit latrine without a slab, 286 (93.7%), and only two households from the SFP group and one household from the N-SFP group had a ventilated pit latrine. Twelve households from the SFP group and three households from the N-SFP group had no latrines and used open fields for defecation. The primary source of drinking water for 204 (66.9%) households of the children from the SFP group and for 226 (73.4%) households of the children from the N-SFP group was protected sources such as tap water. Protected springs as a source of drinking water were found in 75 (24.6%) of the households of the children from the SFP group and 70 (22.8%) of the households of the children from the N-SFP group. However, 8.6% and 3.6% of the households of the students from the SFP group and the N-SFP group, respectively, sourced their drinking water from unprotected sources, such as unprotected springs, ponds, and surface water. Approximately 58.9% and 61.6% of the students from the N-SFP group and the SFP group, respectively, were found to wash their hands before eating food. However, more than half of the children in both groups did not always wash their hands with soap after using the toilet (Table 4).
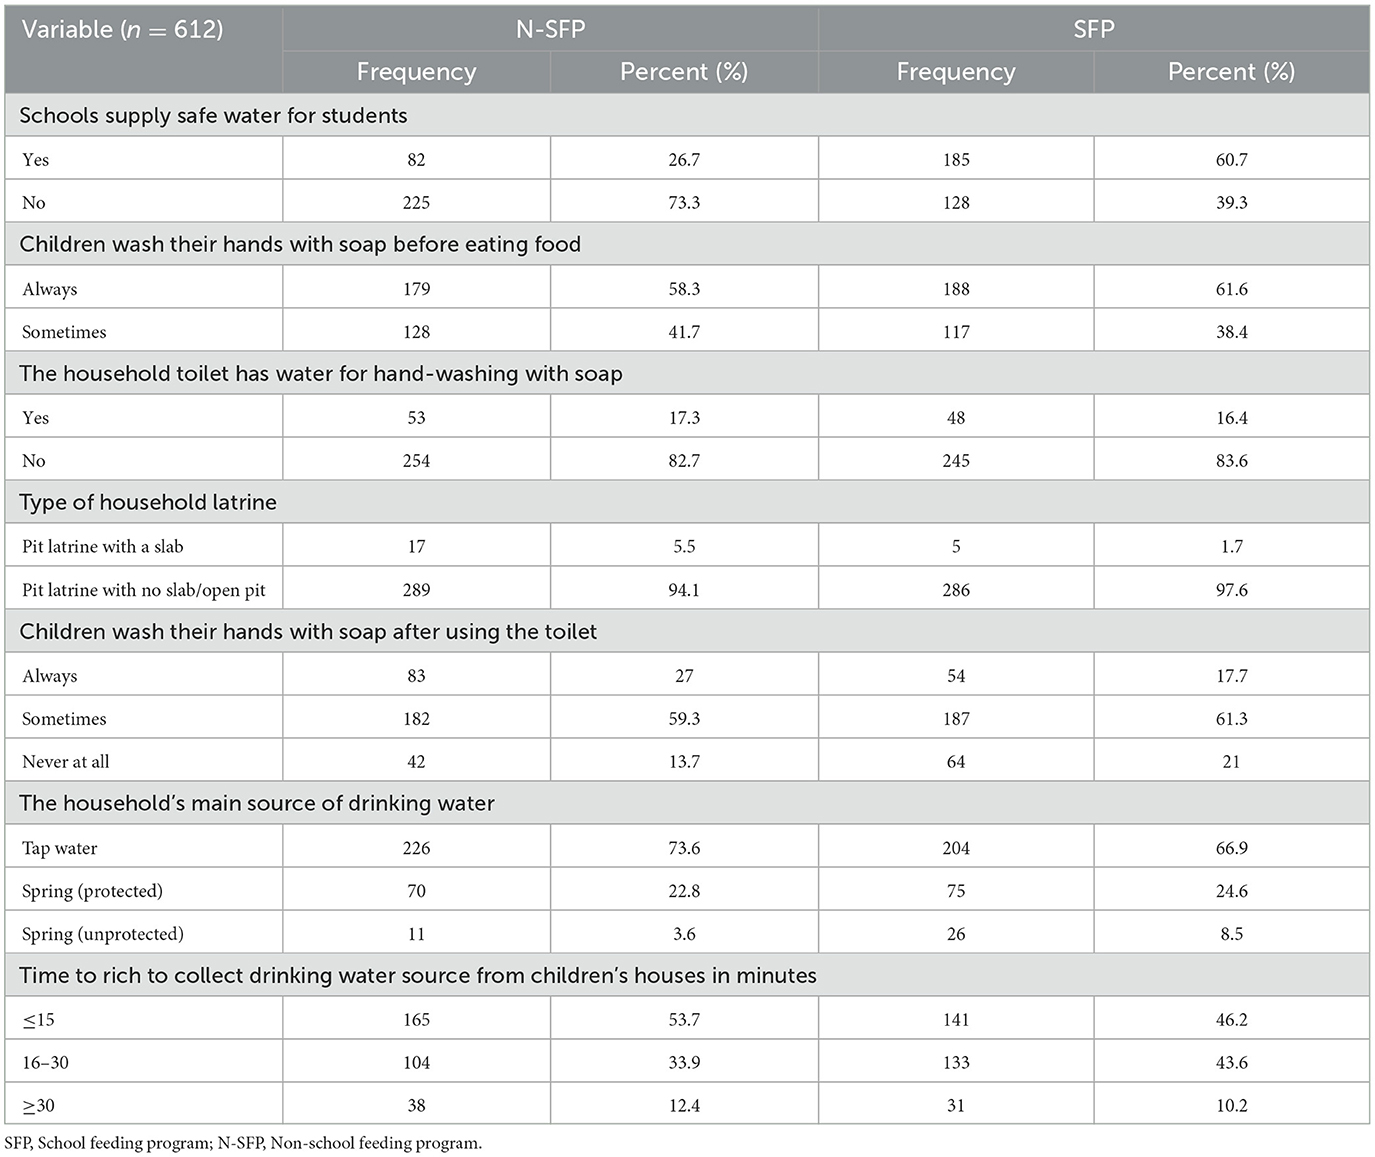
Table 4. Sanitation and hygiene condition of the participants in both SFP and N-SFP groups in Kindo Didaye district, 2023.
Nutritional status of the school-age children
The overall prevalence of undernutrition was observed in 238 (38.9%) children in total, 132 (43.3%) among the children in the schools with an SFP and 106 (34.5%) among the children in N-SFP schools. The magnitude of thinness was observed in 33.8% of the children in the schools with an SFP and in 25.6% of the children in the N-SFP schools. In addition, the prevalence of stunting was observed in 24.1% of the children in the schools with an SFP and in 16.0% of the children in the N-SFP schools (Figure 3).
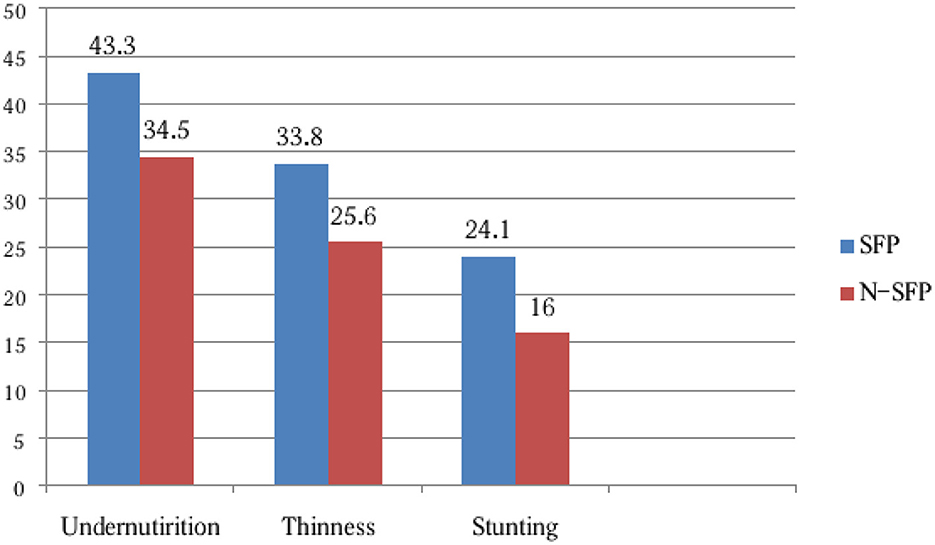
Figure 3. Nutritional status of the school-age children in both SFP and N-SFP groups in Kindo Didaye district, 2023 (n = 612).
Factors associated with undernutrition in both SFP and N-SFP schools
In the multivariable logistic regression model, the age of the child, the father's educational status, eating breakfast before going to school, and the frequency of meals were significantly associated with undernutrition. The children in the older age group (10–15 years) were 4.4 (AOR = 4.4, 95% CI: 2.22, 8.85) times more likely to be undernourished than the children in the younger age group. In addition, the odds of undernutrition among the children whose fathers received secondary education and above was 48% (AOR = 0.52, 95% CI: 0.27, 0.97), which was lower compared to the children whose fathers did not receive formal education. In addition, the children who never ate breakfast before going to school were 3.5 (AOR = 3.5, 95% CI: 1.15, 10.76) times more likely to be undernourished than those who always ate breakfast before school. The odds of undernutrition were six (AOR = 6.0, 95% CI: 3.91, 9.32) times higher among the children who consumed two or fewer meals a day than the children who consumed more than two meals a day (Table 5).
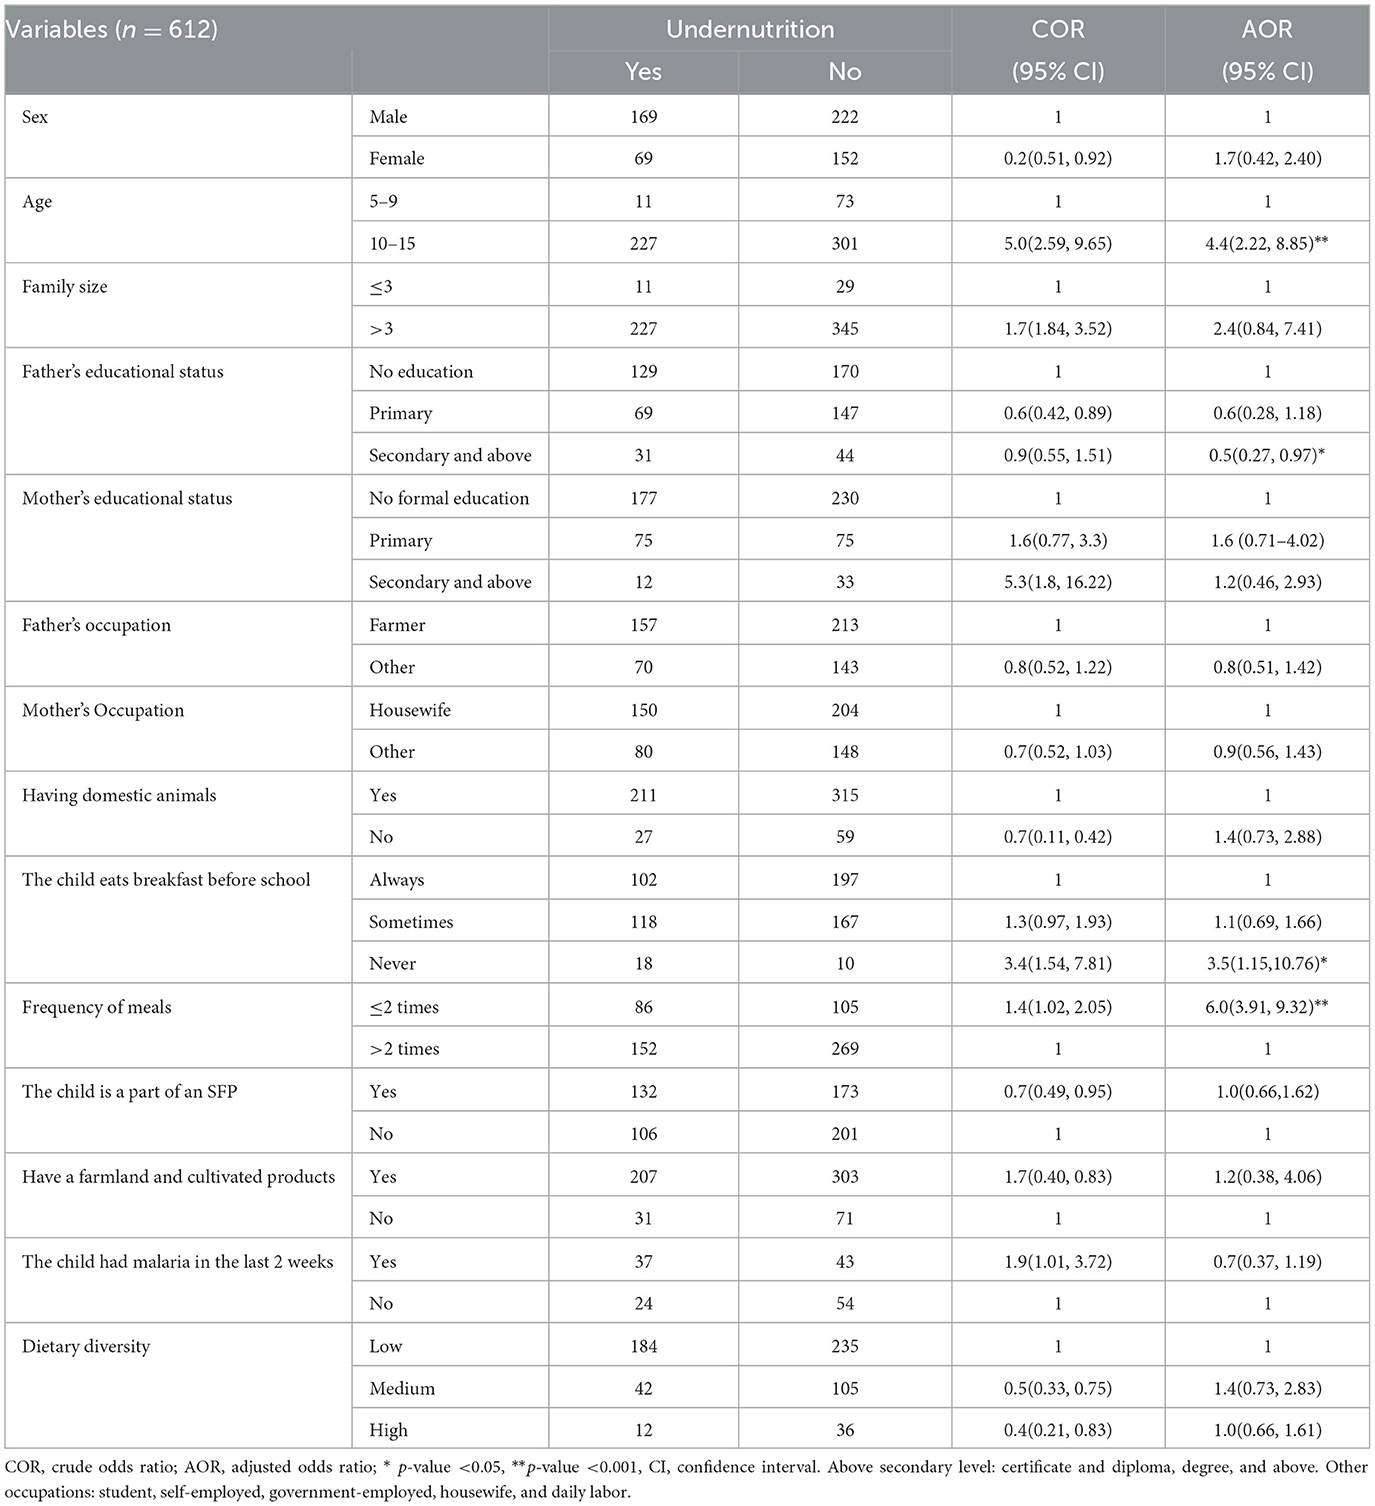
Table 5. Multivariable logistic regression analysis of the factors associated with undernutrition of the children in both SFP and N-SFP schools in Kindo Didaye district, 2023.
Discussion
This study attempted to determine the prevalence of undernutrition and identify its associated factors. The results of the current study showed that the overall prevalence of undernutrition was 38.9%, 43.3% and 34.5% among the children in the SFP group and the N-SFP group, respectively. The study findings also revealed that the children from the older age group (10–15 years), the children whose fathers received secondary education and above, the children who never ate breakfast before school, and the children who consumed two or fewer meals a day were statistically significantly associated with undernutrition.
In this study, the overall prevalence of undernutrition was 38.9%. Undernutrition was higher (43.3%) among the children in the SFP schools as compared to the children in the N-SFP schools (34.5%). The magnitude was higher than the findings reported by studies conducted in Addis Ababa (31%), Durbete town (32.1%), and Ethiopia (12, 28). This finding was lower than the prevalence reported in Northwest Ethiopia, which was 41.6% and 71.98%, respectively (29, 30). The magnitude of thinness in the current study was 33.8% and 25.6% in the schools with SFP and in the N-SFP schools, respectively, whereas stunting was 24.1% and 16% in the schools with SFP and in the N-SFP schools, respectively. This result was higher than that of a study conducted in Southern Ethiopia, which revealed that the prevalence of thinness was 14.3% and 19.5% and that of stunting was 21.1% and 20.4% in SFP and N-SFP schools, respectively (31). The prevalence of stunting and thinness in Ethiopia's Dubti district in the Afar region was also lower than the results of the current study. In the abovementioned study, the prevalence of stunting in the SFP and N-SFP schools was 13.7% and 21.6%, respectively, and the prevalence of thinness was 4.9% in SFP schools and 13.9% in N-SFP schools (32). Similarly, a study in Kenya found that the prevalence of thinness was 12% in SFP schools and 11% in N-SFP schools, whereas the prevalence of stunting was 12% in SFP schools and 22% in N-SFP schools (9). In addition, the prevalence of thinness in this study was higher than that in the study demonstrated by Mohammed et al., which was 23.2% and 22.71% in SFP and N-SFP schools, respectively. However, the prevalence of stunting was lower than that in the same study, 31.5% and 26.3%, among the children in the SFP and N-SFP schools, respectively (11). These differences may be due to differences in the sample size, study setting, and study purposes.
In this study, it was found that there was no statistically significant association between school feeding programs and undernutrition. This finding was in line with other studies conducted in Southern Ethiopia (31) and Ghana (33), which showed that school feeding programs had no association with the nutritional status of children. Contrary to this, a study in Kenya (9) showed that school feeding programs had a negative association with the nutritional status of children. However, the result contrasted with studies conducted in different parts of Ethiopia (14, 18, 20, 32, 34), Kenya (35), Jamaica (36), and Ghana (21). The possible explanation for this discrepancy could be variations in the duration of intervention, availability of the required resources in schools, and the quality and quantity of foods served to children. Reports showed that in developing countries, school feeding programs were facing different challenges related to the quality and quantity of meals given to children (15, 37–39).
Furthermore, evidence from studies showed that SFPs have led to children being fed less at home. This is because some parents use the SFP as a replacement for feeding at home, even though it is meant to complement the child's diet along with home feeding (40). In addition, school feeding programs are implemented in selected schools located in areas where there is food insecurity (40).
The current study revealed that being in the older age group was positively associated with undernutrition. The odds of undernutrition were 4.4 times higher among the children aged between 10 and 15 years compared to the children aged 5 to 9 years. A similar finding was reported by a study conducted in different parts of Ethiopia (11, 16, 29, 34, 41–43). This might be due to experiencing a prolonged chronic food shortage. The consequence of undernutrition is a chronic nutritional problem, which develops over a relatively long period and is difficult to reverse once developed.
According to this study, the odds of undernutrition among the school children whose fathers received secondary education were 48% lower compared to the children whose fathers did not receive formal education. This finding was also similar to the findings from other studies conducted in South Ethiopia (42), Assam (44), Nepal (45), and India (6). This might be because literate parents adopt many improved behaviors related to maternal and child healthcare, feeding, and eating practices, which ultimately affect the nutritional status of children.
The odds of undernutrition among the children who never ate breakfast before school were 3.5 times those of undernutrition among the children who ate breakfast regularly before school. This was similar to previous studies in South Gondar Zone, Ethiopia (22), Kenya (3), and Nigeria (46). This could be because eating breakfast is crucial for getting enough nutrients and energy to prevent acute and chronic malnutrition in school-age children.
The frequency of meals that children take at home is another factor independently associated with undernutrition. The odds of undernutrition were six times higher among the children who ate < 3 meals a day compared to those who ate three or more meals a day. Previous studies in Meket Wereda, Ethiopia (18) in East Demibra district, Northwest Ethiopia (47), Nairobi, Kenya (3), and in Aladinma Owerri, Nigeria (46) showed similar results. This might be because those who eat < 3 times a day cannot meet the nutrient requirements.
This study used cross-sectional data, and the estimates might have been better represented if longitudinal follow-up data were used. Moreover, the school feeding intervention was not randomized; rather, schools were selected for the intervention based on the food insecurity and socioeconomic status of the area. Therefore, it is difficult to conclude that the school-feeding programs contributed to the higher undernutrition level. A certain level of recall bias is expected regarding the age and dietary intake. Interviewers who were aware of cultural issues collected the data to reduce recall bias.
Conclusion
This study showed that the overall magnitude of undernutrition in the study area is high. Existing interventions that work to improve the nutritional status of school-age children should be strengthened. Children should consume any type of food as breakfast at home before going to school regardless of the presence of a school feeding program, and children should at least consume meals three times a day. We also recommend conducting longitudinal studies to explore further the effect of school feeding programs on the nutritional status of school-age children.
Data availability statement
The original contributions presented in the study are included in the article/supplementary material, further inquiries can be directed to the corresponding author.
Author contributions
DM: Conceptualization, Data curation, Formal analysis, Investigation, Methodology, Software, Visualization, Writing – original draft. TA: Data curation, Methodology, Writing – original draft, Visualization, Conceptualization, Writing – review & editing, Validation, Investigation, Supervision. TB: Validation, Data curation, Conceptualization, Visualization, Writing – original draft. MK: Conceptualization, Writing – review & editing, Validation, Methodology, Supervision, Software, Visualization, Data curation. SD: Conceptualization, Writing – review & editing, Investigation, Visualization, Supervision, Methodology, Data curation.
Funding
The author(s) declare that no financial support was received for the research, authorship, and/or publication of this article.
Acknowledgments
We would like to forward our gratitude to the College of Health Sciences and Medicine, Wolaita Sodo University. We also would like to thank the participants, data collectors, school principals, and data collection supervisors.
Conflict of interest
The authors declare that the research was conducted in the absence of any commercial or financial relationships that could be construed as a potential conflict of interest.
Publisher's note
All claims expressed in this article are solely those of the authors and do not necessarily represent those of their affiliated organizations, or those of the publisher, the editors and the reviewers. Any product that may be evaluated in this article, or claim that may be made by its manufacturer, is not guaranteed or endorsed by the publisher.
Abbreviations
AOR, Adjusted odds ratio; BAZ, BMI-for-age z-score; BMI, Body mass index; CI, Confidence interval; COR, Crude odds ratio; HAZ, Height-for-age z-score; MDDS, Minimum Dietary Diversity Score; N-SFP, Non-school feeding program; SD, Standard deviation; SFP, School feeding program; SPSS, Statistical Package for Social Science; SSA, Sub-Saharan Africa.
References
1. Organization WH. Physical status: The use of and interpretation of anthropometry. Report of a WHO Expert Committee: World Health Organization (1995).
3. Mwaniki E, Makokha A. Nutrition status and associated factors among children in public primary schools in Dagoretti, Nairobi, Kenya. Afr Health Sci. (2013) 13:38–46. doi: 10.4314/ahs.v13i1.6
4. World Health Organization. Adolescent nutrition: a review of the situation in selected South-East Asian countries. (2006).
5. Assemie MA, Alamneh AA, Ketema DB, Adem AM, Desta M, Petrucka P, et al. High burden of undernutrition among primary school-aged children and its determinant factors in Ethiopia; a systematic review and meta-analysis. Ital J Pediatr. (2020) 46:118. doi: 10.1186/s13052-020-00881-w
6. Srivastava A, Mahmood SE, Srivastava PM, Shrotriya VP, Kumar B. Nutritional status of school-age children-A scenario of urban slums in India. Arch Public Health. (2012) 70:1–8. doi: 10.1186/0778-7367-70-8
7. De Onis M, Blössner M, Borghi E. Prevalence and trends of stunting among pre-school children, 1990–2020. Public Health Nutr. (2012) 15:142–8. doi: 10.1017/S1368980011001315
8. Ayele S, Zegeye EA, Nisbett N. Multi-sectoral nutrition policy and programme design, coordination and implementation in Ethiopia. Brighton: IDS (2020).
9. Neervoort F, von Rosenstiel I, Bongers K, Demetriades M, Shacola M, Wolffers I. Effect of a school feeding programme on nutritional status and anaemia in an urban slum: a preliminary evaluation in Kenya. J Trop Pediatr. (2013) 59:165–74. doi: 10.1093/tropej/fms070
10. Tunje DS. Prevalence and Determinants of Malnutrition among Primary School Children in Kilifi district. Kenya: University of Nairobi (2012).
11. Mohammed H. Assesment of nutrational status and associated factors in children: a comparative study between school fedding and non school feeding programme in amibera district afar region, Ethiopia, 2018. Samara University (2018).
12. Alelign T, Degarege A, Erko B. Prevalence and factors associated with undernutrition and anaemia among school children in Durbete Town, northwest Ethiopia. Arch Public Health. (2015) 73:1–7. doi: 10.1186/s13690-015-0084-x
13. Amare B, Moges B, Fantahun B, Tafess K, Woldeyohannes D, Yismaw G, et al. Micronutrient levels and nutritional status of school children living in Northwest Ethiopia. Nutr J. (2012) 11:1–8. doi: 10.1186/1475-2891-11-108
14. Ayehu SM, Sahile AT. Body mass index and associated factors of school absenteeism by school feeding program at selected primary schools in Addis Ababa, Ethiopia: a comparative study. Scientifica. (2021) 2021:6671468. doi: 10.1155/2021/6671468
15. Jomaa LH, McDonnell E, Probart C. School feeding programs in developing countries: impacts on children's health and educational outcomes. Nutr Rev. (2011) 69:83–98. doi: 10.1111/j.1753-4887.2010.00369.x
16. Getaneh Z, Melku M, Geta M, Melak T, Hunegnaw MT. Prevalence and determinants of stunting and wasting among public primary school children in Gondar town, northwest, Ethiopia. BMC Pediatr. (2019) 19:1–11. doi: 10.1186/s12887-019-1572-x
18. Demilew YM, Nigussie AA. Nutritional status and associated factors among primary school students. In: Meket Wereda, Ethiopia: comparing schools with feeding and non-feeding program. (2020). doi: 10.21203/rs.2.12672/v2
19. Teferi DY, Atomssa GE, Mekonnen TC. Overweight and undernutrition in the cases of school-going adolescents in Wolaita Sodo Town, Southern Ethiopia: cross-sectional study. J Nutr Metabol. (2018) 2018:8678561. doi: 10.1155/2018/8678561
20. Zenebe M, Gebremedhin S, Henry CJ, Regassa N. School feeding program has resulted in improved dietary diversity, nutritional status and class attendance of school children. Ital J Pediatr. (2018) 44:1–7. doi: 10.1186/s13052-018-0449-1
21. Agbozo F, Atitto P, Abubakari A. Nutritional status of pupils attending public schools with and without school feeding programme in Hohoe municipality GHANA. J Food Nutr Res. (2017) 5:467–474. doi: 10.12691/jfnr-5-7-3
22. Yisak H, Tadege M, Ambaw B, Ewunetei A. Prevalence and determinants of stunting, wasting, and underweight among school-age children aged 6–12 years in South Gondar Zone, Ethiopia. Pediatr Health, Med Therap. (2021) 12:23–33. doi: 10.2147/PHMT.S287815
23. Kennedy G, Razes M, Ballard T, Dop MC. Measurement of Dietary Diversity for Monitoring the Impact of Food Based Approaches. Rome: International symposium on food and nutrition security (2010).
24. Food, Nations AOotU. A manual from the English-speaking Caribbean: developing food-based dietary guidelines. Rome: Food and Agriculture Organization of the United Nations (2007).
25. Kennedy G, Ballard T, Dop MC. Guidelines for Measuring Household and Individual Dietary Diversity. Rome: Nutrition and Consumer Protection Division, Food and Agriculture Organization of the United Nations (2011).
26. Onis Md, Onyango AW, Borghi E, Siyam A, Nishida C, Siekmann J. Development of a WHO growth reference for school-aged children and adolescents. Bull World Health Organ. (2007) 85:660–7. doi: 10.2471/BLT.07.043497
27. De Benoist B, Cogswell M, Egli I, McLean E. Worldwide prevalence of anaemia 1993–2005; WHO global database of anaemia. Cambridge University Press (2008).
28. Degarege D, Degarege A, Animut A. Undernutrition and associated risk factors among school age children in Addis Ababa, Ethiopia. BMC Public Health. (2015) 15:1–9. doi: 10.1186/s12889-015-1714-5
29. Hailegebriel T. Undernutrition, intestinal parasitic infection and associated risk factors among selected primary school children in Bahir Dar, Ethiopia. BMC Infect Dis. (2018) 18:1–11. doi: 10.1186/s12879-018-3306-3
30. Tebeje DB, Agitew G, Mengistu NW, Aychiluhm SB. Under-nutrition and its determinants among school-aged children in northwest Ethiopia. Heliyon. (2022) 8:e11235. doi: 10.1016/j.heliyon.2022.e11235
31. Desalegn TA, Gebremedhin S, Stoecker BJ. Effect of school feeding program on the anthropometric and haemoglobin status of school children in Sidama region, Southern Ethiopia: a prospective study. J Nutr Sci. (2022) 11:e69. doi: 10.1017/jns.2022.73
32. Hussein K, Mekonnen TC, Hussien FM, Alene TD, Abebe MS. School feeding and nutritional status of students in Dubti District, Afar, Northeast Ethiopia: comparative cross-sectional study. Pediat Health Med Therape. (2023) 12:217–30. doi: 10.2147/PHMT.S412740
33. Danquah A, Amoah A, Steiner-Asiedu M, Opare-Obisaw C. Nutritional status of participating and non-participating pupils in the Ghana School Feeding Programme. J Food Res. (2012) 1:263. doi: 10.5539/jfr.v1n3p263
34. Tariku EZ, Abebe GA, Melketsedik ZA, Gutema BT. Prevalence and factors associated with stunting and thinness among school-age children in Arba Minch Health and Demographic Surveillance Site, Southern Ethiopia. PLoS ONE. (2018) 13:e0206659. doi: 10.1371/journal.pone.0206659
35. Rabiu KM, Idoko SA, Ganiyu AI. Effect of school feeding programme on nutritional balance in primary school pupils in Kano. Metrop Fudma J Sci. (2023) 7:256–64. doi: 10.33003/fjs-2023-0702-1689
36. Grantham-McGregor SM, Chang S, Walker SP. Evaluation of school feeding programs: some Jamaican examples. Am J Clin Nutr. (1998) 67:785S−9S. doi: 10.1093/ajcn/67.4.785S
37. Ahmed AU. Impact of Feeding Children in School: Evidence from Bangladesh. Washington, DC: International Food Policy Research Institute (2004).
38. Powell CA, Walker SP, Chang SM, Grantham-McGregor SM. Nutrition and education: a randomized trial of the effects of breakfast in rural primary school children. Am J Clin Nutr. (1998) 68:873–9. doi: 10.1093/ajcn/68.4.873
39. Kwabla MP, Gyan C, Zotor F. Nutritional status of in-school children and its associated factors in Denkyembour District, eastern region, Ghana: comparing schools with feeding and non-school feeding policies. Nutr J. (2018) 17:1–8. doi: 10.1186/s12937-018-0321-6
40. Greenhalgh T, Kristjansson E, Robinson V. Realist review to understand the efficacy of school feeding programmes. BMJ. (2007) 335:858–61. doi: 10.1136/bmj.39359.525174.AD
41. Bogale TY, Bala ET, Tadesse M, Asamoah BO. Prevalence and associated factors for stunting among 6–12 years old school age children from rural community of Humbo district, Southern Ethiopia. BMC Public Health. (2018) 18:1–8. doi: 10.1186/s12889-018-5561-z
42. Argaw D, Kabthymer RH, Endale T, Wudneh A, Meshesha MD, Hirbu JT, et al. Stunting and associated factors among primary school children in Ethiopia: school-based cross-sectional study. Int J Africa Nurs Sci. (2022) 17:100451. doi: 10.1016/j.ijans.2022.100451
43. Herrador Z, Sordo L, Gadisa E, Moreno J, Nieto J, Benito A, et al. Cross-sectional study of malnutrition and associated factors among school aged children in rural and urban settings of Fogera and Libo Kemkem districts, Ethiopia. PLoS ONE. (2014) 9:e105880. doi: 10.1371/journal.pone.0105880
44. Dey AK, Nath AB. Nutritional status of school going children (6–15 years) in a semi-urban area of Cachar District, Assam. J Evol Med Dental Sci. (2017) 6:4057–62. doi: 10.14260/Jemds/2017/877
45. Hs J, Gupta R, Joshi M, Vipul M. Determinants of nutritional status of school children-a cross sectional study in the western region of Nepal. NJIRM. (2011) 2:1–13.
46. Nnebue CC, Ilika AL, Uwakwe KA, Duru CB, Onah SK, Abu HO, et al. Feeding practices and determinants of the nutritional status of pupils in a public primary school in Aladinma Owerri, Nigeria. Int J. (2016) 4:12–8.
Keywords: under-nutrition, school-age children, school feeding program, Kindo Didaye district under-nutrition, Non-school feeding program
Citation: Meskele DK, Abiso TL, Belete TB, Koyira MM and Dake SK (2024) Undernutrition and associated factors among school-age children in Wolaita Zone, South Ethiopia: a comparative cross-sectional study. Front. Nutr. 11:1400276. doi: 10.3389/fnut.2024.1400276
Received: 13 March 2024; Accepted: 28 August 2024;
Published: 18 September 2024.
Edited by:
Reza Rastmanesh, American Physical Society, United StatesReviewed by:
Marina Tandoh, Kwame Nkrumah University of Science and Technology, GhanaKelli George, West Virginia University, United States
Irene Martínez-García, University of Castilla La Mancha, Spain
Copyright © 2024 Meskele, Abiso, Belete, Koyira and Dake. This is an open-access article distributed under the terms of the Creative Commons Attribution License (CC BY). The use, distribution or reproduction in other forums is permitted, provided the original author(s) and the copyright owner(s) are credited and that the original publication in this journal is cited, in accordance with accepted academic practice. No use, distribution or reproduction is permitted which does not comply with these terms.
*Correspondence: Mengistu Meskele Koyira, bWVuZ2lzdHU3N0BnbWFpbC5jb20=