 Huang Runting
 Luo Qingyue1
 Yang Shu
- 1Department of Public Health, Chengdu Medical College, Chengdu, China
- 2School of Medical Information Engineering, Chengdu University of Traditional Chinese Medicine, Chengdu, China
Introduction: Bone mineral density (BMD) is a crucial index for predicting fracture risk and diagnosing osteoporosis. With the global rise in osteoporosis prevalence, understanding the relationship between dietary patterns and BMD is vital for public health. This study aimed to explore the association between various dietary patterns and BMD among adults using data from the National Health and Nutrition Examination Survey (NHANES).
Methods: Data were analyzed from 8,416 NHANES participants aged 40 years and older across three non-consecutive survey cycles from 2013 to 2020. Dietary patterns were identified using a combination of factor analysis and cluster analysis. BMD measurements were then assessed, and associations with the identified dietary patterns were analyzed, with adjustments made for demographic variables.
Results: The analysis identified three distinct dietary patterns: “Low protein-High Dietary fiber-Vitamin A-Magnesium (LP-HDF-Vit A-Mg)”, “High macronutrient-Choline-Selenium (HM-Cho-Se)”, and “Low macronutrient-Vitamin D-Calcium (LM-Vit D-Ca)”, and then we found that women, older adults, and certain ethnic groups were at higher risk for low BMD. Participants adhering to the “HM-Cho-Se” and “LP-HDF-Vit A-Mg” dietary patterns exhibited significantly higher BMD compared to those following the “LM-Vit D-Ca” pattern. After adjusting for demographic variables, the “HM-Cho-Se” pattern remained positively associated with BMD, while the “LM-Vit D-Ca” pattern showed no significant association with BMD or the risk of low BMD.
Discussion: The findings suggest that adherence to the “HM-Cho-Se” dietary pattern may reduce the risk of low BMD, indicating potential synergies between these nutrients for bone health. However, the study has limitations, including the cross-sectional design and potential subjectivity in factor analysis. Future research should focus on longitudinal studies involving diverse age groups to better understand the causal relationship between dietary patterns and BMD. Despite these limitations, the study highlights the importance of dietary factors in maintaining bone health and suggests potential dietary interventions to reduce the risk of low BMD and osteoporosis.
1 Introduction
Bone mineral density (BMD) is a crucial indicator of bone mass per unit volume or area, serving as a significant predictor of fracture risk, an essential diagnostic parameter for osteoporosis and osteopenia, and a prevalent metric for evaluating bone health (1). It is of great concern that individuals with low BMD face a significantly elevated risk of developing osteoporosis and sustaining fractures. Osteoporosis results in a reduction in bone strength and resilience, rendering even minor traumas sufficient to cause fractures, particularly in the hip, spine, and wrist. Among these, hip fractures are of particular concern, as they often necessitate surgical intervention and carry a high mortality rate (2). A significant increase in mortality is observed in elderly patients within the first year after a hip fracture, largely due to complications from surgery and prolonged bed rest, such as infections, blood clots, and cardiorespiratory failure (3).
In the 21st century, osteoporosis due to low BMD has emerged as one of the top five global diseases, with a prevalence of 23.1% in women and 11.7% in m en. This condition has become a significant public health concern, imposing substantial economic burdens on many countries (4). In the United States alone, approximately 2 million fractures are attributed to osteoporosis annually, with projected healthcare costs reaching $25.3 billion by 2025 (5). Furthermore, there is evidence that BMD among United States adults has been declining over the past decade, which may have a detrimental impact on the situation (6).
The development of BMD is influenced by a number of factors, including biological genetics, metabolic processes, and habits (7). It is noteworthy that dietary nutritional intake plays a pivotal role in the presence and development of low BMD and is a factor that can be readily modified (8). The research evidence is clear that an adequate intake of essential nutrients, including protein, calcium, vitamin D, vitamin K, magnesium, and phosphorus, is essential for maintaining bone health and reducing the risk of low BMD (9). This underscores the potential of dietary modifications to mitigate bone loss.
As societies progress, dietary patterns become increasingly intricate. Traditional research often isolates the effects of individual nutrients or foods on diseases, but such approaches fail to capture the interactions among various nutrients. Consequently, dietary pattern analysis has emerged as a supplementary methodology for investigating the association between diet and the risk of developing chronic diseases (10). Previous studies have identified representative dietary patterns, including the Mediterranean diet, which is rich in meat, eggs, milk, nuts, and olive oil, and the Nordic diet, which is characterized by whole grains, root vegetables, and berries (11–13). Despite the 2015 United States Dietary Guidelines Advisory Committee’s emphasis on considering nutrient amounts, proportions, types, combinations, and consumption frequency in dietary patterns, there remains a dearth of nutrient-based studies examining the relationship between dietary patterns and disease (11–14). Although food patterns can predict certain disease risks, the specific mechanisms remain unclear; however, the combination of nutrients may exert a more significant effect on disease than individual nutrients, suggesting that studying dietary patterns could offer deeper insights into the underlying biological mechanisms and new perspectives on disease etiology, while nutrient-based analyses allow for comparisons of nutritional status across diverse populations irrespective of behavioral, cultural, or geographical differences (15–17). A number of studies have employed nutrients as a means of investigating the relationship between dietary patterns and disease, including obesity, psychological disorders, metabolic syndrome, and certain cancers (15, 18–20). However, fewer studies have been conducted on the association between dietary patterns and bone health (21).
A review of the literature revealed that factor analysis and cluster analysis are the most commonly used methods in dietary pattern analysis. Factor analysis yields factor scores, which are subsequently categorized into quartiles to depict dietary patterns. However, this method may result in a loss of statistical information (22). Cluster analysis, which encompasses Q-type (sample clustering) and R-type (variable clustering), offers distinct advantages. Q-type clustering categorizes dietary variables but fails to elucidate intra-group dietary patterns. In contrast, R-type clustering excels at distinguishing populations, although the complexity and icorrelation of dietary items challenge the interpretability of the results (23).
In this study, we will integrate factor analysis and cluster analysis methods to explore the relationship between dietary patterns based on nutrient intake and BMD. Initially, factor analysis will extract factor scores representing nutrient intake from participants, thereby identifying distinct dietary patterns. Subsequently, cluster analysis will effectively classify the study population, maximizing the retention of raw dietary information and distinguishing populations with different dietary patterns. Finally, we will analyze the correlations between these dietary patterns and participants’ BMD, specifically examining how nutrient combinations collectively affect BMD. Our findings aim to inform the development of nutrient-based dietary interventions to prevent and minimize low BMD and osteoporosis. Through our innovative approach and comprehensive analysis, we hope to contribute new perspectives and methodological advancements to the field of diet and BMD research, providing empirical support for future studies.
2 Materials and methods
2.1 Data source
The National Health and Nutrition Examination Survey (NHANES) is a research program designed to assess the health and nutritional status of adults and children through interviews and physical examinations. It is administered by the National Center for Health Statistics (NCHS), a division of the United States Centers for Disease Control and Prevention. Beginning in the 1960s, it was transformed in 1999 into a continuous program focusing on different groups and health topics. Approximately 5,000 people from 15 counties are surveyed each year. Interviews include demographics, socioeconomics, diet, and health, while screenings include medical, dental, and physiologic measures, as well as laboratory tests. NHANES is designed to determine disease prevalence and risk factors and to assess nutritional status. These data inform epidemiologic studies, health research, and public health policy. The database is available at www.cdc.gov/nchs/NHANES, the official website of NHANES.
2.2 Study population
In our study, data from three survey cycles from 2013 to 2014, 2017–2020 were used and the three survey cycles included 34,989 participants. After excluding participants under 40 years of age, those who had used contrast agents in the past 7 days, pregnant individuals, those weighing over 204 kilograms or measuring over 2.17 meters in height, and participants with missing scans of the femur region tissue (n = 26,031), as well as those with missing dietary recall information (n = 642), the final analyzed sample consisted of 8,316 individuals. The NHANES protocol was reviewed and approved by the NCHS Research Ethics Review Board (24). The sample screening process is shown in Figure 1.
Data collection for the NHANES 2019–2020 cycle was not completed due to the 2019 coronavirus disease (COVID-19) pandemic. Therefore, data collected in March 2019–2020 were combined with selected data from the NHANES 2017–2018 cycle to form a nationally representative sample of NHANES March 2017–2020 pre-pandemic data.
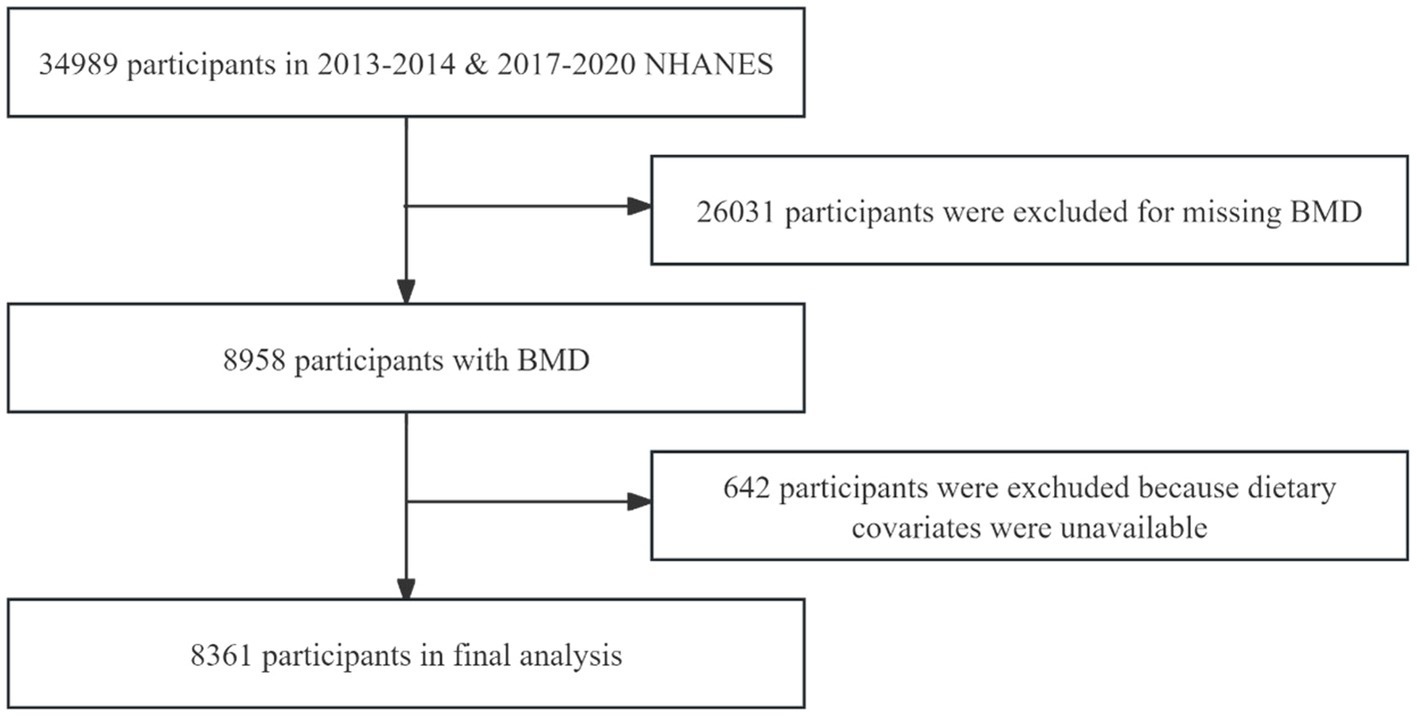
Figure 1. Flowchart of the sample selection.
2.3 Outcome variable: femur neck skeletal status
In this study, bone mineral density (BMD) was measured in grams per square centimeter (g/cm2) using dual-energy X-ray absorptiometry (DXA). The DXA scanning was performed with the HOLOGIC QDR 4500A fan beam densitometer, specifically focusing on the femoral neck. The which is calculated by comparing a patient’s BMD to the BMD of healthy young adults of the same gender, was determined using the following formula: (25). In accordance with the World Health Organization (WHO) recommendations, the mean and standard deviation of femoral neck BMD in healthy adults were used as references. These reference values were based on data from white women aged 20–29 years, as reported in the NHANES 2005–2008 study (26). BMD values were classified according to the T-score classification standard recommended by the WHO and the osteoporosis questionnaire. For the detailed definition and classification, refer to Table 1.
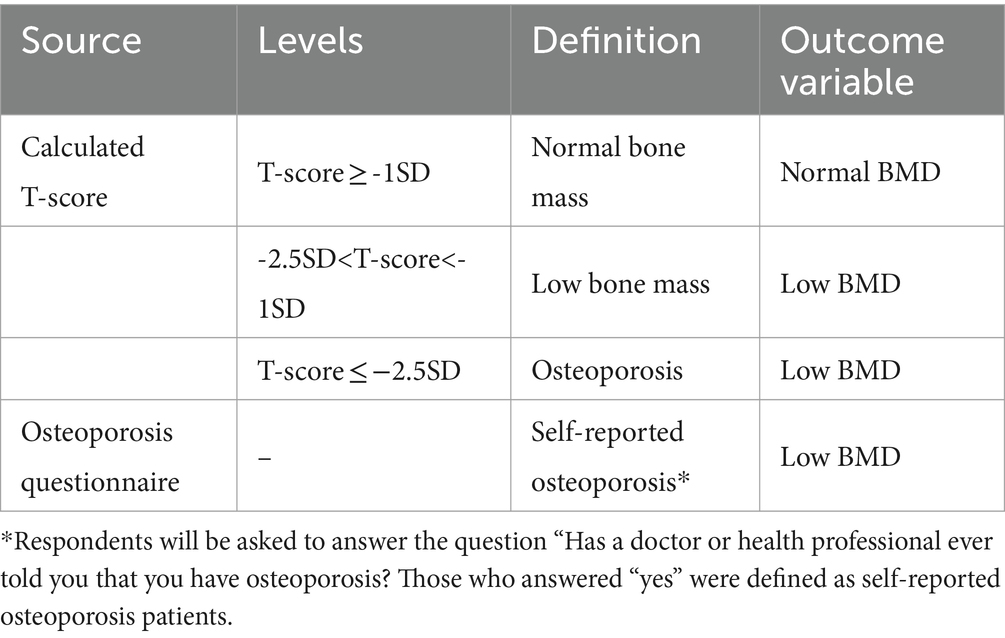
Table 1. Classification of BMD based on T-score and osteoporosis questionnaire.
2.4 Exposure variable: dietary patterns
Dietary data were obtained from the “What We Eat in America (WWEIA)” section of NHANES. Daily nutrient intakes were averaged from two 24-h dietary surveys. The nutrients studied included protein, carbohydrate, dietary fiber, saturated and unsaturated fatty acids (SFA&UFA), cholesterol, vitamins A, D, E, K, C, B, choline, calcium, phosphorus, magnesium, iron, zinc, copper, sodium, potassium, and selenium, totaling 22 nutrient groups. Detailed nutrient deletions and combinations are shown in Table 2.
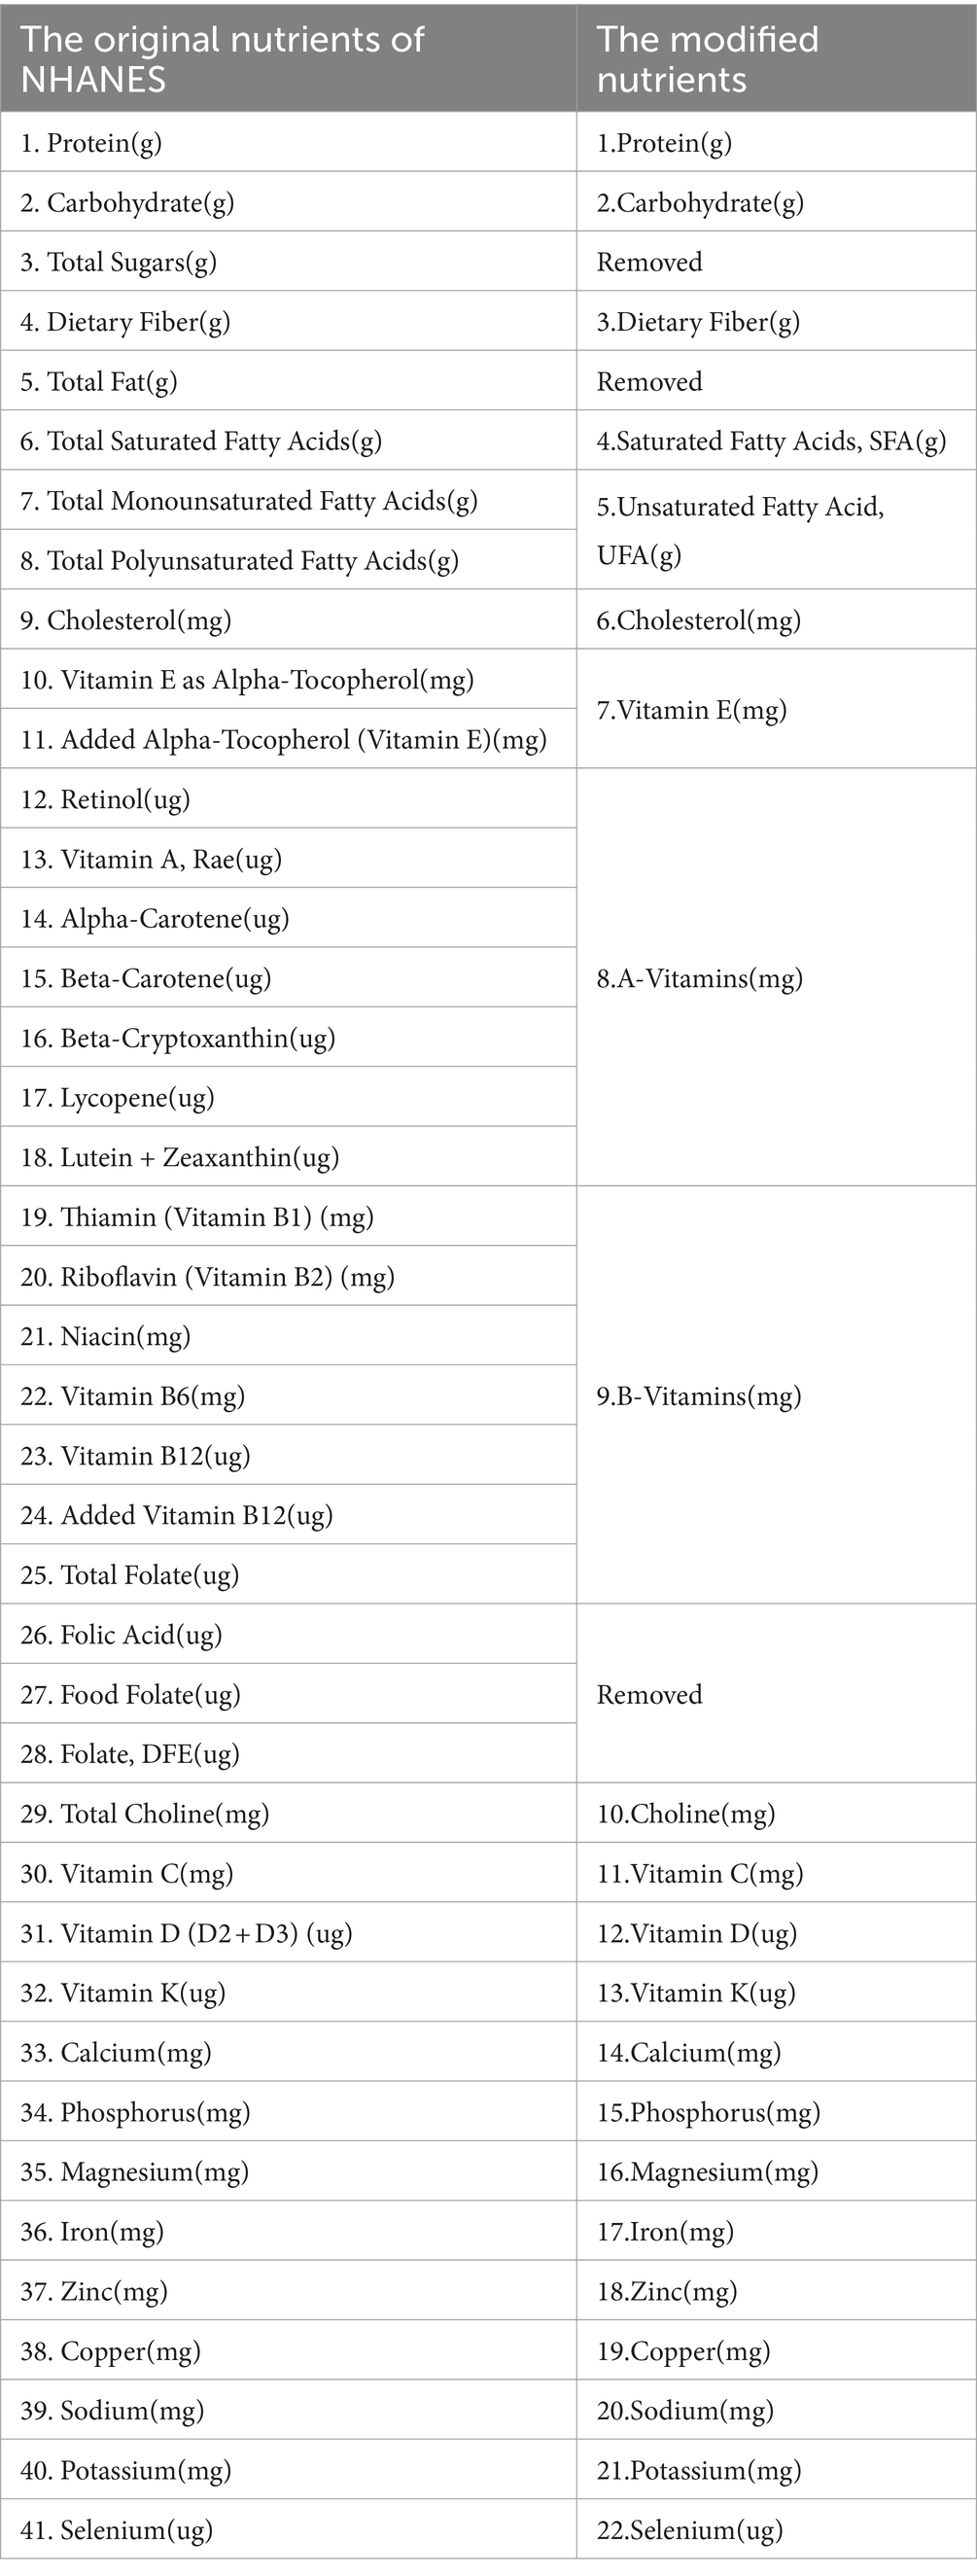
Table 2. Nutrients are calculated by the FNDDS groups and modified groups used in the present study.
We are going to summarize the dietary patterns of nutrient extraction from the 22 nutrient groups. Dietary patterns were extracted using factor analysis combined with cluster analysis, and the specific analysis steps were as follows (1): In order to overcome the effect of outliers, nutrient intake was standardized for all the nutrient variables after 5% bilateral tailing (27). (2) Factor analysis requires the existence of correlation between the original variables, therefore, Kaiser-Mayer-Olkin (KMO) test and Bartlett’s test of sphericity were used to analyze the correlation between the nutrient variables and determine whether the data were suitable for factor analysis. (3) K-means cluster analysis was used to analyze the factor scores (FS) of all samples for each type of nutrient intake.
2.5 Other covariates
The covariates included in the study were age, sex, race, marital status, education, family income, Body Mass Index (BMI), physical activity, smoking history, and alcohol consumption history. According to the Family poverty income ratio (PIR), family income are divided into three levels. Physical activity was assessed by weekly metabolic equivalent task (MET) minute aggregated scores, according to the NHANES recommendations. Weekly MET-minutes were calculated as follows: [8.0 MET scores (weekly minutes of vigorous work-related activity + weekly minutes of vigorous leisure-time physical activity)] + [4.0 MET scores (weekly minutes of moderate work-related activity + weekly minutes of moderate leisure-time physical activity + weekly minutes Walking or bicycling for transportation)] (28). Detailed levels are shown in Table 3.
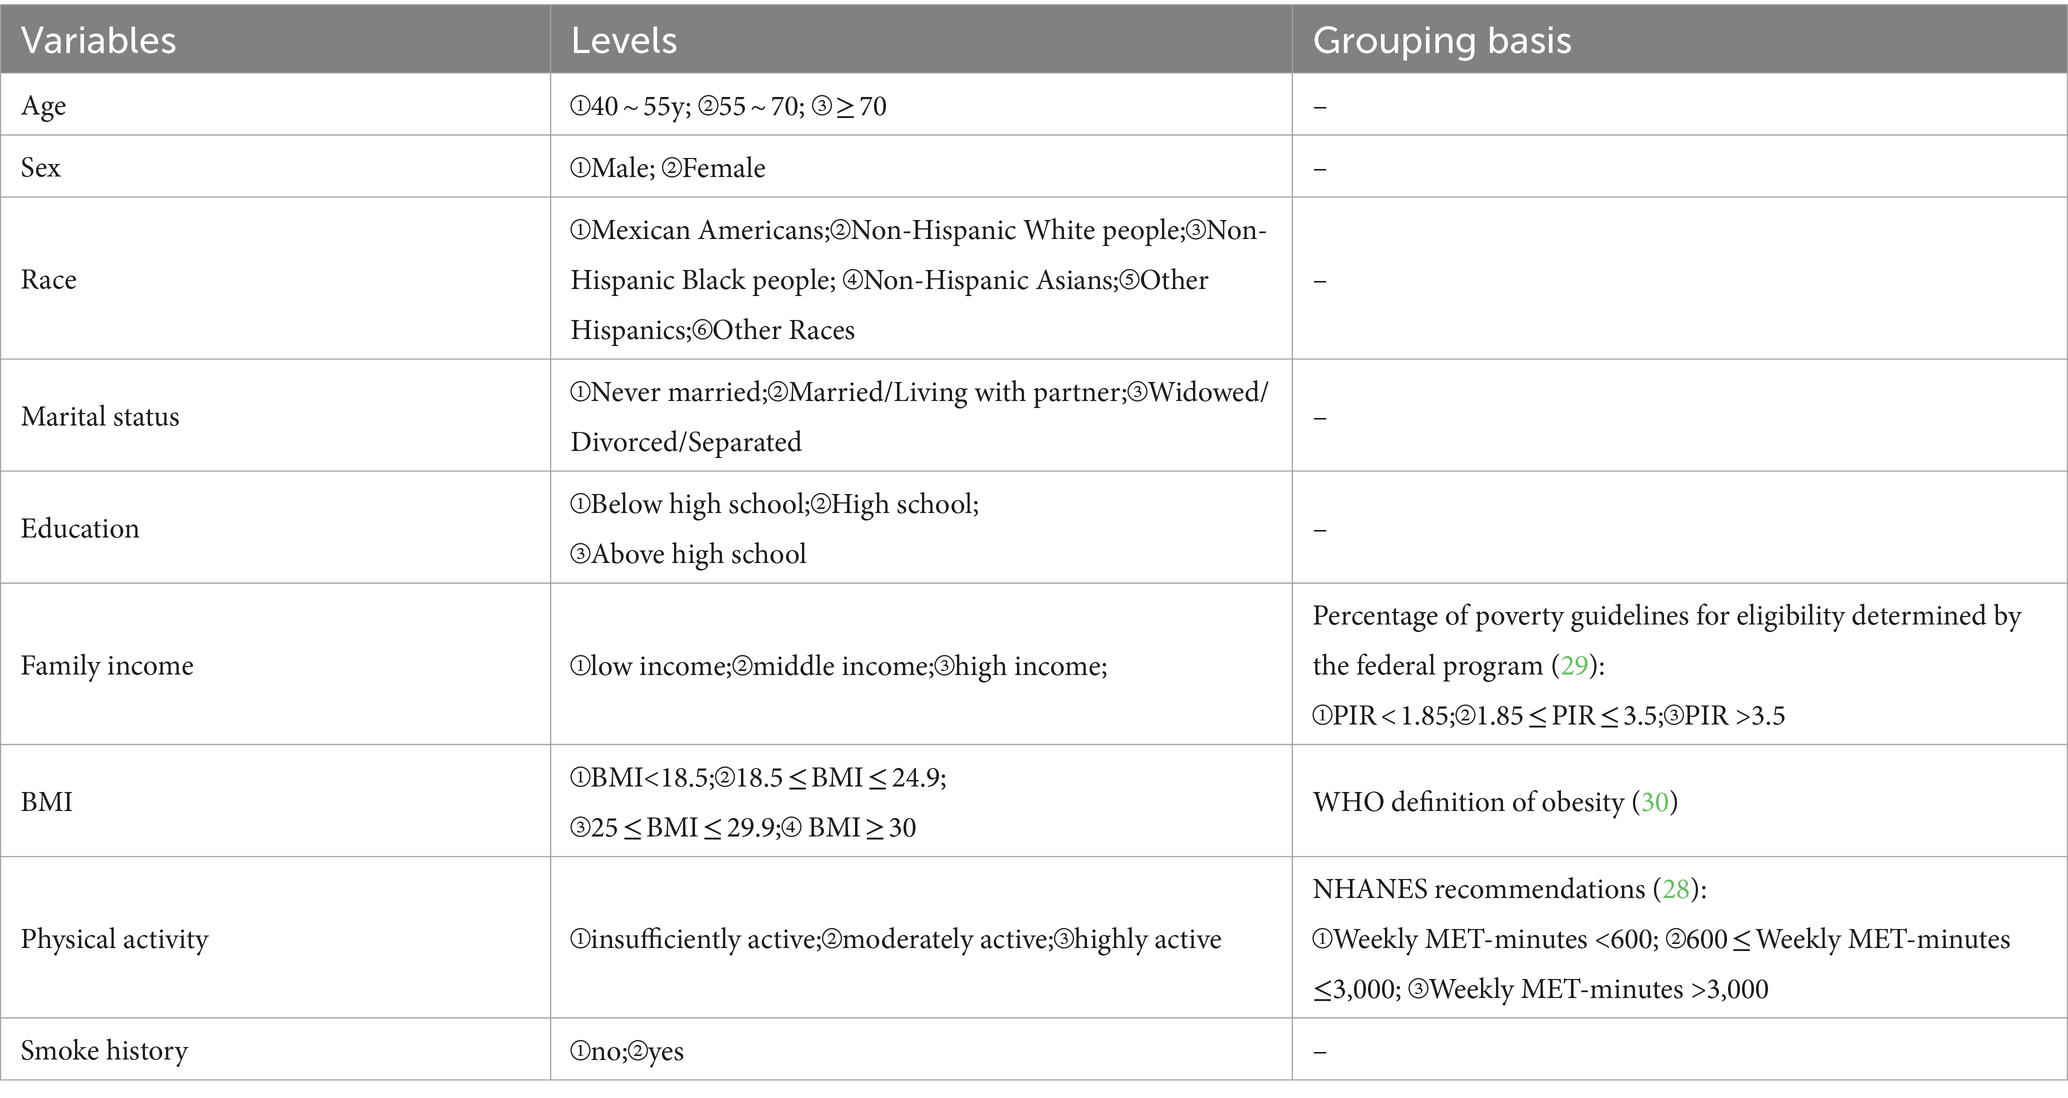
Table 3. Other covariates and their grouping details.
3 Statistical analyses
Sample characteristics were described using mean and standard deviation (SD) for continuous variables and N (%) for categorical variables. The chi-square test or analysis of variance (ANOVA) was used to test the differences between groups for categorical or continuous variables. To investigate the correlation between femoral neck BMD and dietary patterns, multivariate linear regression and logistic regression were performed. Multivariate models were adjusted for demographic variables such as age, sex, and race. NHANES uses complex sampling designs, including multistage whole-cluster sampling and weighting methods, to oversample individuals in certain groups to ensure adequate statistical power. We constructed weights for the multi-period combined data by selecting sampling weights associated with the minimum subsample (MEC), as recommended by NHANES (31). All coefficients with 95% confidence intervals (CI) were recorded. p values less than 0.05 (two-sided) were considered statistically significant. All statistical analyses were performed using the R software (version 4.3.1).
4 Outcome
4.1 Characteristics of participants
The characteristics of the study population were presented in Table 4. A total of 8,316 participants were included in the study, comprising 4,489 individuals with normal bone mass and 3,827 with low BMD. The minimum age of the study participants included in this investigation was 40 years old, with a maximum age of 80 years old, primarily concentrated in the age group of 55 to 70 years old. Among them, 4,299 were males (51.7%) and 4,017 were females (48.3%). See Table 4 for details.
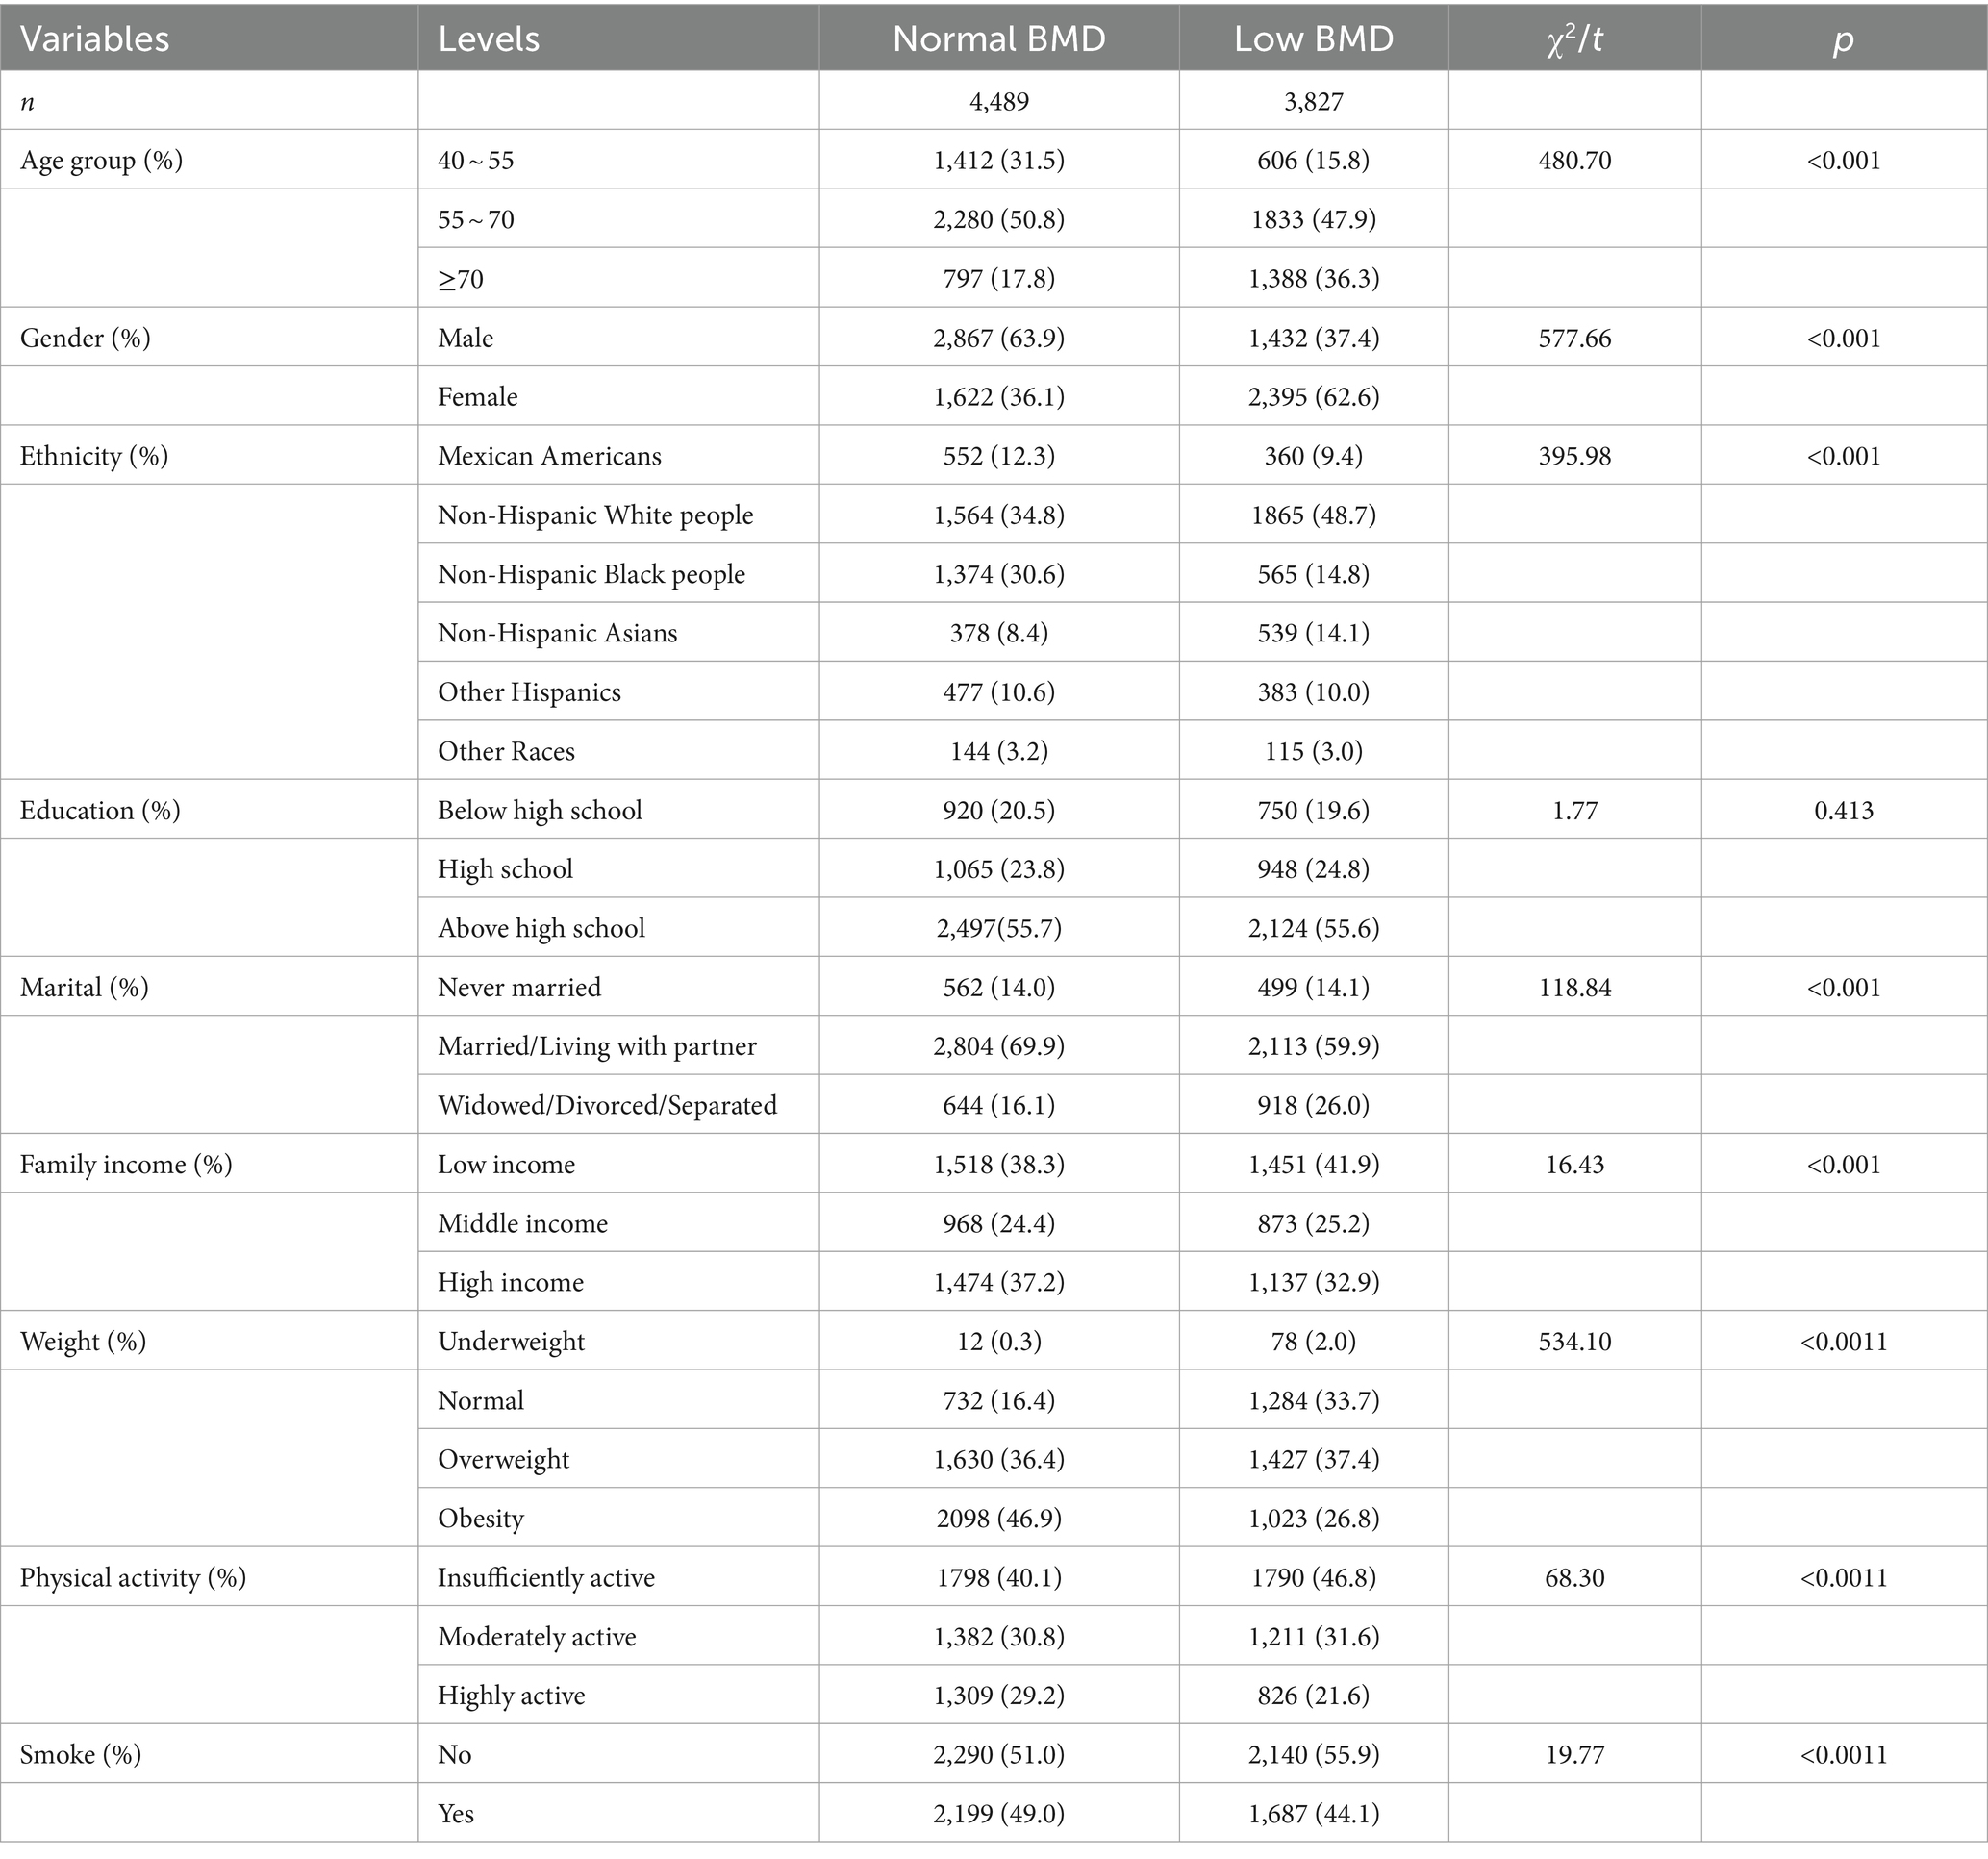
Table 4. General demographic characteristics.
4.2 Dietary pattern
According to the statistical results, the sample KWO test value was 0.92 and Barlen’s Chi-Squar was 96844.06, with a probability of concordance <0.001, indicating strong correlation between the nutrients, which is suitable for factor analysis. The results of factor analysis showed that five factors had an eigen root >1 (Figure 2). Three dietary factors were identified with a total variance contribution ratio of 54.12% by considering the eigen root, total variance contribution ratio, number of factors before the inflection point in the fragmentation plot, and the appropriateness of nutrient combinations. In order to obtain more typical factor compositions and make the results easier to interpret, the original factor loading matrices were rotated with variance-maximizing orthogonal rotation of the rotated loading matrices. Nutrients with factor loadings >|0.40| were used as the main contributing terms of the factors, and the different nutrients contained in each factor were categorized for the naming of dietary patterns.
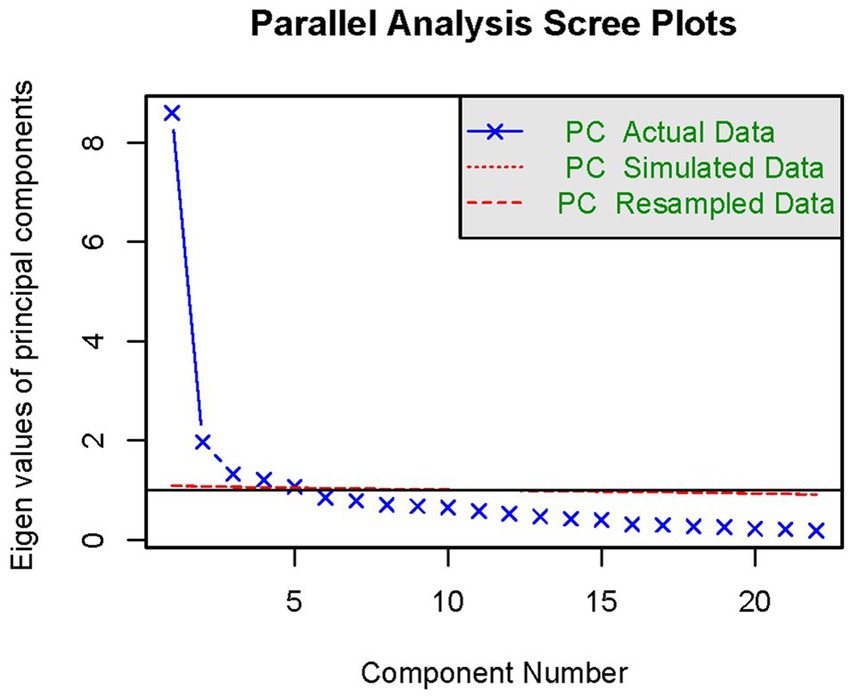
Figure 2. Parallel analysis scree plots.
Factor load after rotation was shown in Table 5. The first factor was dominated by nutrients such as protein, lipids, choline, phosphorus, zinc, sodium, potassium and selenium. The second factor was dominated by nutrients such as carbohydrates, dietary fiber, vitamins A, E, K, C, magnesium, iron, and potassium, and the third factor was dominated by vitamin D, calcium, iron, zinc, and copper.
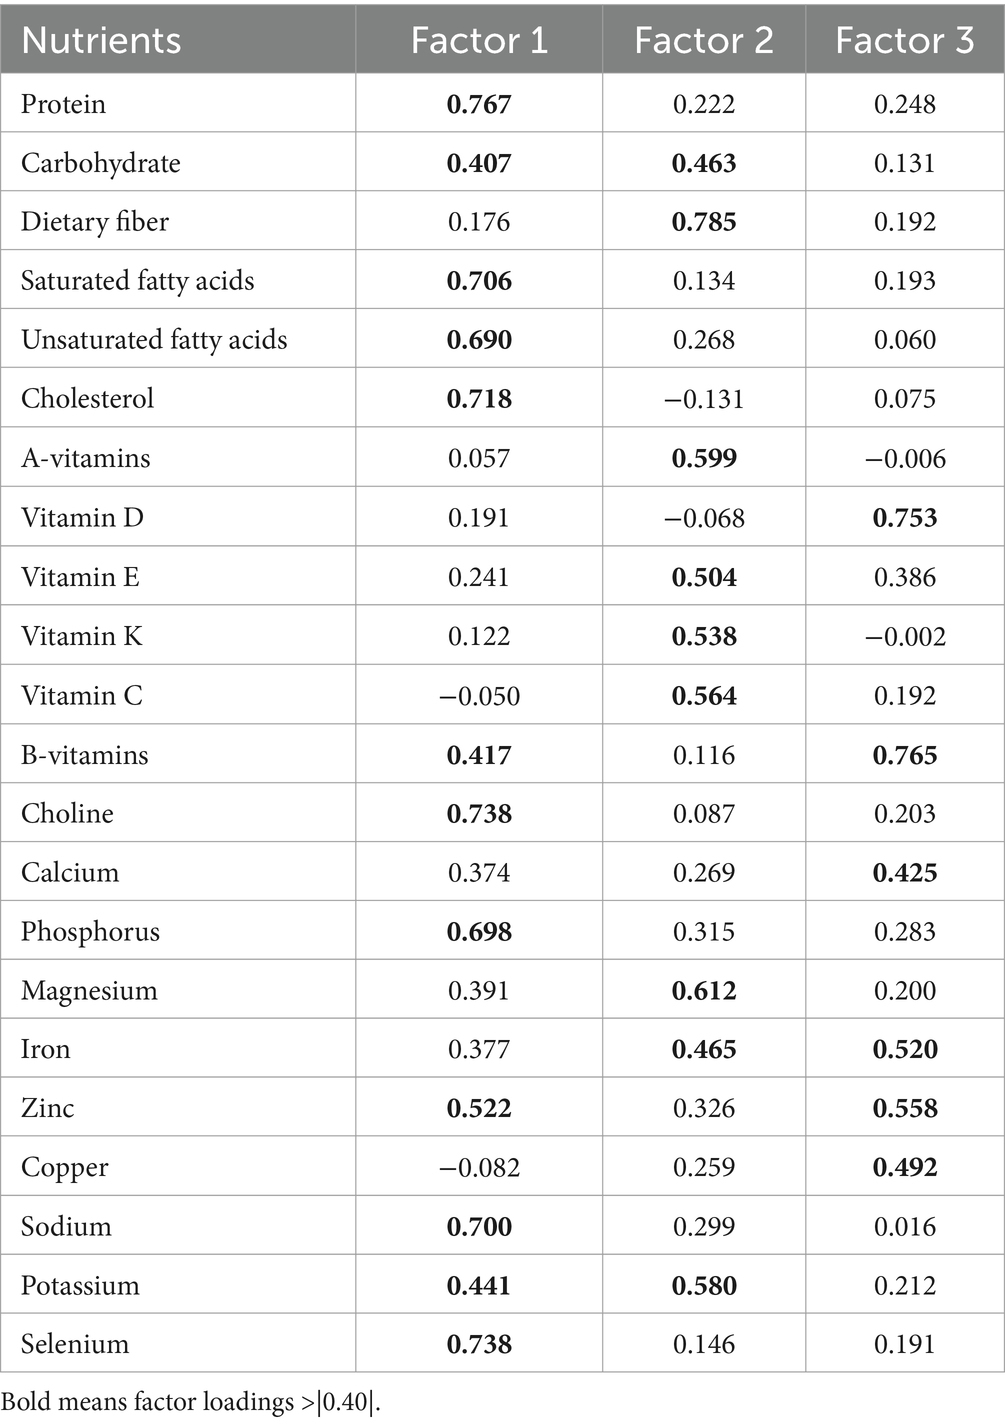
Table 5. Factor loadings after orthogonal rotation with maximum variance.
On this basis, the K-means method was used to cluster the factor scores of the first three common factors of the 22 categories of nutrients of the 8,316 research subjects, and the maximum number of iterations was set to the maximum value of 20, and the clustering results were shown in Table 6, and the number of clusters was determined to be 3 according to the results of the factor analysis. Clustering through the factor scores basically divided the 22 categories of nutrients into three types. The division of three types of sample space was shown in the Figure 3. The mean squares of the clusters were analyzed by ANOVA with p < 0.001, indicating that the differences in the classification of the three dietary patterns were statistically significant.
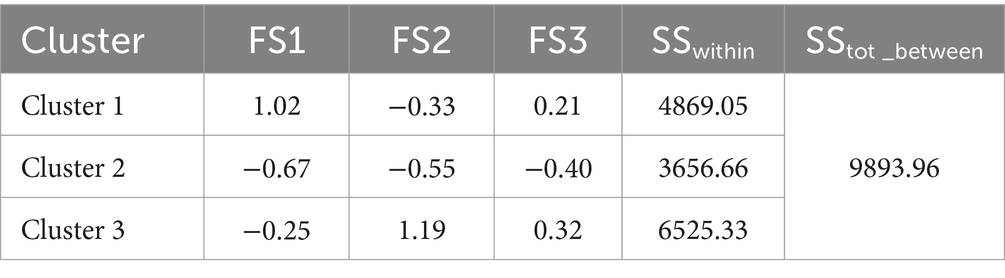
Table 6. K-means clustering results based on factor scores.
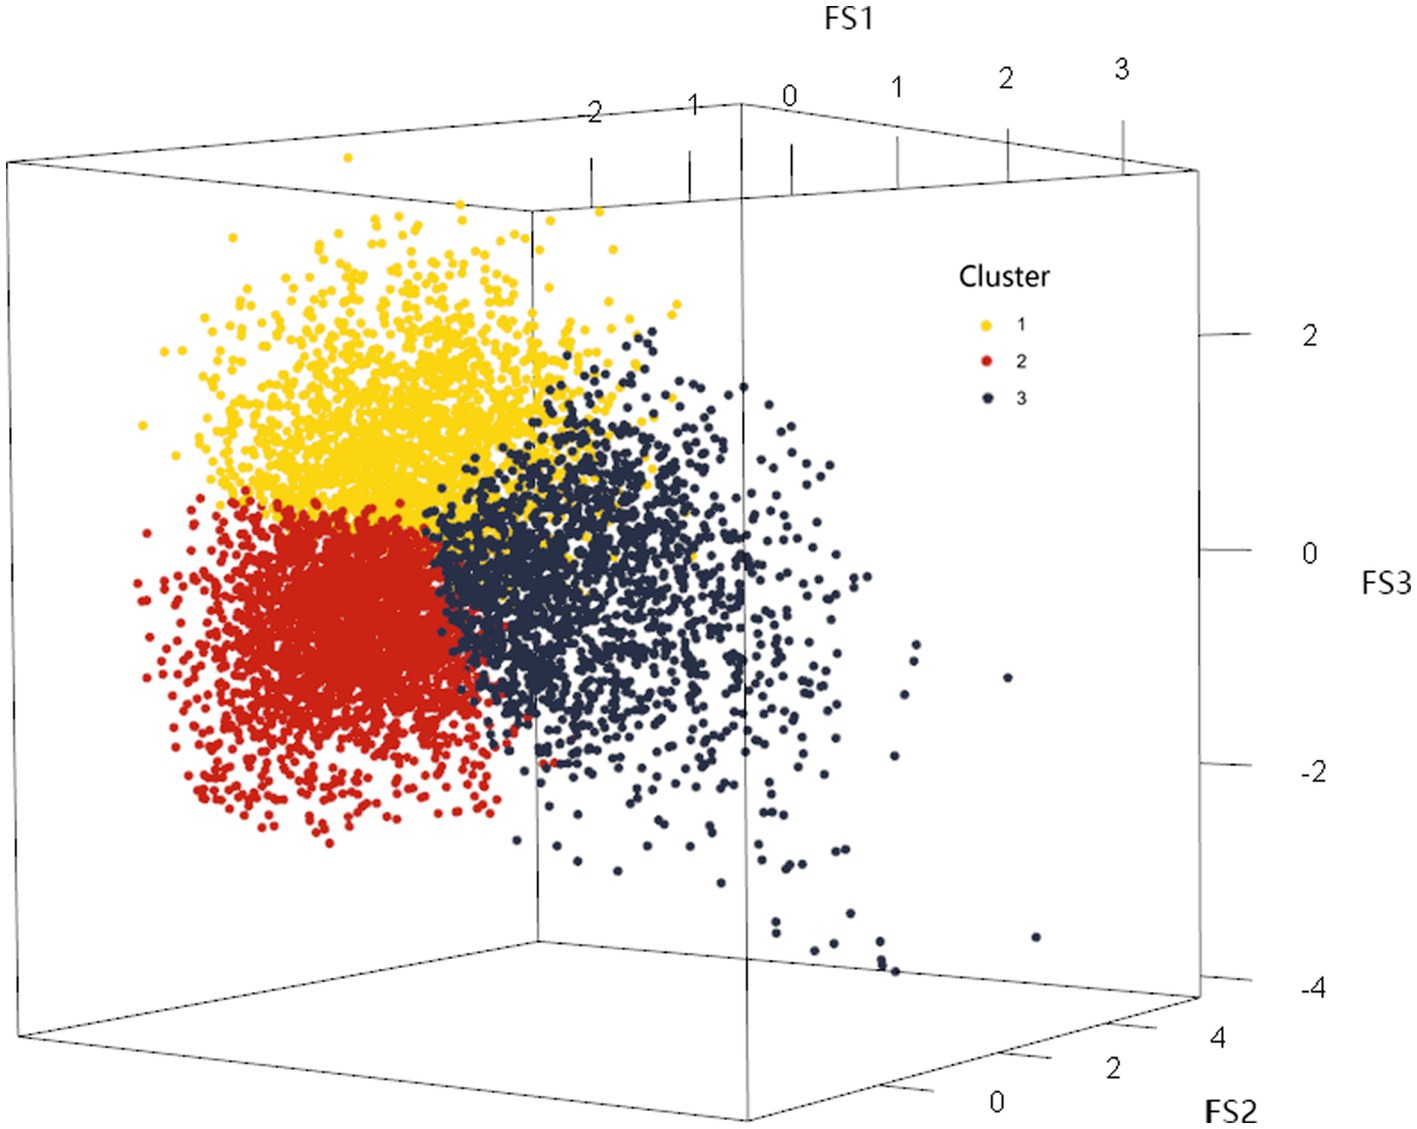
Figure 3. The 3D scatter plot of clustering results based on factor scores.
Based on the results of cluster analysis and the mean intake of each nutrient within the identified patterns, distinct dietary profiles emerged. Cluster 1 exhibited higher mean intake levels of protein, fat, total choline, phosphorus, zinc, sodium, potassium, and selenium compared to the other clusters. This pattern aligned with the characteristics of dietary Factor 1, characterized by high levels of macronutrients, choline, and selenium. Thus, it was designated as the “High Macronutrient-Choline-Selenium (HM-Cho-Se)” pattern.
Cluster 2 demonstrated lower intakes of protein, carbohydrates, and lipids relative to the other clusters, while exhibiting elevated levels of vitamin D and calcium intake. This dietary pattern mirrored the loading characteristics of Dietary Factor 3, characterized by low macronutrient intake but high levels of vitamin D and calcium. Accordingly, it was labeled the “Low Macronutrient-Vitamin D-Calcium (LM-VitD-Ca)” pattern.
In contrast, Cluster 3 displayed lower protein intake but higher consumption of carbohydrates, dietary fiber, and vitamins A, E, K, and C compared to the other clusters. This intake profile corresponded to the loading characteristics of Dietary Factor 2, featuring low protein intake but high intake of dietary components and vitamins. Therefore, it was denoted as the “Low protein-High Dietary fiber-Vitamin A- Magnesium (LP-HDF-VitA-Mg)” pattern (Table 7).
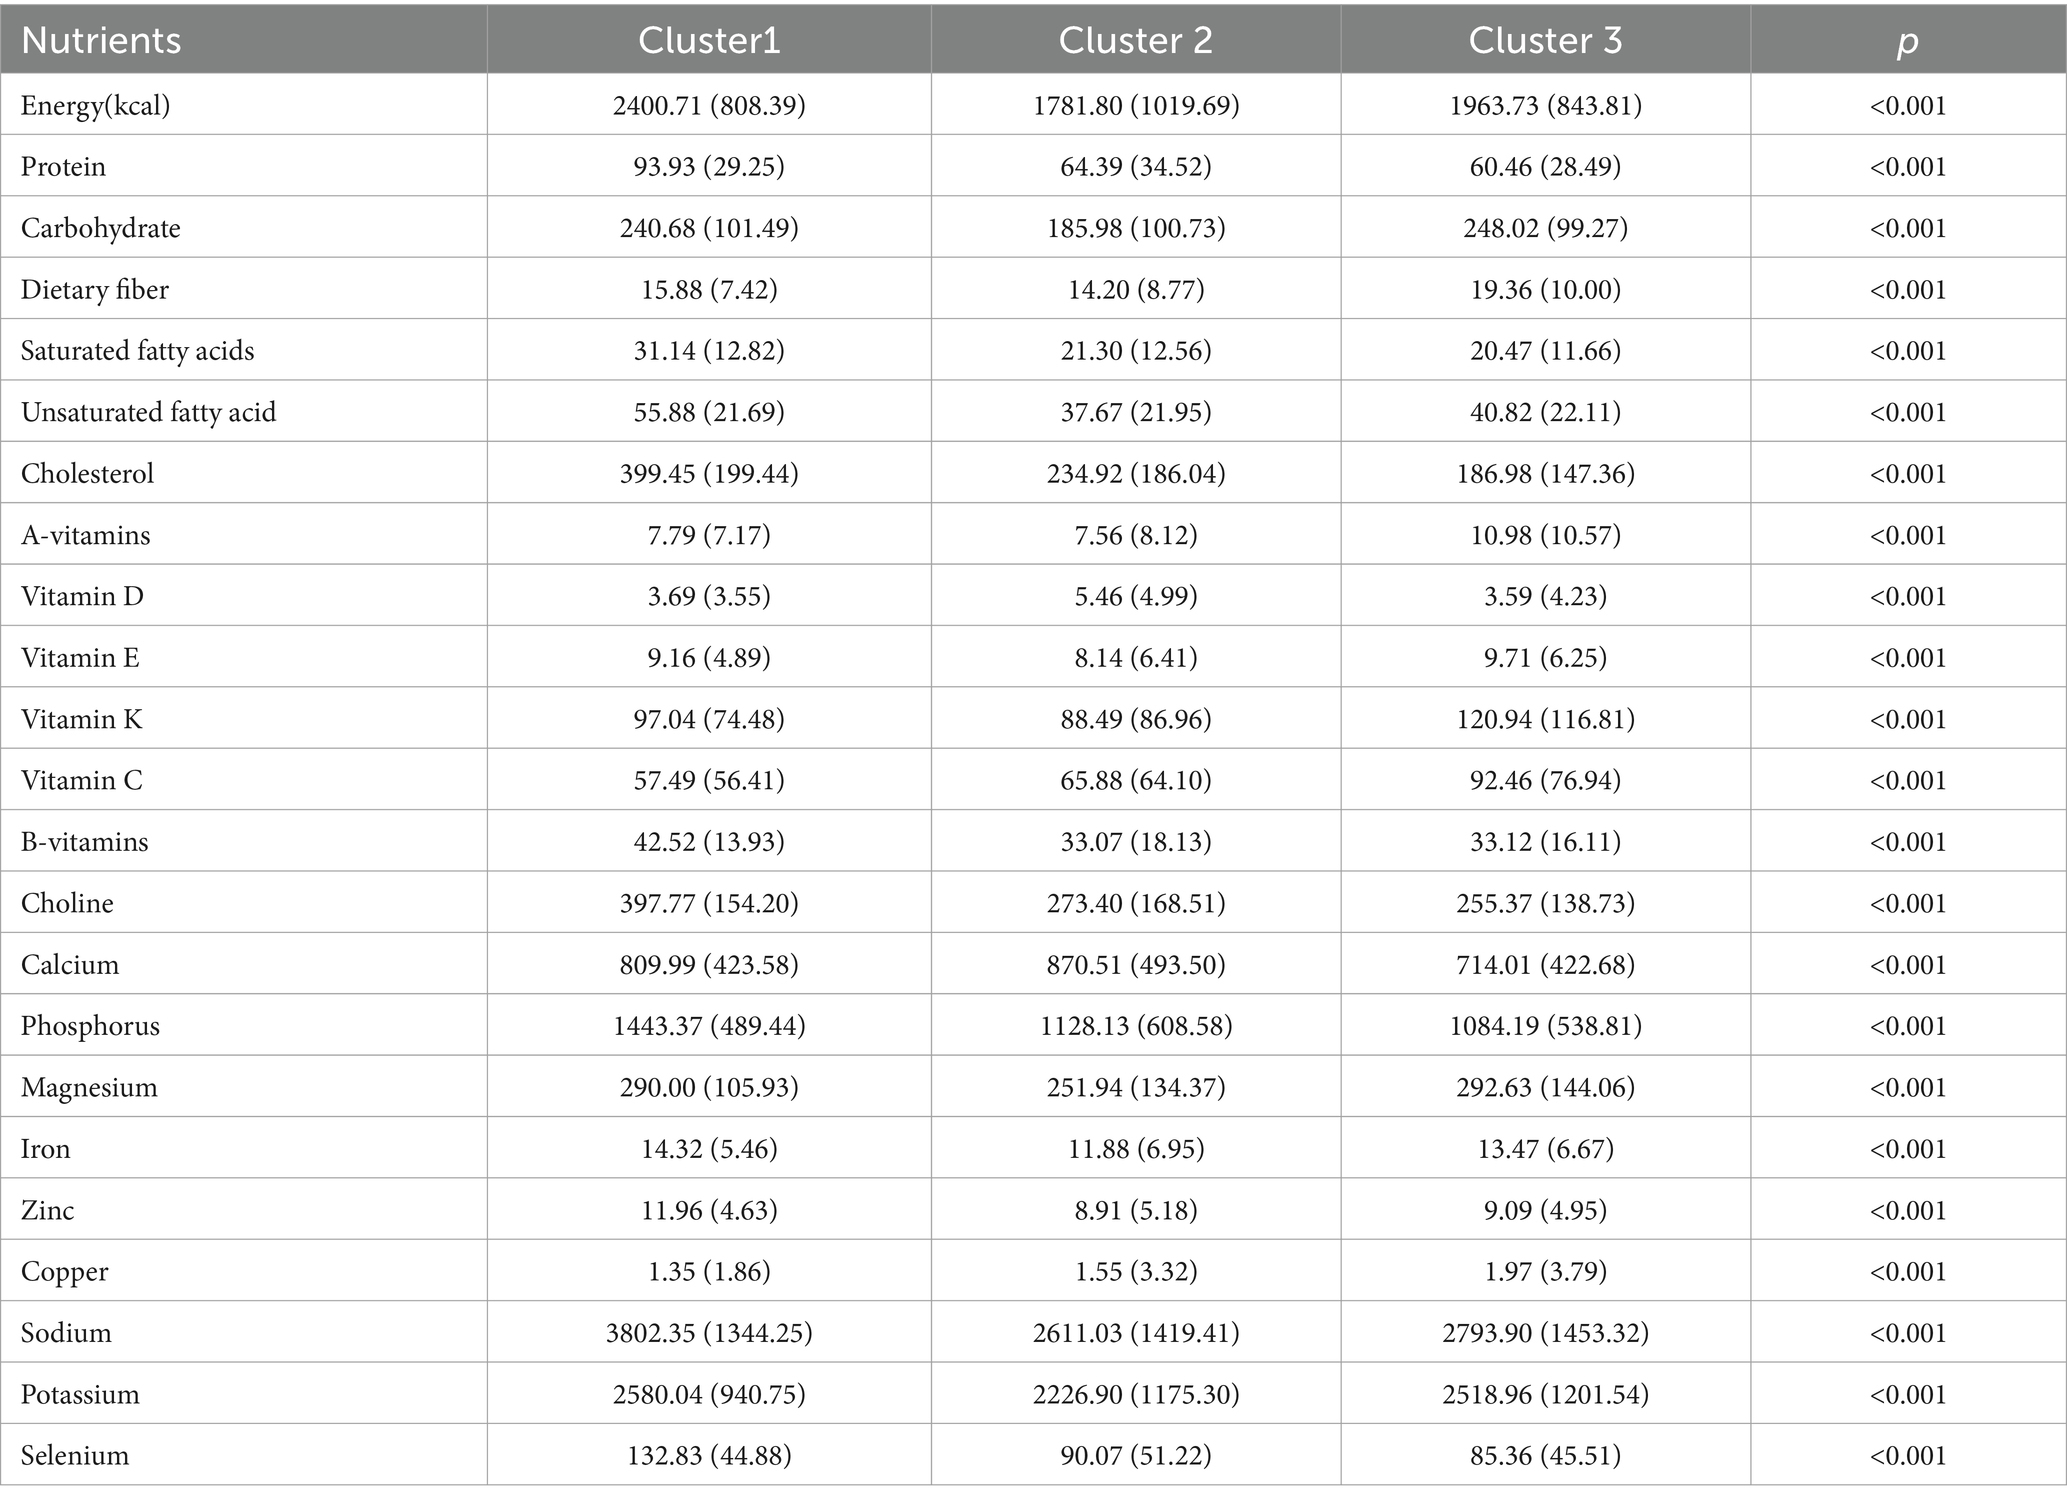
Table 7. Means of nutrient intake for each category of the three clustering patterns [mean (SD)].
4.3 Dietary pattern and BMD of femoral neck
The populations of the three dietary patterns “LP-HDF-VitA-Mg,”"HM-Cho-Se” and “LM-VitD-Ca” consisted of 2,470, 2,570, and 3,276 individuals, respectively. Figure 4 displays the distribution of their femoral neck BMD and low BMD. Statistically significant differences were found in femoral neck BMD and low BMD among the three population patterns. The HM-Cho-Se pattern showed a slightly higher femoral neck BMD compared to the other two dietary patterns. Refer to Table 8 for specifics.
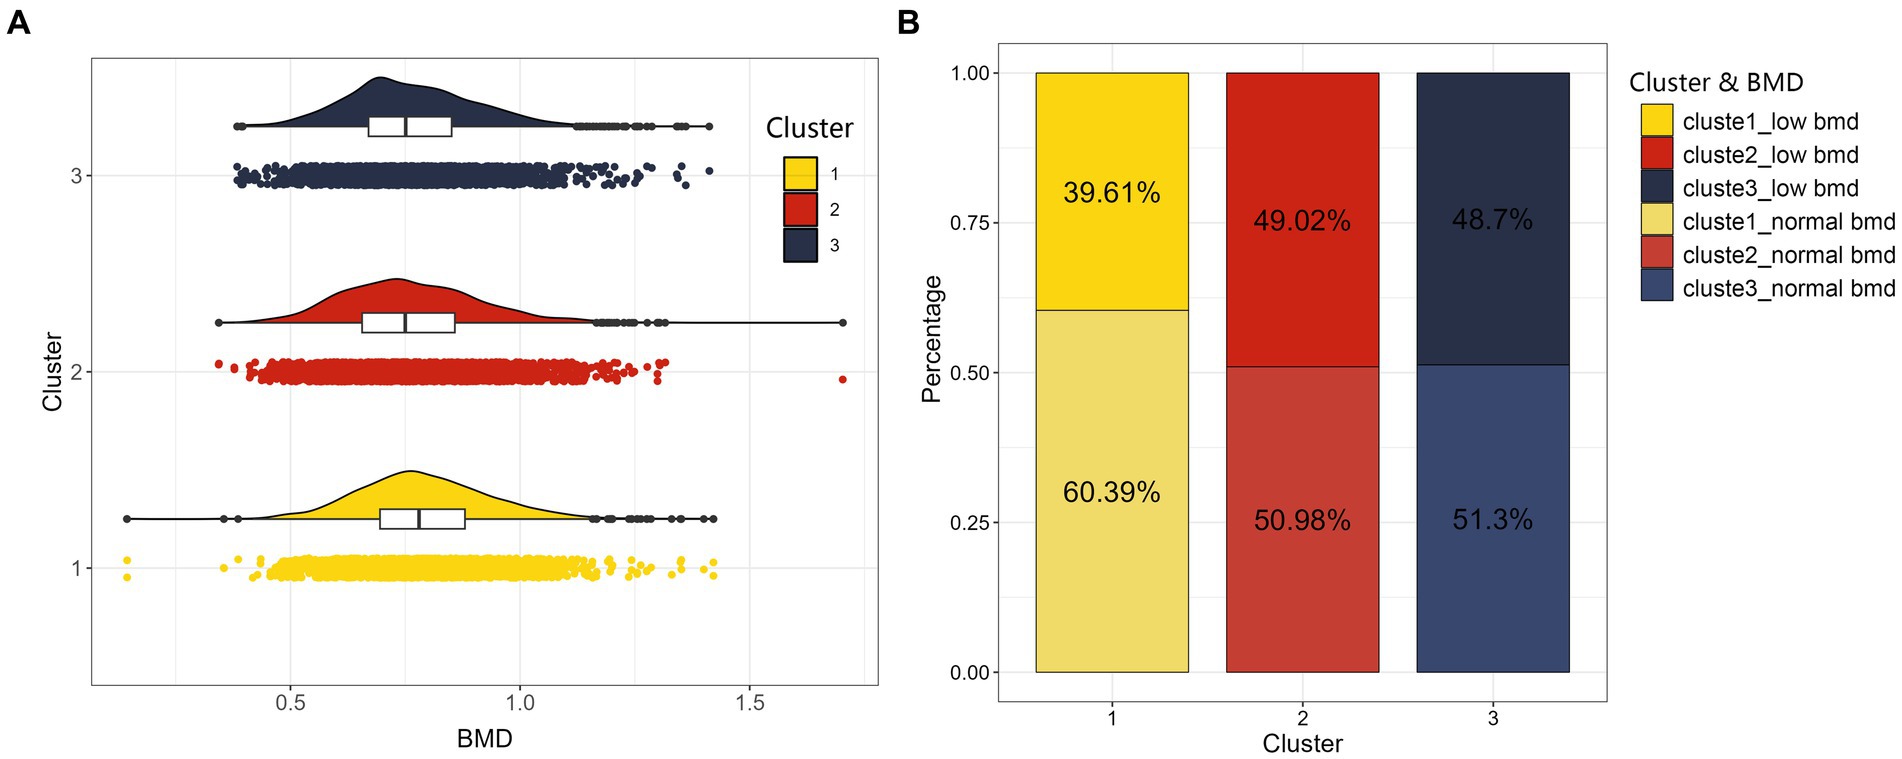
Figure 4. The distribution maps of three clusters. On the left (A) is cloud and rain plot of BMD as a continuous variable, and we can observe a bell-shaped distribution of BMD for the three clustered populations. On the right (B) is stacked bar chart of BMD converted into a categorical variable indicating whether individuals suffer from low BMD for the three clustered populations.
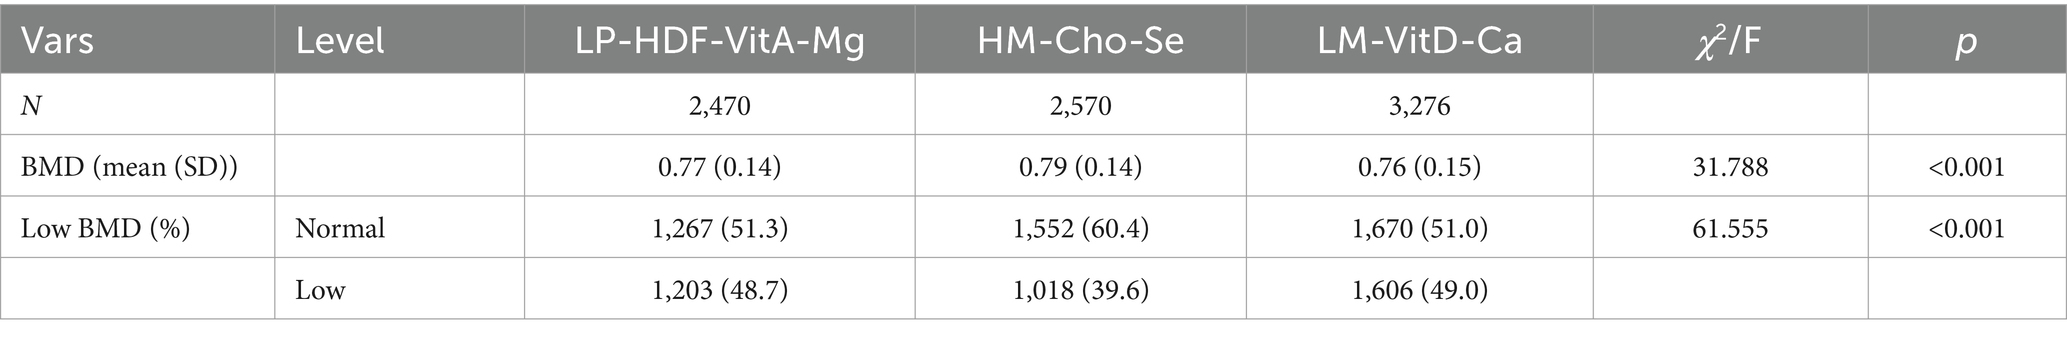
Table 8. Distribution of femoral neck BMD in the population with three dietary patterns.
The relationship between dietary intake patterns and femoral neck BMD and risk of low BMD were shown in Table 9. In the correction model, the “HM-Cho-Se” pattern was positively correlated with BMD of femoral neck [β = 0.01 (−0.00,0.02), p = 0.025]. At the same time, compared with the “LP-HDF-VitA-Mg” mode, the risk of low BMD was 0.86 times [OR = 0.86 (0.75,0.99); p = 0.031], suggesting that better adherence to the “HM-Cho-Se” pattern may reduce the risk of low BMD. However, the “LM-VitD-Ca” pattern was not significantly associated with BMD in the femoral neck or the risk of developing low BMD.
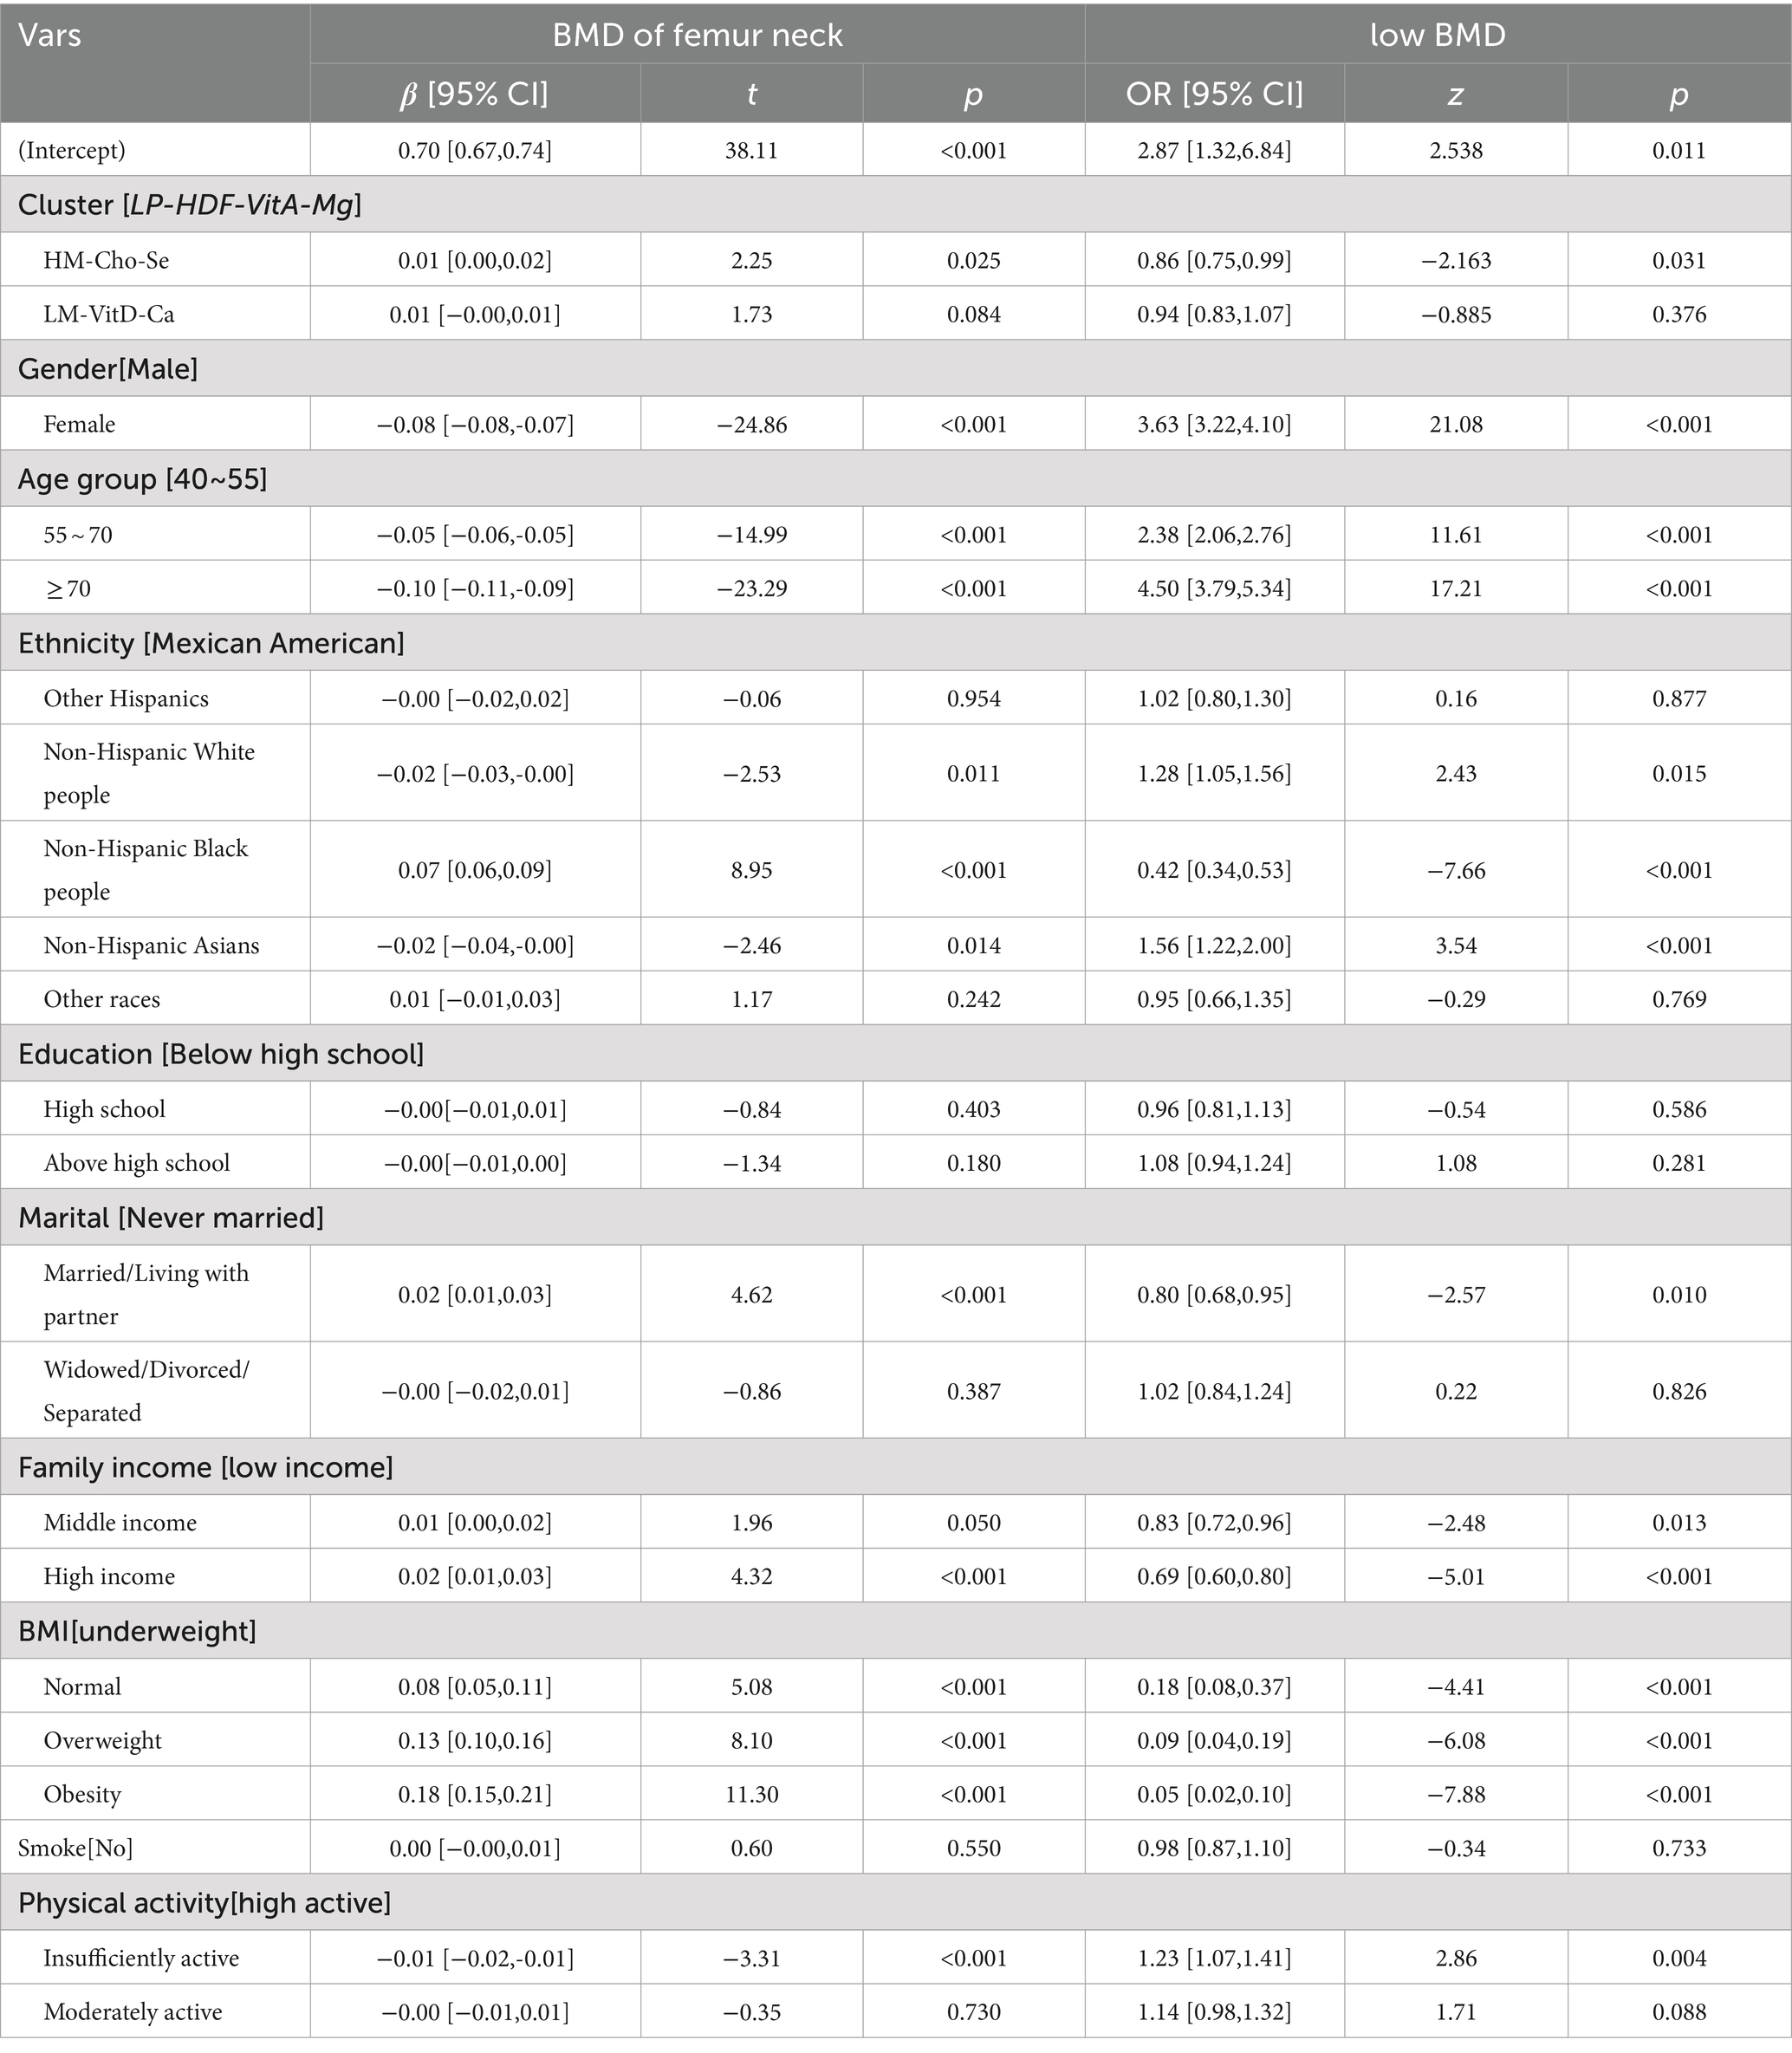
Table 9. Association between dietary patterns and femoral neck BMD (corrected for demographic variables, BMI, smoke history and physical activity).
5 Discussion
In this study, women, higher age groups, and race were identified as risk factors for low bone mineral density (BMD). Numerous prior investigations have highlighted the significant influence of both gender and age on BMD. It was revealed that women are at a higher risk (OR = 3.33, 95% CI: 2.9–3.72, p < 0.001) of low BMD compared to men, while both the 55–70 age group (OR = 2.25, 95% CI: 1.96–2.59, p < 0.001) and the >70 age group (OR = 4.55, 95% CI: 3.86–5.36, p < 0.001) exhibited a higher risk of developing low BMD compared to the 40–55 age group. These findings corroborate earlier research indicating a progressive decline in BMD with advancing age, especially evident after 50 years, making middle-aged and elderly individuals more susceptible to osteoporosis. Additionally, existing literature has highlighted the rapid reduction in bone mass among women following menopause, attributable to declining estrogen levels. This phenomenon elucidates why middle-aged and elderly women exhibit a heightened vulnerability to osteoporosis compared to men of equivalent age (32).
Compared to Mexican Americans, Non-Hispanic White people have a higher risk of low BMD (OR = 1.28, 95% CI: 1.05–1.56, p = 0.015), as do Non-Hispanic Asians (OR = 1.56, 95% CI: 1.22–2.00, p < 0.001). Conversely, Non-Hispanic Black people have a lower risk of developing the condition (OR = 0.42, 95% CI: 0.34–0.53, p < 0.001). Previous studies have shown that, in general, Non-Hispanic Black adults tend to have the highest BMD and the lowest prevalence of bone loss compared to Hispanics, Mexican Americans, Non-Hispanic White people, and Non-Hispanic Asian adults (33, 34). The research findings indicate that polymorphism of the vitamin D receptor (VDR) may be associated with higher BMD in Non-Hispanic Black individuals compared to Non-Hispanic White individuals. Differences in VDR FokI genotypes suggest that allelic frequency differences between Non-Hispanic Black and Non-Hispanic White populations may contribute to BMD variation (35, 36). Additionally, genetic factors such as single nucleotide polymorphisms in TRPV6 and TRPV5 may result in more efficient calcium absorption in Non-Hispanic Black individuals (37, 38). Furthermore, cultural customs promoting physical activity and healthy lifestyles among Non-Hispanic Black populations may also contribute to their relatively higher BMD. In contrast, Non-Hispanic Asians tend to have lower BMD compared to other ethnicities, influenced by both genetic and lifestyle factors. This may be related to unfavorable VDR FokI and BsmI polymorphisms among Asians, which are associated with decreased BMD (39). Additionally, cultural factors such as dietary habits play a role in bone health. Traditional Asian diets typically include fewer dairy and calcium-rich foods, which may contribute to lower BMD (40).
This study also shows a positive correlation between BMI, physical activity, and bone mineral density (BMD). Both high BMI and high activity groups have a lower risk of low BMD, consistent with previous studies (41, 42). Firstly, mechanical loading on bones is greater with higher body weight (higher BMI) and more physical activity. This load generates stresses that activate osteoblasts, promoting bone formation and reducing bone resorption, thus increasing bone density. Physical activity also enhances bone health by increasing muscle strength and mass. Stronger muscles exert greater traction on bones during exercise, promoting bone growth and remodeling (43, 44). Secondly, hormonal regulation plays a role. Fat cells secrete hormones (e.g., estrogen), cytokines, and other signaling molecules that affect bone metabolism. Higher amounts of adipose tissue in obese (high BMI) individuals can alter these hormone levels, influencing bone density. Regular exercise increases levels of growth hormone and sex hormones (e.g., testosterone), crucial for bone metabolism. Additionally, BMI is an important indicator of nutritional status (45).
We extracted three dietary patterns, namely, the “LP-HDF-VitA-Mg” pattern, the “HM-Cho-Se” pattern, and the “LM-VitD-Ca” pattern, from the intake of 22 nutrients among 8,316 research subjects by combining factor analysis with cluster analysis. The proportions of the three dietary populations were 29.70, 30.91, and 39.39%, respectively, after clustering, with relatively balanced numbers of samples in the three categories. Significant differences in femoral neck densities were found between the groups (F = 31.788, p < 0.001). Factor analysis and cluster analysis are two post-hoc analysis methods commonly used in nutritional epidemiology to simplify data and reveal potential relationships between variables, helping to navigate the complex interrelationships among nutritional components and identify various dietary patterns. However, this process can be subject to considerable subjectivity in identifying common factors (46). Previous studies commonly divide factor scores into quartiles after extraction but erroneously assume that subjects with the highest scores represent the dietary pattern, leading to a loss of statistical information, as high scores in common factors merely indicate a tendency toward a specific dietary pattern (47). Cluster analysis complements factor analysis by dividing individuals into groups based on similarities in nutritional profiles, thus identifying subpopulations with similar dietary behaviors, providing a more nuanced view of nutritional patterns, and refining these patterns. In this study, factor analysis was used to identify dietary patterns based on participants’ nutrient intake factor scores, which were effectively categorized using cluster analysis to maximize the retention of original dietary information. Meanwhile, this study utilized the variance contribution ratio and scree plot for statistical analysis to capture the interconnections of nutrients and diverse dietary characteristics in the population.
Investigating the correlation between three dietary intake patterns and BMD, significant inter-group differences in BMD were initially found among the groups. Post-hoc pairwise comparisons revealed higher BMD in the “HM-Cho-Se” group compared to others. However, after adjusting for demographic variables, the difference in BMD between the “LM-VitD-Ca” pattern and the “LP-HDF-VitA-Mg” pattern group became nonsignificant. Yet, a positive correlation persisted with the “HM-Cho-Se” pattern, suggesting that it may mitigate the risk of low BMD.
Interesting findings from our study revealed a complex relationship between nutritional intake patterns and BMD. Higher BMD was observed in individuals who adhered to a dietary pattern rich in protein, carbohydrates, fats, choline, and selenium, emphasizing the potential synergistic effects of these nutrients on bone health. Protein is an essential component of the human diet and plays a key role in bone metabolism. Essential amino acids derived from dietary proteins are critical for the synthesis of collagen, a key structural protein in bone (48). The positive correlation between higher BMD and diets rich in carbohydrates and fats emphasizes the importance of energy availability in bone health. Carbohydrates serve as the body’s primary source of energy to fuel the metabolic processes required for optimal bone function. Similarly, dietary fat contributes to energy reserves and plays a role in hormone production, influencing bone metabolism (49). Choline and selenium, often overlooked in bone health discussions, emerged as potential contributors to higher BMD in our study. Although more research is needed to elucidate their specific mechanisms, choline is known to be involved in cell membrane synthesis, and selenium acts as an antioxidant that may protect bone tissue from oxidative stress (50, 51). The lack of significant differences in femoral BMD between individuals following a “LP-HDF-VitA-Mg” pattern and those adhering to a “LM-VitD-Ca” pattern suggests the need for further exploration. Differences in femoral BMD suggest that specific nutrients may interact in some way to counteract their individual effects on bone health in a given dietary pattern. This indicates the need for more in-depth research into the intricate interactions between nutrients and their combined effects on bone metabolism. At the same time, we need to recognize that individual differences, lifestyle factors, and physical activity levels are critical to the potential impact of study results. Individuals respond differently to various nutritional patterns, which, together with external factors such as exercise and lifestyle choices, may lead to variations in the relationship between diet and bone health.
Our study has several limitations. Firstly, since the NHANES femoral scans were conducted only on individuals aged 40 and above, our findings are not generalizable to a wider age range. Skeletal health is influenced by various factors throughout life, and limiting our sample to those over 40 may miss BMD changes in younger populations. Secondly, using femoral BMD as the sole outcome indicator diminishes the reliability of our results. While femoral BMD is an important measure of bone health, it does not fully represent overall skeletal health and may be affected by individual differences, measurement accuracy, and method consistency. Relying on a single metric may overlook other important aspects of bone health, limiting the study’s applicability and accuracy. Additionally, this study’s cross-sectional design makes it difficult to establish a causal relationship between nutritional patterns and BMD. A longitudinal study would better capture the temporal aspects of these associations and assess the impact of dietary changes on bone health over time. Lastly, factor analysis introduces potential subjectivity, affecting the reliability of identified dietary patterns and their relationship with BMD. Future studies should include diverse age groups, use a longitudinal design, adopt comprehensive covariates, and employ more objective data analysis measures to address these limitations.
6 Conclusion
In summary, our study shows that individuals adhering to a dietary regimen characterized by elevated levels of macronutrients, choline, and selenium demonstrate a diminished likelihood of experiencing low BMD. This suggests that the consumption of foods rich in these specific nutrients may confer benefits for skeletal health.
Data availability statement
Publicly available datasets were analyzed in this study. This data can be found at: https://wwwn.cdc.gov/nchs/nhanes/Default.aspx.
Ethics statement
This study involves the analysis of publicly available data obtained from the NHANES, which is managed by the CDC. Our research has adhered to the guidelines and terms of use as specified by the NHANES and CDC, ensuring that all data utilized in this study are anonymized and do not compromise the privacy or confidentiality of individual participants. No ethical approval was required for this study as it involved the use of existing, publicly available, anonymized data. The research conducted is in compliance with all applicable federal laws and institutional guidelines and adheres to the principles of the Declaration of Helsinki.
Author contributions
HR: Data curation, Formal analysis, Software, Visualization, Writing – original draft, Writing – review & editing. LQ: Writing – original draft. YY: Writing – original draft. SH: Writing – original draft. YS: Methodology, Writing – review & editing. FX: Funding acquisition, Project administration, Supervision, Writing – review & editing.
Funding
The author(s) declare that no financial support was received for the research, authorship, and/or publication of this article.
Conflict of interest
The authors declare that the research was conducted in the absence of any commercial or financial relationships that could be construed as a potential conflict of interest.
Publisher’s note
All claims expressed in this article are solely those of the authors and do not necessarily represent those of their affiliated organizations, or those of the publisher, the editors and the reviewers. Any product that may be evaluated in this article, or claim that may be made by its manufacturer, is not guaranteed or endorsed by the publisher.
References
1. Kanis, JA, and Kanis, JA. Assessment of fracture risk and its application to screening for postmenopausal osteoporosis: synopsis of a who report. Osteoporos Int. (1994) 4:368–81. doi: 10.1007/BF01622200
2. Johnell, O, and Kanis, JA. An estimate of the worldwide prevalence and disability associated with osteoporotic fractures. Osteoporos Int. (2006) 17:1726–33. doi: 10.1007/s00198-006-0172-4
3. Haentjens, P, Magaziner, J, Colón-Emeric, CS, Vanderschueren, D, Milisen, K, Velkeniers, B, et al. Meta-analysis: excess mortality after hip fracture among older women and men. Ann Intern Med. (2010) 152:380–90. doi: 10.7326/0003-4819-152-6-201003160-00008
5. Cosman, F, de Beur, SJ, LeBoff, MS, Lewiecki, EM, Tanner, B, Randall, S, et al. Clinician’s guide to prevention and treatment of osteoporosis. Osteoporos Int. (2014) 25:2359–81. doi: 10.1007/s00198-014-2794-2
6. Chen, C, Chen, Q, Nie, BE, Zhang, H, Zhai, H, Zhao, L, et al. Trends in bone mineral density, osteoporosis, and osteopenia among us adults with prediabetes, 2005–2014. Diabetes Care. (2020) 43:1008–15. doi: 10.2337/dc19-1807
7. Lee, D, and Lee, E. Influencing factors of bone mineral density in men. J Muscle Joint Health. (2011) 18:5–15. doi: 10.5953/JMJH.2011.18.1.005
8. Darling, AL, Millward, DJ, Torgerson, DJ, Hewitt, CE, and Lanham-New, SA. Dietary protein and bone health: a systematic review and meta-analysis. Am J Clin Nutr. (2009) 90:1674–92. doi: 10.3945/ajcn.2009.27799
9. Rizzoli, R, Stevenson, JC, Bauer, JM, van Loon, LJ, Walrand, S, Kanis, JA, et al. The role of dietary protein and vitamin d in maintaining musculoskeletal health in postmenopausal women: a consensus statement from the European society for clinical and economic aspects of osteoporosis and osteoarthritis (esceo). Maturitas. (2014) 79:122–32. doi: 10.1016/j.maturitas.2014.07.005
10. Hu, FB . Dietary pattern analysis: a new direction in nutritional epidemiology. Curr Opin Lipidol. (2002) 13:3–9. doi: 10.1097/00041433-200202000-00002
11. Adamsson, V, Reumark, A, Fredriksson, IB, Hammarström, E, Vessby, B, Johansson, G, et al. Effects of a healthy Nordic diet on cardiovascular risk factors in hypercholesterolaemic subjects: a randomized controlled trial (nordiet). J Intern Med. (2011) 269:150–9. doi: 10.1111/j.1365-2796.2010.02290.x
12. Estruch, R, Ros, E, Salas-Salvadó, J, Covas, M, Corella, D, Arós, F, et al. Primary prevention of cardiovascular disease with a mediterranean diet. N Engl J Med. (2013) 368:1279–90. doi: 10.1056/NEJMoa1200303
13. Yamada, S, Kabeya, Y, and Noto, H. Dietary approaches for Japanese patients with diabetes: a systematic review. Nutrients. (2018) 10:1080. doi: 10.3390/nu10081080
14. Millen, BE, Abrams, S, Adams-Campbell, L, Anderson, CA, Brenna, JT, Campbell, WW, et al. The 2015 dietary guidelines advisory committee scientific report: development and major conclusions. Adv Nutr. (2016) 7:438–44. doi: 10.3945/an.116.012120
15. Salehi-Abargouei, A, Esmaillzadeh, A, Azadbakht, L, Keshteli, AH, Feizi, A, Feinle-Bisset, C, et al. Nutrient patterns and their relation to general and abdominal obesity in iranian adults: findings from the sepahan study. Eur J Nutr. (2016) 55:505–18. doi: 10.1007/s00394-015-0867-4
16. Reedy, J, Subar, AF, George, SM, and Krebs-Smith, SM. Extending methods in dietary patterns research. Nutrients. (2018) 10:571. doi: 10.3390/nu10050571
17. Schwingshackl, L, and Hoffmann, G. Diet quality as assessed by the healthy eating index, the alternate healthy eating index, the dietary approaches to stop hypertension score, and health outcomes: a systematic review and meta-analysis of cohort studies. J Acad Nutr Diet. (2015) 115:780–800.e5. doi: 10.1016/j.jand.2014.12.009
18. Edefonti, V, La Vecchia, C, Di Maso, M, Crispo, A, Polesel, J, Libra, M, et al. Association between nutrient-based dietary patterns and bladder cancer in Italy. Nutrients. (2020) 12:1584. doi: 10.3390/nu12061584
19. Iwasaki, Y, Arisawa, K, Katsuura-Kamano, S, Uemura, H, Tsukamoto, M, Kadomatsu, Y, et al. Associations of nutrient patterns with the prevalence of metabolic syndrome: results from the baseline data of the Japan multi-institutional collaborative cohort study. Nutrients. (2019) 11:990. doi: 10.3390/nu11050990
20. Salehi-Abargouei, A, Esmaillzadeh, A, Azadbakht, L, Keshteli, AH, Afshar, H, Feizi, A, et al. Do patterns of nutrient intake predict self-reported anxiety, depression and psychological distress in adults? Sepahan study. Clin Nutr. (2019) 38:940–7. doi: 10.1016/j.clnu.2018.02.002
21. Ilesanmi-Oyelere, BL, and Kruger, MC. Nutrient and dietary patterns in relation to the pathogenesis of postmenopausal osteoporosis—a literature review. Life. (2020) 10:220. doi: 10.3390/life10100220
22. Newby, PK, and Tucker, KL. Empirically derived eating patterns using factor or cluster analysis: a review. Nutr Rev. (2004) 62:177–203. doi: 10.1111/j.1753-4887.2004.tb00040.x
23. Smith, AD, Emmett, PM, Newby, PK, and Northstone, K. A comparison of dietary patterns derived by cluster and principal components analysis in a Uk cohort of children. Eur J Clin Nutr. (2011) 65:1102–9. doi: 10.1038/ejcn.2011.96
24. Prevention CFDC . National center for health statistics. Nchs research ethics review board (erb) approval. (2003).
25. World Health Organization . Prevention and management of osteoporosis. World Health Organ Tech Rep Ser. (2003) 921:1–164.
26. Looker, AC, Melton, LJ, Borrud, LG, and Shepherd, JA. Lumbar spine bone mineral density in us adults: demographic patterns and relationship with femur neck skeletal status. Osteoporos Int. (2012) 23:1351–60. doi: 10.1007/s00198-011-1693-z
27. Willett, WC, Howe, GR, and Kushi, LH. Adjustment for total energy intake in epidemiologic studies. Am J Clin Nutr. (1997) 65:1220S–8S. doi: 10.1093/ajcn/65.4.1220S
28. Kyu, HH, Bachman, VF, Alexander, LT, Mumford, JE, Afshin, A, Estep, K, et al. Physical activity and risk of breast cancer, colon cancer, diabetes, ischemic heart disease, and ischemic stroke events: systematic review and dose-response meta-analysis for the global burden of disease study 2013. BMJ. (2016):354. doi: 10.1136/bmj.i3857
29. NHANES . Available at: https://wwwn.cdc.gov/Nchs/Nhanes/2015-2016/INQ_I.htm.
31. NHANES . Available at: https://wwwn.cdc.gov/nchs/nhanes/tutorials/weighting.aspx.
32. Manolagas, SC . From estrogen-centric to aging and oxidative stress: a revised perspective of the pathogenesis of osteoporosis. Endocr Rev. (2010) 31:266–300. doi: 10.1210/er.2009-0024
33. Noel, SE, Santos, MP, and Wright, NC. Racial and ethnic disparities in bone health and outcomes in the United States. J Bone Miner Res. (2020) 36:1881–905. doi: 10.1002/jbmr.4417
34. Wu, Q, and Dai, J. Racial/ethnic differences in bone mineral density for osteoporosis. Curr Osteoporos Rep. (2023) 21:670–84. doi: 10.1007/s11914-023-00838-y
35. Ahmad, I, Jafar, T, Mahdi, F, Arshad, M, Das, SK, Waliullah, S, et al. Association of vitamin d receptor (foki and bsmi) gene polymorphism with bone mineral density and their effect on 25-hydroxyvitamin d level in north indian postmenopausal women with osteoporosis. Indian J Clin Biochem. (2018) 33:429–37. doi: 10.1007/s12291-017-0706-x
36. Harris, SS, Eccleshall, TR, Gross, C, Dawson Hughes, B, and Feldman, D. The vitamin d receptor start codon polymorphism (fok i) and bone mineral density in premenopausal American Black and white women. J Bone Miner Res. (1997) 12:1043–8. doi: 10.1359/jbmr.1997.12.7.1043
37. Na, T, Zhang, W, Jiang, Y, Liang, Y, Ma, H, Warnock, DG, et al. The a563t variation of the renal epithelial calcium channel trpv5 among African Americans enhances calcium influx. Am J Physiol Renal Physiol. (2009) 296:F1042–51. doi: 10.1152/ajprenal.90771.2008
38. Peng, JB . Trpv5 and trpv6 in transcellular ca 2+ transport: regulation, gene duplication, and polymorphisms in African populations. Adv Exp Med Biol. (2011) 704:239–75. doi: 10.1007/978-94-007-0265-3_14
39. Arai, H, Miyamoto, KI, Taketani, Y, Yamamoto, H, Iemori, Y, Morita, K, et al. A vitamin d receptor gene polymorphism in the translation initiation codon: effect on protein activity and relation to bone mineral density in Japanese women. J Bone Miner Res. (1997) 12:915–21. doi: 10.1359/jbmr.1997.12.6.915
41. Ilić, K, Obradović, N, and Vujasinović-Stupar, N. The relationship among hypertension, antihypertensive medications, and osteoporosis: a narrative review. Calcif Tissue Int. (2013) 92:217–27. doi: 10.1007/s00223-012-9671-9
42. Sukumar, D, Schlussel, Y, Riedt, CS, Gordon, C, Stahl, T, and Shapses, SA. Obesity alters cortical and trabecular bone density and geometry in women. Osteoporos Int. (2011) 22:635–45. doi: 10.1007/s00198-010-1305-3
43. Kohrt, WM, Bloomfield, SA, Little, KD, Nelson, ME, and Yingling, VR. Physical activity and bone health. Med Sci Sports Exerc. (2004) 36:1985–96. doi: 10.1249/01.MSS.0000142662.21767.58
44. Warburton, DE, Nicol, CW, and Bredin, SS. Health benefits of physical activity: the evidence. CMAJ. (2006) 174:801–9. doi: 10.1503/cmaj.051351
45. Wolff, IV, Van Croonenborg, JJ, Kemper, H, Kostense, PJ, and Twisk, J. The effect of exercise training programs on bone mass: a meta-analysis of published controlled trials in pre-and postmenopausal women. Osteoporos Int. (1999) 9:1–12. doi: 10.1007/s001980050109
46. Johnson, RA, and Wichern, DW. Applied multivariate statistical analysis. Upper Saddle River, NJ: Prentice-Hall (2002).
47. Tapsell, LC, Neale, EP, Satija, A, and Hu, FB. Foods, nutrients, and dietary patterns: interconnections and implications for dietary guidelines. Adv Nutr. (2016) 7:445–54. doi: 10.3945/an.115.011718
48. Dawson-Hughes, B, and Harris, SS. Calcium intake influences the association of protein intake with rates of bone loss in elderly men and women. Am J Clin Nutr. (2002) 75:773–9. doi: 10.1093/ajcn/75.4.773
49. Kerstetter, JE, O’Brien, KO, and Insogna, KL. Dietary protein affects intestinal calcium absorption. Am J Clin Nutr. (1998) 68:859–65. doi: 10.1093/ajcn/68.4.859
50. Tucker, KL, Hannan, MT, Chen, H, Cupples, LA, Wilson, PW, and Kiel, DP. Potassium, magnesium, and fruit and vegetable intakes are associated with greater bone mineral density in elderly men and women. Am J Clin Nutr. (1999) 69:727–36. doi: 10.1093/ajcn/69.4.727
51. Weaver, CM, Gordon, CM, Janz, KF, Kalkwarf, HJ, Lappe, JM, Lewis, R, et al. The national osteoporosis foundation’s position statement on peak bone mass development and lifestyle factors: a systematic review and implementation recommendations. Osteoporos Int. (2016) 27:1281–386. doi: 10.1007/s00198-015-3440-3
Keywords: dietary pattern, bone mineral density, factor analysis, cluster analysis, cross-sectional study
Citation: Runting H, Qingyue L, Yining Y, Huiyu S, Shu Y and Xixi F (2024) Is bone mineral density in middle-aged and elderly individuals associated with their dietary patterns? A study based on NHANES. Front. Nutr. 11:1396007. doi: 10.3389/fnut.2024.1396007
Edited by:
Charlotte Cosemans, University of Hasselt, BelgiumReviewed by:
Zhongxin Zhou, Huazhong Agricultural University, ChinaMehran Rahimlou, Zanjan University of Medical Sciences, Iran
Seong-Hee Ko, Sookmyung Women’s University, Republic of Korea
Copyright © 2024 Runting, Qingyue, Yining, Huiyu, Shu and Xixi. This is an open-access article distributed under the terms of the Creative Commons Attribution License (CC BY). The use, distribution or reproduction in other forums is permitted, provided the original author(s) and the copyright owner(s) are credited and that the original publication in this journal is cited, in accordance with accepted academic practice. No use, distribution or reproduction is permitted which does not comply with these terms.
*Correspondence: Yang Shu, eWFuZ3NodUBjZHV0Y20uZWR1LmNu; Feng Xixi, MTAwMDU4MEBjbWMuZWR1LmNu