
95% of researchers rate our articles as excellent or good
Learn more about the work of our research integrity team to safeguard the quality of each article we publish.
Find out more
ORIGINAL RESEARCH article
Front. Nutr. , 18 April 2024
Sec. Nutrition and Sustainable Diets
Volume 11 - 2024 | https://doi.org/10.3389/fnut.2024.1388645
 Nan Li1,2†Liangzi Cong3†
 Heng Wang4†Yamin Chen1Zhaowei Liu5Mingliang Li5Dong Yang6
 Huzhong Li1*
 Haiqin Fang1*
Objective: This study aimed to establish an accurate and efficient scientific calculation model for the nutritional composition of catering food to estimate energy and nutrient content of catering food.
Methods: We constructed a scientific raw material classification database based on the Chinese food composition table by calculating the representative values of each food raw material type. Using China’s common cooking methods, we cooked 150 dishes including grains, meat, poultry, fish, eggs, and vegetables and established a database showing the raw and cooked ratios of various food materials by calculating the ratio of raw to cooked and the China Total Diet Research database. The effects of various cooking methods on the nutritional composition of catering food were analyzed to determine correction factors for such methods on the nutritional components. Finally, we linked the raw material classification, raw and cooked ratio, and nutritional component correction factor databases to establish a model for calculating the nutritional components of catering food. The model was verified with nine representative Chinese dishes.
Results: We have completed the construction of an accurate and efficient scientific calculation model for the nutritional composition of catering food, which improves the accuracy of nutrition composition calculation.
Conclusion: The model constructed in this study was scientific, accurate, and efficient, thereby promising in facilitating the accurate calculation and correct labeling of nutritional components in catering food.
With the development of society and the acceleration of the pace of life, an increasing number of people chose to dine out in China (1). The nutritional quality of food supplied provided by the catering industry is of particular concerning, as these foods may account for a significant proportion of the daily food intake, and even of the total intake of the population. However, many consumers are less aware of the energy, fat, and sodium (Na) content of the food provided by restaurants, and excessive consumption of these foods increases the risk of chronic diseases, such as coronary heart disease (2, 3).
The nutrition label of catering food can help consumers understand the nutrient type and content in various dishes and guide them to make reasonable choices according to their own needs to improve their quality of life (4, 5). In December 2020, the National Health Commission of the People’s Republic of China issued “Guidelines for Nutritional Labeling of Catering Food.” This guideline clearly defines the basic labeling content (energy, fat, and Na) and optional labeling content (protein, carbohydrates, sugar, minerals, and vitamins) (6). Since the release of this guideline, catering enterprises have provided nutrient content labels. However, the accuracy of the calculated nutritional components is uncertain. Therefore, it is necessary to establish a scientific and accurate model for calculating and labeling the nutrient content of catering food.
Currently, data from the nutritional composition database of catering food are primarily based on the Chinese food composition tables (7, 8). It is difficult to scientifically classify and calculate some food subcategories with different names in different regions (9), and the nutrient composition of the same food can vary with the maturity of the food materials. Therefore, a scientific nutrient classification database and a raw and cooked ratio database of food materials are necessary for a nutritional composition calculation model. In addition, considering the diverse cooking methods in traditional Chinese food, it is necessary to explore the impact of different cooking methods on nutritional components, in order to determine the differences between the calculated value and the measured value of nutritional components in catering food, and to identify the correction factors for the effects of these cooking methods.
Therefore, we established three databases regarding the raw material classification database, raw-to-ripe ratio of materials, and correction factors. Using computer technology, we linked these databases to our calculation model. Furthermore, we validated the model using nine test dishes and found that the model is scientific and reasonable, indicating its potential in providing technical support for the accurate calculation and correct identification of nutritional components in catering food.
After interviewing with 24 nutrition experts and 18 workers in the catering food industry thrice, we formulated a food sampling plan for different cooking methods (Table 1). We then included 150 samples encompassing the following five categories: grains, meat (chicken, pig, beef, and mutton), fish, eggs, and vegetables (green leafy vegetables and potatoes). The sampling principle followed the requirements of national food safety risk monitoring (10). From different supermarkets, farmers’ markets, and e-commerce platforms (Carrefour supermarkets, local farmers’ markets, and Jing dong online malls) in Beijing, three raw material samples were collected at 2 kg each for each ingredient type (rice, noodles, chicken breast, chicken leg, pork belly, pork legs, brisket, beef tendon, leg of lamb, grass carp, scallops, shrimp, eggs, leafy vegetables, potato). We strictly follow the basic principles of timely sampling, rapid transportation, complete information, and safe storage to collect, transport, preserve, and cook these samples.
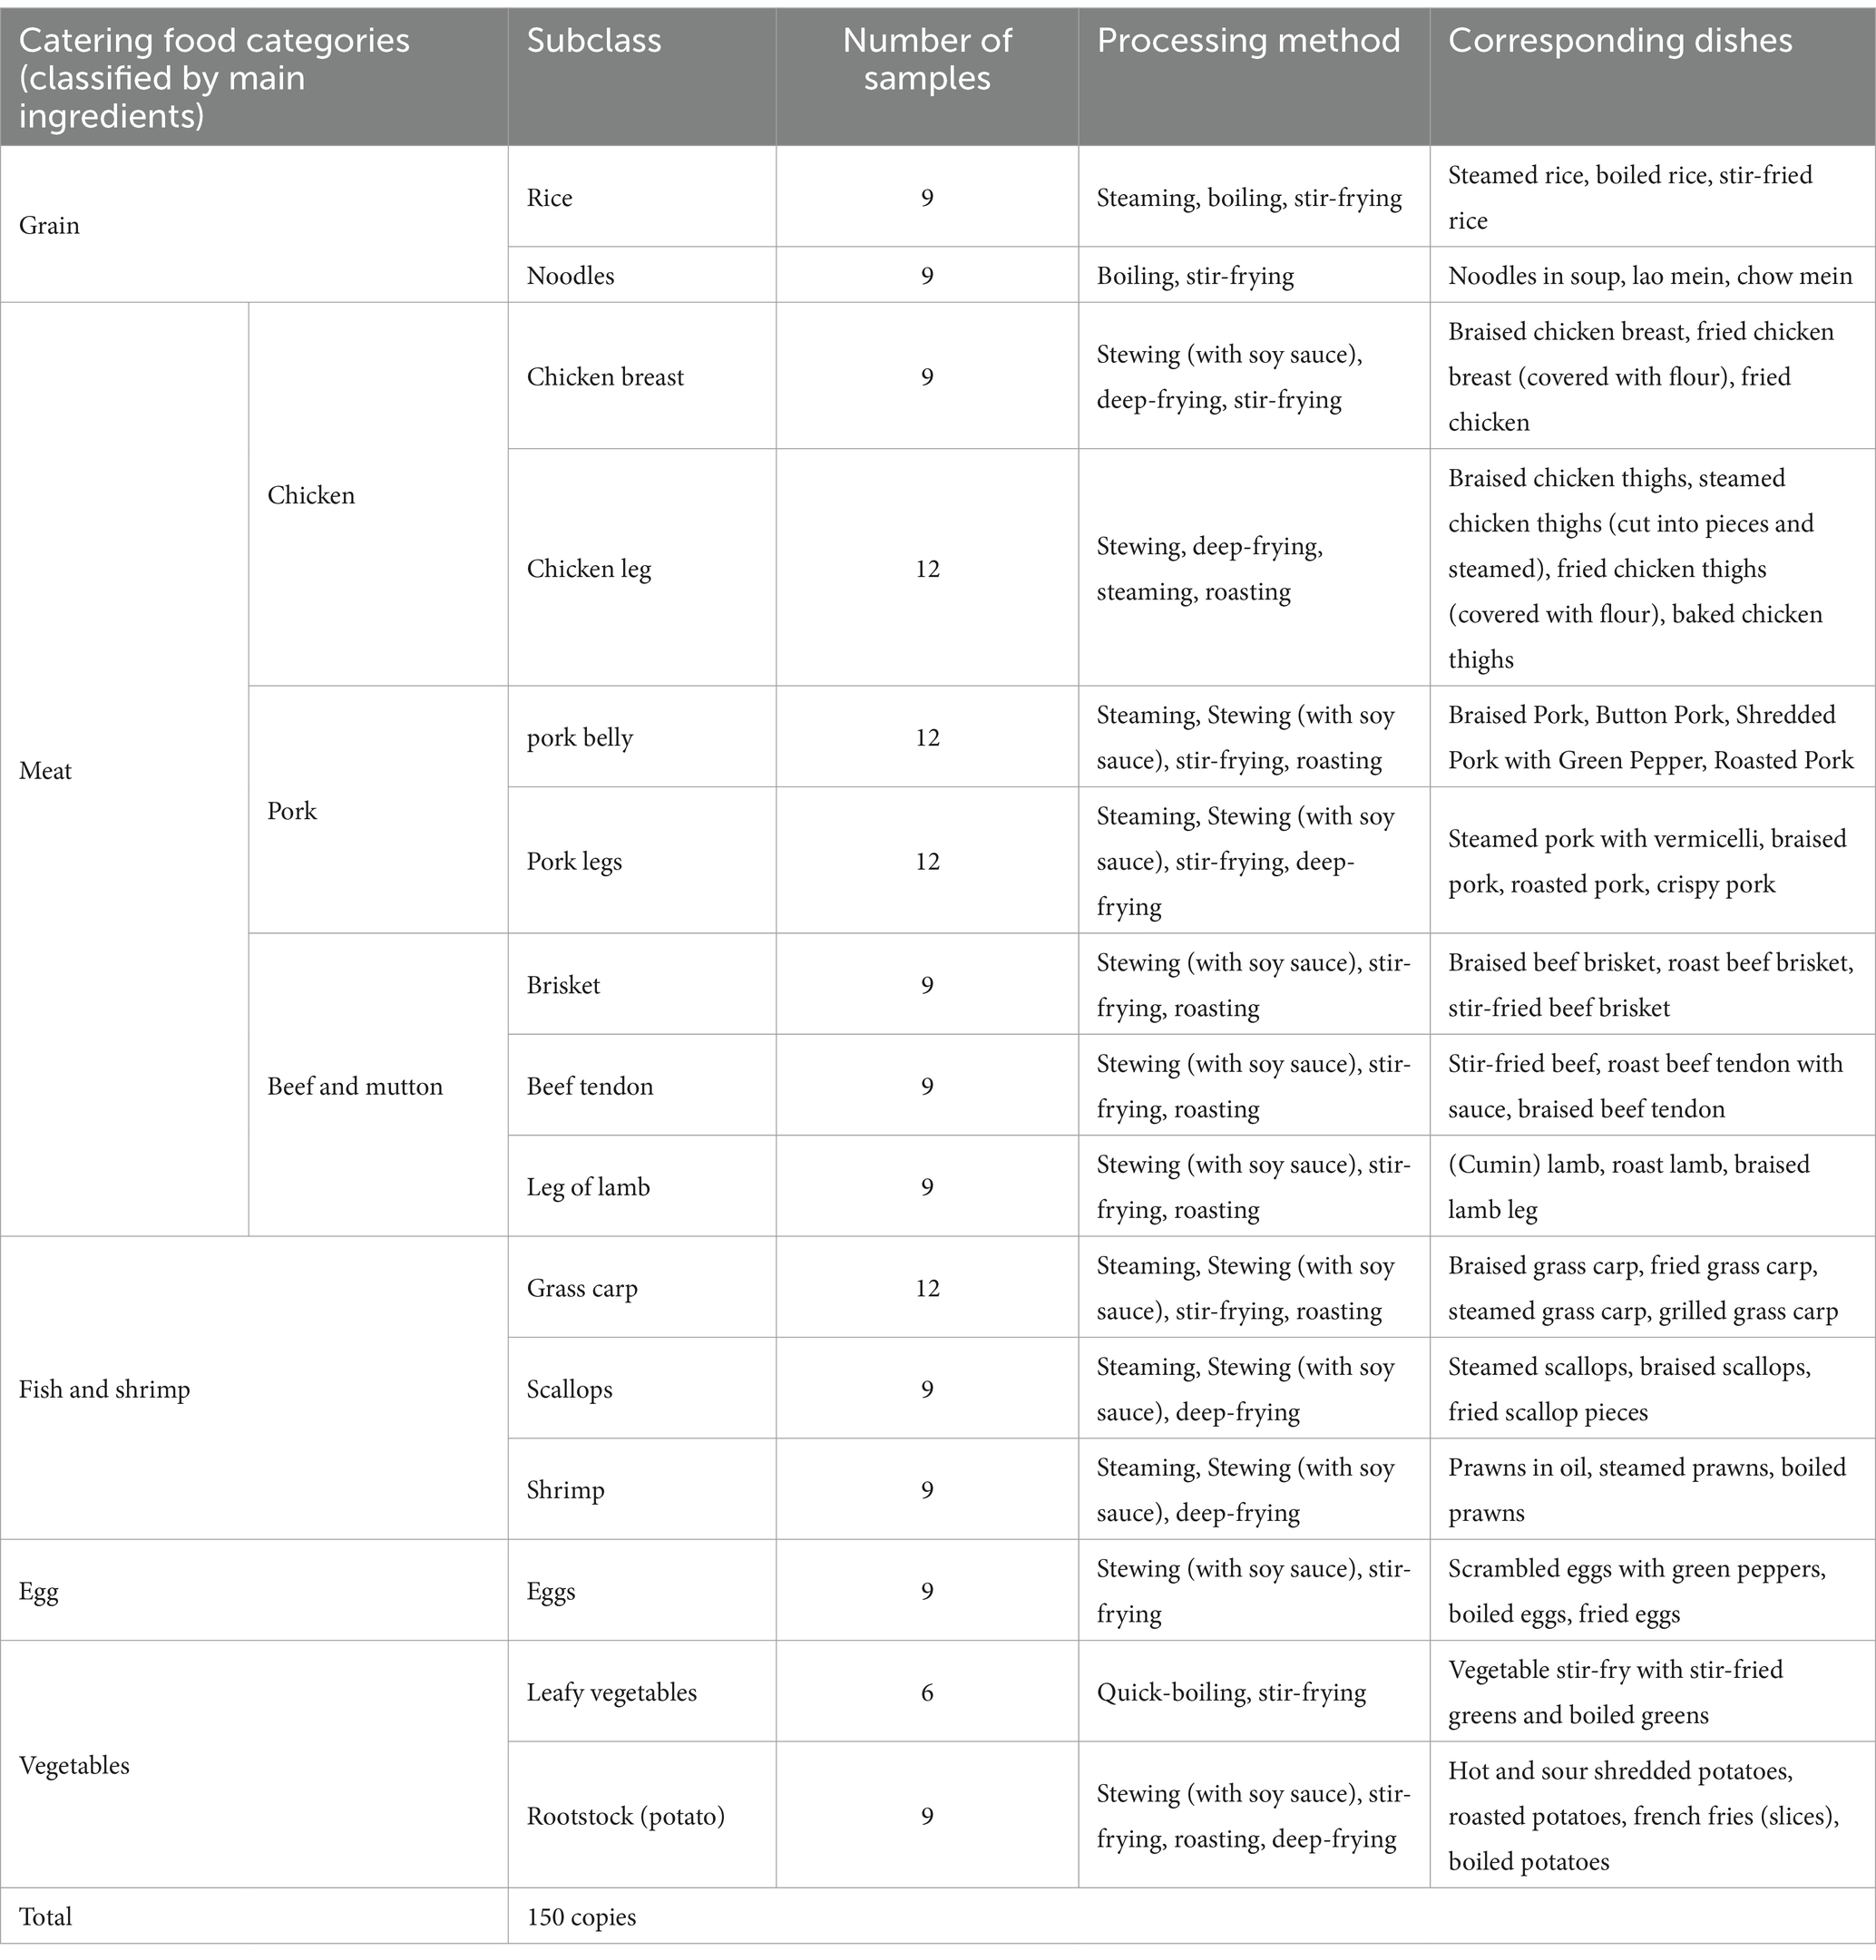
Table 1. Number of catering food processing plans.
After collecting the raw material samples, we processed the food according to the plan with different cooking methods. A total of 150 dishes were cooked. Before cooking, we weighed and recorded the raw materials and seasonings (oil, salt, chicken essence, soy sauce, curd, vinegar, and sugar). The ingredients accurate to 1 g, and the seasonings accurate to 0.1 g. Supplementary Figure S1 shows the weighing procedure. After weighing, we cooked the food, conforming to the traditional Chinese cooking methods, including steaming, boiling (usually with soy sauce), and stir-frying. Supplementary Figure S2 illustrates the cooking process of 150 dishes and some finished dishes. Dishes with different cooking methods were weighed after cooking.
On the basis of the Guidelines for Nutritional Labeling of Catering Foods, we detected fat, protein, carbohydrate and Na in the 150 sample dishes after cooking. Before detection, the inedible parts such as bones/shells were removed and weighed. Fat, protein, ash, and Na were determined according to the relevant national food safety standards (11–14). Carbohydrate content was calculated using the following formula: carbohydrate = total mass – water – ash – protein − fat.
The standard substance, which was used for quality control, was protein/fat in milk powder (FD080-QC) purchased from LGC Technology. Na [GBW10045 (GSB-23)] and ash (RM-18023) in milk powder were both purchased from the Center Testing International Group Co., Ltd. Based on the experimental scheme, the detection results were compared to verify the reliability of the detection method.
In this study, we classified the raw food materials according to the nutritional composition data in the Chinese food composition tables and calculated the representative value of nutrients. Based on this classification, we established a scientific nutritional composition classification database with a wider coverage. Afterward, we selected rice, noodles, beef, pork, mutton, chicken, fish, eggs, potatoes, and green vegetables, which contributed major of nutrients intake in Chinese cooking. Using the most common cooking methods (steaming, boiling, stir-frying, and deep-frying), we cooked 150 Chinese dishes. Thereafter, the nutrients were detected in the laboratory and calculated according to a nutrition calculation formula. Subsequently, we compared the differences between the detected and calculated values of macronutrients and Na in 150 dishes by the various cooking methods. The main effects of the cooking methods on the macronutrients and Na for each ingredient were analyzed, and the correction factors were determined according to the influence of the different cooking methods. In addition, we calculated the actual raw and cooked ratio of different ingredients in 150 dishes and established a raw and cooked ratio database based on the various cooking methods. Finally, we linked the nutrient composition classification, raw and cooked ratio, and correction factor databases to the calculation model. We verified the accuracy of the model‘s calculation results by comparing the calculated and the detected values of nutritional components in nine dishes.
We first referred the nutritional composition data of food raw materials to the China Food Composition Tables to establish the general category of each food raw material; then, we divided the general category into subcategories (Figure 1). After that, we assigned representative values of nutritional components to each subcategory to ensure the reference of nutritional components for the same or similar categories.
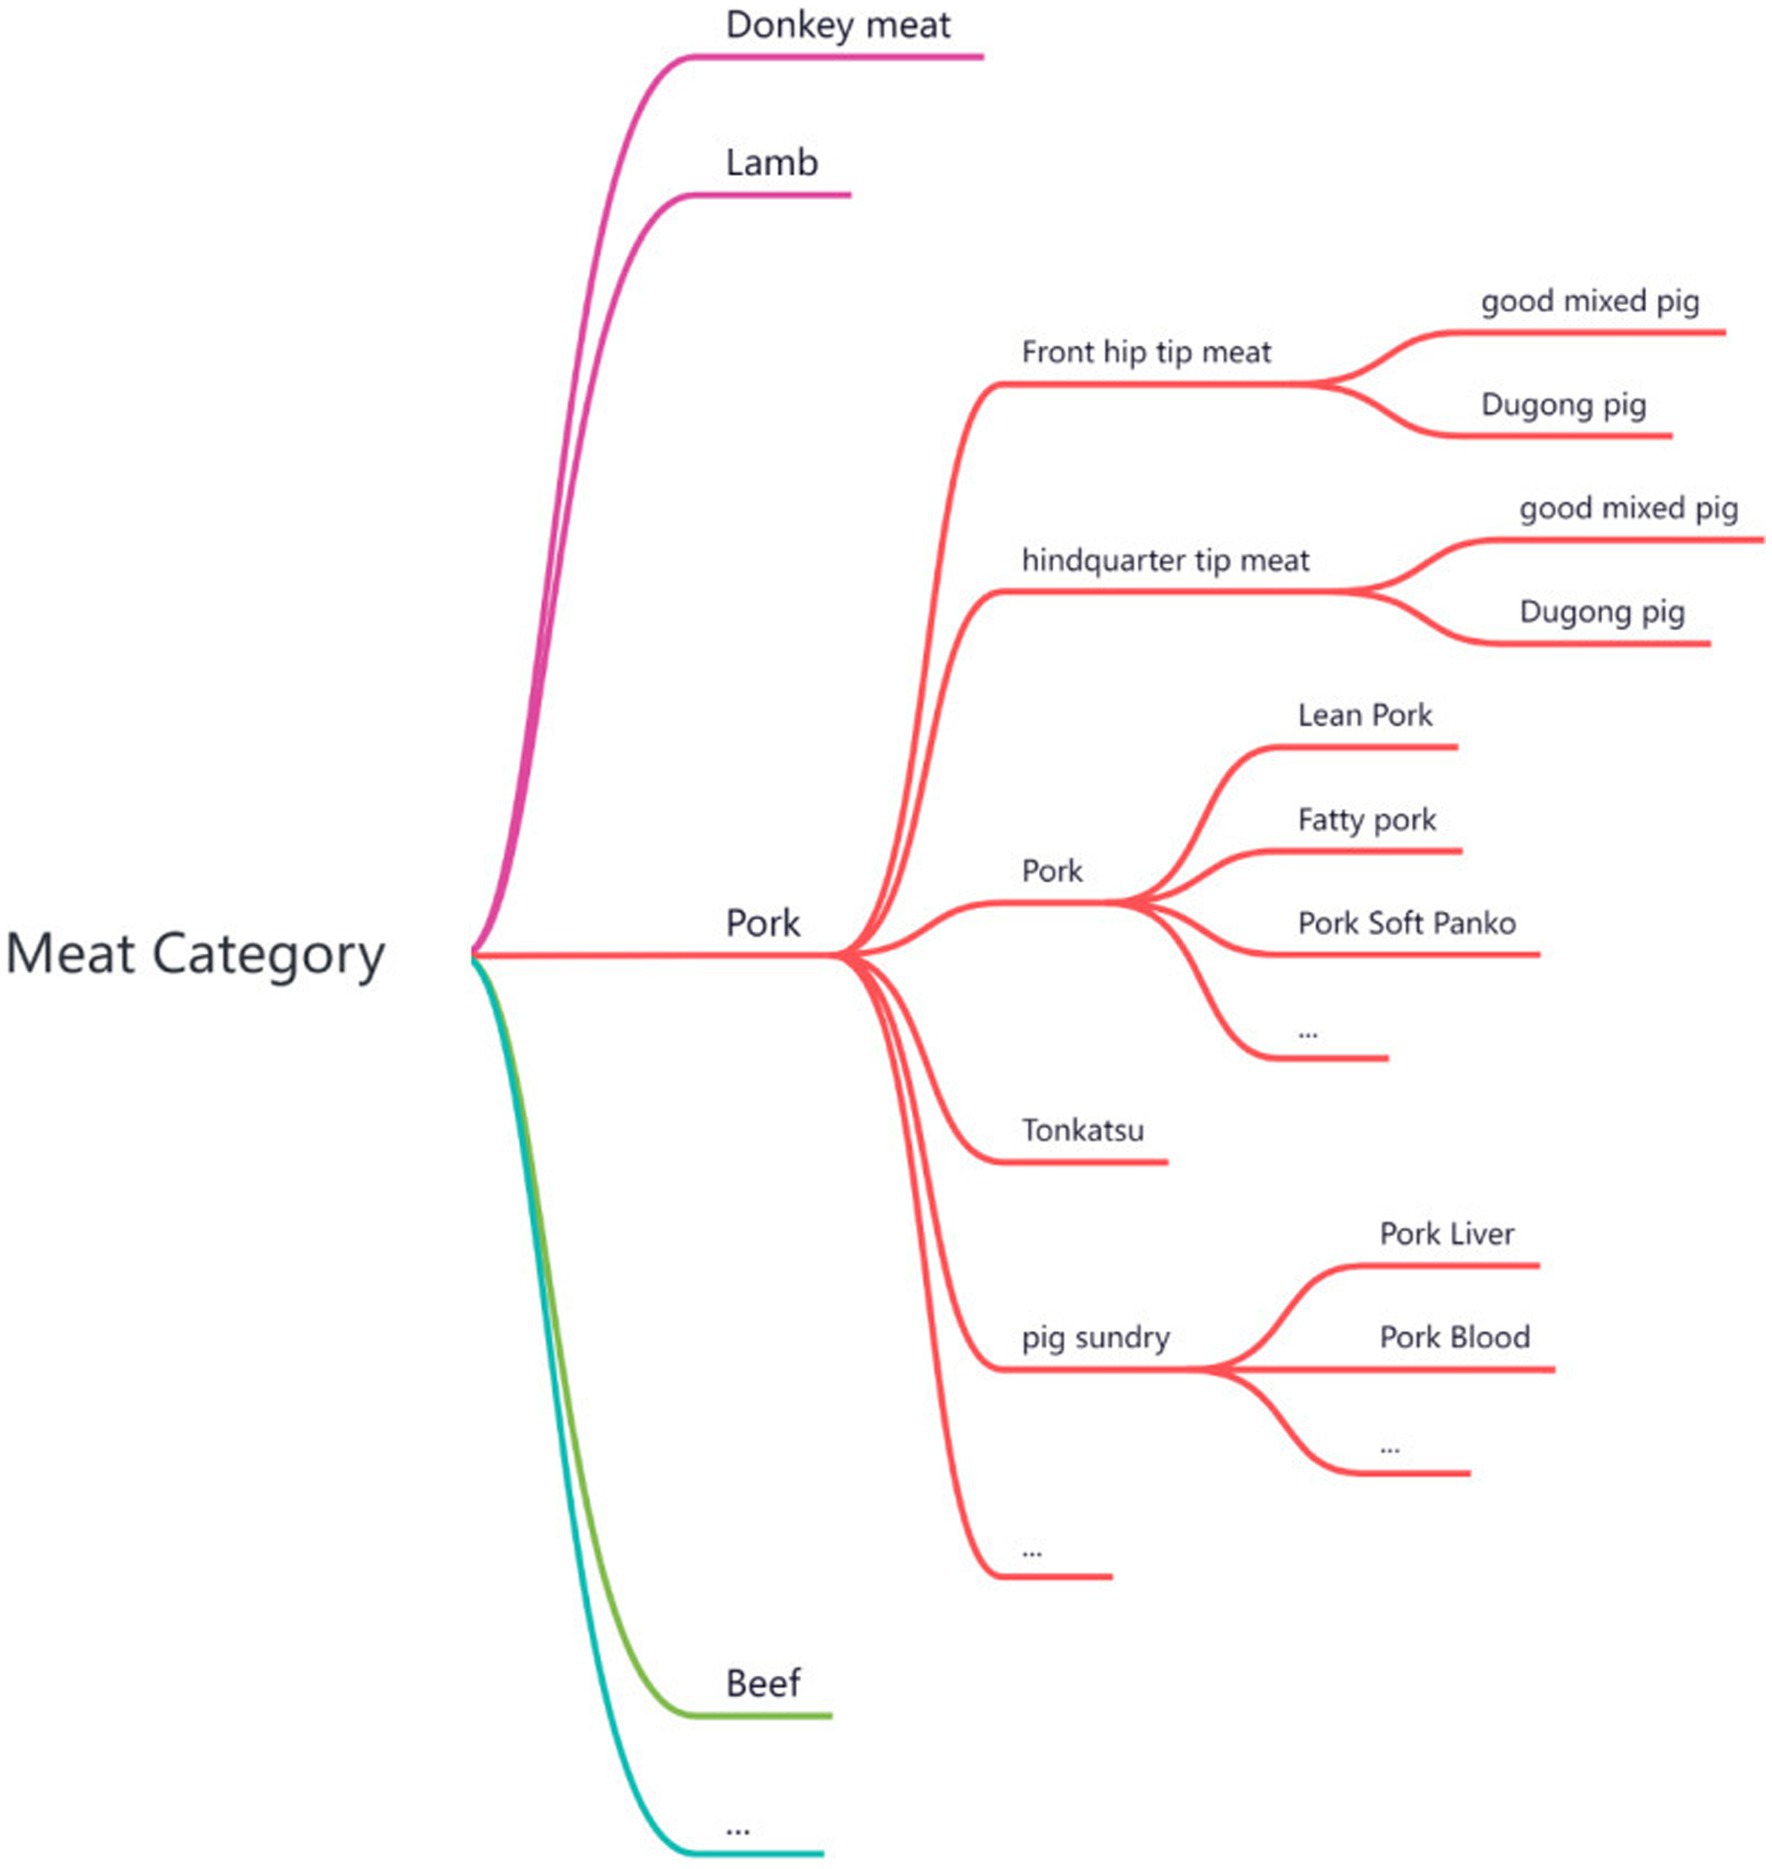
Figure 1. Diagram of the food raw material subcategories.
To represent the raw and cooked ratio of the food, we calculated the mean value of the raw and cooked ratio of food samples in different provinces included in the Fifth China Total Diet Study (15). First, the grains (rice, flour), poultry meat, livestock meat, fish, shrimp, eggs, and vegetables (green leafy vegetables and potatoes) that contribute greatly to energy and macronutrients (carbohydrates, protein, and fat) were selected and then cooked by steaming, boiling, stir-frying, deep-frying, and roasting. Next, we weighed the raw materials and finished products of the catering food and calculated the actual raw and cooked ratio, thereby establishing a raw and cooked ratio database based on cooking methods.
The calculation of nutritional components of catering food should be to multiply the content of nutritional components in the raw materials by the quality and obtain the amount of nutritional components in each portion. At the same time, it should be considered that the difference of the quality of raw materials and finished products. Therefore, the quality of cooked food should be obtained by combining the ratio of raw and cooked food, and then the value of nutritional components of catering food in the quality of 100 g cooked food should be calculated. At present, the nutritional content of raw materials has a corresponding database, that is, the Chinese food composition table, so it is possible to calculate the nutritional content of catering food through the model.
The calculation model program of the present study was based on Browser/Server architecture. For the calculation of the nutritional value of the catering food, in the back-end code, the list of ingredients to be calculated is used as input, and the list contains the nutrient content information of each ingredient (content per 100 g) and the quality of the ingredients. In the calculation process, first, the list of ingredients is traversed to calculate the content of each nutrient in each ingredient. After that, the calculated nutrient content of each food material is summed according to the type, and obtained the nutrient content of the catering food.
Nutrient calculation formula is:
Where “n” represents the number of ingredients, “i” represents ingredient i, “Nutrientsi” represents the nutrient content of the ingredient i, and “quantityi” represents the quality of the ingredient i.
The calculation formula of nutrient reference value is:
In the formula, represents the actual nutrient reference value of the catering food, and represents the recommended nutrient intake.
The above calculation content pseudo-code can be expressed as:
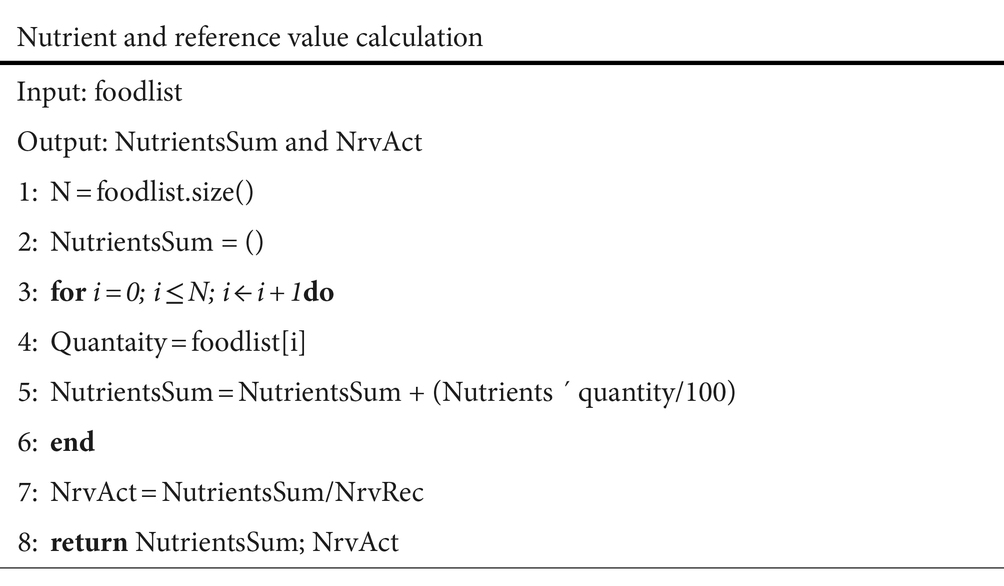
Note:
1. In the specific calculation process, Nutrientsi can be replaced by any nutrient, which is an abstract expression here.
2. Pseudo-code is only the general calculation process of the program, which is a method to describe the calculation logic.
Based on the above nutrient calculation, the calculation model was designed using two formulas, as shown in Equation 1 and Equation 2. Finally, a calculation model program with user-friendly interface is established. Users could freely enter food information, such as food name, and description, quantity into the system. Food material information was directly linked to the food database in this system. After entering the name of the ingredient, the system would automatically search and caculate for relevant information.
Equation 1 Calculation formula for nutrient composition
Equation 2 Calculation formula for Sodium and fat calculation formula
It has been reported that nutrients in food are affected by cooking methods (16–19). By practical operation in the present study, we find the difference between the detection values and the calculated values of catering foods under different cooking methods, such as the fat content of roast beef is higher than that of stewed beef of the same piece of beef. After computing the ratio of the calculated and detection values, it is obvious that many ratios were ≤ 0.5 or ≥ 2, indicating a large difference between these two values. This study proposes correction factors under different cooking methods used to calculate the nutritional components.
By identifying the ratio of the calculated and detection values of raw materials for different cooking methods, we established a correction factor database between these values and linked it to the model to correct the model. Equation 3 and 4 show the corrected model.
Equation 3 Corrected calculation model.
Calculation formula for nutrient composition
Equation 4 Corrected calculation model.
Sodium and fat calculation formula.
Note: The “Food quality of edible part (raw)” in Equations 1—4 refers to the weight of the edible part of the raw material before cooking food. “Nutrient content” refers to the content value of each nutrient in the raw material in the Chinese food composition table, and “weight” is the weight of the food after cooking. In this study, the amount of fat not fully absorbed by food in food or edible oil was also included.
Based on the common catering food of Chinese residents, we selected and weighed various food raw materials (such as rice, eggs, chicken, pork, zucchini, lettuce, broccoli, etc) and seasonings, and then processed nine dishes. Subsequently, we detected the actual nutritional components (total fat, carbohydrate, protein, and Na) and energy values of these dishes. We used the model before and after correction to calculate these nutritional components and energy values. Thereafter, we compared the difference between the calculated values of the model and the detected values before and after correction.
The detection values of nutrient content in various catering foods were analyzed by IBM SPSS Statistics version 26 (IBM SPSS Inc., Chicago, United States), and the data were statistically analyzed in the form of mean ± standard deviation.
Generally speaking, as food material matures, their quality and nutrient content will change. In this study, we calculated the raw and cooked ratio of 150 samples and established the raw and cooked ratio database. Table 2 shows the results.
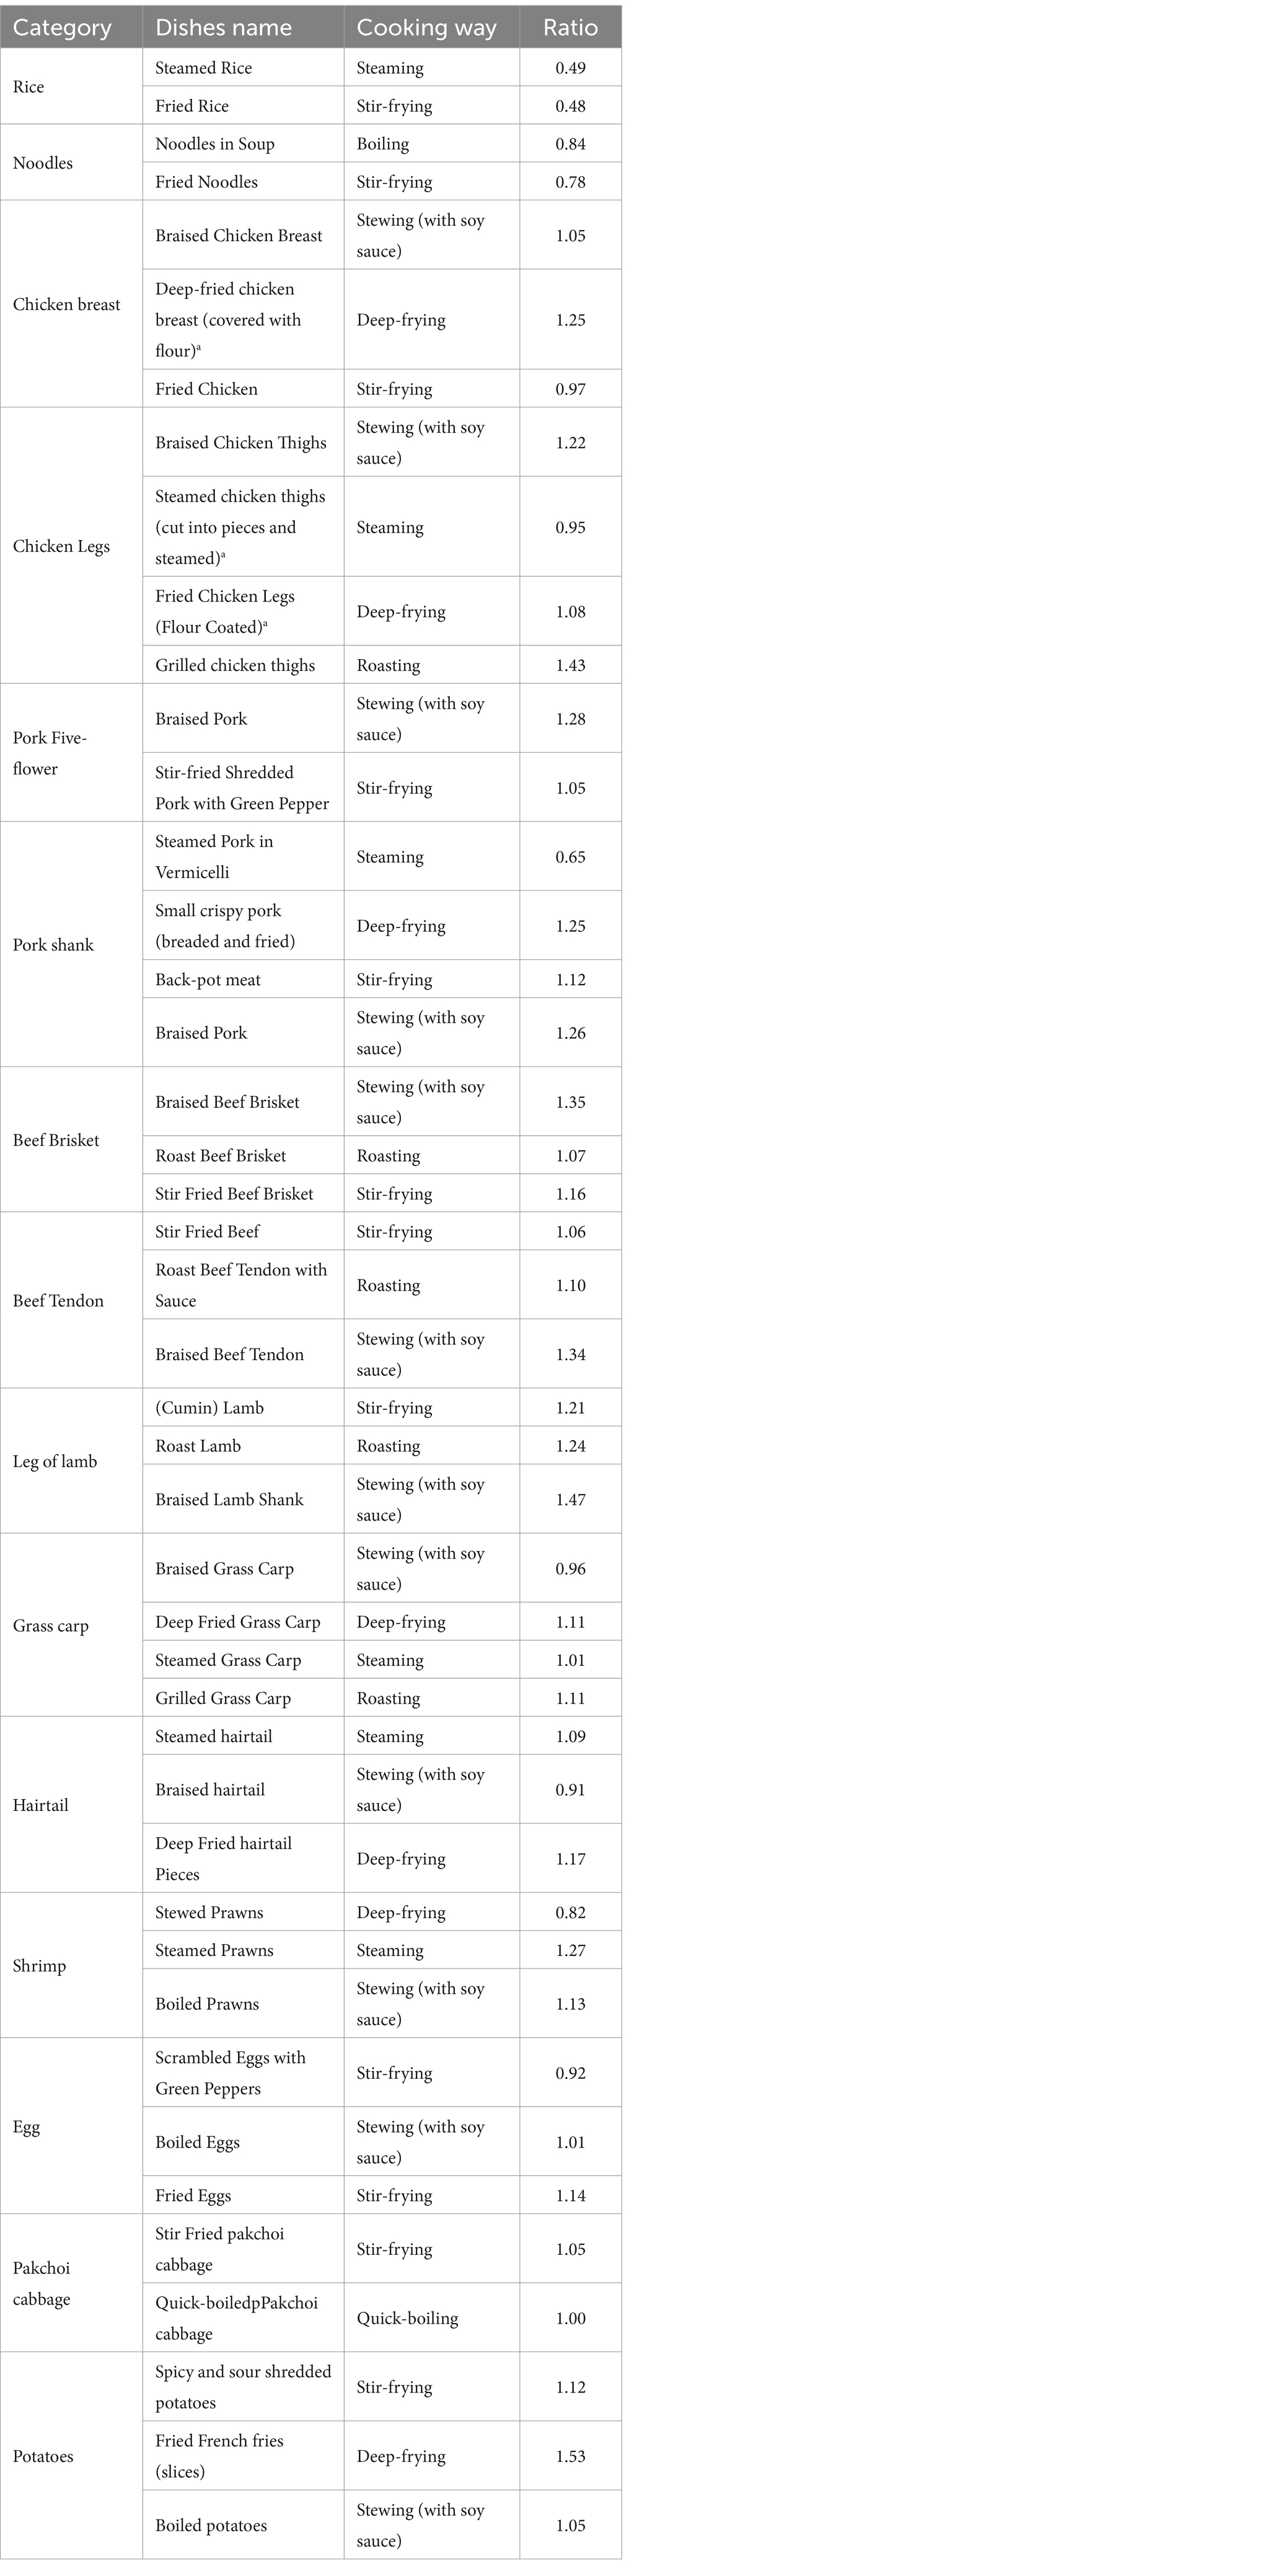
Table 2. Calculation results of the raw and cooked ratio of the processed food samples.
Using the detection method, we identified the nutritional components of the 150 samples. Table 3 shows the results.
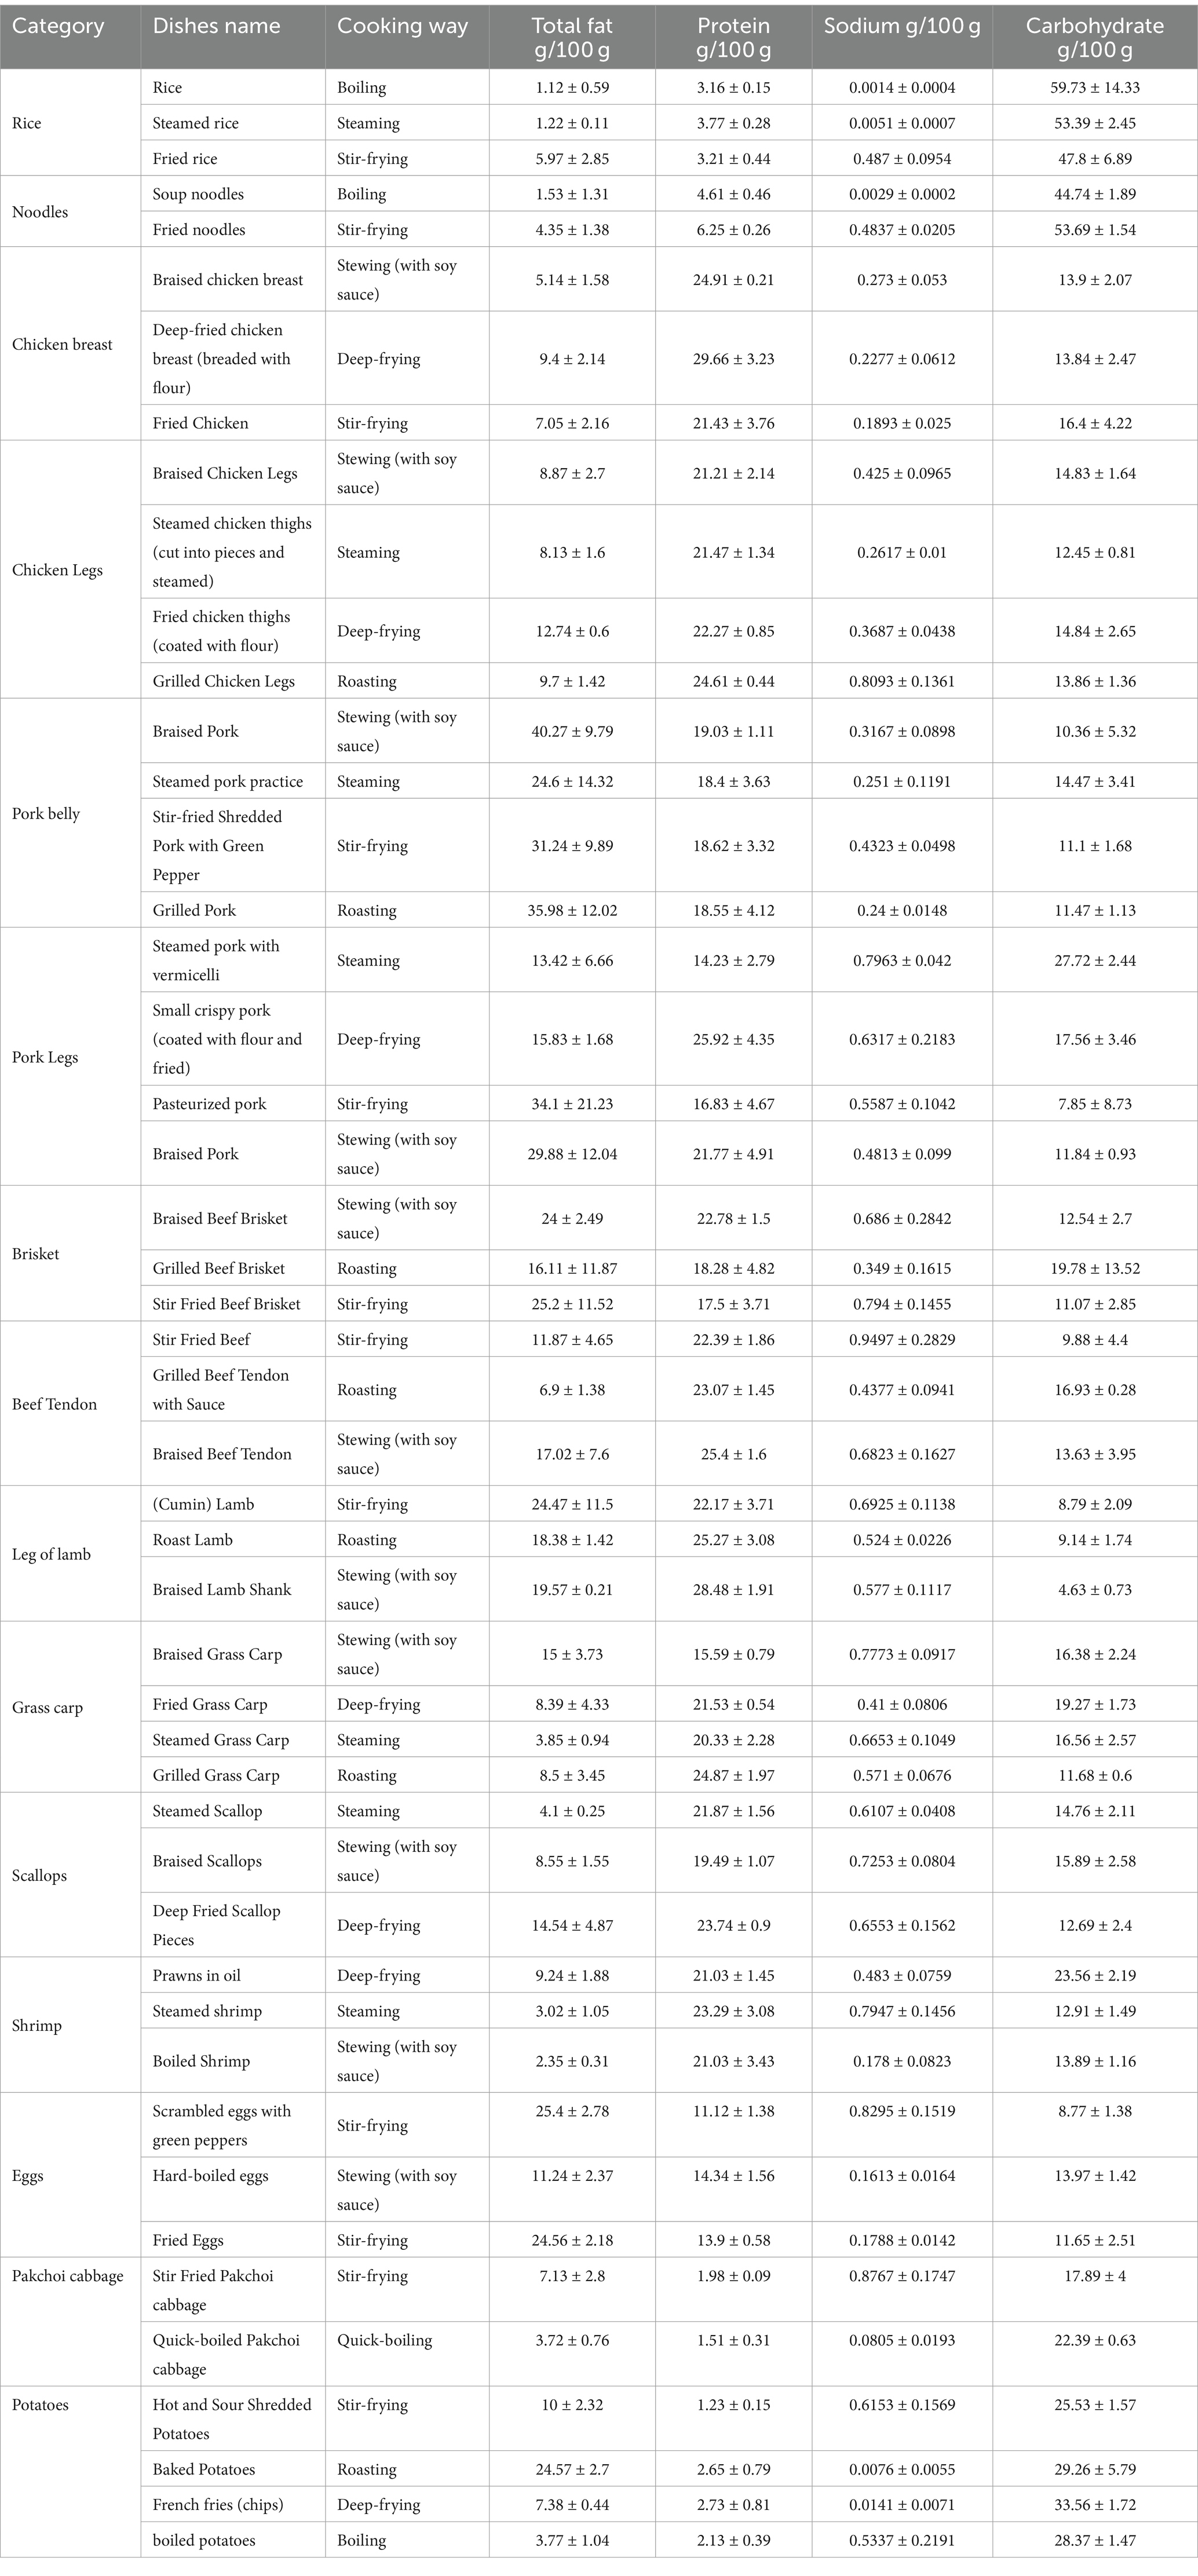
Table 3. Detection value of macronutrients in catering food.
Using the established model, we calculated the nutritional components of the 150 sample dishes (Table 4).
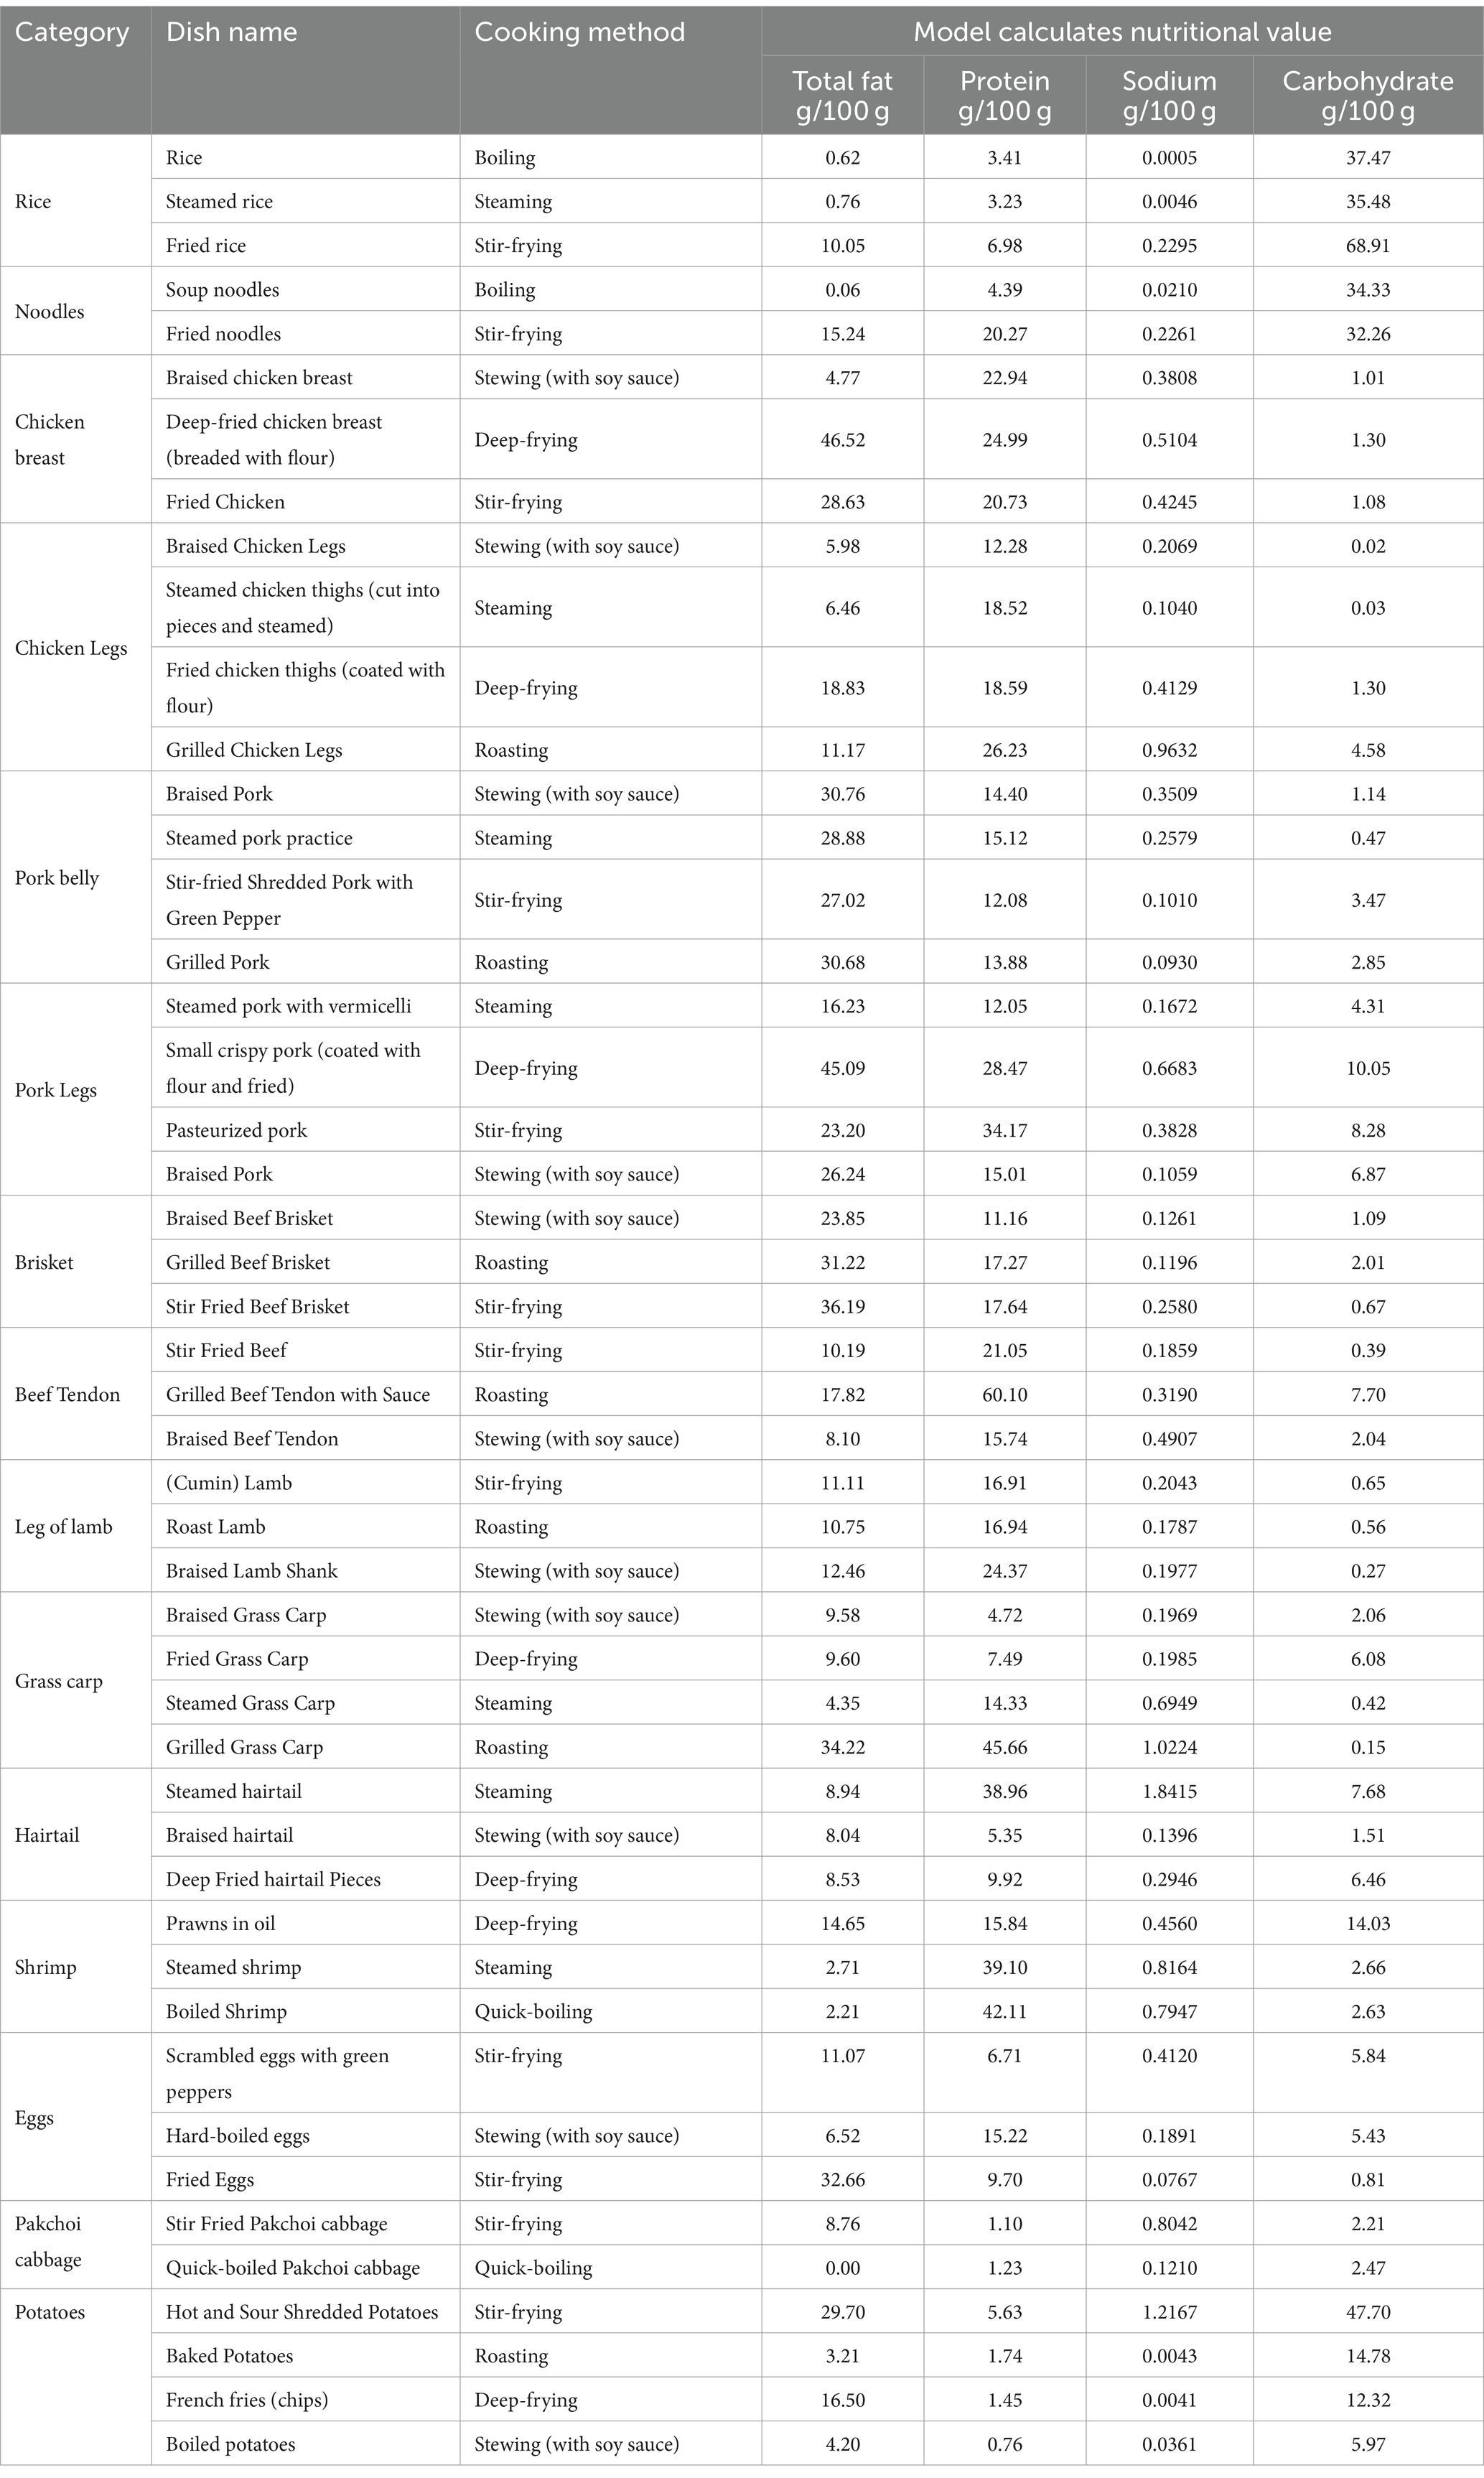
Table 4. Calculated values of macronutrients of the sample dishes with different cooking methods.
According to the screening principle of the ratio of the calculation value to the detection value of ≤0.5 or ≥ 2, we corrected the calculation models of the nutritional components. Table 5 enumerates the examples of specific corrections.
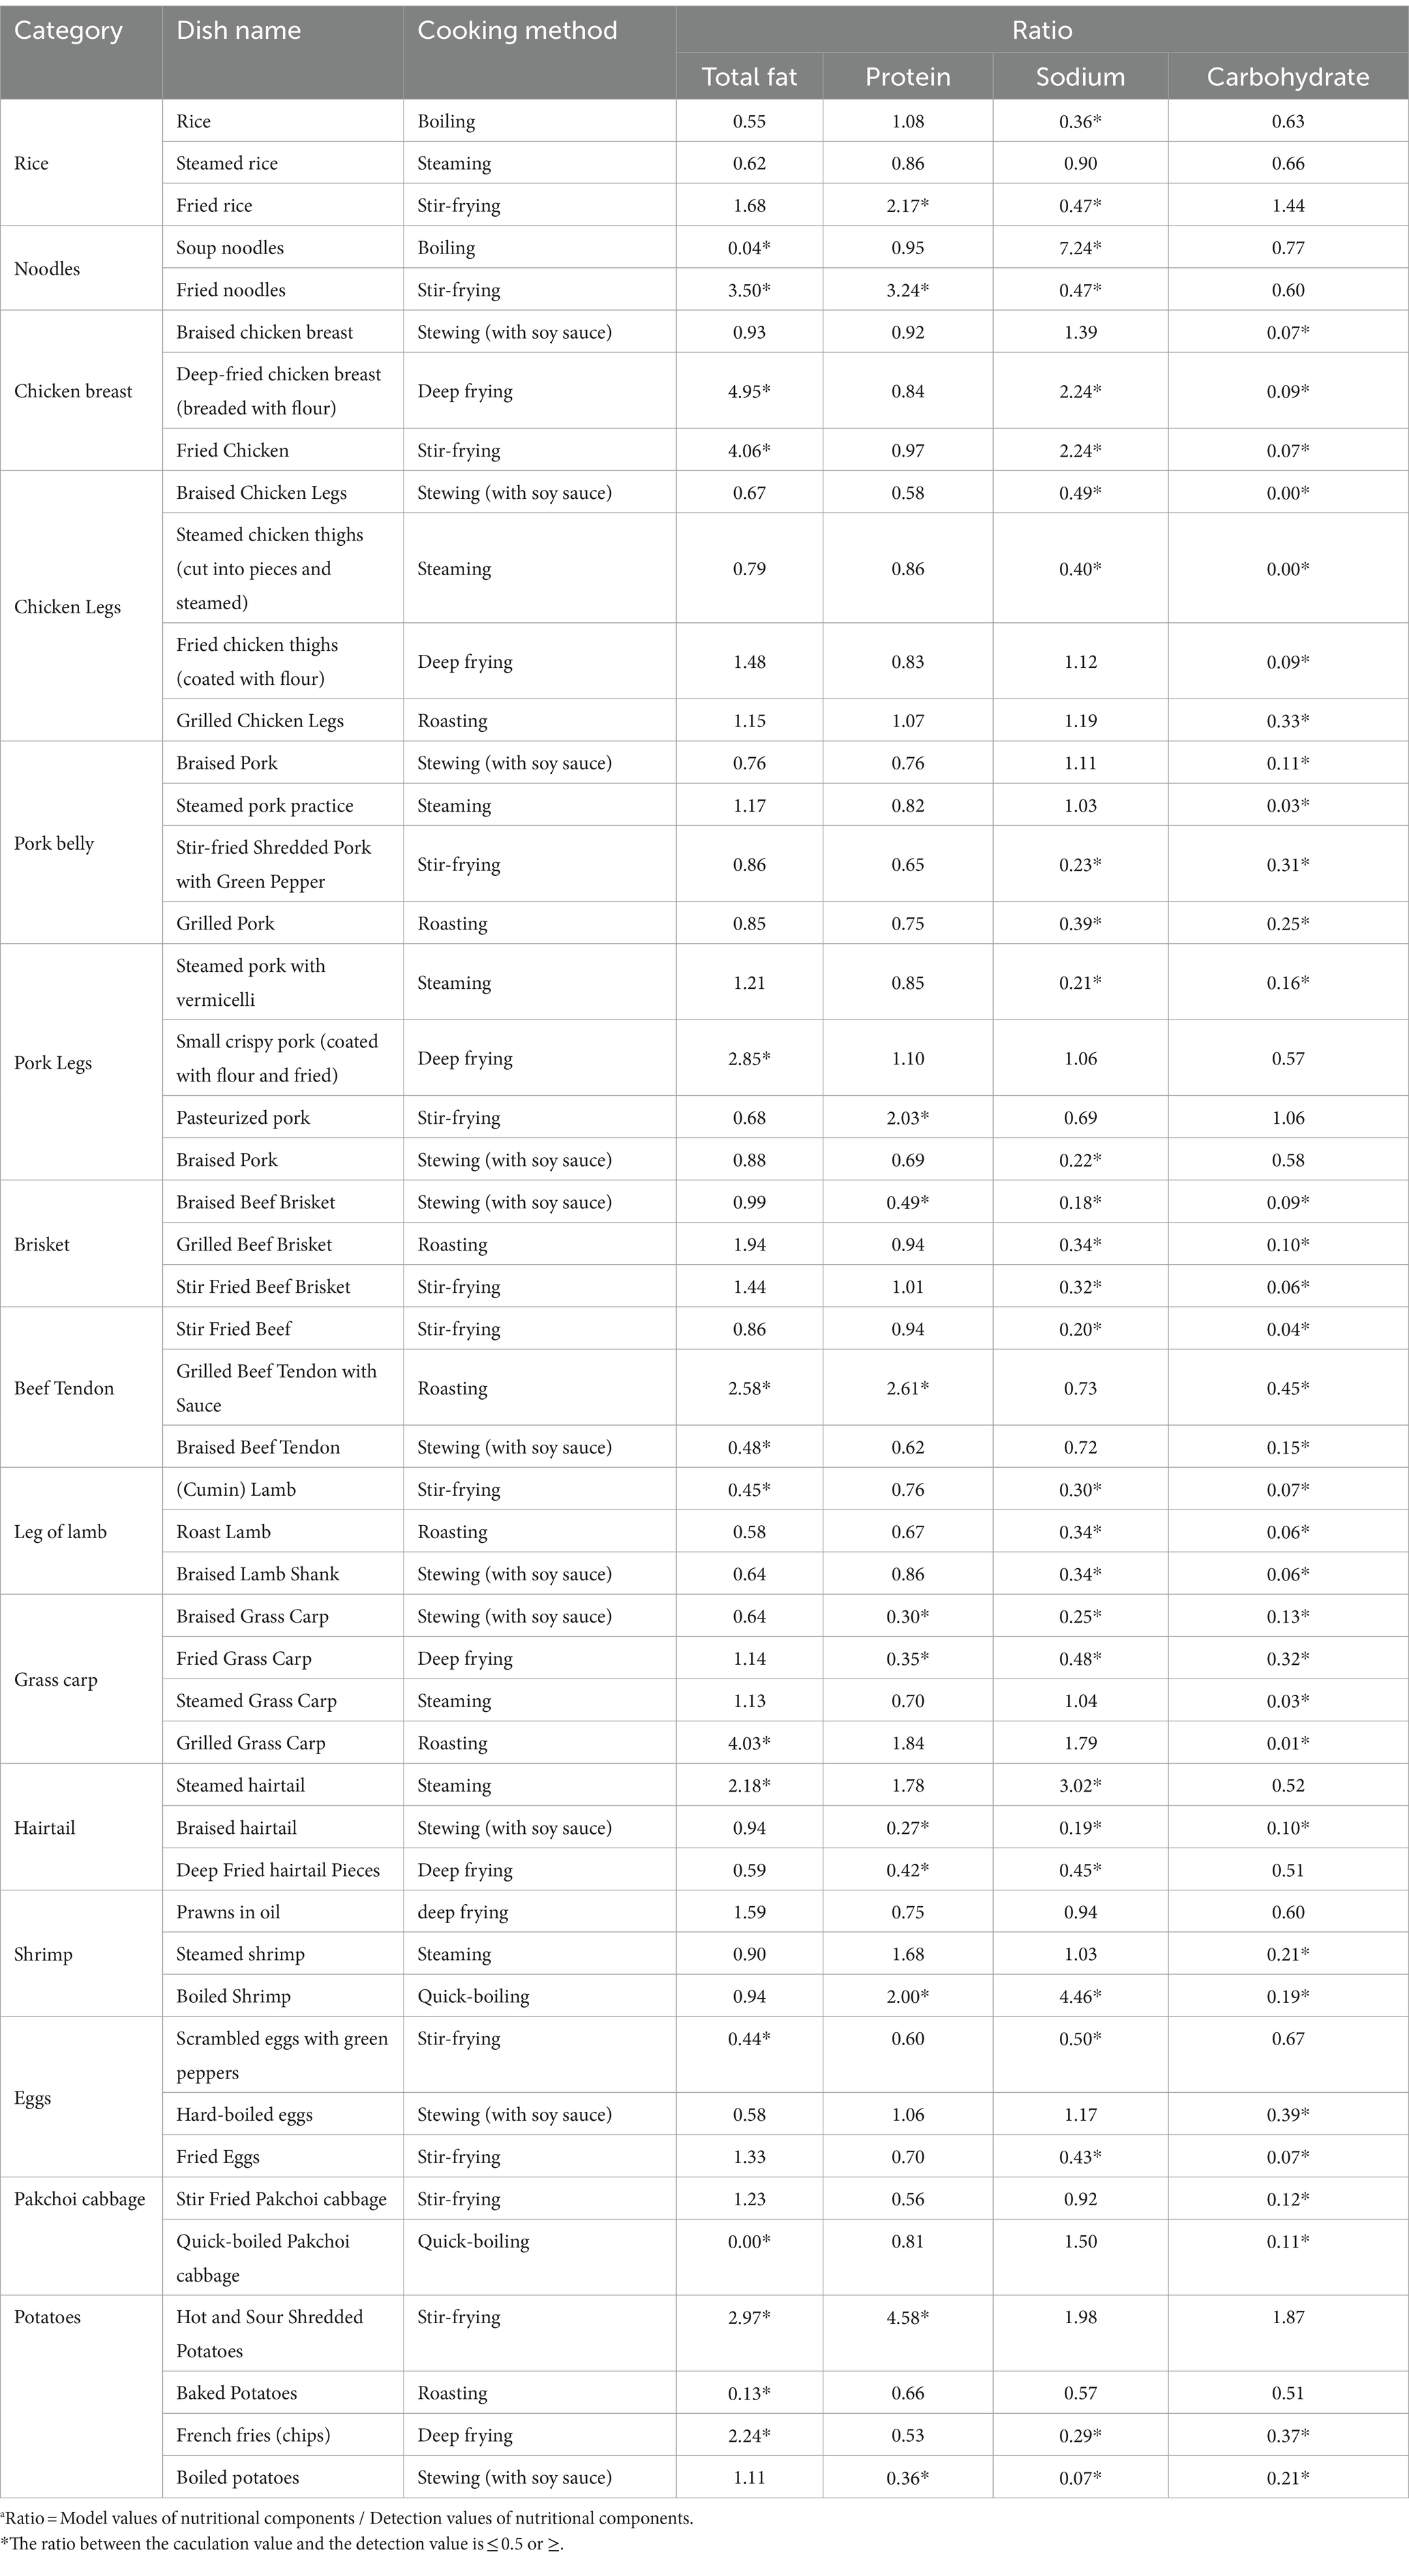
Table 5. Ratio of the calculation value to the detection valuea.
Using the model before and after correction, we calculated the nutritional components and energy values of nine selected dishes and compared their calculated and detected values. Figure 2 illustrates the results.
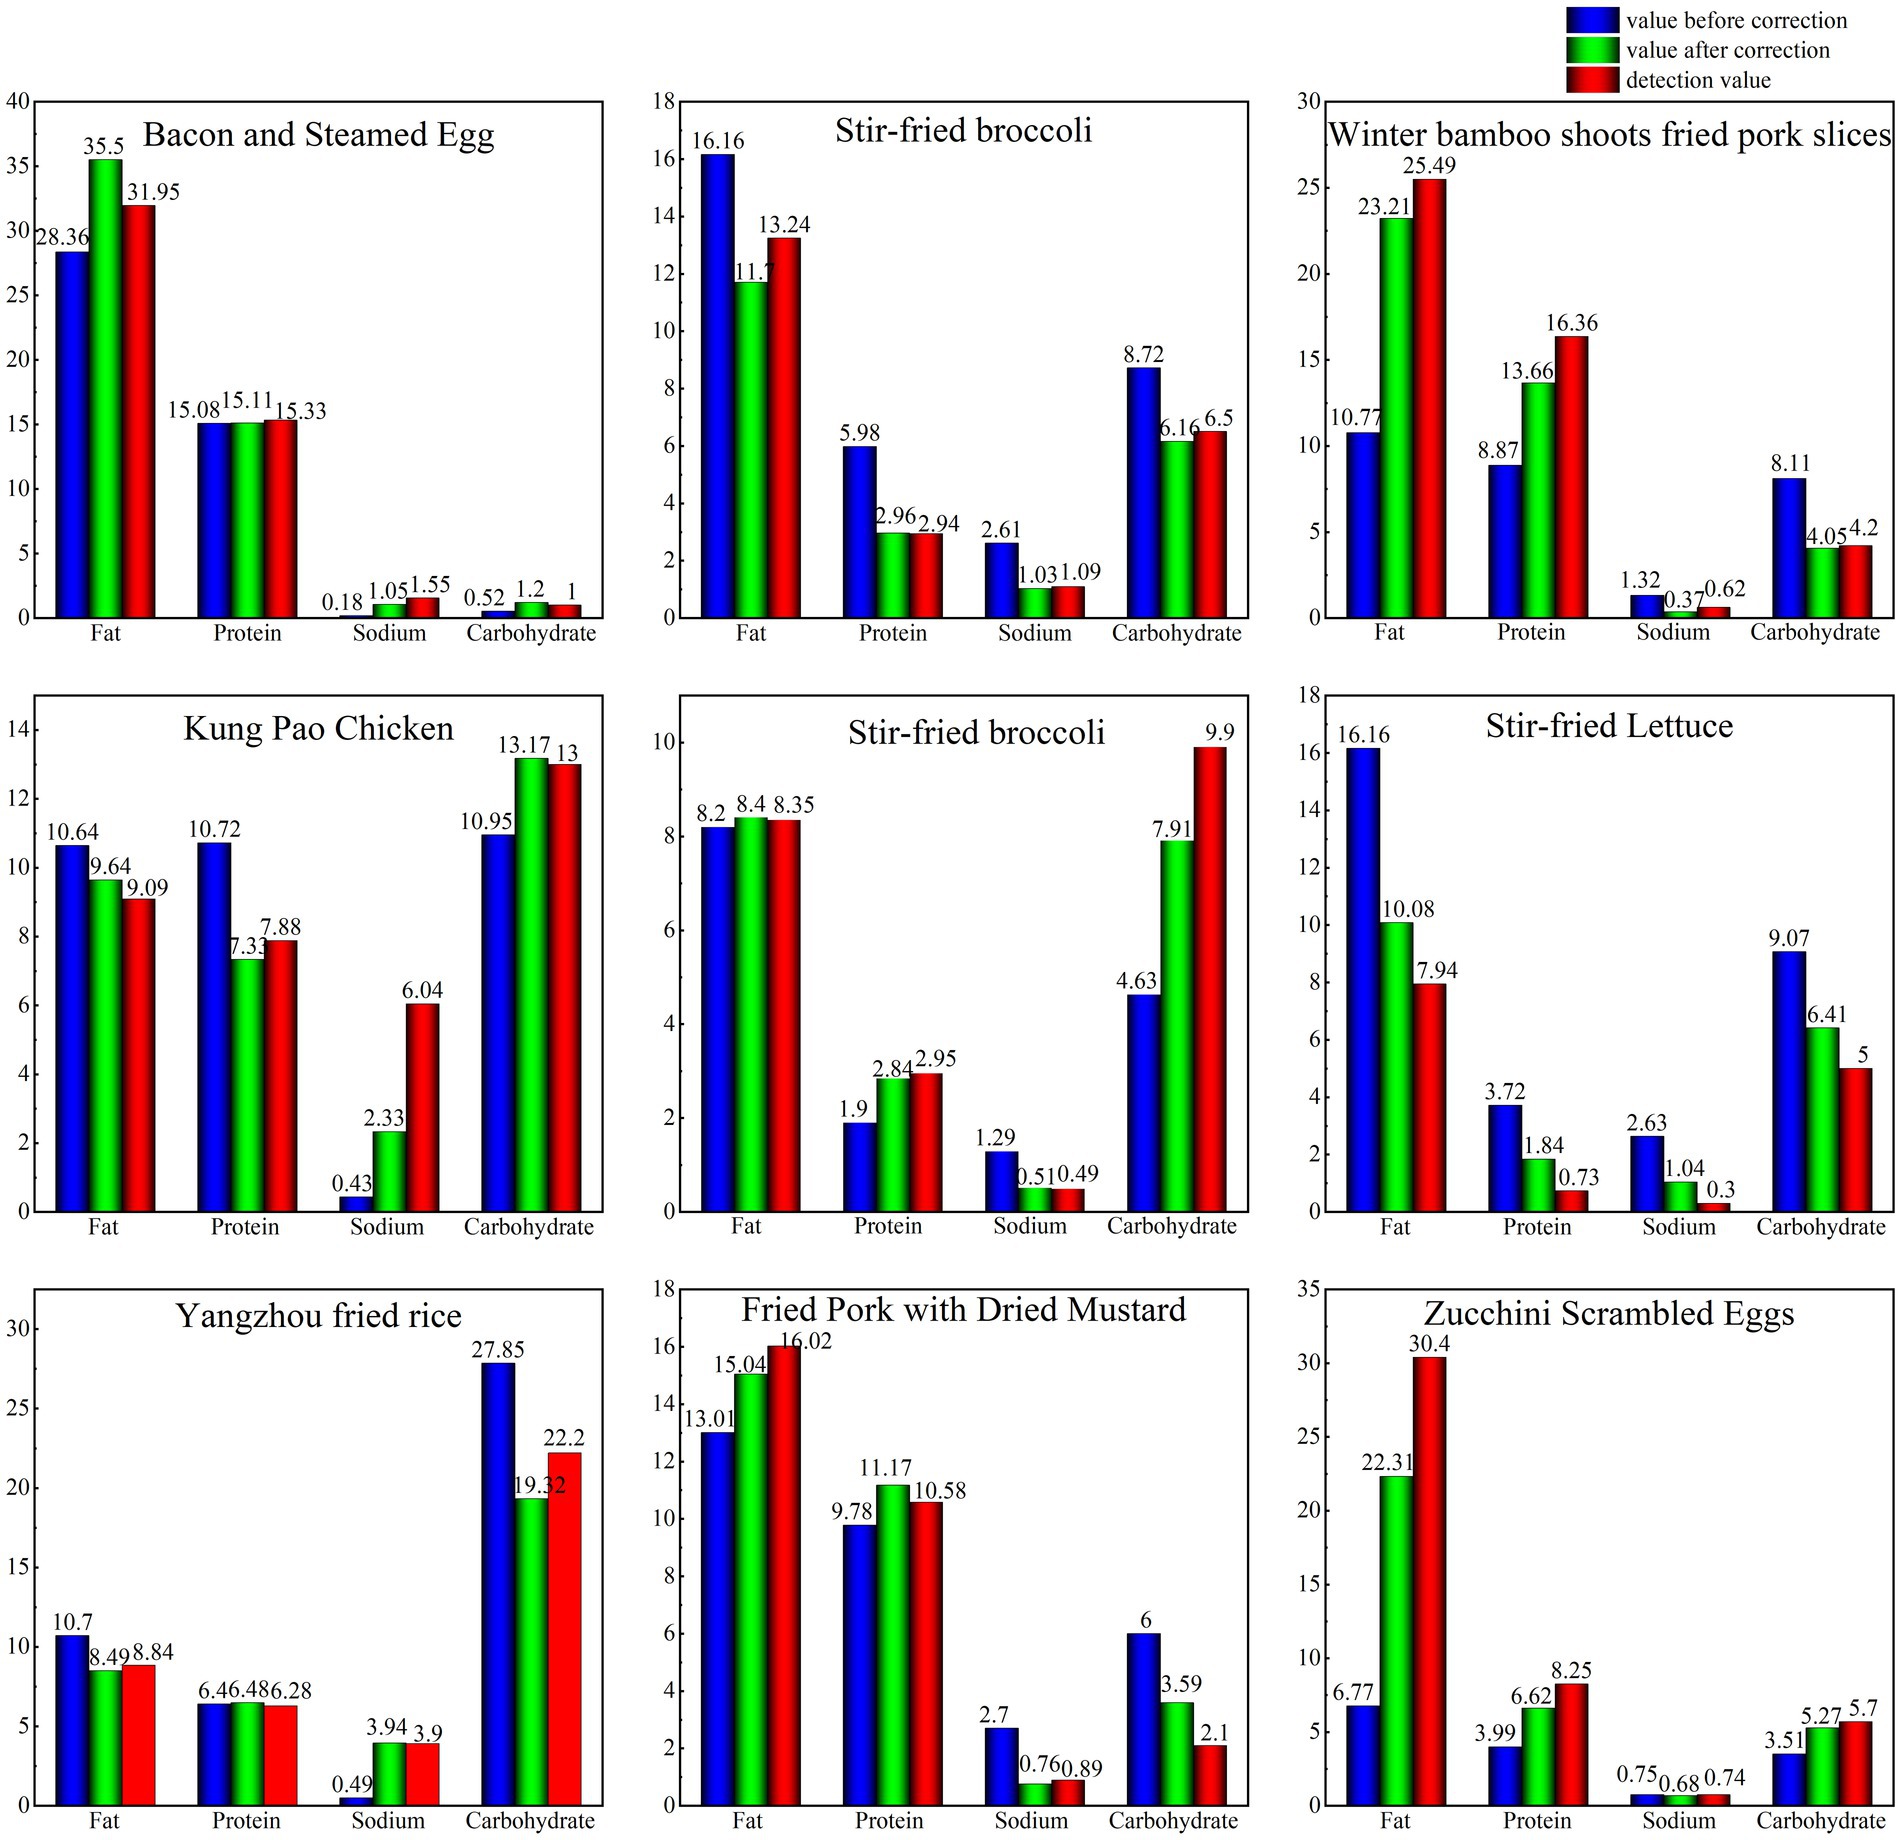
Figure 2. Comparison of the calculated and detected values of the nutrients found in nine dishes.
The nutritional components of catering food raw materials have a fundamental and direct impact on the calculation of the nutritional components of dishes (9). Therefore, a professional nutritional component database is needed for the correct labeling of catering food. Currently, the nutritional composition database of catering food primarily refers to the China Food Composition Tables 2002 and 2004 (7, 8). However, considering the significant differences in China’s geographical environment, the types and nutritional characteristics of raw food materials are diverse. For example, the same type of raw food materials may have different varieties or names. Considering the different environments in different provinces, the same raw materials may have different nutritional components, making it difficult to include the entire catering ingredient in the composition table. This study established a scientific classification database of catering food raw materials. The average values of each nutrient in each type of food ingredients were calculated as the representative values of each nutrient in this type of food raw materials. These representative values were then used to replace the new varieties of this food type, thereby greatly improving the accuracy of the calculation of the catering food’s nutritional components.
Based on different food matrices, different cooking methods have different effects on various nutritional components in catering food. For carbohydrate-rich cereal and potato foods, boiling and stir-frying have a greater impact on their carbohydrate content, deep-frying had the greatest impact on their fat, and stewing and stir-frying had a greater impact on protein. Relevant results have also been reported in previous studies. For example, one study found that three cooking methods, namely, steaming, boiling, and deep-frying, can lose starch and reduce sugar in sweet potato, and the degree of loss from high to low was observed in deep-frying, boiling, and steaming (20). Furthermore, when food is deep-fried or stir-fried, the protein is severely damaged (21, 22).
For fish, meat, and eggs with high fat content, deep-frying affects fat the most, steaming greatly affects protein, and stewing and stir-frying mostly affect carbohydrates. Fat reportedly becomes seriously damaged when the oil temperature is excessively high in the process of deep-frying or stir-frying (23, 24). Compared with steaming and stir-frying, boiling alone can maintain a higher content of amino acids and fatty acids, but it can also induce the production of saturated fatty acids (25). However, cooking studies on foal meat from the Galicia Mountains revealed that steaming and stewing did not affect the total essential amino acids and nonessential amino acids (26). For vegetables, stir-frying affects the nutrients the most. Therefore, for traditional Chinese food, boiling, stir-frying, and deep-frying clearly affect the nutritional components of catering food.
It is very difficult to identify the nutritional information of catering food, because the nutritional components are influenced by the raw materials and processing methods, they are difficult to be accurately calculated, and the cost of detection is too high. Through the classification database, the practical problem of some raw materials do not have nutrient composition data in the Food Composition Table is solved, and all most dishes can be included in the model calculation. After the influencing factors in the processing of catering food are corrected, the data calculated by the model are closer to the true value of the dishes. In this study, we successfully constructed a scientific, accurate, and efficient calculation model for the nutritional components, indicating its potential in providing technical support for the accurate calculation and correct identification of nutritional components in catering food. Accurate nutrition information identification will help consumers make scientific choices and maintain physical health.
This model established in this study improved the accuracy of calculation by taking into account as many key influential factors to reduce the errors. However, this study has some limitations. Chinese food is extremely rich in raw materials and cooking methods. This model only investigates and corrects for the most common cooking methods through the most commonly consumed meat (pig, beef, sheep, chicken, fish) and cereals (rice), which are only a small part of Chinese food. So we should further improve this model by multiple verification and relevant data supplement, analyze each influencing factor on the nutrition content of foods for catering.
Catering food nutrition labeling can help consumers identify the type and content of nutrients in dishes. A scientific, accurate, and efficient calculation model is the key to accurately calculate and label catering food nutrients. In this study, we established three complete databases of food classification, raw and cooked ratio, and correction factors according to different cooking methods. Using computer technology, we linked these databases to the calculation model. Ultimately, we were able to develop a scientific, accurate, and efficient calculation model of the nutritional components of catering food to provide support for the accurate calculation and correct identification of nutritional components.
The original contributions presented in the study are included in the article/Supplementary material, further inquiries can be directed to the corresponding authors.
NL: Data curation, Methodology, Writing – original draft. LC: Formal analysis, Writing – original draft. HW: Validation, Writing – original draft. ZL: Formal analysis, Writing – review & editing. ML: Software, Writing – original draft. DY: Software, Writing – original draft. HL: Conceptualization, Writing – review & editing. HF: Conceptualization, Supervision, Writing – review & editing. YC: Formal analysis, Writing – original draft.
The author(s) declare financial support was received for the research, authorship, and/or publication of this article. This study was supported by World Health Organization Representative Office in China (20220303NUT) and China National Center for Food Safety Risk Assessment high-level talent team construction 523 project.
The authors thank the editor and reviewers for their constructive comments and suggestions to improve the quality of this paper.
The authors declare that the research was conducted in the absence of any commercial or financial relationships that could be construed as a potential conflict of interest.
All claims expressed in this article are solely those of the authors and do not necessarily represent those of their affiliated organizations, or those of the publisher, the editors and the reviewers. Any product that may be evaluated in this article, or claim that may be made by its manufacturer, is not guaranteed or endorsed by the publisher.
The views expressed in this report are those of the authors alone and do not necessarily reflect the policies or views of the World Health Organization.
The Supplementary material for this article can be found online at: https://www.frontiersin.org/articles/10.3389/fnut.2024.1388645/full#supplementary-material
1. Du, WW, Li, Y, Zhang, JG, Zhang, B, Zhang, PH, and Wang, HJ. Action on salt in China: an overview of restaurant intervention study. Acta Nutrimenta Sin. (2022) 44:112–20. doi: 10.13325/j.cnki.acta.nutr.sin.2022.02.004
2. World Health Organization. Diet, nutrition and the prevention of chronic diseases: Report of a joint WHO/FAO expert consultation. Geneva: WHO (2003).
3. Burton, S, Howlett, E, and Tangari, AH. Food for thought: how will the nutrition Labeling of quick service restaurant menu items influence consumers’ product evaluations, purchase intentions, and choices? J Retail. (2009) 85:258–73. doi: 10.1016/j.jretai.2009.04.007
4. World Health Organization. Salt reduction and iodine fortification strategies in public health. Australia: WHO (2013).
5. World Health Organization. Global action plan for the prevention and control of NCDs 2013–2020. Geneva: WHO (2013).
6. National Health Commission of the People's Republic of China. Notice on the issuance of guidelines on nutrition Labeling of catering food and other 3 guidelines Available at: http://www.nhc.gov.cn/sps/s7885u/202012/95a58c9edaa645e1adab956e278c2794.shtml
7. Yang, YX, Wang, GY, and Pan, XC. Chinese food composition 2002. Beijing: Beijing Medical University Press (2002).
8. National Institute for Nutrition and Health Chinese Center for Disease Control and Prevention In: Chinese food composition 2004. Beijing: Beijing Medical University Press (2005)
9. Li, L, and Zhou, SS. Investigation on the issues of implementing nutrition labeling for Chinese dishes. Chin J Food Hygiene. (2011) 5:455–8. doi: 10.13590/j.cjfh.2011.05.013
10. China National Center for Food Safety Risk Assessment. National Food Contaminants and hazardous factors risk monitoring and work manual for 2020. (2019). Available at: https://www.doc 88.com/p-80329237912352.html
11. National Health Commission of the People's Republic of China. National standards for food safety determination of fat in food (GB 5009.6-2016). (n.d.). Available at: http://down.foodmate.net/standard/sort/3/50382.html
12. National Health Commission of the People's Republic of China. National standards for food safety determination of protein in food (GB 5009.5-2016). (n.d.). Available at: http://down.foodmate.net/standard/sort/3/50381.html
13. National Health Commission of the People's Republic of China. National standards for food safety determination of ash in food (GB 5009.4-2016). (n.d.). Available at: http://down.foodmate.net/standard/sort/3/49326.html
14. National Health Commission of the People's Republic of China. National standards for food safety determination of multielement in food (GB 5009.268-2016). (n.d.). Available at: http://down.foodmate.net/standard/sort/3/50423.html
15. Wu, YN, Zhao, YF, and Li, JG. The fifth China Total diet study. Beijing: China Science Publishing & Media Ltd. (Cspm) (2018).
16. Liu, LL, Gao, CX, Jiang, TH, et al. Effects of cooking methods and conditions on nutritional content of potato tubers. J Chin Cereals Oils Assoc. (2023) 38:61–70. doi: 10.3969/j.issn.1003-0174.2023.07.011
17. Huang, QH, Xiong, J, and Wu, L. Influence of different cooking methods on the nutrients in food. Food Eng. (2013) 126:62–4. doi: 10.3969/j.issn.1673-6044.2013.01.021
18. Jiang, YT. Discussion on the influence of cooking processing on different nutrients and countermeasures. Nutr Health. (2023) 29:108–10. doi: 10.16736/j.cnki.cn41-1434/ts.2023.15.027
19. Liu, Q, Tarn, R, Lynch, D, and Skjodt, NM. Physicochemical properties of dry matter and starch from potatoes grown in Canada. Food Chem. (2007) 105:897–907. doi: 10.1016/j.foodchem.2007.04.034
20. Chen, WH, and Huang, LL. Effects on sweet potato nutrient of different cooking methods. Food Sci Technol. (2013) 38:88–91. doi: 10.13684/j.cnki.spkj.2013.01.045
22. Gál, R, Kameník, J, Salek, RN, Polášek, Z, Macharáčková, B, Valenta, T, et al. Research note: impact of applied thermal treatment on textural, and sensory properties and cooking loss of selected chicken and Turkey cuts as affected by cooking technique. Poult Sci. (2022) 101:101923. doi: 10.1016/j.psj.2022.101923
23. Zhou, Z. Explore the influence of different cooking methods on food nutrients. China Food Safety Magazine. (2020) 39. doi: 10.16043/j.cnki.cfs.2020.30.031
24. Purchas, RW, Wilkinson, BH, Carruthers, F, and Jackson, F. A comparison of the nutrient content of uncooked and cooked lean from New Zealand beef and lamb. J Food Compos Anal. (2014) 35:75–82. doi: 10.1016/j.jfca.2014.04.008
25. Li Quanquan, L, Jie, CY, et al. Effect of different cooking methods on nutritional intake and different storage treatments on nutritional losses of abalone. Food Chem. (2022) 377:132047. doi: 10.1016/j.foodchem.2022.132047
Keywords: catering food, nutritional components, calculation model, raw and cooked ratio, correction factor
Citation: Li N, Cong L, Wang H, Chen Y, Liu Z, Li M, Yang D, Li H and Fang H (2024) Establishing a nutrition calculation model for catering food according to the influencing factors of energy and nutrient content in food processing. Front. Nutr. 11:1388645. doi: 10.3389/fnut.2024.1388645
Edited by:
Reza Rastmanesh, American Physical Society, United StatesReviewed by:
Fatima Ezzahra Housni, Instituto de Investigaciones en Comportamiento Alimentario y Nutrición (IICAN), MexicoCopyright © 2024 Li, Cong, Wang, Chen, Liu, Li, Yang, Li and Fang. This is an open-access article distributed under the terms of the Creative Commons Attribution License (CC BY). The use, distribution or reproduction in other forums is permitted, provided the original author(s) and the copyright owner(s) are credited and that the original publication in this journal is cited, in accordance with accepted academic practice. No use, distribution or reproduction is permitted which does not comply with these terms.
*Correspondence: Haiqin Fang, ZmFuZ2hhaXFpbkBjZnNhLm5ldC5jbg==; Huzhong Li, bGlodXpob25nQGNmc2EubmV0LmNu;
†These authors have contributed equally to this work
Disclaimer: All claims expressed in this article are solely those of the authors and do not necessarily represent those of their affiliated organizations, or those of the publisher, the editors and the reviewers. Any product that may be evaluated in this article or claim that may be made by its manufacturer is not guaranteed or endorsed by the publisher.
Research integrity at Frontiers
Learn more about the work of our research integrity team to safeguard the quality of each article we publish.