 Guanghong Yan1†Lizhu Liu2†
 Mengmei Liu1†Xinyue Jiang3†Ping Chen1Min Li1Qingyan Ma1Yani Li1Sifan Duan1Ruimin You2Yanni Huang2*Zhenhui Li2*
 Dingyun You1*
- 1Yunnan Provincial Key Laboratory of Public Health and Biosafety, School of Public Health, Kunming Medical University, Kunming, China
- 2Department of Radiology, The Third Affiliated Hospital of Kunming Medical University, Yunnan Cancer Hospital, Yunnan Cancer Center, Kunming, China
- 3Second Ward of Gastrointestinal Surgery, The Second Affiliated Hospital of Kunming Medical University, Kunming, China
Introduction: Low skeletal muscle mass and high adipose tissue coexist across the body weight spectrum and independently predict the survival ratio of colorectal cancer (CRC) patients. This combination may lead to a mutually exacerbating vicious cycle. Tumor-associated metabolic conditions primarily affect subcutaneous adipose tissue, but the nature and direction of its relationship with skeletal muscle are unclear. This study aims to examine the bidirectional causal relationship between skeletal muscle index (SMI) and subcutaneous fat index (SFI) during the perioperative period in CRC patients; as well as to validate the association between perioperative SMI, SFI, and CRC prognosis.
Methods: This population-based retrospective cohort study included patients with stage I-III colorectal cancer who underwent radical resection at the Third Affiliated Hospital of Kunming Medical University between September 2012 and February 2019. Based on inclusion and exclusion criteria, 1,448 patients were analyzed. Preoperative (P1), 2 months postoperative (P2), and 5 months postoperative (P3) CT scans were collected to evaluate the skeletal muscle index (SMI; muscle area at the third lumbar vertebra divided by height squared) and subcutaneous fat index (SFI; subcutaneous fat area at the third lumbar vertebra divided by height squared). A random intercept cross-lagged panel model (RI-CLPM) was used to examine the intra-individual relationship between SMI and SFI, and Cox regression was employed to assess the association between SMI, SFI, recurrence-free survival (RFS), and overall survival (OS).
Results: The median age at diagnosis was 59.00 years (IQR: 51.00–66.00), and 587 patients (40.54%) were female. RI-CLPM analysis revealed a negative correlation between SFI and subsequent SMI at the individual level: P1-P2 (β = −0.372, p = 0.038) and P2-P3 (β = −0.363, p = 0.001). SMI and SFI showed a negative correlation during P1-P2 (β = −0.363, p = 0.001) but a positive correlation during P2-P3 (β = 0.357, p = 0.006). No significant correlation was found between the random intercepts of SFI and SMI at the between-person level (r = 0.157, p = 0.603). The Cox proportional hazards multivariate regression model identified that patients with elevated SFI had poorer recurrence-free survival (HR, 1.24; 95% CI: 1.00–1.55). Compared to patients with normal preoperative SMI and SFI, those with low SMI or high SFI had poorer recurrence-free survival (HR, 1.26; 95% CI: 1.03–1.55) and overall survival (HR, 1.39; 95% CI: 1.04–1.87). However, no significant association between SMI and SFI and the prognosis of colorectal cancer patients was observed postoperatively.
Conclusion: In CRC patients, preoperative muscle loss leads to postoperative fat accumulation, exacerbating muscle loss in a feedback loop. Elevated preoperative SFI predicts poorer survival outcomes. Monitoring SMI and SFI is crucial as prognostic indicators, despite non-significant postoperative associations. Further research is needed to improve patient outcomes.
1 Introduction
Colorectal cancer (CRC) is the third most common malignant tumor and the second leading cause of cancer deaths worldwide (1). The number of patients with CRC increases with changing lifestyles (2). One-third of CRC patients are malnourished, and this proportion reaches 65% in patients with metastatic colorectal cancer (3, 4). Nutrient intake and consumption are closely related to changes in body composition. Cancer patients, including those with CRC, often undergo abnormal body composition changes due to inadequate food intake, reduced physical activity, and catabolic disorders (5). In addition, abnormal body composition is a risk factor for poor prognosis in CRC. For example, sarcopenia (loss of skeletal muscle mass and strength) and obesity predict poorer prognosis in CRC (6–8). Cancer is a catabolic disease characterized by muscle loss, often accompanied by fat gain, also known as less muscular obesity (9–11). This abnormal body composition phenotype occurs across the weight spectrum, with an 18% prevalence (12). Reduced skeletal muscle and increased adipose tissue may synergize to exacerbate body damage and metabolic disorders (13). Moreover, the metabolic profile associated with tumors preferentially affects subcutaneous adipose tissue, which accounts for 80% of the body’s adiposity (14–17). Therefore, it is important to elucidate its relationship with skeletal muscle.
Skeletal muscle area and subcutaneous fat area, measured by computed tomography (CT) at the level of the third lumbar vertebra (L3), are considered the most relevant areas for overall body composition and have become the gold standard for diagnosing sarcopenia (18, 19). These images can be easily obtained from the Medical Imaging Case system used for cancer diagnosis and prognostic follow-up, and reliable and accurate measurements can be made without increasing the burden and cost to the patient. To correlate skeletal muscle area and subcutaneous fat area with total muscle mass and total subcutaneous fat content, respectively, and to obtain relative measurements, they were normalized to the square of height to obtain the skeletal muscle index (SMI) and the subcutaneous fat index (SFI) (20). Although previous studies have shown an association between SMI and SFI and CRC, the evidence for an association between SMI and SFI based on prospective studies is very limited and it is not clear how causal the relationship is. Understanding the bidirectional relationship between SMI and SFI in CRC patients could provide valuable insights into the underlying mechanisms between muscle mass and obesity, as well as treatment and prognosis. The use of Random Intercept Cross-Lagged Panel Model (RI-CLPM) provides a unique opportunity to explore the temporal relationship between SMI and SFI in CRC patients. It allows the directionality of the relationship between the two variables to be examined after controlling for inter-individual confounders, leading to a more comprehensive understanding of their interactions (21).
This retrospective cohort study aimed to measure the SMI and SFI at the L3 vertebral segment by collecting perioperative CT images of CRC patients. The RI-CLPM was used to analyze the direction and strength of the longitudinal association between SMI and SFI at the individual level, while Cox regression was employed to examine the association between these indices and the prognosis of CRC patients, emphasizing their clinical importance. The findings may aid in developing tailored interventions targeting obesity and muscle mass in CRC patients, potentially improving patient outcomes.
2 Materials and methods
2.1 Study population
The study protocol was approved by the Ethics Committee of Kunming Medical University. As this was a retrospective study, the Ethics Committee waived the requirement for informed consent. All data were anonymized. This study included consecutive patients with stage I-III primary colorectal cancer who underwent radical resection at the Third Affiliated Hospital of Kunming Medical University from September 2012 and February 2019 and met the inclusion and exclusion criteria. The hospital is a tertiary cancer care center serving Yunnan Province, China. All patients were pathologically confirmed. Exclusion criteria included postoperative staging to stage IV and the inability to obtain high-quality CT images during the perioperative period. CT scan images were retrospectively collected at three time points: preoperatively (P1), 2 months ± 60 days postoperatively (P2), and 5 months ± 60 days postoperatively (P3), for a total of 2,225 patients with reliable preoperative measurements. To ensure test power, only patients with complete preoperative data and at least one valid postoperative data point were included. The final cohort consisted of 1,448 patients, with the number reduced to 1,291 at 2 months postoperatively and 933 at 5 months postoperatively; the remaining data were used to assess lost to follow-up bias. The detailed inclusion and exclusion criteria are presented in Figure 1. This study followed the reporting guidelines of the Strengthening the Reporting of Observational Studies in Epidemiology (STROBE) (22).

Figure 1. Study flow diagram.
2.2 CT examination
Abdominal contrast and non-contrast CT scans were performed using a CT scanner (SOMATOM Definition AS+, Siemens Healthineers, Germany). The abdominal CT images were obtained using a 128-row spiral CT scanner with a tube voltage of 120 kVp, tube current of 290–330 mA, and a rotation time of 0.50 s. The reconstruction image thickness for VP was 2.0 mm, and the image matrix was 512 × 512. Following this, the abdomen was radio scanned at a rate of 0.5 s per frame after an intravenous injection of Omnipaque GE Healthcare, USA (450 mg/kg) for approximately 70 s.
2.3 Image analysis
The radiologist identified the skeletal muscle and subcutaneous fat areas independently. One radiologist had 13 years of experience in abdominal imaging, while the other had 2 years of experience in abdominal imaging. The CT images from the study, whether enhanced or non-enhanced, were analyzed using Slice Omatic software (version 6.0), which is available on the open-source website https://www.slicer.org. The cross-sectional area of skeletal muscle and subcutaneous fat was measured at the level of the third lumbar vertebrae using a semi-automated method. The standard Hounsfield unit range (−190 to −30 for adipose tissue and −29 to +150 for skeletal muscle) was employed. Skeletal muscle included psoas, erector spine, lumbar square, transversus abdominis, external abdominal obliquity, internal abdominal obliquity, and rectus abdominis. The region of interest was adjusted manually to match the actual boundaries of the muscle and subcutaneous fat. The areas of skeletal muscle and subcutaneous fat were then calculated automatically. If the correlation coefficient between the measurements of the two radiologists was 0.90 or higher, the average of the two measurements was used as the result. If the correlation coefficient was lower than 0.90, a third radiologist (with over 25 years of clinical experience in CT scanning and image post-processing) measured the skeletal muscle area and subcutaneous fat area again. The measurements taken by the third radiologist were used as the final result. Subsequently, the skeletal muscle area and subcutaneous fat area were normalized and divided by the square of the height (m2) to calculate the SMI and SFI. For subsequent analysis, measurements from patients with two or more observations within each time period were averaged.
2.4 Definitions of low SMI and high SFI
To further analyze the association between SMI and SFI with CRC prognosis, we applied the same methodology as previous studies to determine the optimal cutoff values based on baseline data (23). The X-tile software (version 3.6.1) was employed to identify cutoff points for continuous variables from gender-specific stratifications (23, 24). This software identifies the cutoff that best separates patient outcomes by maximizing the difference in survival between groups. For each candidate cutoff point, we compared recurrence-free survival (RFS) between the low SMI and normal SMI groups, as well as between the normal SFI and high SFI groups, calculated the log-rank statistics. The cutoff point yielding the highest log-rank statistic, indicating the most significant in RFS, was selected to distinguish between different SMI and SFI groups. These optimal cutoff values were then used to categorize the perioperative SMI into low SMI and normal SMI groups, and the SFI into normal SFI and high SFI groups.
In this study, the optimal cutoff values determined were 43.8 cm2/m2 for men and 34.3 cm2/m2 for women for SMI, and 46.20 cm2/m2 for men and 64.0 cm2/m2 for women for SFI. These values were chosen because they provided the greatest separation in survival outcomes within our cohort, thus enhancing the predictive accuracy of the Cox regression models in evaluating colorectal cancer prognosis.
2.5 Covariates and endpoints
Covariates were obtained from the electronic medical record, including gender, age, weight, preoperative to first postoperative weight change, BMI, smoking history, drinking history, hypertension, diabetes, ECOG performance status, Charlson comorbidity index, primary site, AJCC pathological stage, AJCC T stage, AJCC N stage, tumor differentiation, histologic type, lymph node yield, lymphovascular invasion, perineural invasion, tumor deposit, and adjuvant chemotherapy.
All patients were assessed for survival using an electronic medical record system and regular telephone follow-up. The primary outcome was recurrence-free survival (RFS), defined as the time from the date of surgery to cancer recurrence, death, or the last follow-up date. The secondary outcome was overall survival (OS), defined as the time from surgery to death from any cause. Data for patients lost to follow-up were censored at the date of the last known contact.
2.6 Missing data
We compared demographic and study variables between participants who were included in the study and those who remained. The final study population and those who dropped out did not differ significantly in sex (p = 0.075), primary site (p = 0.070), pathologic stage (p = 0.060), and postoperative SMI and SFI at all time points. However, significant differences were found in age (p < 0.001) and preoperative SMI (p = 0.003). Older patients, lower preoperative SMI were more likely to be lost to follow-up, as detailed in Supplementary Table 1. Among the study subjects in the analysis, 10.84% lost visits between the first and second measurements, and 35.57% lost visits between the first and third measurements. Comparisons of clinical variables between the included participants and those lost to follow-up are detailed in Supplementary Tables 2, 3. We conducted the primary analysis of this study using full information maximum likelihood (FIML) estimation, an appropriate method for estimating a structural equation model when the data are missing at random or non-randomly (25). FIML estimation for non-MCAR data is preferable to other methods for dealing with missing values, such as deletion by list (26).
2.7 Statistical analysis
Continuous variables were presented as mean ± standard deviation or median [quartiles]. Group comparisons were made using either the paired t-test or the non-parametric rank-sum test. The study expressed categorical variables as frequencies (percentages) and compared them between groups using either the chi-square test or Fisher’s exact test. RI-CLPM was used to examine the within-person association of SMI and SFI at P1, P2, and P3. The complete RI-CLPM path diagram is presented in Figure 2. For each variable of interest, we conducted a regression analysis using the variables observed at P1, P2, and P3. The regression weights were constrained to be equal and were regressed on a time-invariant latent factor, the random intercept. This factor represents the stabilizing effect on the model over the observation period. Additionally, we regressed the variables on a separate latent factor at each time point, which represents the time-specific bias of the within-individual level at measurement. Cross-lagged and autoregressive coefficients were specified and freely estimated between the time-varying latent factors. These coefficients were interpreted as associations between within-person changes in SMI and SFI over the specified time interval. The within-person correlations were used to test the hypothesis that SMI and SFI would be prospectively correlated over time. Correlations with random intercepts represent the time-invariant effects of unmeasured sources of interindividual variance, such as sex and age, on the overall relationship between the constructs. Model fit was evaluated using chi-square (χ2), comparative goodness-of-fit indices, Tucker-Lewis indices, approximated root-mean-square errors, and standardized root-mean-square residuals. Standardized estimates were reported and compared for all analyses. In the survival analysis, univariate and multivariate Cox proportional hazards models were used to evaluate the crude and adjusted associations between perioperative SMI, SFI, their combination, and RFS and OS in CRC patients. Variables that achieved a less strict significance level of p < 0.10 in the univariate analysis were included in the subsequent multivariate model. Hazard ratios (HRs) and corresponding 95% confidence intervals (CIs) were estimated.
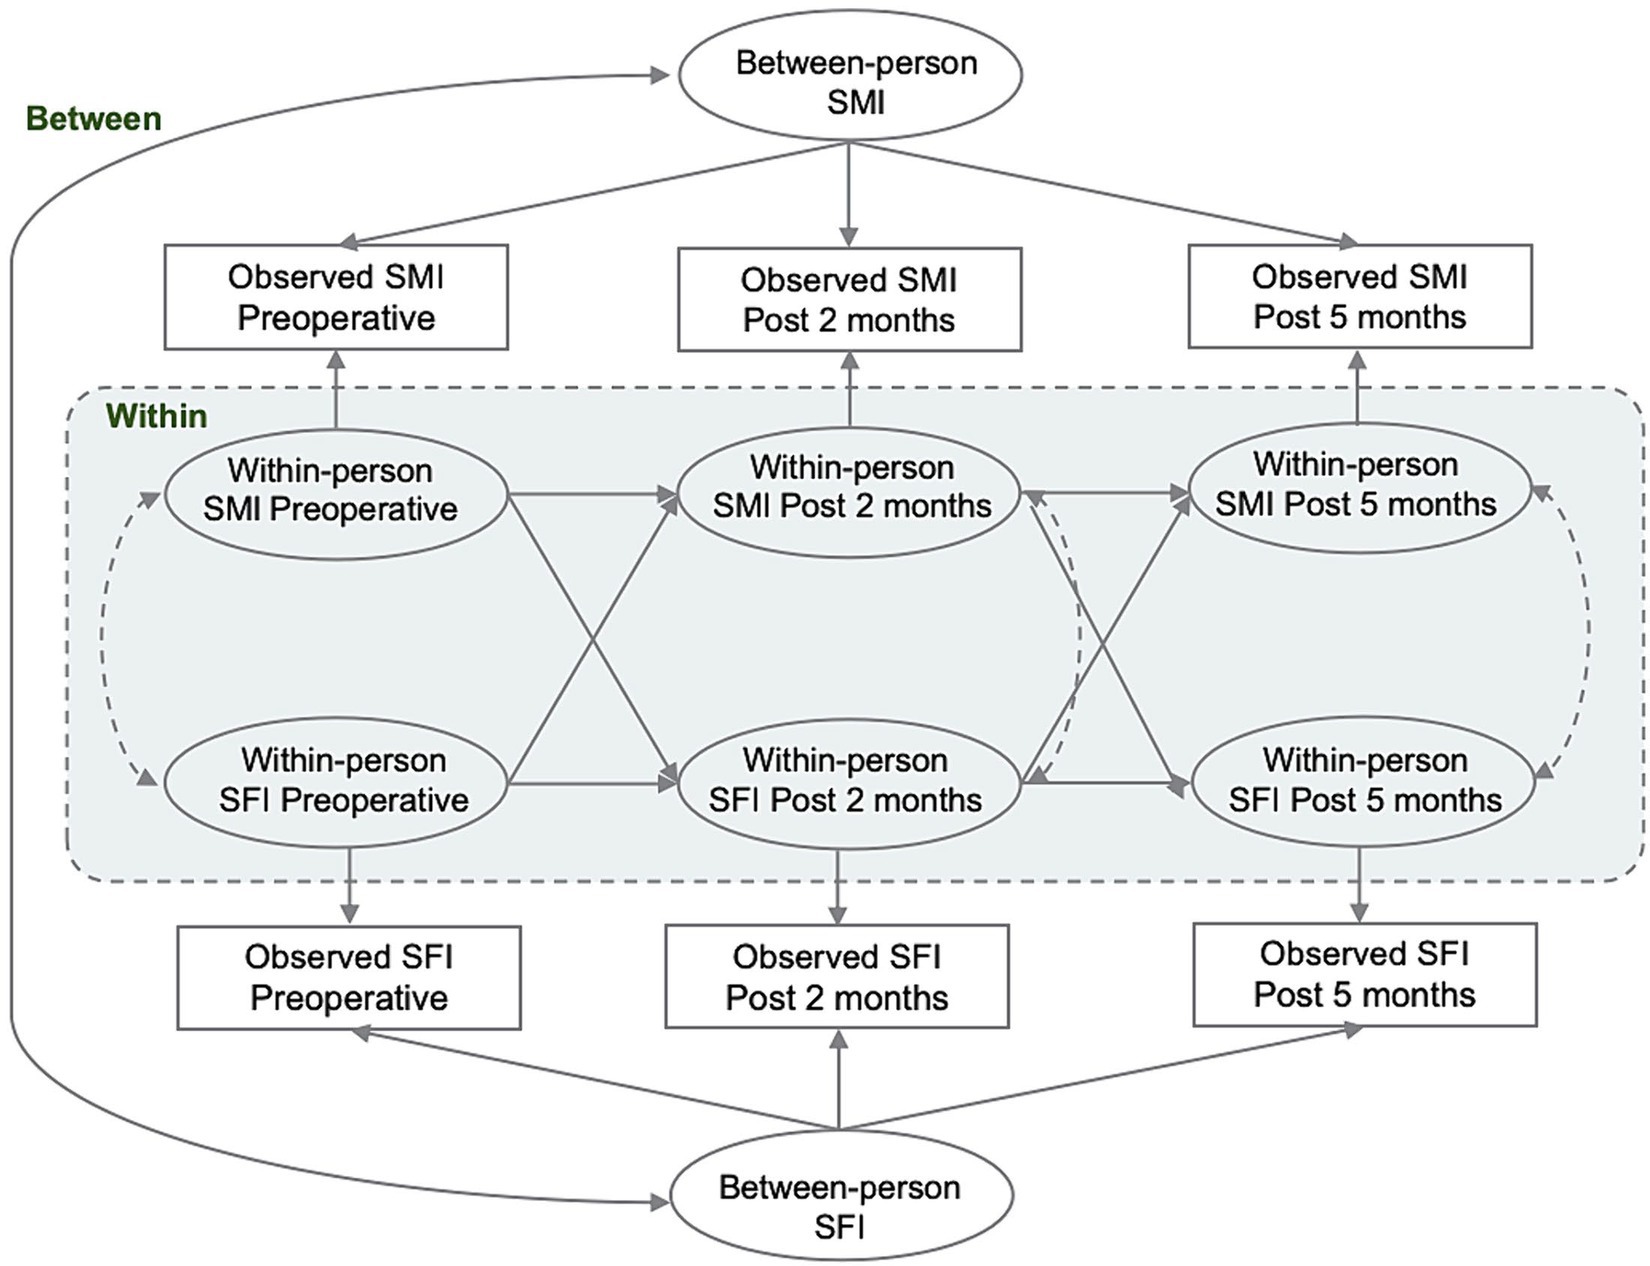
Figure 2. Conceptual model of the random-intercept cross-lagged panel analysis.
The data was cleaned and fitting of Cox proportional hazards models were conducted using the R statistical computing environment, version 4.3.0. A random intercept cross-lagged panel analysis was conducted using Mplus v.8.7, with a significance threshold of 0.05.
3 Results
3.1 Clinical and demographic variables by SMI and SFI
Clinical and demographic variables were compared based on SMI levels at P1, P2, and P3 (Table 1) and SFI levels at P1, P2, and P3 (Table 2). A total of 1,488 patients were included in the study. The median age at diagnosis was 59.00 years (IQR: 51.00–66.00), and 587 (40.54%) of the cases were female. At P1, 358 patients (24.72%) were classified as low SMI; at P2, 320 patients (24.79%) were low SMI; and at P3, 182 patients (19.51%) were low SMI. For SFI, 392 patients (27.07%) were classified as low SFI at P1; 282 patients (21.84%) at P2; and 224 patients (24.03%) at P3. Patients with low SMI at all three time points were older (p < 0.001) and had lower BMI (p < 0.001). High SFI patients were more likely to be female (p < 0.001) and had higher BMI (p < 0.001). At P1, low SMI was more prevalent in patients with colon cancer (p = 0.010), while at P3, it was more prevalent in patients with rectal cancer (p = 0.007). No significant differences were found across different pathological stages. At P1, high SFI was more common in patients with stage III cancer (p = 0.012), with no significant differences observed across primary sites.
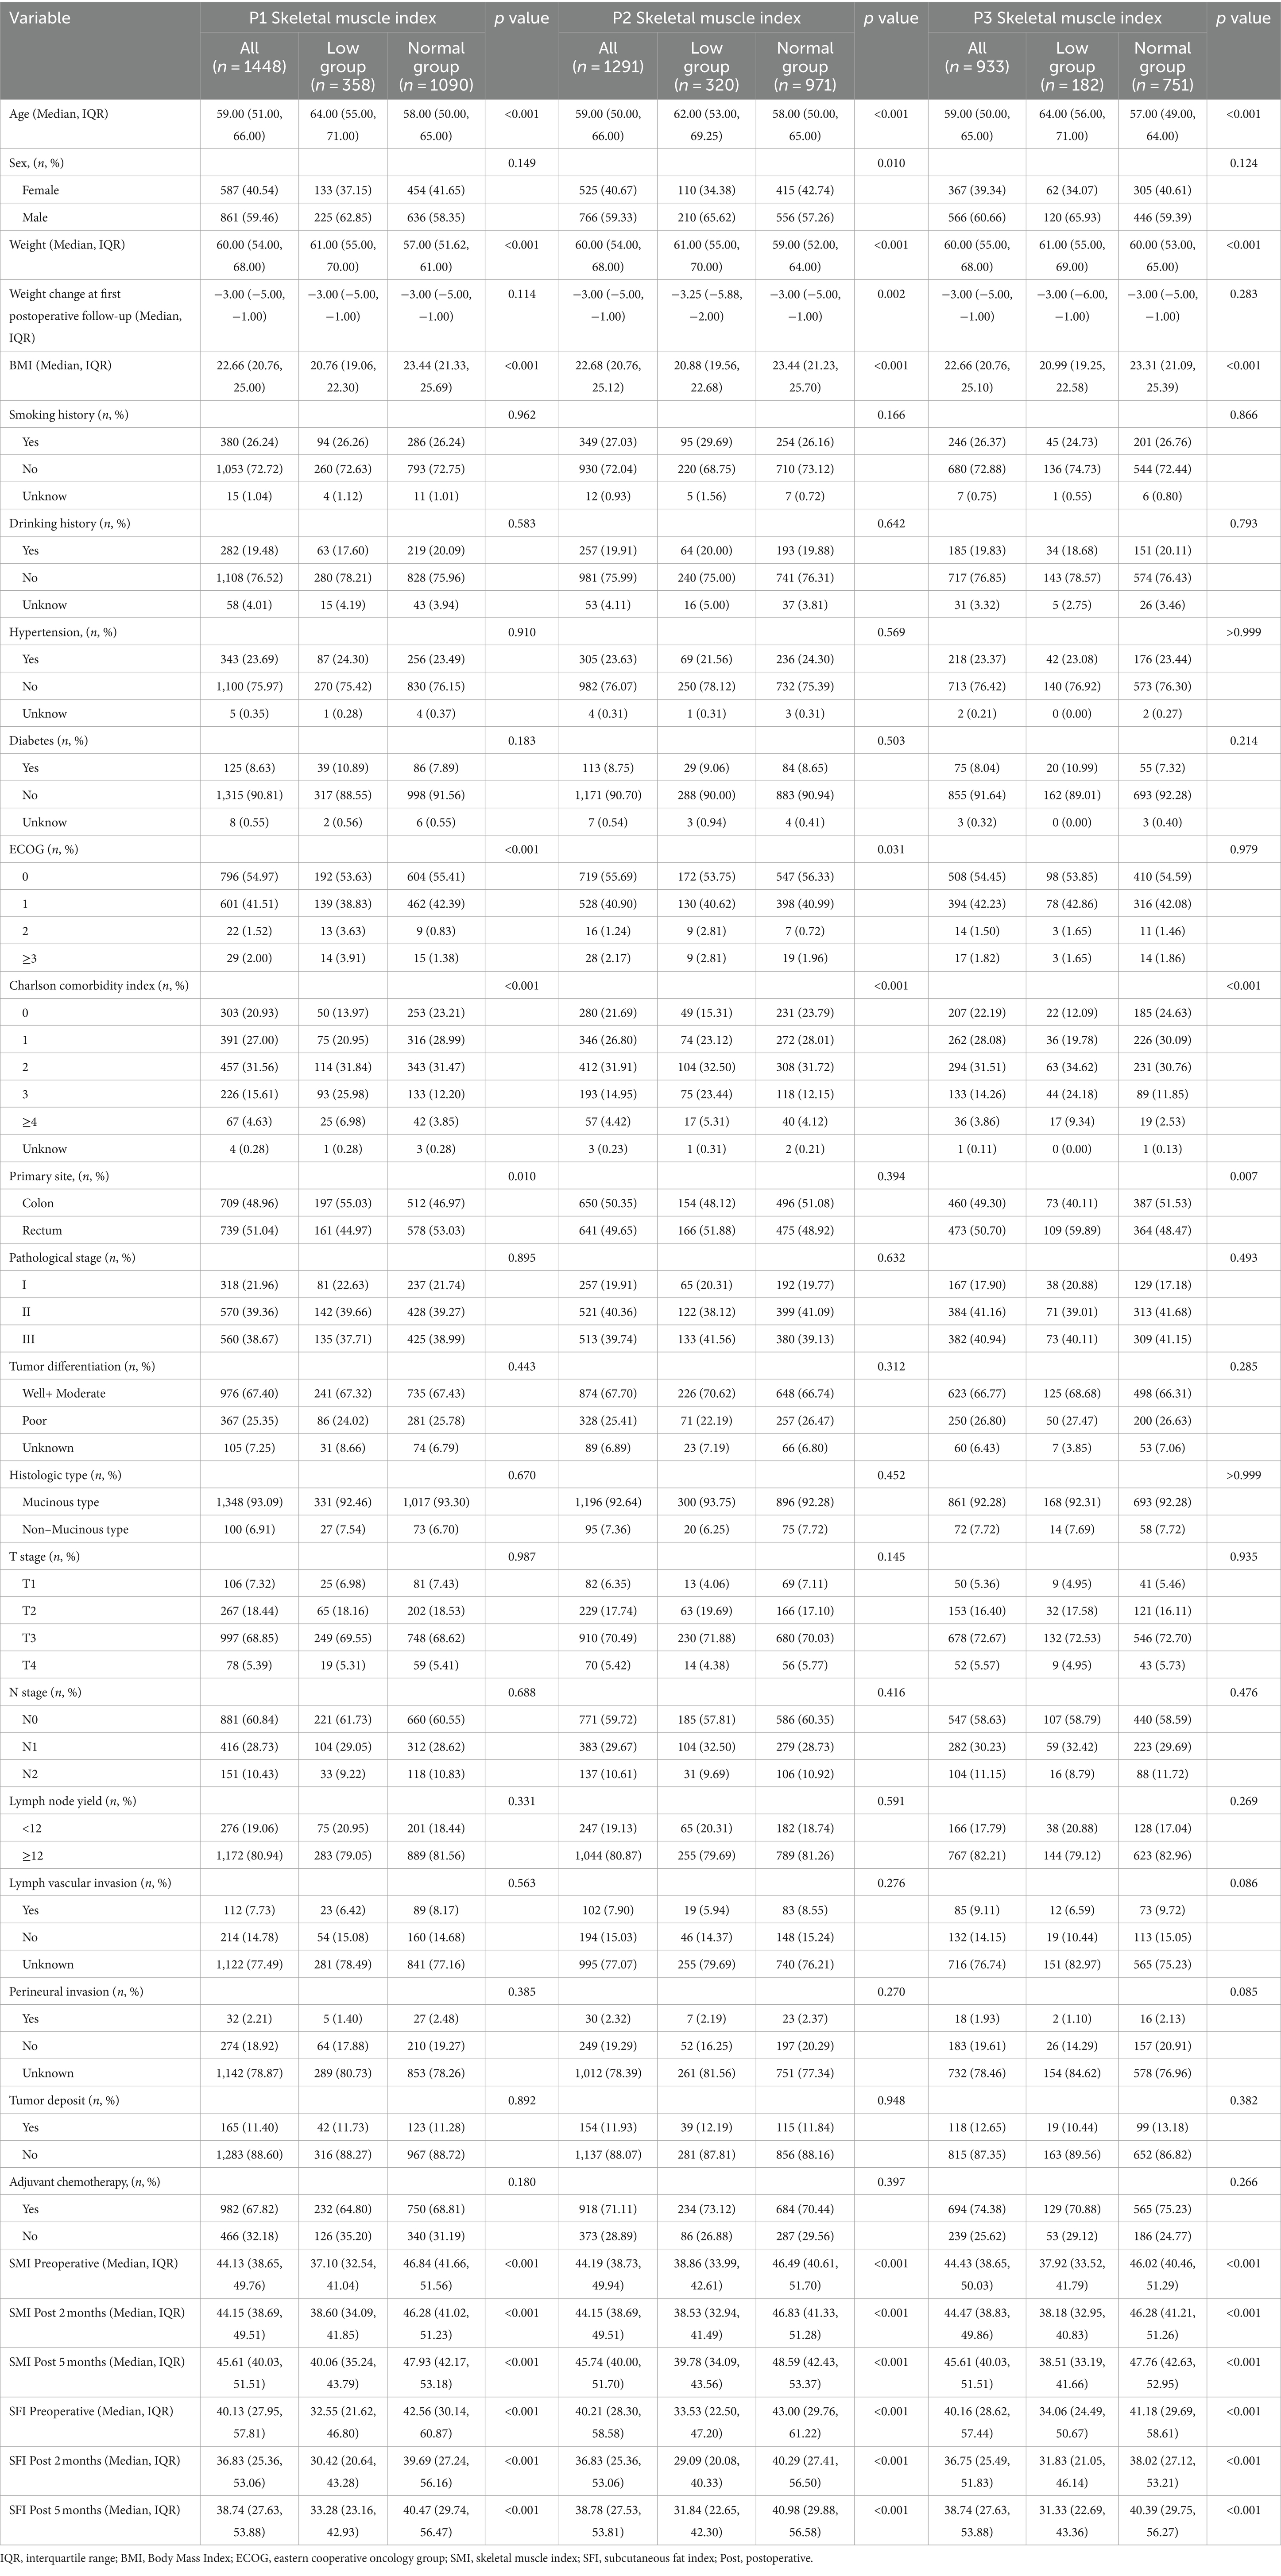
Table 1. Demographic and clinical characteristics in colorectal cancer cohort by P1, P2, and P3 SMI.
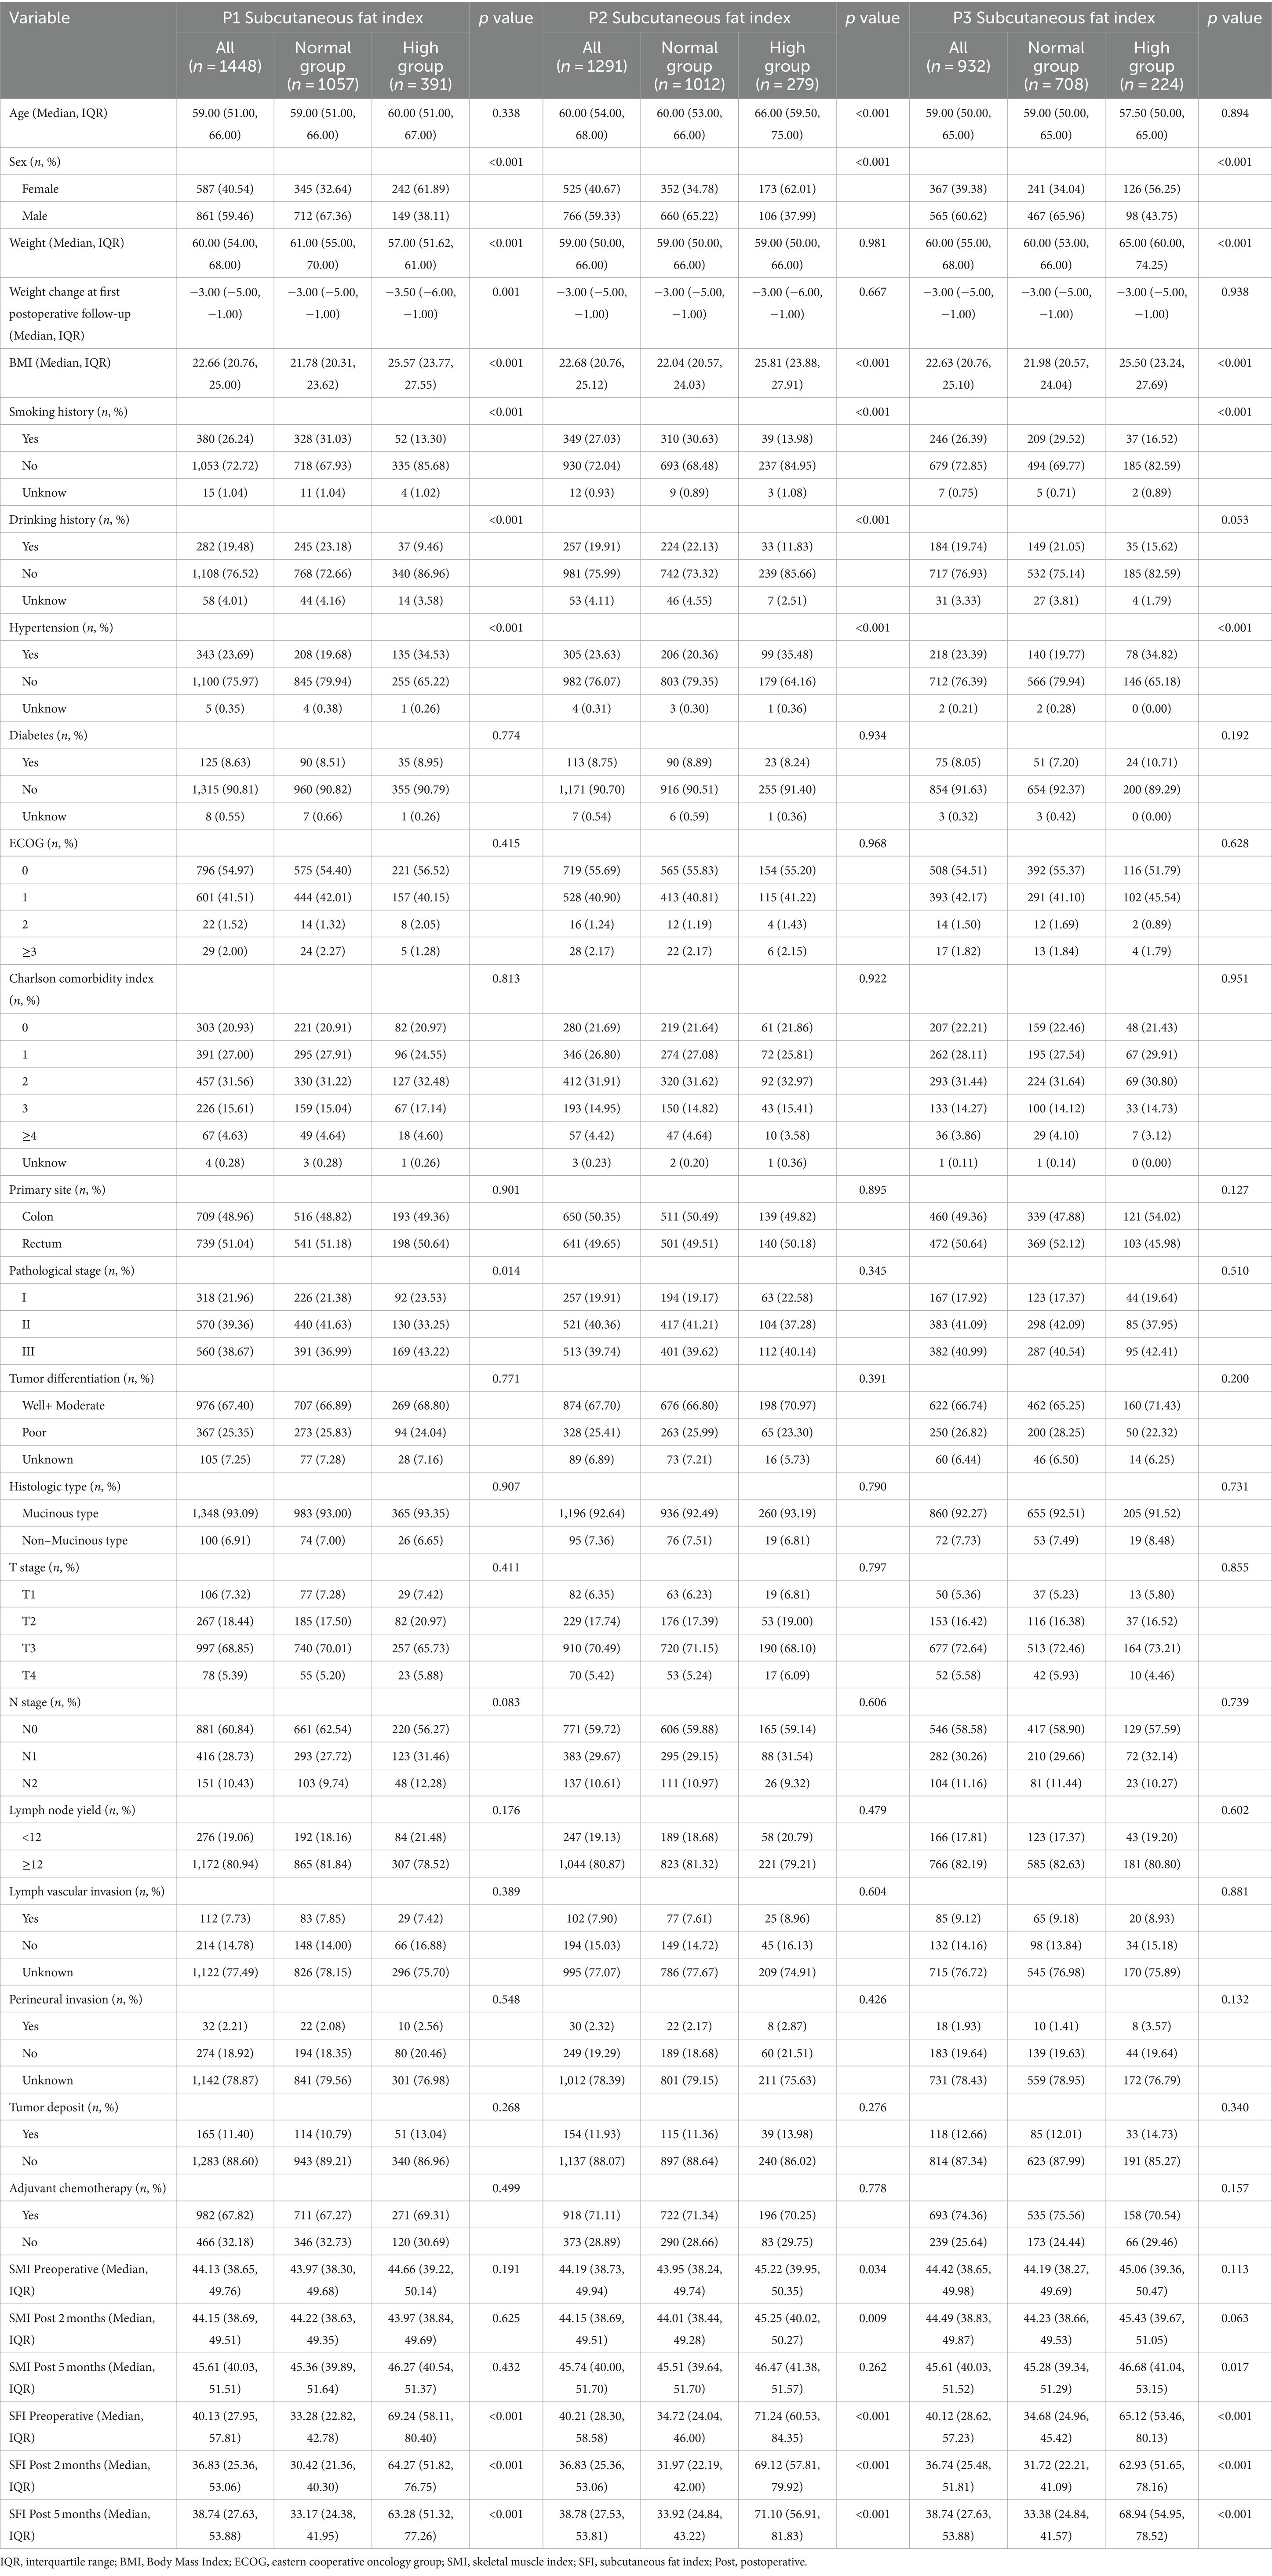
Table 2. Demographic and clinical characteristics in colorectal cancer cohort by P1, P2, and P3 SFI.
3.2 Clinical and demographic variables by overall survival status and recurrence-free survival status
Clinical and demographic variables by survival status and relapse-free survival status are presented in Supplementary Table 4. The median follow-up time for the entire cohort was 51.47 months (IQR: 50.10–52.67). During the follow-up period, we observed 185 deaths and 375 recurrences. Patients who died or experienced recurrence were more likely to have stage III disease, higher pathological differentiation, and to have received adjuvant chemotherapy, p < 0.05. No significant differences were found in age, gender, or BMI, p > 0.05.
3.3 Bidirectional associations of SMI and SFI
The intra-individual associations between SMI and SFI at three time points were analyzed using RI-CLPM. The regression coefficients for each path in the model are shown in Figure 3. At the individual level, SMI at P1 negatively predicted SFI at P2 (β = −0.802, p < 0.001). Similarly, SFI at P1 negatively predicted SMI at P2 (β = −0.372, p = 0.040). However, SMI at P2 positively predicted SFI at P3 (β = 0.356, p = 0.006), and SFI at P2 negatively predicted SFI at P3 (β = −0.363, p = 0.001). At P2-P3, the influence of subcutaneous fat on skeletal muscle and vice versa was reduced compared to P1-P2. Additionally, the negative effect of subcutaneous fat on skeletal muscle was greater than the positive effect of skeletal muscle on subcutaneous fat (p = 0.001). As a sensitivity analysis, the model was re-run using data with complete measurements at all three time points. Given the potential differences in disease progression and nutritional status between colon and rectal cancer patients, we adjusted for the primary tumor site in the model, yielding similar conclusions, as shown in Supplementary Figure 1.
The autoregressive effect of SMI was significant at both P1-P2 (β = 0.552, p = 0.019) and P2-P3 (β = 0.566, p < 0.001), indicating that SMI was prospectively associated with itself at all time points. In contrast, SFI at P1 was not associated with SFI at P2 (β = 0.234, p = 0.082), although SFI at P2 predicted SFI at P3 (β = 0.976, p = 0.001). There was no significant correlation between the random intercepts for SFI and SMI at the person-to-person level (r = 0.158, p = 0.604).
The model fit indices indicated a very good fit: (χ2/df (1) = 8.524, p = 0.004, CFI = 0.999, RMSEA = 0.072 [90% CI: 0.033–0.120]), which met or exceeded the traditional thresholds of χ2/df < 2, CFI > 0.95, and RMSEA <0.08 (27, 28). However, our model had a low degree of freedom (df = 1), which could indicate an overly stringent estimation of model fit (29). Therefore, we relied mainly on χ2/df and CFI to assess model fit.
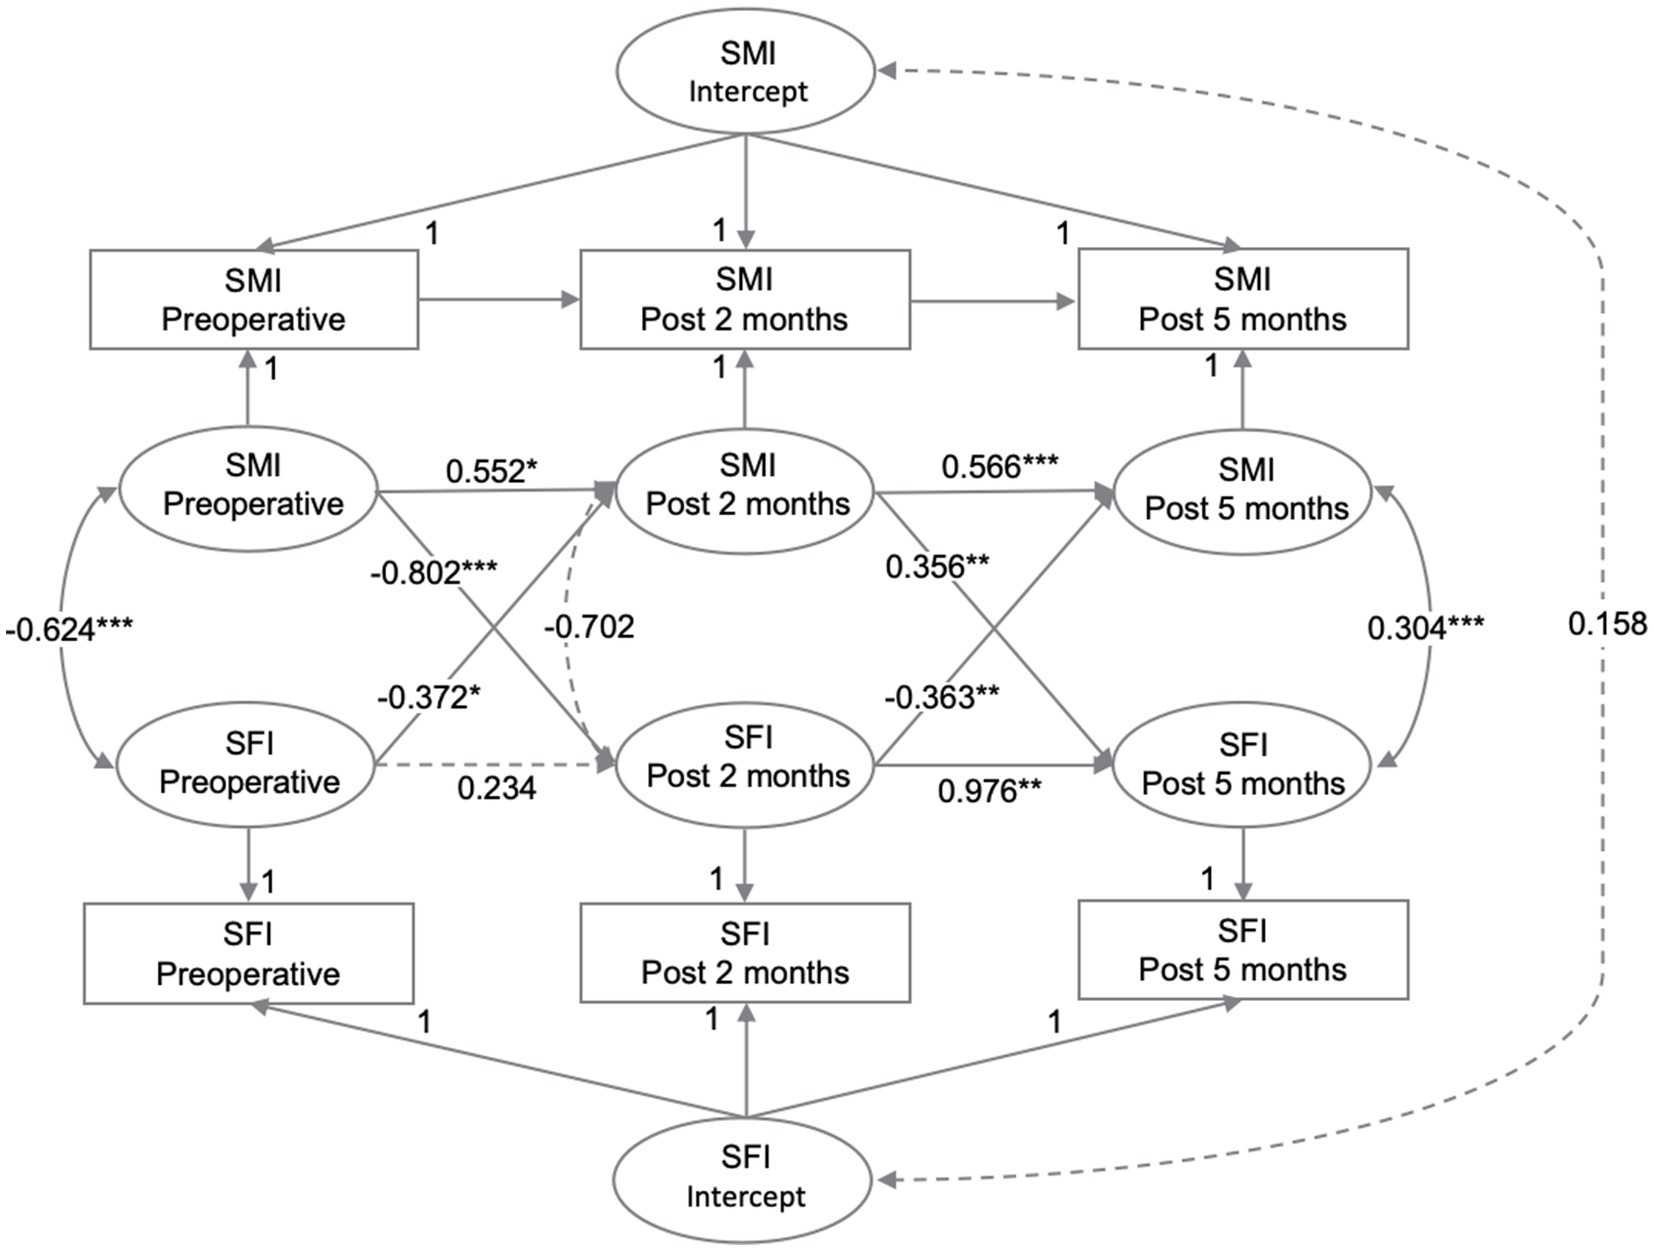
Figure 3. The relationships between SMI and SFI were analyzed at preoperative, post 2 months, and post 5 months using RI-CLPM. Solid black arrows indicate significant regression weights or correlations, while dashed arrows indicate non-significant parameters (p > 0.05). Standardized estimates are provided.
3.4 Survival analysis
In the univariate and multivariable Cox regression analyses, seven potential covariates were identified in the univariate model: ECOG, pathological stage, tumor differentiation, lymphovascular invasion, perineural invasion, tumor deposits, and adjuvant chemotherapy (Supplementary Tables 5, 6). After adjusting for these factors in the multivariable model, At P1, the group with elevated SFI exhibited worse recurrence-free survival compared to the group with normal SFI (adjusted hazard ratio [aHR] = 1.24, 95% CI: 1.00–1.55). However, no significant associations were found between SFI at P2 and P3, SMI at P1-P3, and colorectal cancer prognosis. Furthermore, we examined the combined effects of low SMI and high SFI on prognosis. We observed that patients with either preoperative low SMI or preoperative high SFI had poorer recurrence-free survival (aHR = 1.39, 95% CI: 1.04–1.87) and overall survival (aHR = 1.26, 95% CI: 1.03–1.55) compared to patients with normal preoperative SMI and SFI. No similar associations were observed postoperatively (Supplementary Tables 7, 8).
4 Discussion
This study investigated the bidirectional causal relationship between perioperative SMI and SFI in CRC patients, and validated their association with CRC prognosis. The within-person analyses supported a bidirectional relationship between SMI and SFI, with varying patterns over time. Our model indicated that SMI at P1 negatively predicted SFI at P2, while SMI at P2 positively predicted SFI at P3, but this effect diminished at later time intervals. Meanwhile, SFI negatively predicted SMI at both P2 and P3, with relatively large effect sizes during P2-P3. Therefore, the predominant direction of the effect was SMI- > SFI during P1-P2, but SFI- > SMI during P2-P3. Additionally, multivariable Cox regression analysis revealed that patients with elevated preoperative SFI had poorer recurrence-free survival. Further analysis found that compared to patients with normal preoperative SMI and SFI, those with low SMI or high SFI had worse recurrence-free survival and overall survival.
This model may reflect perioperative body composition changes in CRC patients. Previous longitudinal studies have shown that most patients undergoing resection for CRC lose skeletal muscle and subcutaneous fat due to impaired food digestion and lower physical activity. In contrast, in the postoperative period, patients with I-III stage CRC gradually restore their body function and metabolic homeostasis, which decreases the breakdown and release of subcutaneous adipose tissue and increases the synthesis and growth of skeletal muscle tissue (30), as also supported by these data. The larger effect sizes from P1 to P2 for the SMI- > SFI relationship suggest a direct and/or specific relationship between the two. Skeletal muscle is the largest energy-consuming organ in the body, and its metabolic activity and function are related to energy balance and fat oxidation (31, 32). The physiology and morphology of skeletal muscle change with age, with skeletal muscle mass and strength declining linearly from the fourth decade of life, and up to 50% loss of skeletal muscle mass by the eighth decade of life (33). Loss of skeletal muscle leads to a 4% per decade decline in basal metabolic rate after age 50 (34, 35). Simultaneously, the lower physical activity following muscle loss reduces total energy expenditure and causes fat accumulation (36). Moreover, skeletal muscle, as the primary site of insulin-stimulated glucose uptake, has been implicated as a major driver of systemic insulin resistance; patients with skeletal muscle atrophy often develop insulin resistance, resulting in lower glucose utilization, which in turn stimulates fat synthesis and storage (37).
The larger effect size of SFI- > SMI from P2-P3 may imply that the subcutaneous fat increase due to skeletal muscle loss may feedback-regulate skeletal muscle changes, causing further skeletal muscle reduction in a vicious cycle. Previous studies have demonstrated that obesity causes a persistent low-grade inflammation in the body and the production of pro-inflammatory factors, such as TNF-α, IL-1β, IL-6, etc., which inhibit skeletal muscle cell proliferation and differentiation, promote skeletal muscle protein degradation, and induce apoptosis, reducing skeletal muscle mass through various signaling pathways (38, 39). Moreover, adipokine, secreted by adipose tissue, regulates insulin resistance and metabolic homeostasis (40), and subcutaneous adipose tissue increase releases more leptin (the adipokine prototype) (41), It decreases myofibrillar protein synthesis in skeletal muscle without changing circulating insulin levels, which then inhibits skeletal muscle tissue synthesis and growth (42). These metabolic disorders are intertwined in a vicious recurrent cycle of skeletal muscle mass reduction and adiposity (obesity) increase, resulting in “sarcopenic obesity” (43, 44).
Our results agree with Kim TN and colleagues’ findings, who reported that baseline visceral fat area (VFA) measured by CT negatively predicted changes in appendicular lean soft tissue (ALST) mass calculated using dual-energy X-ray absorptiometry, but baseline ALST mass did not predict changes in VFA during follow-up (45). Our results indicated that preoperative SMI negatively predicted SFI at P2, but SMI at P2 positively predicted SFI at P3, which may partly account for why baseline muscle mass did not predict fat area changes during follow-up. Moreover, Kim TN and colleagues’ study had only 379 participants, and they stressed that a larger sample size may show that baseline ALST mass is an independent risk factor for visceral obesity development (45). Therefore, there is increasing evidence that age-related skeletal muscle loss increases adipose tissue accumulation in the subcutis, which then causes further skeletal muscle loss.
Additionally, the results indicated that SMI at P2 positively influenced SFI at P3, possibly reflecting overall health and physical recovery during the postoperative period. Early postoperative increases in skeletal muscle mass are often accompanied by increased nutrient intake, which not only promotes muscle recovery but may also lead to increased subcutaneous fat. Our findings showed that SMI increased from 44.15 (38.69, 49.51) at P2 to 45.61 (40.03, 51.51) at P3, while SFI increased from 36.83 (25.36, 53.06) at P2 to 38.74 (27.63, 53.88) at P3. Although increased skeletal muscle mass raises metabolic rate and promotes fat consumption, the overall improvement in nutritional status and physical recovery may result in a net increase in fat stores. Conversely, SFI at P2 negatively affected SMI at P3, potentially due to the inhibitory effect of subcutaneous fat accumulation on muscle growth. During the postoperative recovery period, increased fat may be associated with inflammatory responses and metabolic stress, which can hinder muscle growth (46, 47).
Our study demonstrates that colorectal cancer patients with elevated preoperative subcutaneous fat index (SFI) have significantly lower recurrence-free survival rates compared to those with normal preoperative SFI. Furthermore, combined analysis reveals that patients with either low preoperative skeletal muscle index (SMI) or high preoperative SFI exhibit reduced overall and recurrence-free survival. These findings are consistent with existing literature, underscoring the importance of body composition in colorectal cancer prognosis. High SFI is associated with poorer outcomes potentially due to the promotion of inflammation and immune suppression in the tumor microenvironment, which accelerates tumor progression. Previous studies indicate that elevated SFI can affect tumor behavior and patient prognosis through mechanisms involving cytokines and growth factors secreted by adipose tissue (48, 49). Additionally, low SMI, indicative of muscle loss or atrophy, is often linked to frailty and poor survival outcomes. Research suggests that decreased skeletal muscle may lead to diminished immune function and reduced treatment tolerance, thereby impacting overall and recurrence-free survival (50–52). Although postoperative SFI and SMI measurements did not show significant associations, this could be attributed to the complexity of body composition changes post-surgery and the effects of surgical and therapeutic interventions. The variability during postoperative recovery may obscure the associations observed preoperatively. Furthermore, preoperative body composition indicators likely better reflect baseline health status and physiological reserves, thus providing a more accurate prediction of prognosis (53).
This study has several strengths. First, the authors used RI-CLPM to investigate the bidirectional association between SMI and SFI, which is believed to be the first study to do so. Second, we further validated the predictive value of SFI, SMI, and their combination for colorectal cancer prognosis. The results suggest that increasing preoperative skeletal muscle levels can prevent subcutaneous fat accumulation, thereby maintaining physical health and improving prognosis in colorectal cancer patients. This finding is significant for understanding and addressing changes and imbalances in body composition among colorectal cancer patients and for its clinical relevance. However, the study has certain limitations. Firstly, being a single-center retrospective study, its generalizability might be limited, potentially introducing bias. Secondly, due to the loss of cancer patients during follow-up, long-term effective CT images and measurement results could not be obtained. Only patients with more than two measurements from preoperative to 6 months postoperative were included to ensure a sufficient sample size, which might introduce bias and overlook long-term effects over time. Thirdly, the study variables SMI and SFI measured at three time points varied to different extents by gender, age, tumor primary site, and pathological stage. Due to the limited sample size, further stratified analysis could not be performed. Future studies might examine if similar effects exist in different populations.
Moreover, although we controlled for variance components such as gender, age, and pathological type before measurement, potential confounding factors such as tumor treatment, nutritional intake, perioperative physical activity, and resistance training could not be stabilized or predicted, possibly leading to biased estimates of our results. Lastly, although RI-CLPM is considered a residual-level methodology (54), which decomposes longitudinal correlations between constructs into stable person-to-person correlations and time-invariant intrapersonal dynamics (54). This decomposition allows for the estimation of within-person cross-lagged effects after adjusting for stabilizing factors (55). Many scholars argue that RI-CLPM is superior to CLPM, especially in the presence of stable factors (56–58). However, Lüdtke et al. (59), found that RI-CLPM has limited capacity to control for unobserved stable confounders when estimating cross-lagged effects. The within-person cross-lagged effect in RI-CLPM, which estimates the effect of a one-unit increase around a person’s mean, is often less relevant for testing causal hypotheses with longitudinal data, as it captures only individual temporary fluctuations and overlooks potential causes of between-person differences. Furthermore, Lüdtke’s simulation study confirms that RI-CLPM provides biased estimates of cross-lagged effects and heavily relies on specific parametric assumptions, leading to biases in different data generation scenarios (55). These critical perspectives suggest caution in interpreting our study’s results and emphasize the need to consider the inherent limitations of these models. Future research should explore improvements and alternatives to enhance the accuracy and reliability of the analysis.
5 Conclusion
Overall, this study supports a bidirectional relationship between SMI and SFI in colorectal cancer patients. We found that the relative strength of these relationships varies perioperatively. Specifically, SMI negatively predicted SFI from the preoperative period to 2 months postoperatively, but positively predicted SFI from 2 to 5 months postoperatively, with the effect size gradually decreasing. At 2 months postoperatively, SFI emerged as the major predictor. This suggests that age-related skeletal muscle loss increases subcutaneous adipose tissue storage, which further exacerbates skeletal muscle loss in CRC patients. Additionally, we confirmed that preoperative SFI and its combination with SMI are independent prognostic factors for CRC, validating the clinical importance of preoperative SMI and SFI in CRC patinets. Future studies should investigate SMI and SFI over long-term follow-up or in healthy populations to further elucidate these complex relationships.
Data availability statement
The original contributions presented in the study are included in the article/Supplementary material, further inquiries can be directed to the corresponding authors.
Ethics statement
The studies involving humans were approved by the Ethics Committee of Kunming Medical University. The studies were conducted in accordance with the local legislation and institutional requirements. Written informed consent for participation was not required from the participants or the participants’ legal guardians/next of kin in accordance with the national legislation and institutional requirements.
Author contributions
GY: Conceptualization, Data curation, Formal analysis, Investigation, Methodology, Software, Validation, Visualization, Writing – original draft. LL: Data curation, Investigation, Writing – original draft. MeL: Conceptualization, Data curation, Investigation, Writing – original draft. XJ: Conceptualization, Data curation, Investigation, Methodology, Writing – original draft. PC: Investigation, Project administration, Writing – original draft. MiL: Conceptualization, Data curation, Investigation, Writing – original draft. QM: Conceptualization, Data curation, Formal analysis, Investigation, Resources, Writing – original draft. YL: Conceptualization, Data curation, Investigation, Supervision, Writing – original draft. SD: Conceptualization, Data curation, Investigation, Project administration, Writing – original draft. RY: Data curation, Investigation, Writing – original draft. YH: Data curation, Investigation, Project administration, Supervision, Validation, Writing – review & editing. ZL: Conceptualization, Data curation, Funding acquisition, Investigation, Methodology, Project administration, Resources, Supervision, Validation, Writing – review & editing. DY: Formal analysis, Funding acquisition, Project administration, Resources, Supervision, Writing – review & editing.
Funding
The author(s) declare financial support was received for the research, authorship, and/or publication of this article. This study was supported by the National Natural Science Foundation of China (grant numbers 82073569, 81960592, 82001986, and 82360345), the Outstanding Youth Science Fundation of Yunnan Basic Research Project (202001AW070021), the Special Program for the Selection of High-Level Scientific and Technological Talent and Innovation Teams in Yunnan Province (2012005AC160023 and 202405AS350016), and the Key Science Fundation of Yunnan Basic Research (202101AS070040).
Acknowledgments
Thanks to all the authors for their contributions to this article.
Conflict of interest
The authors declare that the research was conducted in the absence of any commercial or financial relationships that could be construed as a potential conflict of interest.
Publisher’s note
All claims expressed in this article are solely those of the authors and do not necessarily represent those of their affiliated organizations, or those of the publisher, the editors and the reviewers. Any product that may be evaluated in this article, or claim that may be made by its manufacturer, is not guaranteed or endorsed by the publisher.
Supplementary material
The Supplementary material for this article can be found online at: https://www.frontiersin.org/articles/10.3389/fnut.2024.1381995/full#supplementary-material
References
1. Sung, H, Ferlay, J, Siegel, RL, Laversanne, M, Soerjomataram, I, Jemal, A, et al. Global cancer statistics 2020: globocan estimates of incidence and mortality worldwide for 36 cancers in 185 countries. CA Cancer J Clin. (2021) 71:209–49. doi: 10.3322/caac.21660
2. Khil, H, Kim, SM, Hong, S, Gil, HM, Cheon, E, Lee, DH, et al. Time trends of colorectal cancer incidence and associated lifestyle factors in South Korea. Sci Rep. (2021) 11:2413. doi: 10.1038/s41598-021-81877-2
3. Ma, CJ, Hu, WH, Huang, MC, Chiang, JM, Hsieh, PS, Wang, HS, et al. Taiwan Society of Colon and Rectum Surgeons (Tscrs) consensus for anti-inflammatory nutritional intervention in colorectal Cancer. Front Oncol. (2021) 11:819742. doi: 10.3389/fonc.2021.819742
4. Gillis, C, Richer, L, Fenton, TR, Gramlich, L, Keller, H, Culos-Reed, SN, et al. Colorectal Cancer patients with malnutrition suffer poor physical and mental health before surgery. Surgery. (2021) 170:841–7. doi: 10.1016/j.surg.2021.04.003
5. Lewandowska, A, Religioni, U, Czerw, A, Deptała, A, Karakiewicz, B, Partyka, O, et al. Nutritional treatment of patients with colorectal Cancer. Int J Environ Res Public Health. (2022) 19:6881. doi: 10.3390/ijerph19116881
6. Petrova, M, Valchev, G, Conev, NV, Dimitrova, E, Robev, B, Boneva, M, et al. Sarcopenia as a negative predictive marker for treatment with pembrolizumab as a second line in patients with metastatic non-small cell lung cancer. J Clin Oncol. (2020) 38:e21541. doi: 10.1200/JCO.2020.38.15_suppl.e21541
7. Petrelli, F, Cortellini, A, Indini, A, Tomasello, G, Ghidini, M, Nigro, O, et al. Association of obesity with survival outcomes in patients with cancer: a systematic review and meta-analysis. JAMA Netw Open. (2021) 4:e213520. doi: 10.1001/jamanetworkopen.2021.3520
8. Fleming, CA, O’Connell, EP, Kavanagh, RG, O’Leary, DP, Twomey, M, Corrigan, MA, et al. Body composition, inflammation, and 5-year outcomes in colon cancer. JAMA Netw Open. (2021) 4:e2115274. doi: 10.1001/jamanetworkopen.2021.15274
9. Fonseca, GWP, Farkas, J, Dora, E, von Haehling, S, and Lainscak, M. Cancer Cachexia and related metabolic dysfunction. Int J Mol Sci. (2020) 21:2321. doi: 10.3390/ijms21072321
10. Vandewoude, MF, Alish, CJ, Sauer, AC, and Hegazi, RA. Malnutrition-sarcopenia syndrome: is this the future of nutrition screening and assessment for older adults? J Aging Res. (2012) 2012:651570:1–8. doi: 10.1155/2012/651570
11. Arends, J, Bachmann, P, Baracos, V, Barthelemy, N, Bertz, H, Bozzetti, F, et al. Espen guidelines on nutrition in Cancer patients. Clin Nutr. (2017) 36:11–48. doi: 10.1016/j.clnu.2016.07.015
12. Saino, Y, Kawase, F, Nagano, A, Ueshima, J, Kobayashi, H, Murotani, K, et al. Diagnosis and prevalence of Sarcopenic obesity in patients with colorectal Cancer: a scoping review. Clin. Nutr. (2023) 42:1595–601. doi: 10.1016/j.clnu.2023.06.025
13. Li, CW, Yu, K, Shyh-Chang, N, Jiang, Z, Liu, T, Ma, S, et al. Pathogenesis of sarcopenia and the relationship with fat mass: descriptive review. J Cachexia Sarcopenia Muscle. (2022) 13:781–94. doi: 10.1002/jcsm.12901
14. Sakers, A, De Siqueira, MK, Seale, P, and Villanueva, CJ. Adipose-tissue plasticity in health and disease. Cell. (2022) 185:419–46. doi: 10.1016/j.cell.2021.12.016
15. Mueller, TC, Bachmann, J, Prokopchuk, O, Friess, H, and Martignoni, ME. Molecular pathways leading to loss of skeletal muscle mass in cancer cachexia--can findings from animal models be translated to humans? BMC Cancer. (2016) 16:75. doi: 10.1186/s12885-016-2121-8
16. Das, SK, Eder, S, Schauer, S, Diwoky, C, Temmel, H, Guertl, B, et al. Adipose triglyceride lipase contributes to Cancer-associated Cachexia. Science. (2011) 333:233–8. doi: 10.1126/science.1198973
17. Ibrahim, MM. Subcutaneous and visceral adipose tissue: structural and functional differences. Obes Rev. (2010) 11:11–8. doi: 10.1111/j.1467-789X.2009.00623.x
18. Kong, M, Geng, N, Zhou, Y, Lin, N, Song, W, Xu, M, et al. Defining reference values for low skeletal muscle index at the L3 vertebra level based on computed tomography in healthy adults: a multicentre study. Clin Nutr. (2022) 41:396–404. doi: 10.1016/j.clnu.2021.12.003
19. Lee, K, Shin, Y, Huh, J, Sung, YS, Lee, I-S, Yoon, K-H, et al. Recent issues on body composition imaging for sarcopenia evaluation. Korean J Radiol. (2019) 20:205–17. doi: 10.3348/kjr.2018.0479
20. McGovern, J, Dolan, RD, Horgan, PG, Laird, BJ, and McMillan, DC. Computed tomography-defined low skeletal muscle index and density in cancer patients: observations from a systematic review. J Cachexia Sarcopenia Muscle. (2021) 12:1408–17. doi: 10.1002/jcsm.12831
21. Hamaker, EL, Kuiper, RM, and Grasman, RPPP. A critique of the cross-lagged panel model. Psychol Methods. (2015) 20:102–16. doi: 10.1037/a0038889
22. von Elm, E, Altman, DG, Egger, M, Pocock, SJ, Gøtzsche, PC, and Vandenbroucke, JP. Strengthening the reporting of observational studies in epidemiology (Strobe) statement: guidelines for reporting observational studies. BMJ. (2007) 335:806–8. doi: 10.1136/bmj.39335.541782.AD
23. Martin, L, Birdsell, L, Macdonald, N, Reiman, T, Clandinin, MT, McCargar, LJ, et al. Cancer Cachexia in the age of obesity: skeletal muscle depletion is a powerful prognostic factor, independent of body mass index. J Clin Oncol. (2013) 31:1539–47. doi: 10.1200/jco.2012.45.2722
24. Camp, RL, Dolled-Filhart, M, and Rimm, DL. X-tile: a new bio-informatics tool for biomarker assessment and outcome-based cut-point optimization. Clin Cancer Res. (2004) 10:7252–9. doi: 10.1158/1078-0432.Ccr-04-0713
25. Gao, W, Hou, Y, Hao, S, and Yu, A. Helicopter parenting and emotional problems in Chinese emerging adults: are there cross-lagged effects and the mediations of autonomy? J Youth Adolesc. (2023) 52:393–405. doi: 10.1007/s10964-022-01702-5
26. Schafer, JL, and Graham, JW. Missing data: our view of the state of the art. Psychol Methods. (2002) 7:147–77. doi: 10.1037/1082-989X.7.2.147
27. Hu, L-T, and Bentler, PM. Cutoff criteria for fit indexes in covariance structure analysis: conventional criteria versus new alternatives. Struct Eq Model. (1999) 6:1–55. doi: 10.1080/10705519909540118
28. Hooper, D, Coughlan, J, and Mullen, MR. Structural equation modelling: guidelines for determining model fit. Electr J Busin Res Methods. (2008) 6:53–60. doi: 10.21427/D7CF7R
29. Kenny, DA, Kaniskan, B, and McCoach, DB. The performance of RMSEA in models with small degrees of freedom. Sociol Methods Res. (2015) 44:486–507. doi: 10.1177/0049124114543236
30. Dolan, RD, Abbass, T, Sim, WMJ, Almasaudi, AS, Dieu, LB, Horgan, PG, et al. Longitudinal changes in Ct body composition in patients undergoing surgery for colorectal Cancer and associations with Peri-operative Clinicopathological characteristics. Front Nutr. (2021) 8:678410. doi: 10.3389/fnut.2021.678410
31. Frampton, J, Murphy, KG, Frost, G, and Chambers, ES. Short-chain fatty acids as potential regulators of skeletal muscle metabolism and function. Nat Metab. (2020) 2:840–8. doi: 10.1038/s42255-020-0188-7
32. Kim, KM, Jang, HC, and Lim, S. Differences among skeletal muscle mass indices derived from height-, weight-, and body mass index-adjusted models in assessing sarcopenia. Korean J Intern Med. (2016) 31:643–50. doi: 10.3904/kjim.2016.015
33. Wilkinson, DJ, Piasecki, M, and Atherton, PJ. The age-related loss of skeletal muscle mass and function: measurement and physiology of muscle fibre atrophy and muscle fibre loss in humans. Ageing Res Rev. (2018) 47:123–32. doi: 10.1016/j.arr.2018.07.005
34. Kawada, T. Basal metabolic rate parameters, sarcopenia, and frailty in older males. J Am Med Dir Assoc. (2019) 20:919. doi: 10.1016/j.jamda.2019.03.021
35. Zampino, M, Semba, RD, Adelnia, F, Spencer, RG, Fishbein, KW, Schrack, JA, et al. Greater skeletal muscle oxidative capacity is associated with higher resting metabolic rate: results from the Baltimore longitudinal study of aging. J Gerontol Ser A. (2020) 75:2262–8. doi: 10.1093/gerona/glaa071
36. Yoo, TK, Rhim, HC, Lee, YT, Yoon, KJ, and Park, CH. Relationship between hyperhomocysteinemia and coexisting obesity with low skeletal muscle mass in asymptomatic adult population. Sci Rep. (2022) 12:12439. doi: 10.1038/s41598-022-16401-1
37. Merz, KE, and Thurmond, DC. Role of skeletal muscle in insulin resistance and glucose uptake. Compr Physiol. (2020) 10:785–809. doi: 10.1002/cphy.c190029
38. Ji, T, Li, Y, and Ma, L. Sarcopenic obesity: an emerging public health problem. Aging Dis. (2022) 13:379–88. doi: 10.14336/ad.2021.1006
39. Kalinkovich, A, and Livshits, G. Sarcopenic obesity or obese sarcopenia: a cross talk between age-associated adipose tissue and skeletal muscle inflammation as a main mechanism of the pathogenesis. Ageing Res Rev. (2017) 35:200–21. doi: 10.1016/j.arr.2016.09.008
40. Wang, X, Zhang, S, and Li, Z. Adipokines in glucose and lipid metabolism. Adipocytes. (2023) 12:2202976. doi: 10.1080/21623945.2023.2202976
41. Shi, W, Lou, J, Zhang, X, Ji, Y, Weng, X, and Du, J. Adipose tissue alleviates the stress response by releasing adiponectin during laparoscopic surgery in patients with colorectal cancer. Lipids Health Dis. (2021) 20:166. doi: 10.1186/s12944-021-01595-6
42. Carbó, N, Ribas, V, Busquets, S, Alvarez, B, López-Soriano, FJ, and Argilés, JM. Short-term effects of leptin on skeletal muscle protein metabolism in the rat. J Nutr Biochem. (2000) 11:431–5. doi: 10.1016/s0955-2863(00)00101-7
43. Hu, T, Shen, Y, Cao, W, Xu, Y, Wang, Y, Ma, X, et al. Two-year changes in body composition and future cardiovascular events: a longitudinal community-based study. Nutr Metabolism. (2023) 20:4. doi: 10.1186/s12986-023-00727-2
44. Volpi, E, Nazemi, R, and Fujita, S. Muscle tissue changes with aging. Curr Opin Clin Nutr Metab Care. (2004) 7:405–10. doi: 10.1097/01.mco.0000134362.76653.b2
45. Kim, TN, Park, MS, Ryu, JY, Choi, HY, Hong, HC, Yoo, HJ, et al. Impact of visceral fat on skeletal muscle mass and vice versa in a prospective cohort study: the Korean Sarcopenic obesity study (Ksos). PLoS One. (2014) 9:e115407. doi: 10.1371/journal.pone.0115407
46. Wu, H, and Ballantyne, CM. Skeletal muscle inflammation and insulin resistance in obesity. J Clin Invest. (2017) 127:43–54. doi: 10.1172/jci88880
47. Bondia-Pons, I, Ryan, L, and Martinez, JA. Oxidative stress and inflammation interactions in human obesity. J Physiol Biochem. (2012) 68:701–11. doi: 10.1007/s13105-012-0154-2
48. Brown, JC, Caan, BJ, Prado, CM, Cespedes Feliciano, EM, Xiao, J, Kroenke, CH, et al. The association of abdominal adiposity with mortality in patients with stage I-III colorectal cancer. J Natl Cancer Inst. (2020) 112:377–83. doi: 10.1093/jnci/djz150
49. Del Cornò, M, D'Archivio, M, Conti, L, Scazzocchio, B, Varì, R, Donninelli, G, et al. Visceral fat adipocytes from obese and colorectal cancer subjects exhibit distinct secretory and Ω6 polyunsaturated fatty acid profiles and deliver immunosuppressive signals to innate immunity cells. Oncotarget. (2016) 7:63093–105. doi: 10.18632/oncotarget.10998
50. Wang, S, Xie, H, Gong, Y, Kuang, J, Yan, L, Ruan, G, et al. The value of L3 skeletal muscle index in evaluating preoperative nutritional risk and long-term prognosis in colorectal Cancer patients. Sci Rep. (2020) 10:8153. doi: 10.1038/s41598-020-65091-0
51. Reisinger, KW, Derikx, JP, van Vugt, JL, Von Meyenfeldt, MF, Hulsewé, KW, Olde Damink, SW, et al. Sarcopenia is associated with an increased inflammatory response to surgery in colorectal cancer. Clin Nutr. (2016) 35:924–7. doi: 10.1016/j.clnu.2015.07.005
52. Mallet-Boutboul, L, Basile, D, Gallois, C, Roblot, V, Cazelles, A, Labiad, C, et al. Impact of sarcopenia and visceral fat on postoperative morbidity and survival after rectal cancer surgery in patients treated with neoadjuvant chemoradiotherapy. Surgery Open Digestive Adv. (2023) 10:100083. doi: 10.1016/j.soda.2023.100083
53. Price, KL, and Earthman, CP. Update on body composition tools in clinical settings: computed tomography, ultrasound, and bioimpedance applications for assessment and monitoring. Eur J Clin Nutr. (2019) 73:187–93. doi: 10.1038/s41430-018-0360-2
54. Andersen, HK. Equivalent approaches to dealing with unobserved heterogeneity in cross-lagged panel models? Investigating the benefits and drawbacks of the latent curve model with structured residuals and the random intercept cross-lagged panel model. Psychol Methods. (2022) 27:730. doi: 10.1037/met0000285
55. Lüdtke, O, and Robitzsch, A. A comparison of different approaches for estimating cross-lagged effects from a causal inference perspective. Struct Equ Model Multidiscip J. (2022) 29:888–907. doi: 10.1080/10705511.2022.2065278
56. Grimm, KJ, Helm, J, Rodgers, D, and O'Rourke, H. Analyzing cross-lag effects: a comparison of different cross-lag modeling approaches. New Dir Child Adolesc Dev. (2021) 2021:11–33. doi: 10.1002/cad.20401
57. Mulder, JD, and Hamaker, EL. Three extensions of the random intercept cross-lagged panel model. Struct Equ Model Multidiscip J. (2021) 28:638–48. doi: 10.1080/10705511.2020.1784738
58. Usami, S. On the differences between general cross-lagged panel model and random-intercept cross-lagged panel model: interpretation of cross-lagged parameters and model choice. Struct Equ Model Multidiscip J. (2021) 28:331–44. doi: 10.1080/10705511.2020.1821690
Keywords: skeletal muscle index, subcutaneous fat index, RI-CLPM, colorectal cancer, retrospective cohort
Citation: Yan G, Liu L, Liu M, Jiang X, Chen P, Li M, Ma Q, Li Y, Duan S, You R, Huang Y, Li Z and You D (2024) Bidirectional association between perioperative skeletal muscle and subcutaneous fat in colorectal cancer patients and their prognostic significance. Front. Nutr. 11:1381995. doi: 10.3389/fnut.2024.1381995
Edited by:
Clelia Madeddu, University of Cagliari, ItalyReviewed by:
Jacek Budzyński, Nicolaus Copernicus University in Toruń, PolandDenis Fedorinov, Russian Medical Academy of Postgraduate Education, Russia
Copyright © 2024 Yan, Liu, Liu, Jiang, Chen, Li, Ma, Li, Duan, You, Huang, Li and You. This is an open-access article distributed under the terms of the Creative Commons Attribution License (CC BY). The use, distribution or reproduction in other forums is permitted, provided the original author(s) and the copyright owner(s) are credited and that the original publication in this journal is cited, in accordance with accepted academic practice. No use, distribution or reproduction is permitted which does not comply with these terms.
*Correspondence: Dingyun You, eW91ZGluZ3l1bkBrbW11LmVkdS5jbg==; Zhenhui Li, bGl6aGVuaHVpNjIxQHFxLmNvbQ==; Yanni Huang, aHVhbmd5YW5uaUBrbW11LmVkdS5jbg==
†These authors have contributed equally to this work and share first authorship