
94% of researchers rate our articles as excellent or good
Learn more about the work of our research integrity team to safeguard the quality of each article we publish.
Find out more
ORIGINAL RESEARCH article
Front. Nutr., 06 March 2024
Sec. Nutritional Epidemiology
Volume 11 - 2024 | https://doi.org/10.3389/fnut.2024.1331990
This article is part of the Research TopicEating Behavior and Chronic Diseases: Research Evidence from Population StudiesView all 16 articles
 Marco Antonio Ávila Arcos1
 Teresa Shamah Levy1
 Marti Yareli Del Monte Vega2
 Adolfo Chávez Villasana2
 Abelardo Ávila Curiel2*
Introduction: The prevalence of obesity in the Mexican school-age (5–11 years old) population increased from 8.9 to 18.1% between 1999 and 2022. Although overweight and obesity (OW + Ob) is a complex and multifactorial phenomenon, alongside its increasing trend, changes in eating patterns as a result of obesogenic environments that promote higher energy intake have been documented. The objective of the present study was to detect possible associations between schools and their proximity to and density of convenience stores in Monterrey, Mexico from 2015 to 2018.
Materials and methods: Anthropometric data were obtained from a subset of measurements of the National Registry of Weight and Height (RNPT) performed in the Monterrey Mexico metropolitan area in 2015 and 2018, and obesity prevalence was computed and classified into quintiles at the school level. Convenience store data were obtained from the National Directory of Economic Units (DNUE). The analyses consisted of densities within 400-800 m buffers, distance to the nearest stores, and cartographic visualization of the store’s kernel density versus OW + Ob hotspots for both periods.
Results: A total of 175,804 children in 2015 and 175,964 in 2018 belonging to 1,552 elementary schools were included in the study; during this period, OW + Ob prevalence increased from 38.7 to 39.3%, and a directly proportional relationship was found between the quintiles with the higher OW + Ob prevalence and the number of stores for both radii. Hotspots of OW + Ob ranged from 63 to 91 between 2015 and 2018, and it was visually confirmed that such spots were associated with areas with a higher density of convenience stores regardless of socioeconomic conditions.
Conclusion: Although some relationships between the store’s proximity/density and OW + Ob could be identified, more research is needed to gather evidence about this. However, due to the trends and the magnitude of the problem, guidelines aimed at limiting or reducing the availability of junk food and sweetened beverages on the school’s periphery must be implemented to control the obesogenic environment.
Overweight and Obesity (OW + Ob) is among the most challenging and urgent problems worldwide. In the last decade, no countries have controlled or even lowered their OW + Ob prevalence, particularly in countries with lower incomes, which report greater increases in this issue (World Obesity Federation Atlas) for the period between 2020 and 2025 on a worldwide scale. An increment is expected in the prevalence of obesity from 10 to 14% and 8 to 10% for boys and girls aged 5–19 years, respectively (1).
In Mexico, the OW + Ob problem was recognized in 2016 and ratified in 2018 as a national public health emergency (2). In the school-age population (5–11 years old), the National Nutrition Survey (ENSANUT) reported an alarming increase between 1999 and 2022, rising from 17.2 to 19.2% for overweight and from 8.3 to 18.1% for obesity (3, 4).
This rising trend in OW + Ob has occurred alongside changes in eating patterns, and Popkin et al. found a shift from home-prepared to processed and packaged foods (5). This is not unique to Mexico; in other countries such as Brazil, the increase in ultra-processed foods (junk food) during the last two decades has also been documented (6).
There is existing literature that demonstrates a link between junk food consumption and OW + Ob as a “cause-effect” relationship. One such study was developed by PAHO in 2015, wherein the authors analyzed data from 14 countries and found a significant relationship between the per-capita sales of these products and the OW + Ob levels. Moreover, in their conclusion, they encourage countries to reduce the consumption of ultra-processed food due to its negative impacts on the nutrition of the population (7). Longitudinal (cohort) studies (8) and literature reviews (9) have confirmed this relationship. Recently, a study conducted in eight countries (including Mexico) documented that increased consumption of ultra-processed foods was associated with higher energy and free sugar intake and stated that this association constituted a potential determinant of obesity in children and adolescents (10).
Numerous studies have been conducted to examine the obesogenic environment from a spatial perspective, some of them in Latin American countries such as Peru and El Salvador (11, 12), which are merely descriptive and aimed at characterizing the spatial distribution of OW + Ob. In the case of seeking spatial interactions between junk food offerings and OW + Ob, research is mainly based on developed countries, and one study conducted in the United Kingdom in 2012 established that areas with greater access to fast food stores also had greater OW + Ob prevalence (13). Similar studies have been carried out in the USA, Netherlands, Germany, Canada, Macao, and New Zealand, finding spatial interactions between food sources and OW + Ob (14–18).
In Mexico, recent studies have approached this issue by conducting a cross-sectional analysis to estimate the indirect association between food store density and OW + Ob among Mexican adolescents, using sugar-sweetened beverage (SSB) consumption as a mediator. Store density was directly associated with SSB consumption but not indirectly associated with OW + Ob mediated by SSB (19). Another study analyzed the change in the retail food environment in Mexican municipalities from 2010 to 2020 and assessed whether these trends were modified by socioeconomic deprivation. It was concluded that there has been a substantial expansion and rapid change in Mexico’s food environment, driven mainly by the rise in convenience stores and supermarkets in the most deprived and least urbanized areas (20).
The present study was designed to measure the impact of convenience stores on OW + Ob prevalence in children, which is relevant because some authors have documented that although the home is still a place where a large number of calories is consumed, a significant proportion of the calories consumed (almost one-third) come from eating episodes conducted outside of the house (21, 22). A spatial approach using GIS techniques was proposed, considering that the periphery of schools could be a place where children acquire a significant proportion of their calories.
The objective of the present study was to assess the OW + Ob rates in children who attended schools in Monterrey, Mexico, between 2015 and 2018, and to detect possible associations between schools and their proximity to and density of convenience stores.
The present work is an ecological study whose population was children (6 to 12 years old) from Monterrey, Mexico; the variable of interest was OW + Ob prevalence at the school level and its relation to spatial attributes – proximity and density – of convenience stores, as promoters of obesogenic environments. Considering the school as the unit of analysis, the study is longitudinal (2015–2018) since anthropometric data are present in both periods for the 1,552 schools.
The study area encompasses the Monterrey Metropolitan Area, situated in the northern region of Mexico (25.67° N, 100.308° E), approximately 224 km southwest of the United States border in Laredo, Texas. As of the 2020 census, this region comprises 16 municipalities, analogous to county-level administrative units, with a total population of 5.3 million inhabitants. The economic landscape of the area is predominantly shaped by industrial activities, with a particular emphasis on key sectors such as beer, steel, and concrete production and the manufacture of cars and machinery.
Anthropometric data were obtained from the National Registry of Weight and Height (RNPT in Spanish) (23), a strategy implemented in Mexico to evaluate the nutritional status of children in elementary schools. Its main objective is to identify nutritional disorders such as malnutrition, overweight, and obesity. This initiative is jointly managed by the Health and Education Ministries (SSA and SEP in Spanish) and the National and State Systems for Integral Family Development (DIF) and is technically overseen by the National Nutrition and Medical Sciences Institute (INCMNSZ). This collaboration includes periodic visits to schools by trained personnel to conduct anthropometric measurements (24, 25). From these data, a subset consisting of 1,552 Elementary schools belonging to the urban areas of the municipalities (a county-like territorial division) conforms to the Metropolitan Area of Monterrey, as defined by the National Statistics Geography and Informatics Institute (INEGI) in its Metropolitan Areas Catalog (26). This dataset had an OW + Ob prevalence for each school of 454,217 and 447,792 children in 2015 and 2018, respectively. Nutritional status was defined using the WHO BMI/age indicator, defining overweight as individuals with a z-score greater than +1 S.D. and obesity as those with a z-score > +2 S. D (27). To include socioeconomic data on the schools, a social exclusion index (SEI) variable built for the 2020 National Population and Household Census (28) was included, and the smallest geographic unit (suburb) was used to obtain the maximal resolution for characterizing the schools.
Convenience store data were extracted from the National Directory of Economic Units (DNUE) of INEGI (29), which includes information regarding all the businesses across the country, such as the type of activity, company name, number of employees, opening date, and, most important for the purposes of the present study, latitude and longitude. The final store dataset was constructed by filtering the DNUE database for the following criteria: “Convenience stores” as economic activity code, “OXXO” or “7-11” as company name, and – as in the case of the schools – being located in the urban areas of the Metropolitan Area of Monterrey. In 2015 and 2018, 1,394 and 1979 convenience stores were located, respectively (585 new stores were opened in the metropolitan area during this period).
All previously described data were clipped to the suburb polygon layer that included the SEI; quintiles for OW + Ob and the index were recoded to create categorical variables using QGIS 3.282 and SPSS 25, respectively (30, 31). Buffers (influence areas) of 400 and 800 m were constructed around every school using QGIS; these distances represent, in round numbers, walking times of 5 and 10 min, respectively, for an average pedestrian speed of 1.25 m/s (32).
As the geographic layers were not locally projected, we used the Python equidistance buffer plugin to generate buffer polygons with a precision of ±2 m (33). Once the polygons were generated, we used the QGIS count points in the polygon geoprocessing tool to determine the number of convenience stores within 400 m and 800 m radii from each school, which allowed us to estimate the density of such stores around the school-age population. Additionally, to establish ease of access to the stores from the schools, we computed the Euclidean distance from every school to its nearest store using the distance to the nearest hub geoprocessing tool. Once the spatial variables were calculated, cross-tabulations and scatter plots were performed to analyze the interaction between the density and ease of access of the population to stores with OW + Ob prevalence.
Additionally, to evaluate the impact of SEI characteristics on OW + Ob, a bootstrap analysis of 1,000 samples was performed to calculate the 95% confidence intervals for OW + Ob prevalence for every SEI quintile and determine whether the differences could be due to this and not necessarily because of the proximity and density of the convenience stores. Bootstrap analysis was performed using the SPSS v. 25.0, which uses the computer’s calculation power to create a large number (1,000 in this case) of subsamples of the actual data to calculate a standard error, thus obtaining a confidence interval of the variable of interest (OW + Ob prevalence) (34).
Finally, the last analysis consisted of generating a raster Kernel Density Estimation (KDE) heatmap for the stores in 2015 and 2018, using the QGIS KDE geoprocessing tool with an Epanechnikov kernel shape, which is the most efficient and suitable for our data (35), and a bandwidth of 0.24° (degrees), defined by Scott’s Rule for Bandwidth Selection (36) calculated for 2015 store data. The rasters corresponding to the density of the stores for the 2 years were clipped to the metropolitan area of Monterrey and cartographically represented with a pseudo-band color ramp for their visualization. Along with the previously described process, a Getis-Ord Gi* hotspot analysis was performed in ArcGIS desktop 3.0.3 (37) with the OW + Ob prevalence as the input field. This spatial statistical procedure allowed us to identify, with a significance level (90, 95, and 99%), those schools with a prevalence remarkably greater than their neighbors (38), and the resulting layer of this process was also included in the map along with the store density to visualize the relationship between them. This was performed for 2015 and 2018; therefore, changes over time can be observed when comparing the two maps.
The number of children suffering from OW + Ob in the weight and height registry was 175,804 and 175,964 in 2015 and 2018, respectively, which are expressed as prevalence corresponding to 38.7 and 39.3%, respectively, which also modifies the Q4 and Q5 quintiles by year. The results are presented in Table 1.
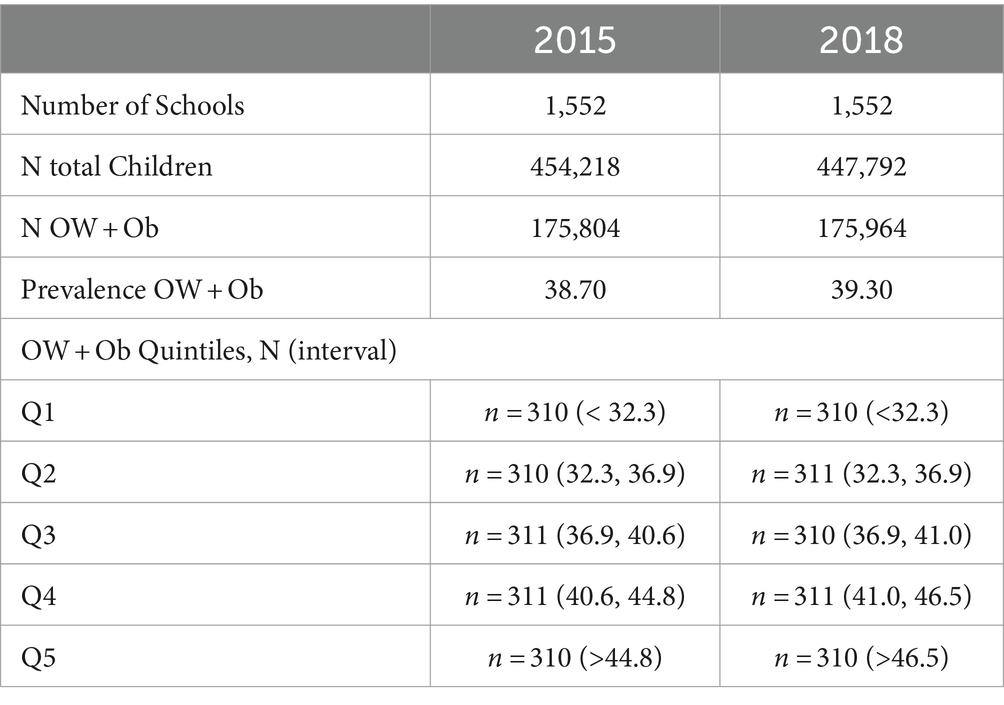
Table 1. General characteristics of the elementary schools, Monterrey Metropolitan Area Mexico 2015–2018.
To assess whether variations in socioeconomic status alone could account for differences in OW + Ob prevalence among schools, a bootstrap analysis of mean prevalence and 95% confidence intervals (CI) was conducted based on Socioeconomic Index (SEI) quintiles. The results, depicted in Figure 1, indicate that although Q4 consistently exhibited a higher prevalence in both years and the overall prevalence increased from the first to the second year of the study, no statistically significant differences were evident between the quintiles in 2015 and 2018 (with overlapping CIs).
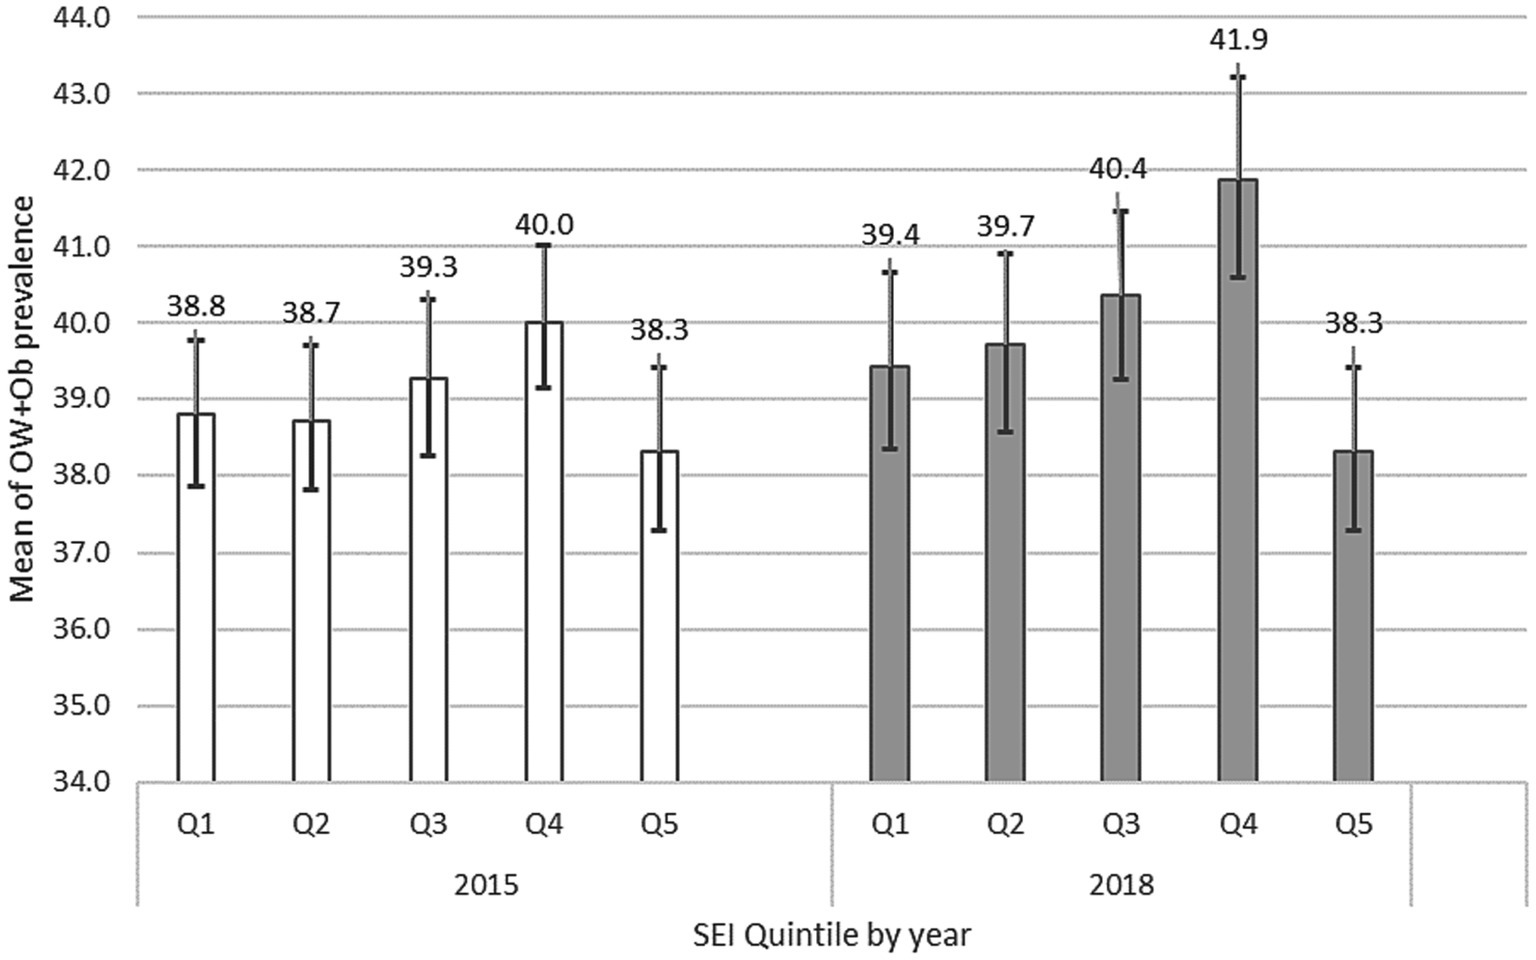
Figure 1. Mean and 95%CI of OW + Ob prevalence in schools in Monterrey Mexico Metropolitan Area by Social Economic Index (SEI) quintile 2015–2018.
Convenience stores registered in the National Directory of Economic Units (DNUE) in the geographical area of the study grew from 1,394 to 1979 in the 2015–18 period, which corresponds to a 42% relative increase in the number of stores in the cited period. Another way to describe this growth is that from 2015 to 2018, a new store was opened every 2.5 days in the Monterrey Metropolitan Area.
Table 2 shows the mean and SD of the number of convenience stores in the OW + Ob quintile for the 2 years of the present study. The first aspect that is clear is that regardless of the store’s density, in Q4 and Q5, OW + Ob increased between 2015 and 2018, showing a greater lower limit value in the most recent period (40.6 to 41.0 and 44.8 to 46.6, respectively). In other words, in the same proportion of the Q4 and Q5 quintiles, the actual prevalence is greater. Another interesting finding is that, between 2015 and 2018, in all quintiles and for both radii, the mean number of stores increased. If we consider that schools are spatially fixed, this necessarily indicates that a significant number of stores opened in the school’s proximity during this time. A greater increment can be seen within the 400 m radius for Q1 schools, which increased from 0.82 schools to 1.27 (this corresponds to a 54% relative increment).
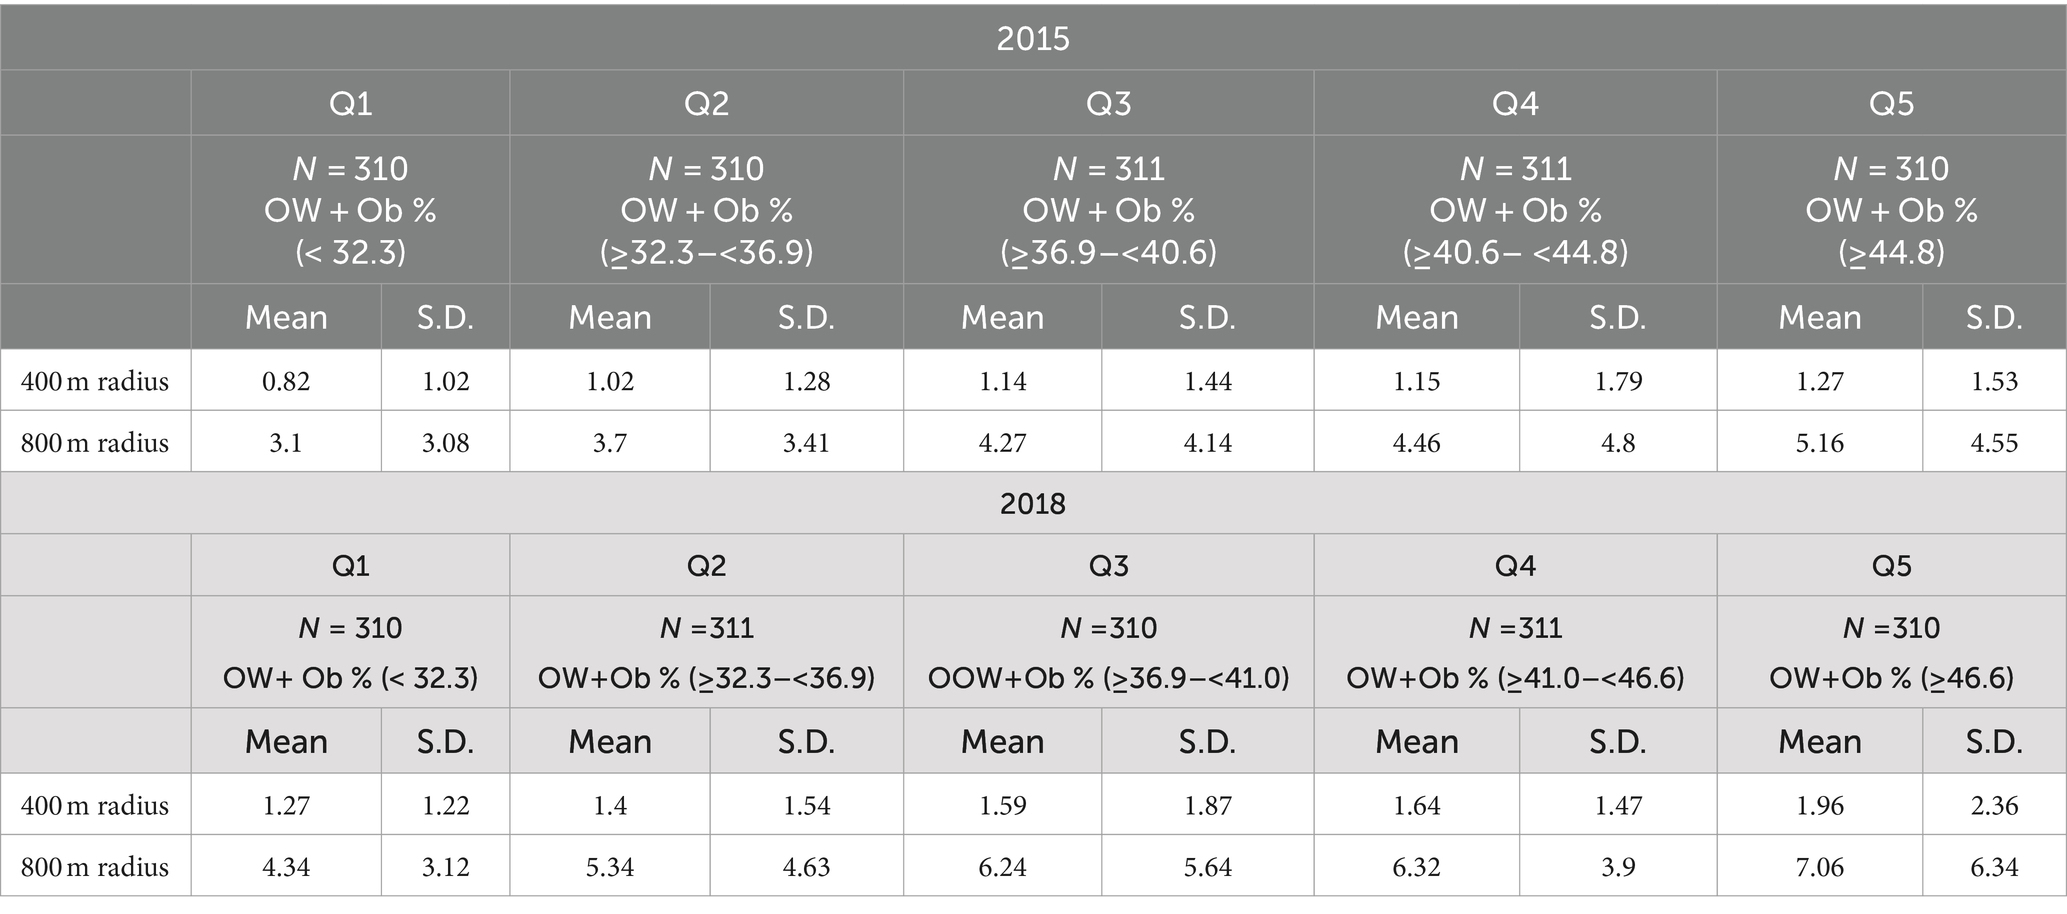
Table 2. Mean and standard deviation of the number of convenience stores around the elementary schools within 400 m and 800 m radii by OW + Ob quintile and year in Monterrey Mexico Metropolitan Area 2015–2018.
The relationship between the OW + Ob quintile and the number of stores in the two radii is shown in Figure 2A which graphically shows two trends: the OW + Ob quintile increases with the number of stores and, as shown in Table 2, the OW + Ob quintile and the store number increased between 2015 and 2018. The same Figure 2B shows an example of a school with 14 convenience stores within its 400 m radius and the remarkably high number of 46 within its 800 m radius.
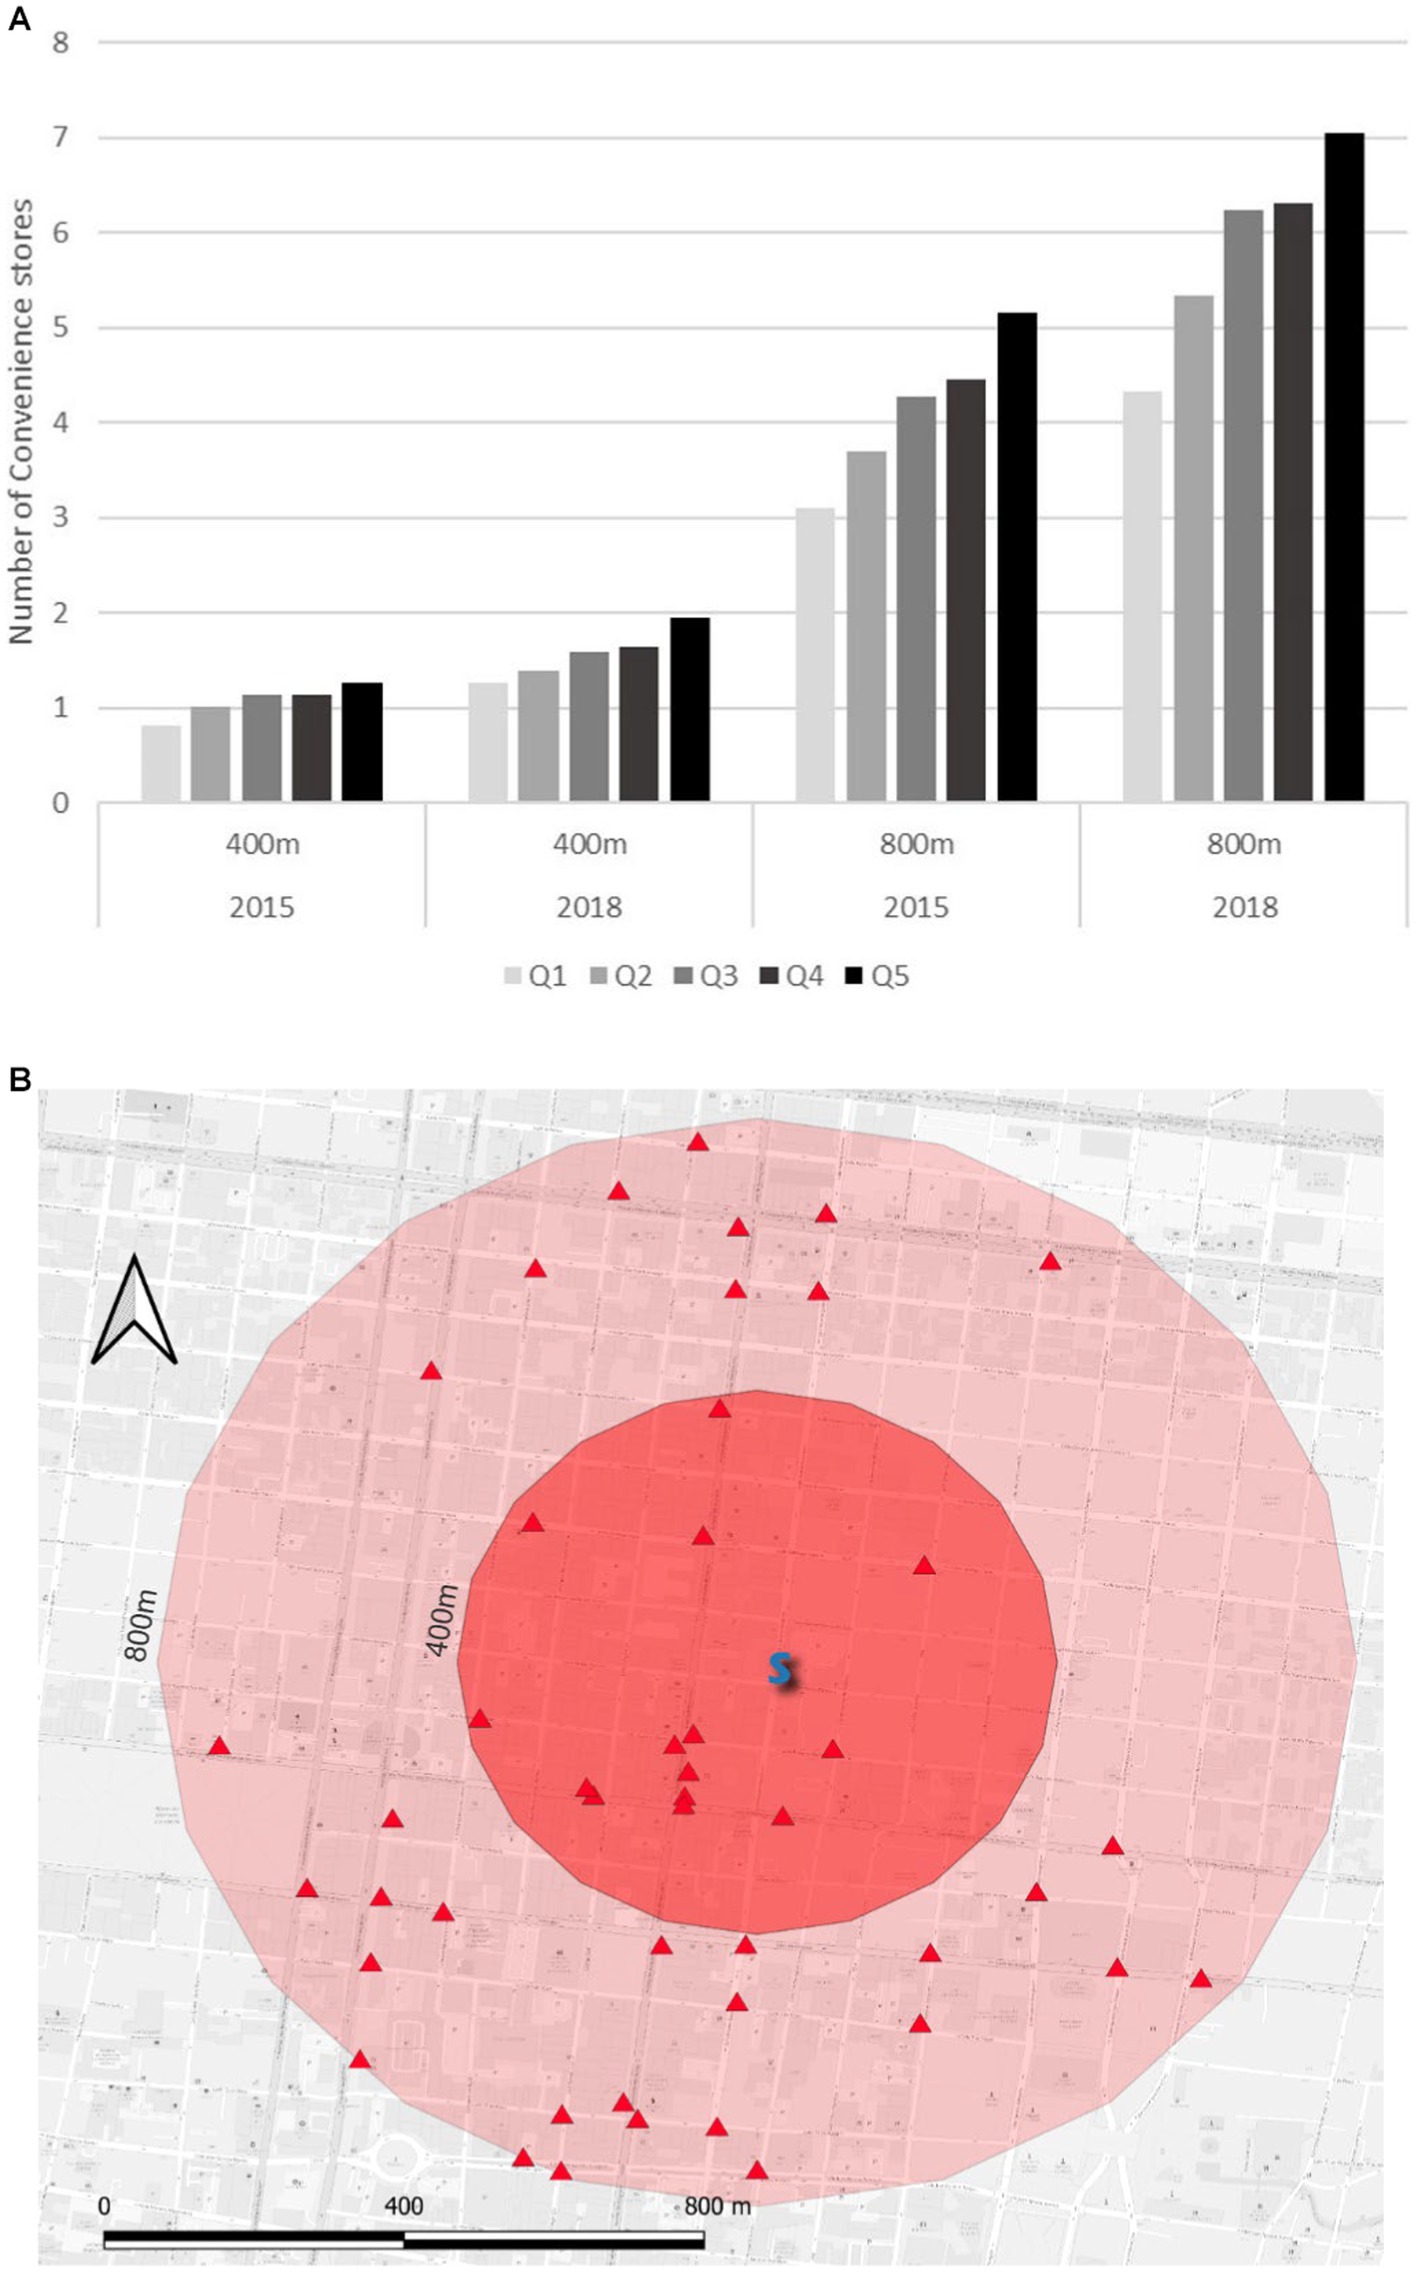
Figure 2. (A) Mean of the number of convenience stores around the elementary schools within 400 m and 800 m radii by OW + Ob quintile and year in Monterrey Mexico Metropolitan Area 2015–2018. (B) Extract of the actual data showing a school (S) surrounded by 14 and 46 convenience stores (Red triangles) in radii of 400 m and 800 m, respectively.
The results show that, in all cases, a greater number of stores were present in the higher OW + Ob quintiles; moreover, a consistent trend was found as the quintile increased (perfect ladder view in Figure 2). It was quite concerning that by 2018, the children of the more prevalent OW + Ob schools could reach more than seven stores by walking for 10 min and at least two stores by walking for only 5 minutes. Another finding of this analysis was that over 3 years, all schools, regardless of their OW + Ob status, faced an increase in the density of convenience stores on their periphery.
Regarding the influence of the proximity of convenience stores and its effect on OW + Ob prevalence, Figure 3 shows a decreasing trend of the mean distance to the nearest store as the prevalence increases for 2015 and 2018; in other words, the schools in which the OW + Ob is greater have, on average, a convenience store nearer than those with lower prevalences (182 m for 2015 and 120 m for 2018). It is also clear that between 2015 and 2018, for all schools, regardless of the OW + Ob level, stores were actually nearer.
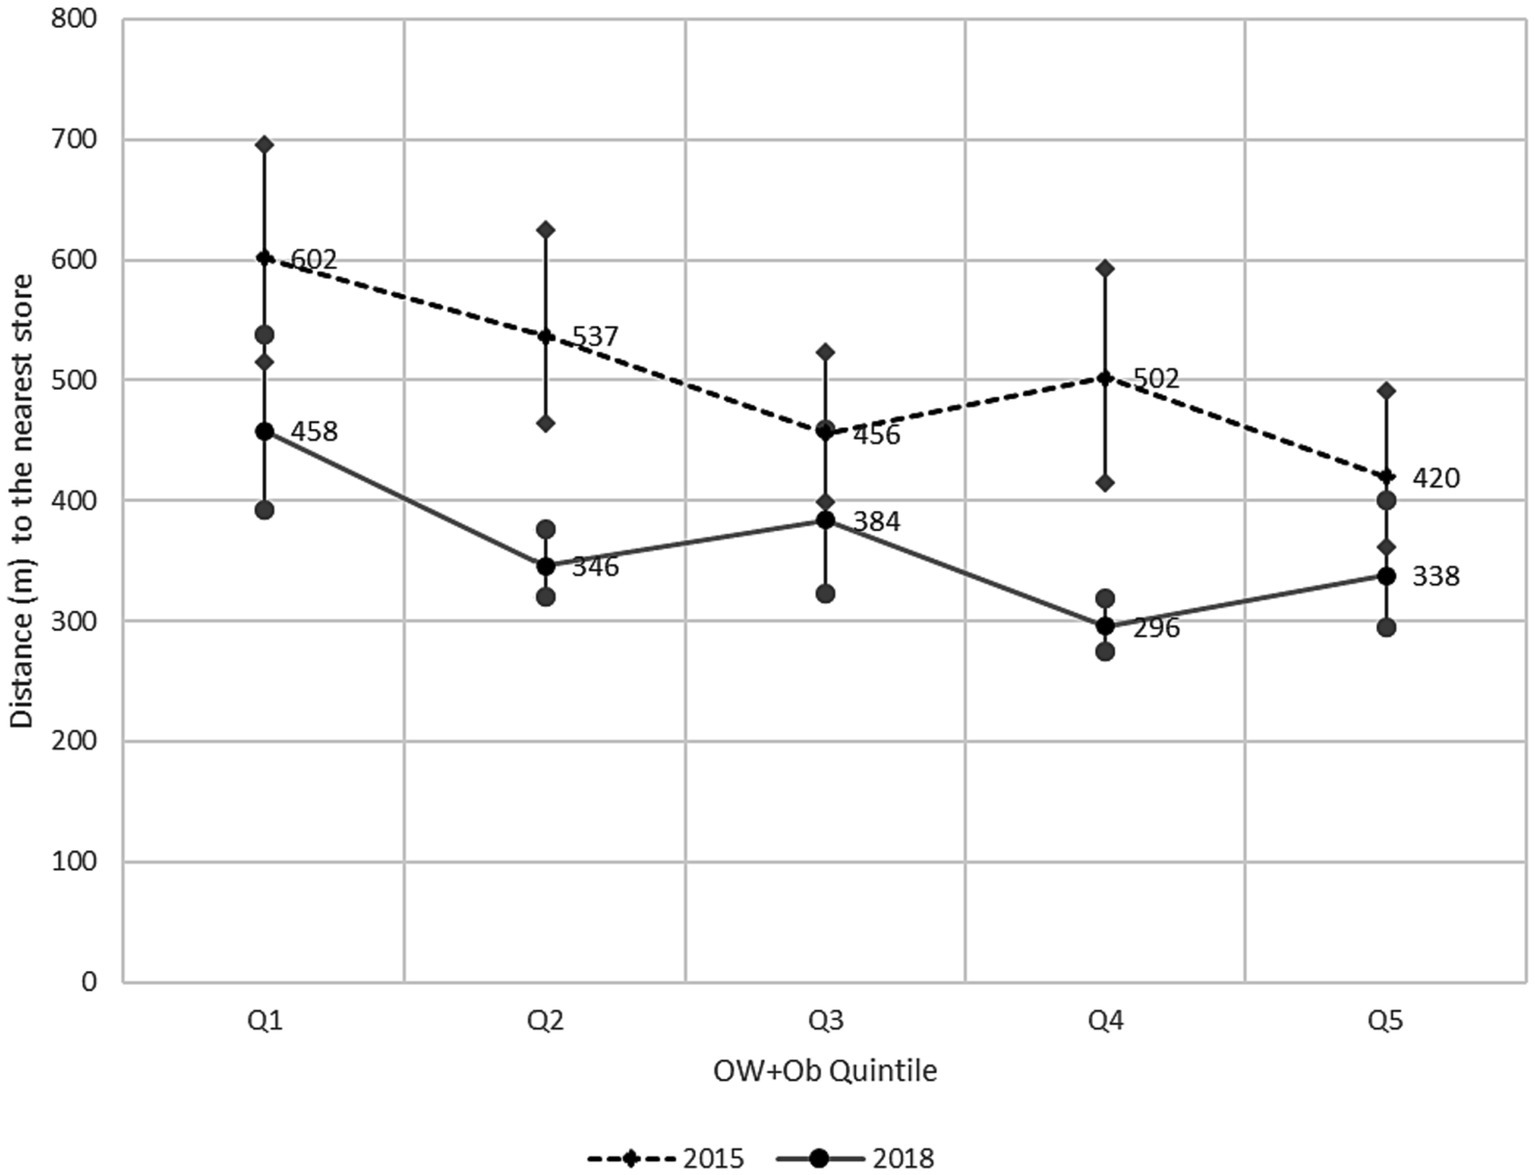
Figure 3. Mean Euclidean distance (m) and 95%CI between schools and the nearest convenience store by OW + Ob quintile, Monterrey Mexico Metropolitan Area 2015–2018.
In this sense, we also found that by 2018, the average distance for the schools with the highest prevalence was only 338 m, but even for those with a lower prevalence, the average distance was 458 m, which indicates that in all cases, convenience stores and their food were near the schools. In this analysis, we confirmed the increase in the number of convenience store trends found in the density computations, which can be seen in Figure 3, in which the line of 2018 is well below the 2015 one, indicating that convenience stores and junk food offerings became nearer and thereby easier and faster to access during this period.
Another way to visualize the relationship between OW + Ob and distance to the nearest store is by plotting the schools as data hotspots using the school-store distance as the X-axis and the OW + Ob prevalence as the Y-axis and making a linear regression of the dataset, which can be seen for both years in Figure 4, where a negative slope of the linear fit can be seen and is confirmed by the negative β (beta) value, indicating that a trend for a lower prevalence of OW + Ob occurs as the schools have their nearest school at a greater distance. When viewing the same data not aggregated in quintiles but as continuous hotspots (Figure 4), one can confirm the cited behavior by inspecting the plot and linear regression negative coefficients that, again, not only confirm but also prove with statistical significance the inverse relationship between the distance to the nearest store and OW + Ob prevalence.
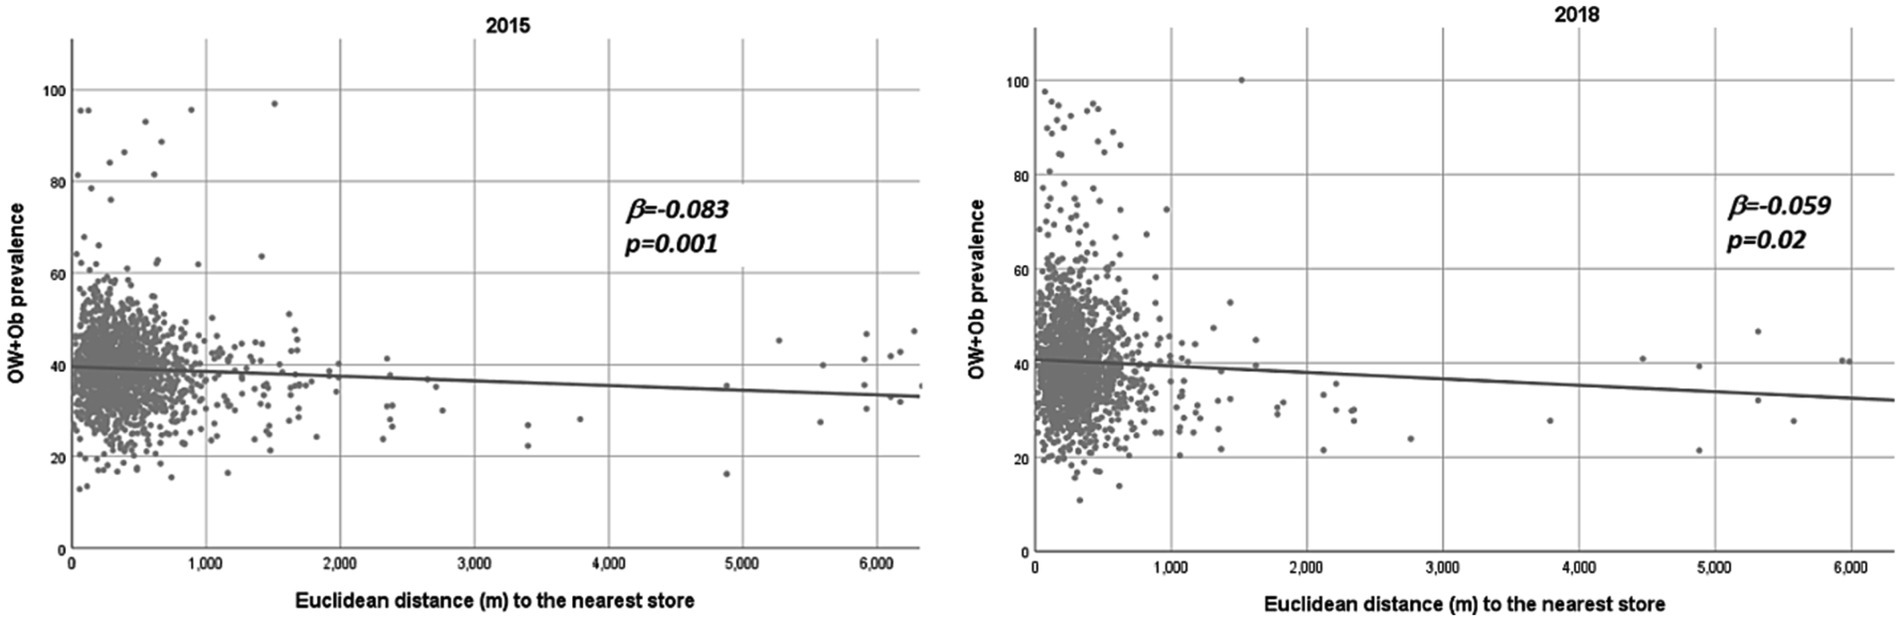
Figure 4. Scatterplot, linear fit, a negative beta value of p of the distance to the nearest convenience store (trimmed to 6 km) vs. OW + Ob prevalence in Monterrey Mexico Metropolitan Area 2015–2018.
Figure 5 shows two maps of the Metropolitan Area of Monterrey for 2015 (Figure 5A) and 2018 (Figure 5B), in which a raster layer in the background corresponding to the kernel density of convenience stores is presented as a white–red color ramp, where the more intense red color represents areas with a high density of stores. Another information layer presented as size-scaled hotspots shows those schools that were detected by the Getis-Ord Gi*algorithm as OW + Ob hotspots; in other words, the schools that presented a much higher prevalence of OW + Ob when compared to their neighbors. Point size indicates the confidence level of the categorization as a hotspot (90, 95, or 99%).
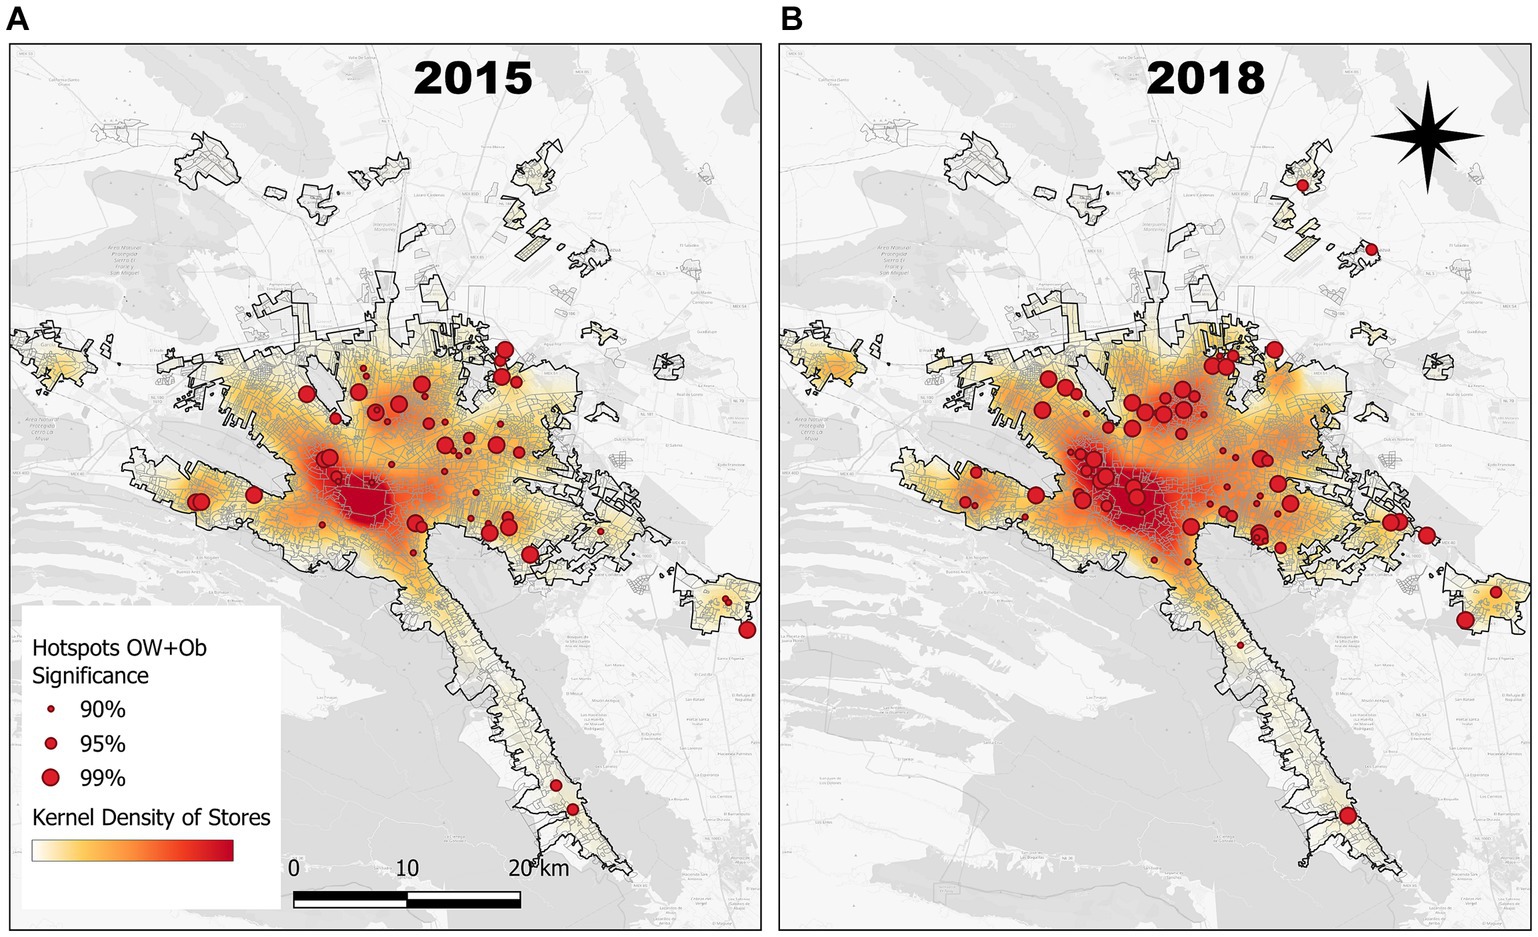
Figure 5. Getis-Ord Gi* Hotspots and significance level of OW + Ob in elementary school children in comparison to kernel density of convenience stores in Monterrey Metropolitan Area, Mexico in (A) 2015 and (B) 2018.
Looking at the maps side by side, it is clear that (regardless of the OW + Ob component) the store density grew from 2015 to 2018; it can be seen that (b) shows a more intense red background in the central area of the city and a slight increase in the periphery when compared to (a), which is a visual confirmation of the findings presented in Table 2. Regarding the hotspots, in (a), there are 63, whereas in (b), this cipher increased to 91, being an important proportion of such hotspots of 95–99% significance. It is also important to point out that in the central area of the city where the store density is greater, an important number of OW + Ob hotspots appeared over 3 years. Overall, the maps displayed a general concordance between the store’s denser areas and the OW + Ob hotspots for both years, but this was more evident for the most recent period.
The store density and OW + Ob Getis-Ord Gi* Hotspots maps allow not only the visualization of the spatial distribution of the two variables but also the changes over time. Focusing on store density, it is clear that they are more abundant in the center of the metropolitan area and that they increased in number between 2015 and 2018 in the same center and also toward the periphery. The maps also show that in the areas of higher store density in the center and north, there are more schools with high OW + Ob, and the presence and significance levels of the hotspots increased between 2015 and 2018. It is also shown, in a more subtle way, that some new hotspots appeared in the periphery and some had an increased significance level.
Monterrey Mexico is a metropolitan area that belongs to the Nuevo León State, where, in the 2022 National Continuous Nutrition Survey, there was an OW + Ob prevalence of 34.2% (39), whereas the National was 37.1% (4). These data are strongly consistent with the prevalences found by us in 2015 and 2018 (Table 1). This region, especially the city, is highly industrialized, and its cultural and social patterns are strongly influenced by its proximity to the United States. One of the results of such an influence can be found in current eating behaviors, which have shifted from traditional food to fast food and energy-dense food (40). This is also where the main chain of convenience stores (OXXO) opened its first business more than 46 years ago (41, 42). This metropolitan area is also the second most populated in the country (43), and all the previous factors make this place suitable for conducting the analyses of the present work.
It is well known that OW + Ob is a complex phenomenon that cannot be reduced to one or only a few factors. However, one of the main questions that could be addressed in this study is whether the stores themselves are the influencing factors for OW + Ob development or whether the mere presence of the stores in some places reflects the intrinsic economic characteristics of the regions inside the metropolitan area, and whether such characteristics are what finally determine or at least have an impact on OW + Ob. To control this issue, as the first step of the study, we calculated the distribution of OW + Ob using an SEI, finding no significative differences between the groups; this led us to discard the idea that inside the Monterrey Metropolitan area, the problem of OW + Ob in the children was determined mainly by socio-economic characteristics.
Approaching the research question from a spatial perspective, the first influencing factor from the stores that were studied was their density around the schools within 400 m and 800 m radii, corresponding to walking times of 5 and 10 min, respectively (32). This was important because we wanted to determine the number of junk/fast food offering hotspots available within those two radii around the schools. In other words, we considered these variables as a measure of the magnitude of this kind of food availability for all children who attended schools.
The other spatial property that we studied in the school–store interactions was nearness, which can be interpreted as the ease of access to junk/fast food by the children. These results are consistent with the density. The use of Euclidean distance constitutes the first approach; however, more sophisticated methods, such as distances over street networks (service areas) could be used in future research.
When viewing both maps side-by-side, it seems that the store presence and the obesity hotspots spread over time, increasing in the center and expanding these phenomena to the edges of the Metropolitan Area. Again, these analyses correspond to the first approach but are susceptible to being enhanced in many ways: updating the data (schools and stores) to more recent sets to confirm the cartographic findings, performing other analyses (i.e., map algebra) using density rasters, and perhaps replicating these same methods in other regions of the country. Although we cannot state that the store density, distance, and location are directly responsible for the OW + Ob condition of children attending school, we found interesting and consistent facts and trends that may point toward this. Although there are few spatial analyses of this issue in Mexico, the obtained results are consistent with those found by Zavala et al. in 2021 (44), but in the case of the present work, on a much larger scale (metropolitan area) and over a lapse of time. Furthermore, these results are consistent with numerous studies on urban areas in developed countries (45, 46).
According to a systematic review by Matsusaki et al. (47), a positive association exists between the nearness of fast food selling hotspots to schools and OW + Ob prevalence in children from Latin, Anglo-Saxon, and Afro-American ethnic groups from different continents, which was observed in all school degrees, but the authors remarked that this could be more important in younger individuals.
Hughey and collaborators (48) proposed a kernel density estimator methodology for an adolescent population to group the obesogenic environment components in the proximity of neighborhoods, such as processed food selling hotspots and fast food restaurants, and, on the other hand, positive elements such as parks and green/recreative areas used for physical activity. The authors recognize all of these places as relevant to the research because of the large amount of time spent by the individuals there.
In a similar study, Buszkiewicz et al. (49) established a relationship between the obesogenic environment and the presence of OW + Ob according to the place of residence. Their main findings agree with our work by showing that at smaller distances between households and junk food selling hotspots, OW + Ob prevalence increases. These results reinforce the idea that variables related to the food environment have an impact on weight gain.
The strengths of this study include its use of a large amount of data (census) on a homogeneous population (school-attending children), which results in robust OW + Ob ciphers, along with consistent and complete spatial information about convenience stores. This, in the context of a metropolitan area that does not have the enormous economic/social inequities present in other regions, allowed for the removal of some of the “noise” and facilitated a focus on the impact of the stores on OW + Ob. On the other hand, the study’s weakness consists of the multifactorial complexity of the problem, which cannot be reduced only to junk food consumption and, thus, the stores’ geographical locations. Another limitation could lie in the simplicity of some of the methods used (buffers and Euclidean distance), which could certainly be improved in future research. Despite the fact that it is not possible to confirm that all of the junk food and sweetened beverages come from convenience stores, it remains a hard fact that the number of such businesses has grown in recent years, reducing the distance of access to ultra-processed foods. This rapid spread of stores could not be explained without having significant sales, and in contrast to the supermarkets that are centralized meeting hotspots, these stores’ strategies consist of “getting nearer” to the customers and readily offering the products.
In conclusion, investigating the relationship between convenience stores and their role in obesity in school-aged children, which is a growing global public health concern, requires an understanding of the potential role of convenience stores in contributing to this problem to support interventions and policies aimed at mitigating its impact, along with the use of spatial analysis, which provides valuable information for public health interventions and urban planning and aids in tailoring interventions to specific geographic areas and formulating policy to promote healthier environments for children to grow and develop in. Considering this, it is important to conduct more research on this topic in Mexico using more recent datasets and more sophisticated methods to identify the precise role and possible negative impacts of convenience stores on the health of the population. It is necessary to promote guidelines that restrict the availability of junk food and sugar-sweetened beverages in schools.
Public policies aimed at effectively coping with this problem must include strategies for dealing with obesogenic environments. This implies limiting the number of convenience stores around schools and, at the same time, promoting the availability of healthy foods.
The raw data supporting the conclusions of this article will be made available by the authors, without undue reservation.
MÁ: Writing – original draft, Investigation, Formal analysis, Conceptualization. TS: Writing – original draft, Supervision, Formal analysis, Conceptualization, Writing – review & editing. MD: Methodology, Data curation, Writing – review & editing. AC: Writing – review & editing, Project administration, Investigation, Conceptualization. AÁ: Writing – review & editing, Project administration, Investigation.
The author(s) declare that no financial support was received for the research, authorship, and/or publication of this article.
The authors declare that the research was conducted in the absence of any commercial or financial relationships that could be construed as a potential conflict of interest.
All claims expressed in this article are solely those of the authors and do not necessarily represent those of their affiliated organizations, or those of the publisher, the editors and the reviewers. Any product that may be evaluated in this article, or claim that may be made by its manufacturer, is not guaranteed or endorsed by the publisher.
1. World Obesity Federation. World obesity atlas (2023). Available at:https://data.worldobesity.org/publications/?cat=19
2. Secretaría de Salud. Declaratoria de emergencia epidemiológica EE-3-2016. Mexico City, Mexico: Secretaría de Salud (2016).
3. Shamah-Levy, T, Cuevas-Nasu, L, Romero-Martínez, M, Gómez-Humaran, IM, Ávila-Arcos, MA, and Rivera, JA. Nutrition status of children, teenagers, and adults from National Health and nutrition surveys in Mexico from 2006 to 2020. Front Nutr. (2021) 8:777246. doi: 10.3389/fnut.2021.777246
4. Shamah-Levy, T, Gaona-Pineda, EB, Cuevas-Nasu, L, Morales-Ruan, C, Valenzuela-Bravo, DG, Méndez-Gómez Humaran, I, et al. Prevalencias de sobrepeso y obesidad en población escolar y adolescente de México. Ensanut Continua 2020-2022. Salud Publica Mex. (2023) 65:s218–24. doi: 10.21149/14762
5. Popkin, BM. Relationship between shifts in food system dynamics and acceleration of the global nutrition transition. Nutr Rev. (2017) 75:73–82. doi: 10.1093/nutrit/nuw064
6. Martins, AP, Levy, RB, Claro, RM, Moubarac, JC, and Monteiro, CA. Increased contribution of ultra-processed food products in the Brazilian diet (1987-2009). Rev Saude Publica. (2013) 47:656–65. doi: 10.1590/S0034-8910.2013047004968
7. PAHO. Ultra-processed food and drink products in Latin America: Trends, impact on obesity, policy implications. Washington, DC: PAHO (2015).
8. Mendonca, RD, Pimenta, AM, Gea, A, de la Fuente-Arrillaga, C, Martinez-Gonzalez, MA, Lopes, AC, et al. Ultraprocessed food consumption and risk of overweight and obesity: the University of Navarra Follow-up (SUN) cohort study. Am J Clin Nutr. (2016) 104:1433–40. doi: 10.3945/ajcn.116.135004
9. Welker, E, Lott, M, and Story, M. The school food environment and obesity prevention: Progress over the last decade. Curr Obes Rep. (2016) 5:145–55. doi: 10.1007/s13679-016-0204-0
10. Neri, D, Steele, EM, Khandpur, N, Cediel, G, Zapata, ME, Rauber, F, et al. Ultraprocessed food consumption and dietary nutrient profiles associated with obesity: a multicountry study of children and adolescents. Obes Rev. (2022) 23:e13387. doi: 10.1111/obr.13387
11. Hernández-Vásquez, A, Bendezú-Quispe, G, Díaz-Seijas, D, Santero, M, Minckas, N, Azañedo, D, et al. Spatial analysis of childhood obesity and overweight in Peru, 2014. Rev Peru Med Exp Salud Publica. (2016) 33:489–97. doi: 10.17843/rpmesp.2016.333.2298
12. Pérez, W, Melgar, P, Garcés, A, de Marquez, AD, Merino, G, and Siu, C. Overweight and obesity of school-age children in El Salvador according to two international systems: a population-based multilevel and spatial analysis. BMC Public Health. (2020) 20:687. doi: 10.1186/s12889-020-08747-w
13. Fraser, LK, Clarke, GP, Cade, JE, and Edwards, KL. Fast food and obesity: a spatial analysis in a large United Kingdom population of children aged 13-15. Am J Prev Med. (2012) 42:e77–85. doi: 10.1016/j.amepre.2012.02.007
14. Hollands, S, Campbell, MK, Gilliland, J, and Sarma, S. A spatial analysis of the association between restaurant density and body mass index in Canadian adults. Prev Med. (2013) 57:258–64. doi: 10.1016/j.ypmed.2013.07.002
15. Huang, H. A spatial analysis of obesity: interaction of urban food environments and racial segregation in Chicago. J Urban Health. (2021) 98:676–86. doi: 10.1007/s11524-021-00553-y
16. Huang, R, Moudon, AV, Cook, AJ, and Drewnowski, A. The spatial clustering of obesity: does the built environment matter? J Hum Nutr Diet. (2015) 28:604–12. doi: 10.1111/jhn.12279
17. Lakes, T, and Burkart, K. Childhood overweight in Berlin: intra-urban differences and underlying influencing factors. Int J Health Geogr. (2016) 15:12. doi: 10.1186/s12942-016-0041-0
18. Vandevijvere, S, Sushil, Z, Exeter, DJ, and Swinburn, B. Obesogenic retail food environments around New Zealand schools: a National Study. Am J Prev Med. (2016) 51:e57–66. doi: 10.1016/j.amepre.2016.03.013
19. Arango-Angarita, A, Méndez-Gómez-Humarán, I, Guerrero-López, CM, and Shamah-Levy, T. Is store density associated with sugar-sweetened beverages consumption and overweight or obesity in Mexican adolescents? Pediatr Obes. (2022) 17:e12838. doi: 10.1111/ijpo.12838
20. Ramírez-Toscano, Y, Pérez-Ferrer, C, Bilal, U, Auchincloss, AH, and Barrientos-Gutierrez, T. Socioeconomic deprivation and changes in the retail food environment of Mexico from 2010 to 2020. Health Place. (2022) 77:102865. doi: 10.1016/j.healthplace.2022.102865
21. Vatanparast, H, Islam, N, Masoodi, H, Shafiee, M, Patil, RP, Smith, J, et al. Time, location and frequency of snack consumption in different age groups of Canadians. Nutr J. (2020) 19:85. doi: 10.1186/s12937-020-00600-5
22. Briefel, RR, Wilson, A, and Gleason, PM. Consumption of low-nutrient, energy-dense foods and beverages at school, home, and other locations among school lunch participants and nonparticipants. J Am Diet Assoc. (2009) 109:S79–90. doi: 10.1016/j.jada.2008.10.064
23. Ávila-Curiel, A, Juárez-Martínez, L, Del Monte-Vega, M, Ávila-Arcos, MA, and Galindo-Gómez, C. Estado de Nutrición en Población Escolar Mexicana que Cursa el Nivel de Primaria. Ciudad de México: Instituto de Ciencias Médicas y Nutrición Salvador Zubirán (2016).
24. Ávila Curiel, A, Galindo Gómez, C, Juárez Martínez, L, García-Guerra, A, Del Monte Vega, MY, Martínez Domínguez, J, et al. Mala nutrición en población escolar mexicana: factores geográficos y escolares asociados. Glob Health Promot. (2021) 29:126–35. doi: 10.1177/17579759211038381
25. Cecchini, SHolz R y Soto de la Rosa H (coords). Caja de herramientas. Promoviendo la igualdad: el aporte de las políticas sociales en América Latina y el Caribe (LC/TS.2021/55). Santiago: Comisión Económica para América Latina y el Caribe (CEPAL) (2021).
26. Instituto Nacional de Estadística Geografía e Informática, Consejo Nacional de Población, Secretaría de desarrollo Agrario Territorial y Urbano. Delimitación de las zonas metropolitanas de México 2015. (2015). Available at:https://www.gob.mx/cms/uploads/attachment/file/344506/1_Preliminares_hasta_V_correcciones_11_de_julio.pdf.
27. de Onis, M. (2016). Valores de referencia de la Organización Mundial de la Salud. Available at:https://ebook.ecog-obesity.eu/es/tablas-crecimiento-composicion-corporal/valores-de-referencia-de-la-organizacion-mundial-de-la-salud/
28. Consejo Nacional de Población. Índice de marginación urbana por colonia (2020) Nota técnico-metodológica 2022. Available at:https://www.gob.mx/cms/uploads/attachment/file/714573/Nota_t_cnica_IMUC_2020.pdf
29. Instituto Nacional de Estadística y Geografía (INEGI). (2017). Directorio Estadístico Nacional de Unidades Económicas DENUE Interactivo, Documento Metodológico 2017. Available at:http://www3.inegi.org.mx/contenidos/temas/economia/empresas/directorio/metodologias/DENUE_metodologia.pdf.
30. QGIS Development Team. QGIS geographic information system. Chicago: Open-Source Geospatial Foundation (2020).
32. Silva, AMCB, da Cunha, JRR, and da Silva, JPC. Estimation of pedestrian walking speeds on footways. Proc Inst Civ Eng. (2014) 167:32–43. doi: 10.1680/muen.12.00048
33. Gandhi, U. (2019). Approximating Geodesic Buffers with PyQGIS. Available at:https://spatialthoughts.com/2019/04/05/geodesic-buffers-in-qgis/.
34. Binder, H. Computer age statistical inference B. Efron T. Hastie. New York, NY: Cambridge University Press (2016).
35. García-Portugués, E.. (2022). Notes for nonparametric statistics version 6.5.2.2022. Available at:https://bookdown.org/egarpor/NP-UC3M/.
36. Scott, DW. Multivariate density estimation: Theory, practice, and visualization. New York: John Wiley & Sons (2015).
37. Environmental Systems Research Institute. Arcgis Desktop 3.03.2.9 ed2023. Redlands, CA: Environmental Systems Research Institute (2023).
38. Getis, A, and Ord, JK. The analysis of spatial association by use of distance statistics. Geogr Anal. (1992) 24:189–206. doi: 10.1111/j.1538-4632.1992.tb00261.x
39. Shamah-Levy, T, Romero-Martínez, M, Barrientos-Gutiérrez, T, Cuevas-Nasu, L, Herrera González, MP, Alejandre-Mora, DA, et al. Encuesta Nacional de Salud y Nutrición Continua 2022 e Indicadores para la primera infancia Resultados de Nuevo León. Cuernavaca, México: Instituto Nacional de Salud Pública (2023).
40. Hutchinson, CA. Los Orígenes de la Industrialización de Monterrey: Una Historia Económica y Social Desde la Caída del Segundo Imperio Hasta el Fin de la Revolución (1867–1920). Am Hist Rev. (1970) 75:1555–6. doi: 10.2307/1844638
41. OXXO. (2024). Blog: la historia de Oxxo. Recuperado el 2 de enero de 2024, de. Available at:https://www.oxxo.com/blog/40-aniversario-de-oxxo
42. Lázaro, JM. Los españoles y la revolución comercial mexicana: las cadenas de supermercados, 1921-2011. Investig Hist Econ. (2012) 8:69–82. doi: 10.1016/j.ihe.2011.08.015
43. SEDATU (2020). Metrópolis de México. Secretaria de Desarrollo agrario, territorial y urbano. Available at:https://sistemas.sedatu.gob.mx/repositorio/s/CCM_BLCKSfGKvIImB2ThOA
44. Zavala, GA, Tenorio-Palos, Y, Campos-Ponce, M, Elton-Puente, JE, López-González, CA, Doak, CM, et al. Proximity and high density of convenience stores was associated with obesity in children of a rural Community of Mexico: using a geographic information system approach. Food Nutr Bull. (2021) 42:490–501. doi: 10.1177/03795721211033146
45. Day, PL, and Pearce, J. Obesity-promoting food environments and the spatial clustering of food outlets around schools. Am J Prev Med. (2011) 40:113–21. doi: 10.1016/j.amepre.2010.10.018
46. Yenerall, J, You, W, and Hill, J. Investigating the spatial dimension of food access. Int J Environ Res Public Health. (2017) 14:866. doi: 10.3390/ijerph14080866
47. Matsuzaki, M, Sánchez, BN, Acosta, ME, Botkin, J, and Sanchez-Vaznaugh, EV. Food environment near schools and body weight-a systematic review of associations by race/ethnicity, gender, grade, and socio-economic factors. Obes Rev. (2020) 21:e12997. doi: 10.1111/obr.12997
48. Morgan Hughey, S, Kaczynski, AT, Porter, DE, Hibbert, J, Turner-McGrievy, G, and Liu, J. Development and testing of a multicomponent obesogenic built environment measure for youth using kernel density estimations. Health Place. (2019) 56:174–83. doi: 10.1016/j.healthplace.2019.01.011
Keywords: childhood obesity, geographic information systems, obesogenic environment, spatial analisis, scholar population
Citation: Ávila Arcos MA, Shamah Levy T, Del Monte Vega MY, Chávez Villasana A and Ávila Curiel A (2024) Convenience stores: an obesogenic promoter in a metropolitan area of northern Mexico? Front. Nutr. 11:1331990. doi: 10.3389/fnut.2024.1331990
Edited by:
Fei Xu, Nanjing Municipal Center for Disease Control and Prevention, ChinaReviewed by:
Luana Lara Rocha, Federal University of Minas Gerais, BrazilCopyright © 2024 Ávila Arcos, Shamah Levy, Del Monte Vega, Chávez Villasana and Ávila Curiel. This is an open-access article distributed under the terms of the Creative Commons Attribution License (CC BY). The use, distribution or reproduction in other forums is permitted, provided the original author(s) and the copyright owner(s) are credited and that the original publication in this journal is cited, in accordance with accepted academic practice. No use, distribution or reproduction is permitted which does not comply with these terms.
*Correspondence: Abelardo Ávila Curiel, YWJlbGFyZG8uYXZpbGFjQGluY21uc3oubXg=
Disclaimer: All claims expressed in this article are solely those of the authors and do not necessarily represent those of their affiliated organizations, or those of the publisher, the editors and the reviewers. Any product that may be evaluated in this article or claim that may be made by its manufacturer is not guaranteed or endorsed by the publisher.
Research integrity at Frontiers
Learn more about the work of our research integrity team to safeguard the quality of each article we publish.