 Ming Zhang1†
 Xi-xiang Shuai
 Tao-tao Dai
- 1South Subtropical Crops Research Institute, China Academy of Tropical Agricultural Sciences, Key Laboratory of Hainan Province for Postharvest Physiology and Technology of Tropical Horticultural Products, Zhanjiang, China
- 2State Key Laboratory of Food Science and Resources, Nanchang University, Nanchang, China
- 3Zhanjiang Experimental Station, China Academy of Tropical Agricultural Sciences, Zhanjiang, China
Amomum villosum Lour. (A. villosum), known as Sharen in China, is widely used for culinary and medicinal purposes due to containing a diverse set of bioactive compounds. In this study, the optimum ethanol extraction process was optimized and the composition and biological activities (antioxidant and antitumor) of five different fractions (dichloromethane, petroleum ether, ethyl acetate, n-butanol and H2O) extracted from the ethanol extract of A. villosum were investigated. The results showed that the optimal extraction conditions were extraction temperature 80°C, extraction time 120 min, ethanol concentration 40% and solid–liquid ratio 1:25 g/mL. Moreover, 35 bioactive compounds were successfully identified by UPLC-ESI-QTOF-MS/MS from five factions for the first time, including 12 phenolic acids and derivatives, 2 organic acids, 12 flavonoids and derivatives, 2 oxylipins and 7 proanthocyanidins. Among them, ethyl acetate fraction (Fr-EtOAc) exhibited the highest content of total phenolic (374.01 mg GAE/g DW) and flavonoid (93.11 mg RE/g DW), where vanillic acid, catechin, epicatechin and protocatechuic acid were the predominant phenolic compounds that accounting for 81.65% of the quantified bioactive compounds. In addition, Fr-EtOAc demonstrated excellent total antioxidant activity (IC50 of DPPH and ABTS assays were 0.23, 0.08 mg/mL, respectively, and FRAP assay was 322.91 mg VCE/100 g DW) and antitumor activity (1,000 μg/mL, 79.04% inhibition rate). The results could provide guidance for the industrial production and application of A. villosum.
1 Introduction
Amomum villosum Lour. (A. villosum), usually called sharen in China, is a member of Zingiberaceae family and is mainly cultivated in Southern China and Southeast Asian countries. The fruit of A. villosum was used for medicine purposes could be traced back to the seventh century, and together with Areca catechu L., Morinda officinalis How. and Alpinia oxyphylla Miq. were called “four southern medicines” (1). Nowadays, the fruit of A. villosum is also widely used as a spice in culinary due to its non-toxic, aromatic smell and biological activities (2). There is no doubt that the medicinal and edible values of A. villosum were related to the chemical ingredients, including volatile oils, non-volatile compounds (phenolics, flavonoids, polysaccharides, et al.) and so on (3).
Currently, lots of research had focused on the volatile oils and polysaccharides from A. villosum and their pharmacological effects. As previously reported, Tang et al. (4) found that A. villosum volatile oil exhibited antibacterial activity by interfering with the metabolism of methicillin-resistant Staphylococcus aureus, and the report described by Liu et al. (5) revealed that A. villosum polysaccharides could reduce gastric mucosal injury by promoting the level of reactive oxygen species and inflammatory factors. Although there were several studies on the biological activities of the water extract of A. villosum, including absorption characteristics (6), weight loss (7), mitigate hyperlipidemia (8), the composition of phenolic compounds from A. villosum was still unclear, which restricted the further utilization of A. villosum.
Phenolic compounds have a wide range of bioactive properties, including antioxidant (9, 10), antitumor (11) and other properties. Meanwhile, an increasing number of reports had proved that biological activities were related to the composition of phenolic compounds (12, 13). Therefore, it was very important to take suitable methods for identifying and quantifying the phenolic compounds in plants. Notably, isolation was an essential procedure to enrich the phenolic compounds. And, fractional extraction, as an efficient isolation method, had been utilized to enrich and isolate the target natural compounds by many researchers (13–15). However, there was no report on the systematic study of phenolic compounds from A. villosum, such as phenolic compounds composition, antioxidant activities and their correlation.
Based on the aforementioned, this study focused on optimizing the extraction conditions of phenolic compounds in the seeds of A. villosum and obtaining five fractions from the ethanol extract by fractional extraction method with five different polarities solvents, and then identifying and quantifying the phenolic compounds composition by UHPLC-ESI-QTOF-MS/MS. Moreover, the antioxidant and antitumor activities were determined and the correlation with phenolic compounds was evaluated by Person correlation analysis. These results could provide guidance for the development and application of A. villosum.
2 Materials and methods
2.1 Materials and reagents
The seeds of A. villosum were collected by a five digonal point sampling method from Yangjiang Amomum planting base (Guangdong Province, China) in August 2022. 20 plants without disease and pest were randomly selected when the fruit was easy to separate from stem and crack and the color of seeds became dark brown. The collected samples were fully mixed, packaged with valve bags and labeled, then taken back to the laboratory. 2,2′-azino-bis (3-ethylbenzothiazoline-6-sulfonic acid) (ABTS), 1,1-diphenyl-2-picrylhydrazyl (DPPH), dulbecco’s modified eagle medium (DMEM), fetal bovine serum (FBS), cell counting kit-8 (CCK8), acetonitrile, quercitrin, vanillic acid, gallic acid, syringic acid, protocatechuic acid, catechin, epicatechin, isorhamnetin, rutin, ferulic acid, caffeic acid, hyperoside, isoqercitrin, protocatechualdehyde, quercetin, p-coumaric acid and 4-hydroxybenzoic acid were purchased from Sigma-Aldrich Co., Ltd. (Shanghai, China). Petroleum ether, dichloromethane, ethyl acetate, n-butanol, sodium carbonate, formic acid and methanol were purchased from Tianjin Fuyu Co., Ltd. (Tianjin, China). All other reagents were analytical grade.
2.2 Preparation and extraction of phenolic compounds from Amomum villosum
The seeds of A. villosum were washed with distilled water and then placed into a hot air dryer (101-A1, Wuxi marit Co., Ltd., Jiangsu, China) at 50°C until constant weight. The dried seeds were ground to powder (particle size less than 50 μm) using a high-speed grinder (HR-10, Zhejiang harui Co. Ltd., Zhejiang, China). The A. villosum powder was taken into extraction vessel and mixed with a defined solid-to-solvent ratio of ethanol solution, and then extracted at the set temperature and time according to the experimental design (Table 1). After extraction, the extract was separated from the solid by centrifuging at 4500 rpm for 15 min, and the supernatant was collected and concentrated to approximate 50 mL at 50°C under vacuum by a rotary evaporator (RE-2000A, Shanghai yarong Co. Ltd., Shanghai). The concentrated solution was diluted to a total volume of 100 mL with distilled water, and successively extracted using petroleum ether, dichloromethane, ethyl acetate and n-butanol at a ratio of 1:1 (v/v), 3 times. And the extract solutions were condensed to 5 mL, and the organic phase and H2O phase extracts were dried by nitrogen blowing concentrator and lyophilizer, respectively. Finally, there were five fractions were prepared from the ethanol extract of A. villosum, including petroleum ether fraction (Fr-PE, 0.47%), dichloromethane fraction (Fr-CH2Cl2, 0.95%), ethyl acetate fraction (Fr-EtOAc, 0.46%), n-butanol fraction (Fr-nBuOH, 1.95%) and H2O fraction (Fr-H2O, 10.30%), and the yields were shown in Table 2. The dried samples were collected and stored at-18°C (in a dark condition) for further investigations. A schematic representation of the experiments carried out in this study was shown in Figure 1.

Table 1. The design of orthogonal test (L9 (34)) and range analysis.

Table 2. The yields of different fractions.
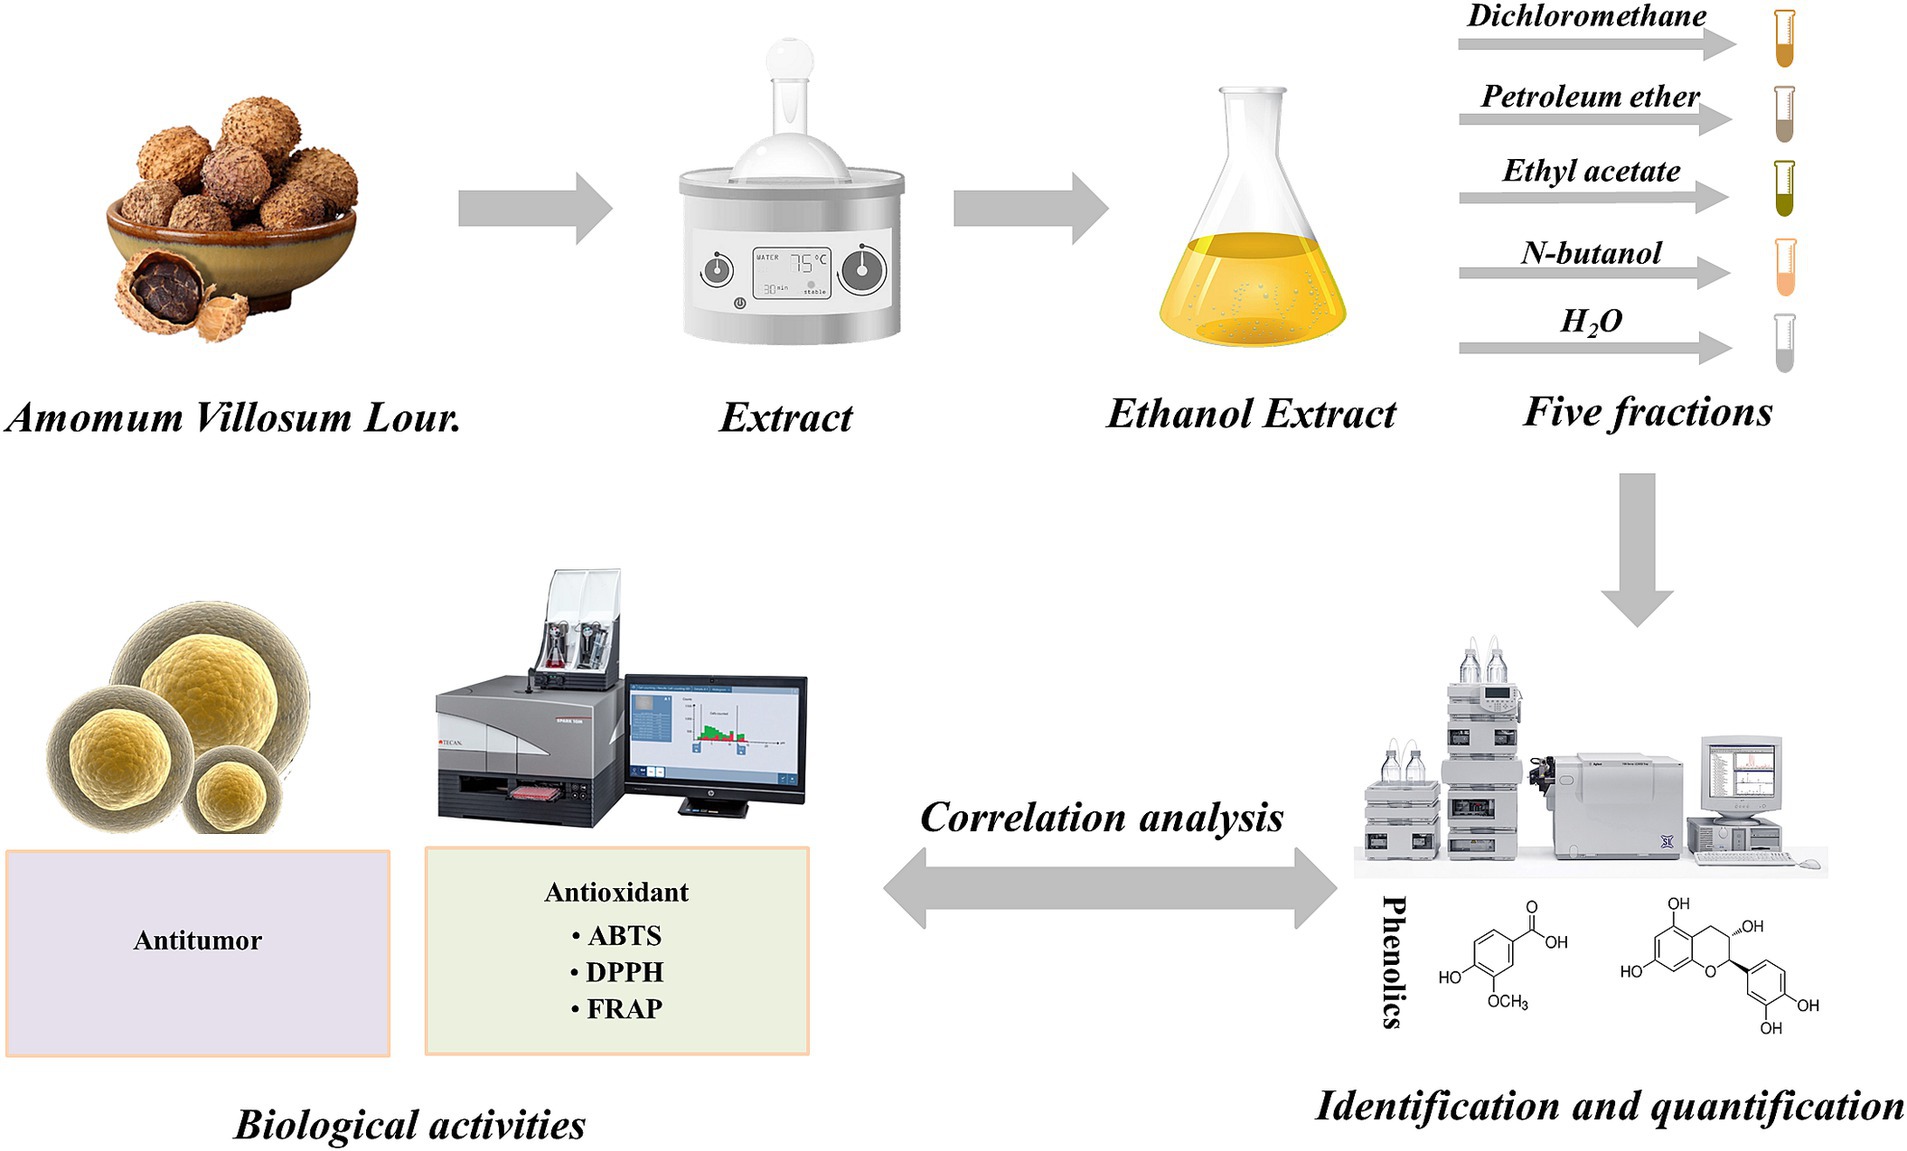
Figure 1. The schematic diagram of the detailed trial protocol of this study.
2.3 Determination of total phenolic content and total flavonoid content
The TPC and TFC of five fractions from A. villosum were evaluated by the Folin–Ciocalteu method (16) and aluminum chloride colorimetric method (17), respectively. The absorbance values of TPC and TFC assays were read at 750 nm and 510 nm by a UV–Vis spectrophotometer (U-T1810, Beijing puxi Co., Ltd., Beijing, China), respectively. Finally, the results of TPC were quantified as mg gallic acid equivalent (GAE) per gram of dried weight (DW) of five fractions (mg GAE/g DW), while the results of TFC were expressed as mg rutin equivalent (RE) per gram of DW of five fractions (mg RE/g DW).
2.4 Antioxidant activities
2.4.1 DPPḤ and ABTS+ free radical scavenging capacities
The DPPḤ and ABTS+ free radical scavenging assays were performed according to the previous reports by Zhou et al. (18) and da Costa et al. (19), respectively. The absorbance values of DPPḤ and ABTS+ free radical scavenging assays were measured at 517 nm and 734 nm using a microplate reader (Bio Tek, United States), respectively. Finally, the DPPḤ or ABTS+ free radical scavenging rate was calculated by the following Equation (1).
where A0 and A1 refer to the absorbance values of the sample and control, respectively. Finally, the DPPḤ and ABTS+ free radical scavenging capacities denoted as IC50, represented the concentration of the sample when the DPPḤ or ABTS+ free radical scavenging rate was 50% which was calculated by the fitting curves.
2.4.2 The ferric ion reducing antioxidant power
The FRAP assay was measured according to the method reported by Pourshoaib et al. (20). The absorbance value was measured at 593 nm and the results of FRAP were expressed as mg vitamin C equivalent (VCE) per 100 grams of DW of five fractions (mg VCE/100 g DW).
2.5 Cytotoxicity and antitumor activity
To determine the cytotoxicity and antitumor activity of five fractions of A. villosum, the human umbilical vein endothelial (HUVE) cells (Shanghai Meixuan Biotechnology Co., Ltd., Shanghai, China) and HeLa cell lines (Beyotime Institute of Biotechnology, Shanghai, China) were used, respectively. The cells were cultured in DMEM basic medium supplemented with 10% (v/v) FBS and 1% (v/v) penicillin–streptomycin at 37°C in an atmosphere with 5% CO2 (21). When the cell confluence reached ~70%, the cells were then further used for the cytotoxicity and antitumor activity assays. In this study, the cytotoxicity and antitumor activity were analyzed by CCK8 assays based on the method described by Pu et al. (22) with slightly modifications. Briefly, the cells were seeded into 96-well plates at a density of 5 × 10⁴ cells/well and allowed to grow at 37°C for 12 h. For determination of the cytotoxicity of five fractions, 10 μL of 100, 500, 1,000 μg/mL of five fractions were added into the wells, respectively, and incubated at 37°C for 48 h followed by 10 μL of CCK8 reagent for 2 h. Subsequently, the absorbance value was measured at 450 nm using a microplate reader (Multiskan FC, Thermo Fisher Scientific, Waltham, MA, United States). For determination of the antitumor activity of five fractions, 100, 200, 400, 600, 800, and 1,000 μg/mL of five fractions were evaluated according to the procedure of cytotoxicity assay. Finally, the results of the cytotoxicity and antitumor activity of five fractions were expressed by cell viability (%) and inhibition rate (%), respectively.
2.6 UHPLC-ESI-QTOF-MS/MS analysis of phenolic compounds
The phenolic compounds in five fractions were identified using a Ultra-High Performance Liquid Chromatography (UHPLC; 1,290 Infinity, Agilent, United States) equipped with ZORBAX Eclipse Plus C18 (100 mm × 2.1 mm, 1.8 μm, Agilent Technologies, Santa Clara, CA) column and Triple TOF™ 5600+ electrospray time-of-flight high resolution mass (AB Sciex, Foster City, CA, United States). The gradient elution of the mobile phase was conducted using solvent A (water) and B (acetonitrile), respectively, and the process was as follows: 0 min, 99% B; 4 min, 95% B; 23 min, 45% B, 26 min, 10% B, 27 min, 10% B, 28 min, 99% B and hold it for 4 min, flow rate = 0.3 mL/min, injection volume = 10 μL, column temperature = 40°C. The UHPLC system was coupled to a quadrupole-time-of-flight orthogonal accelerated Q-TOF mass spectrometer equipped with an electrospray ionization source (ESI) and operating parameters as described by Wang et al. (23). Finally, the composition of phenolic compounds from A. villosum was analyzed by matching the database. The standard compounds, calibration lines and method validations for quantification of phenolic compounds from A. villosum were presented in Table 3. The content of phenolic compounds was expressed as mg of phenolic compounds per gram of DW of five fractions (mg/g DW).
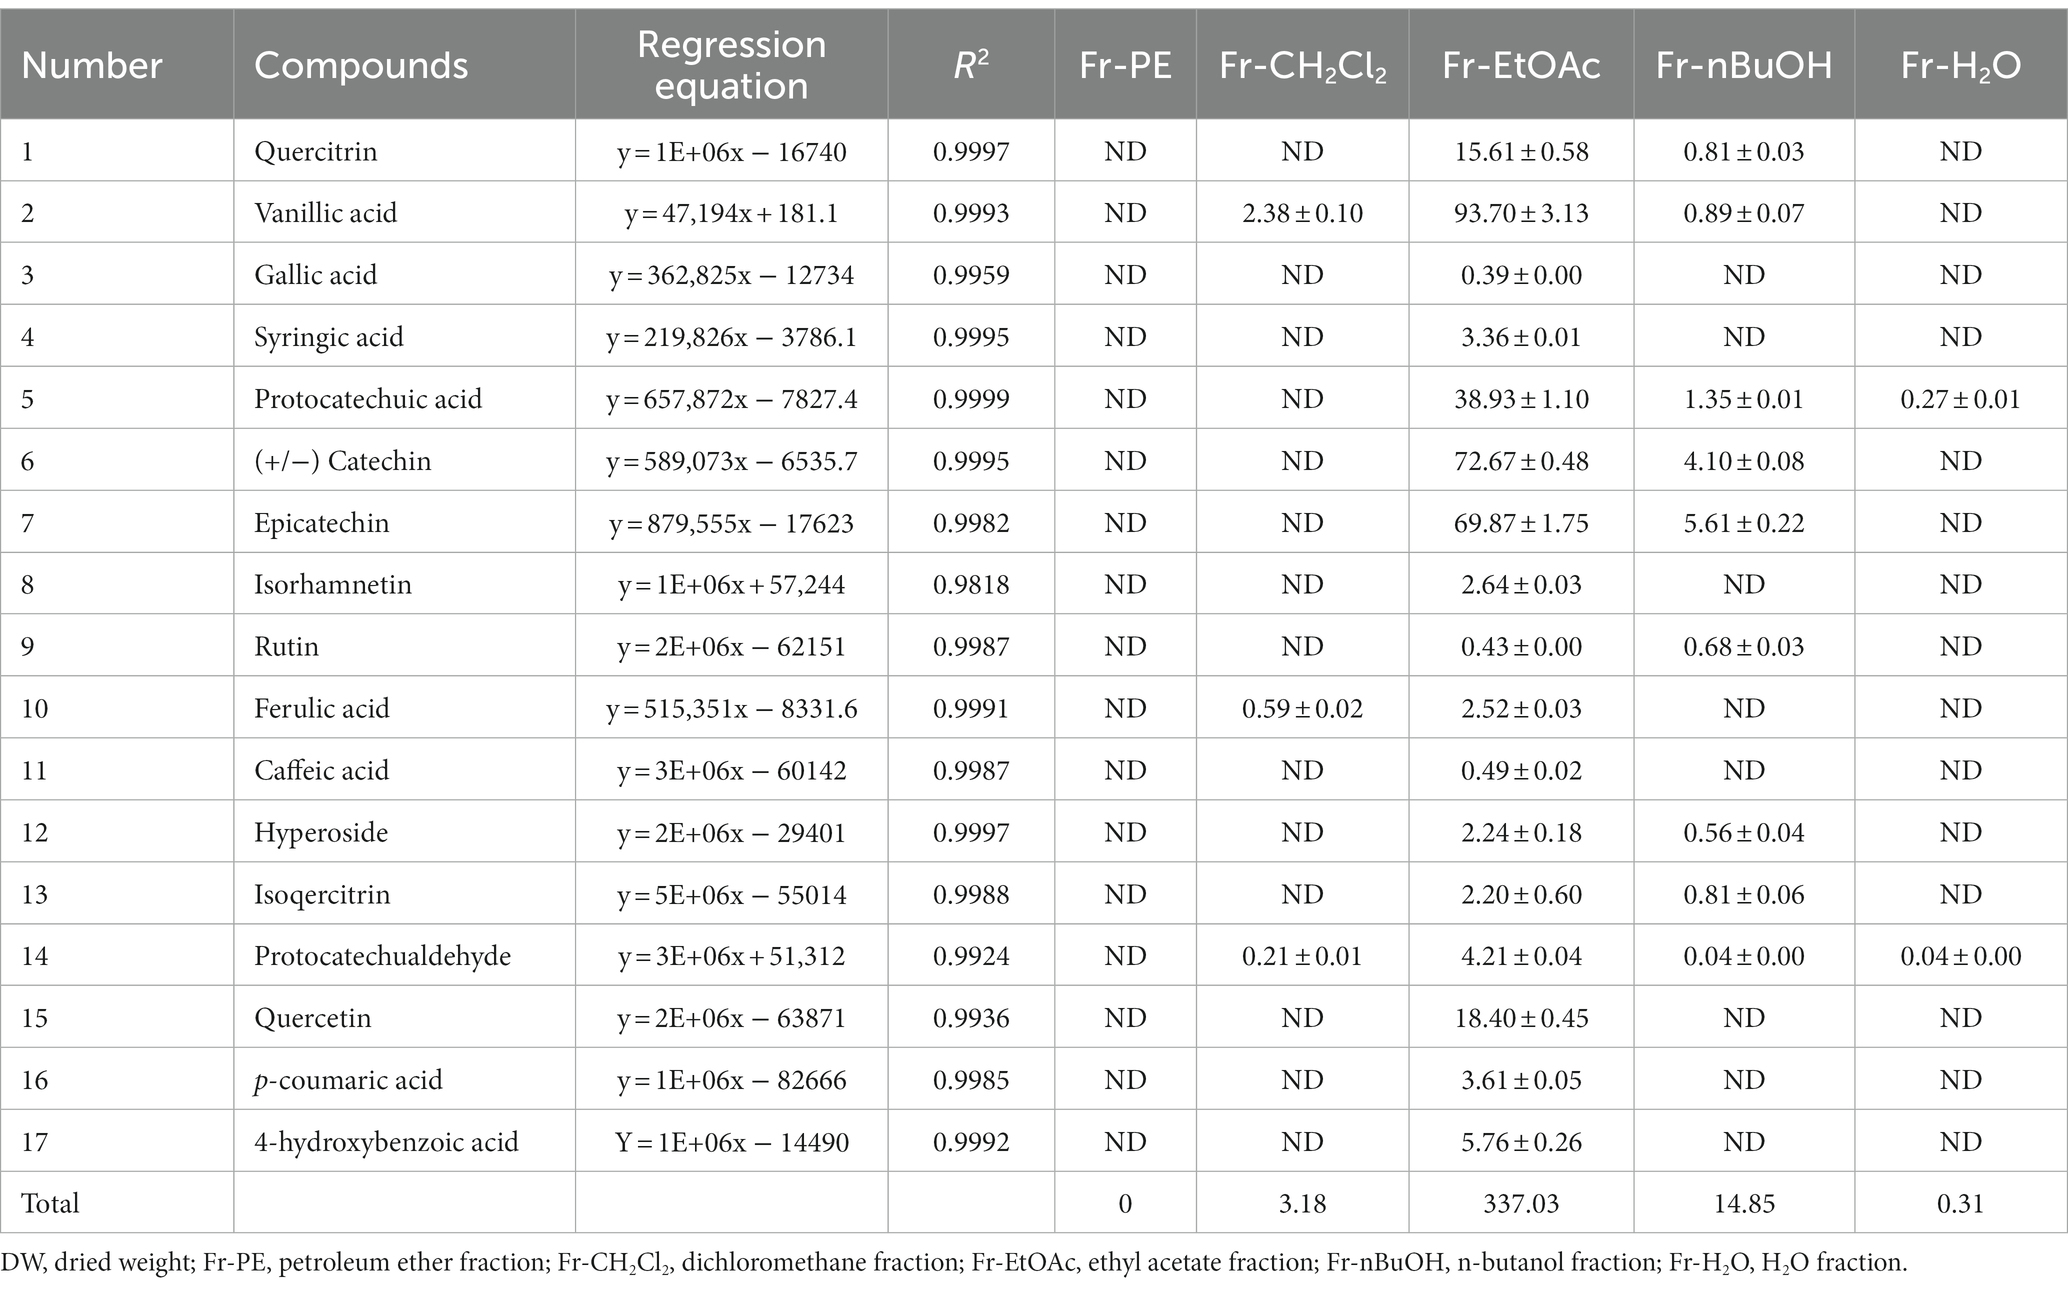
Table 3. Contents of 17 major phenolic compounds in five A. villosum fractions (mg/g DW).
2.7 Statistical analyses
All experiments were conducted in triplicate and all results were shown as mean value ± standard deviation. The analysis of significant differences was performed at p = 0.05 by Duncan’s tests through SPSS Statistic 26.0 (IBM software, United States). The nonlinear polynomial fit of antioxidant activities results and graph drawing were conducted by Origin 9.0 (Origin Lab Co., Northampton, MA, United States).
3 Results and discussion
3.1 The extraction of phenolic compounds from Amomum villosum
The yield of phenolic compounds was affected by many extraction factors, such as extraction time, solvent type and temperature, etc. The single-factor experiments in this study were performed at various solid–liquid ratio (g/mL), ethanol concentration (%), temperature (°C) and time (min). Figure 2 presented the results of four single-factor experiments, and it showed that the TPC value of ethanol concentration, temperature and time experiments exhibited a tendency of increasing first and then decreasing, while the solid–liquid ratio experiment showed an increasing trend first and then stabilizing. Considering the cost, energy consumption and other factors, the optimal extraction conditions for single-factor were obtained from the response of TPC to extraction parameters: extraction temperature of 70°C, extraction time of 120 min, ethanol concentration of 50% and solid–liquid ratio of 1:30 g/mL, respectively.
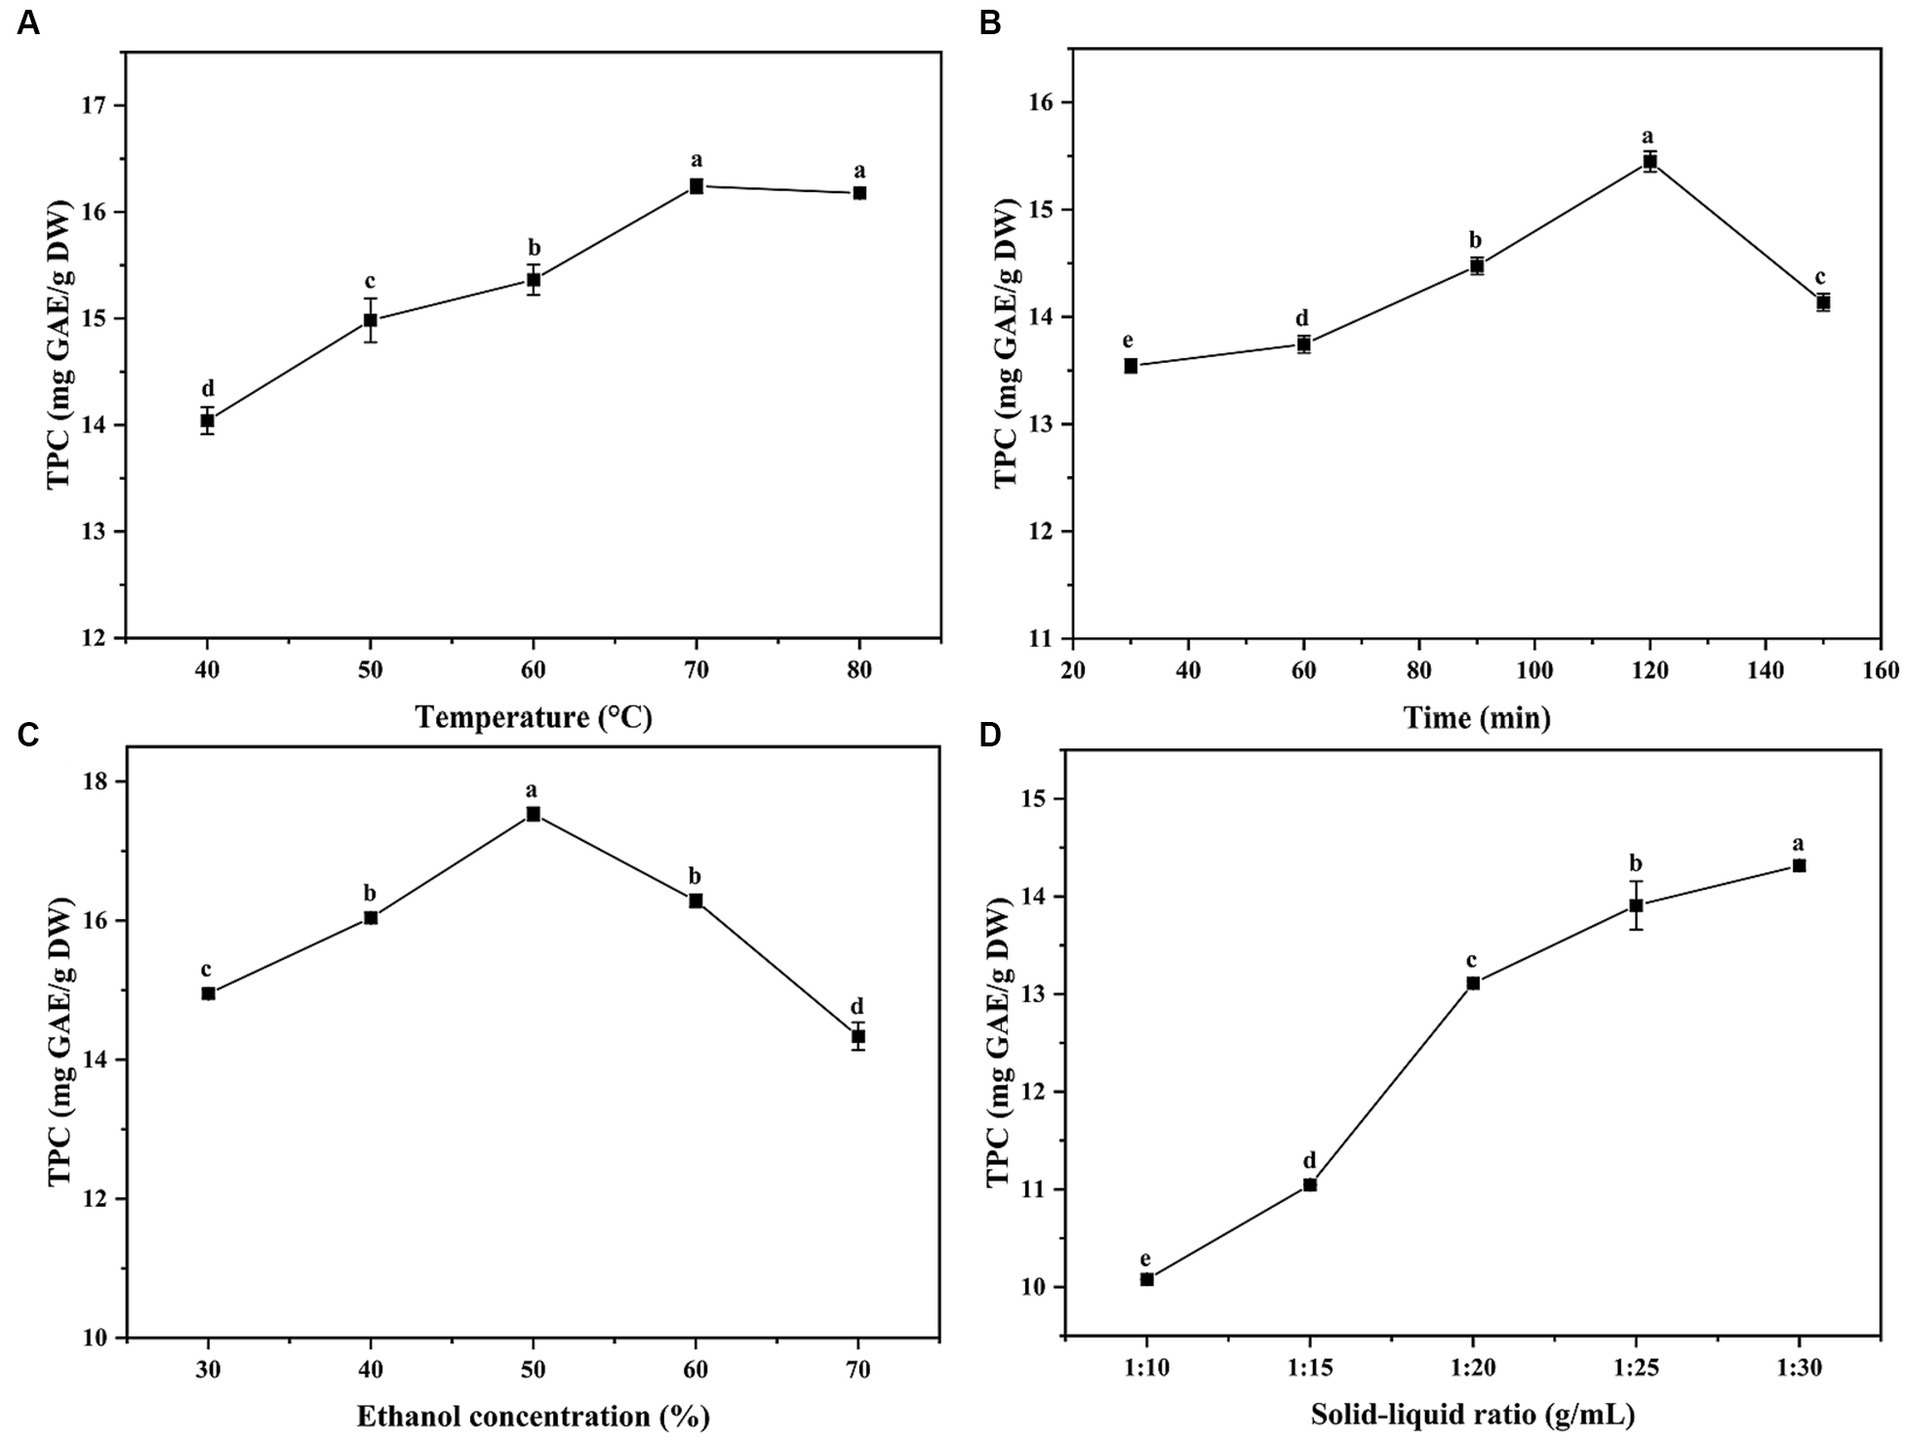
Figure 2. The effects of temperature, time, ethanol concentration and solid-liquid ratio on total phenolic content (TPC). GAE: gallic acid equivalent, DW: dried weight. Superscript letters in each point indicated significant differences between different letters (p < 0.05).
Based on the above results, an orthogonal test (L9 (34)) was employed to optimize the extraction conditions of phenolic compounds in the seeds of A. villosum, and the results were listed in Table 1. It was shown that the TPC values were in a range of 13.75 ± 0.67 mg GAE/g DW to 19.18 ± 0.08 GAE/g DW. Meanwhile, the influence order of four factors was obtained from the range of Table 1 and the F ratio of Table 4: extraction temperature > ethanol concentration > solid–liquid ratio > extraction time. In general, the extraction temperature was related to the mass transfer rate and the TPC increased within a certain temperature range, and the extraction time showed a positive response of TPC within a certain time range. While the excessive solid–liquid rate and ethanol concentration led to more energy consumption. Therefore, considering the ki (i = 1, 2, 3) values from Table 1 and the effect of factors, the optimum extraction conditions of phenolic compounds from A. villosum were as follows: extraction temperature of 80°C, extraction time of 120 min, ethanol concentration of 40% and solid–liquid ratio of 1:25 g/mL. Meanwhile, the TPC value was 19.65 ± 0.13 mg GAE/g DW under the above-optimized extraction conditions, which was 0.47 mg GAE/g DW higher than the highest TPC value (19.18 mg GAE/g DW) of orthogonal test, suggesting that the extraction conditions optimized by orthogonal test were credible.
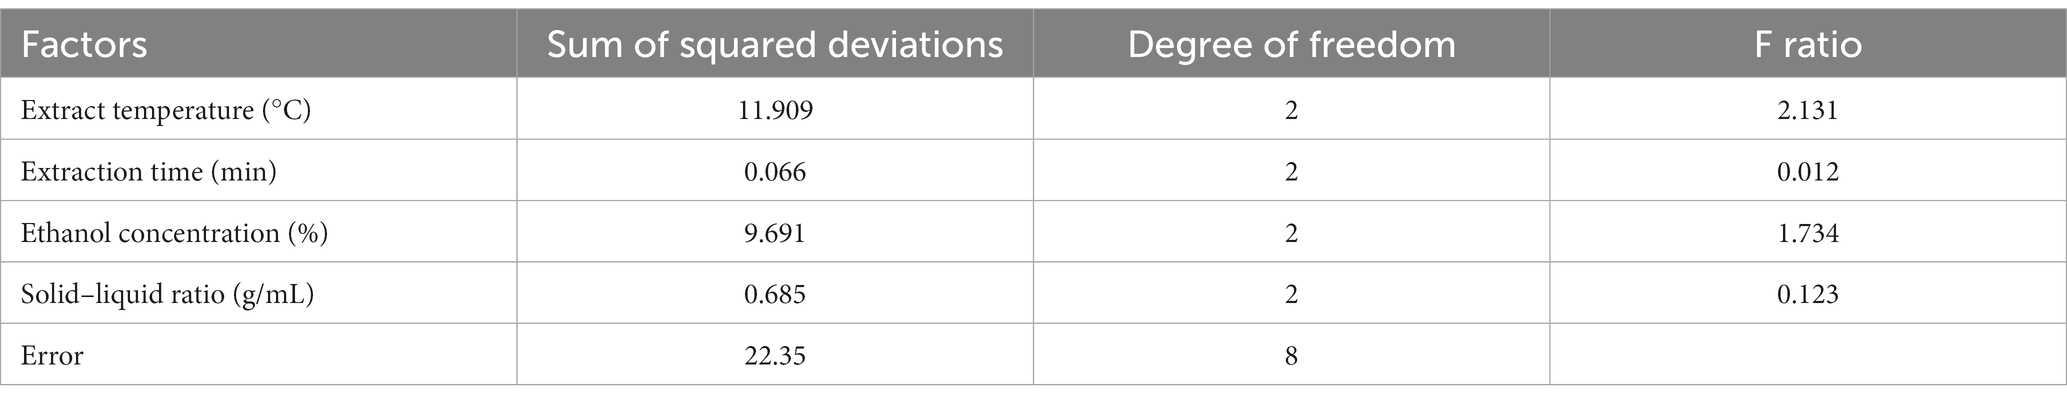
Table 4. The variance analysis of orthogonal test.
3.2 TPC and TFC
Phenolic compounds, as the plant secondary metabolites, their contents are commonly considered to be responsible for biological activities, including antioxidant, antitumor and antibacterial (24, 25). As presented in Figure 3, TPC and TFC values ranged from 2.29 to 374.01 mg GAE/g DW and 0.38 to 93.11 mg RE/g DW, respectively, and significant differences were observed in TPC and TFC values of five fractions (p < 0.05). Among five fractions, the highest TPC and TFC values were found in Fr-EtOAc, while Fr-H2O displayed the lowest, which were consistent with the studies conducted by Fan et al. (13) and Bhardwaj et al. (26) that solvents with too high or too low polarity showed low response for TPC and TFC. Meanwhile, the results were also in line with the fact that water was not effective for the extraction of phenolic compounds (15). Therefore, the higher TPC and TFC values of Fr-EtOAc indicated that extraction solvents with medium polarity were more effective for the extraction of phenolic compounds from A. villosum. However, EtOAc presented a low response for TPC in the study of Dias et al. (27) who evaluated the extraction ability of different solvents for bioactive compounds from C. baccatum fruit, which confirmed the assumption of Herrera-Pool et al. (14) that different species of plants and extraction conditions of phenolic compounds related to the different responses for TPC.
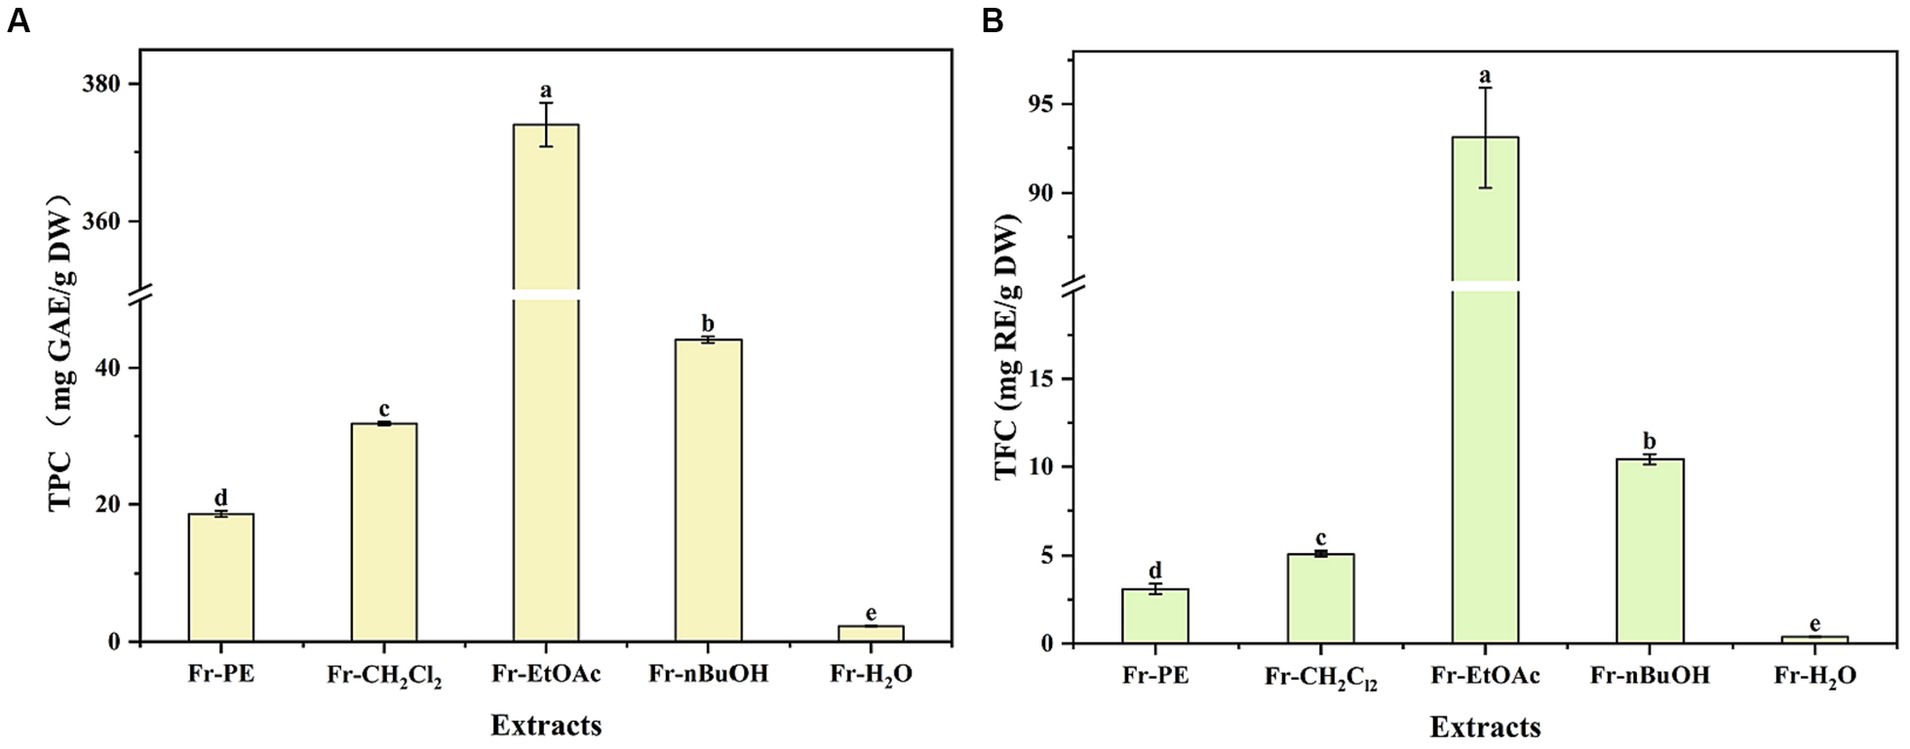
Figure 3. The effects of extraction methods on TPC and TFC of A. villosum TPC: total phenolic content, TFC: total flavonoid content, GAE: gallic acid equivalent, RE: rutin equivalent, DW: dried weight, Fr-PE: petroleum ether fraction, Fr-CH2Cl2: dichloromethane fraction, Fr-EtOAc: ethyl acetate fraction, Fr-nBuOH: n-butanol fraction, Fr-H2O: H2O fraction. Superscript letters in each column indicated significant differences between different letters (p < 0.05).
3.3 Identification of phenolic compounds from Amomum villosum
In this study, the phenolic compounds in five fractions of A. villosum were analyzed by UHPLC-ESI-QTOF-MS/MS according to the method illustrated in Section 2.6. As shown in Table 5 and Figure 4, a total of 35 bioactive compounds in five fractions of A. villosum were successfully verified based on the retention time (RT), fragmentation pattern of MS and MS2 mass spectra, including 12 phenolic acids and derivatives, 2 organic acids, 12 flavonoids and derivatives, 2 oxylipins and 7 proanthocyanidins.
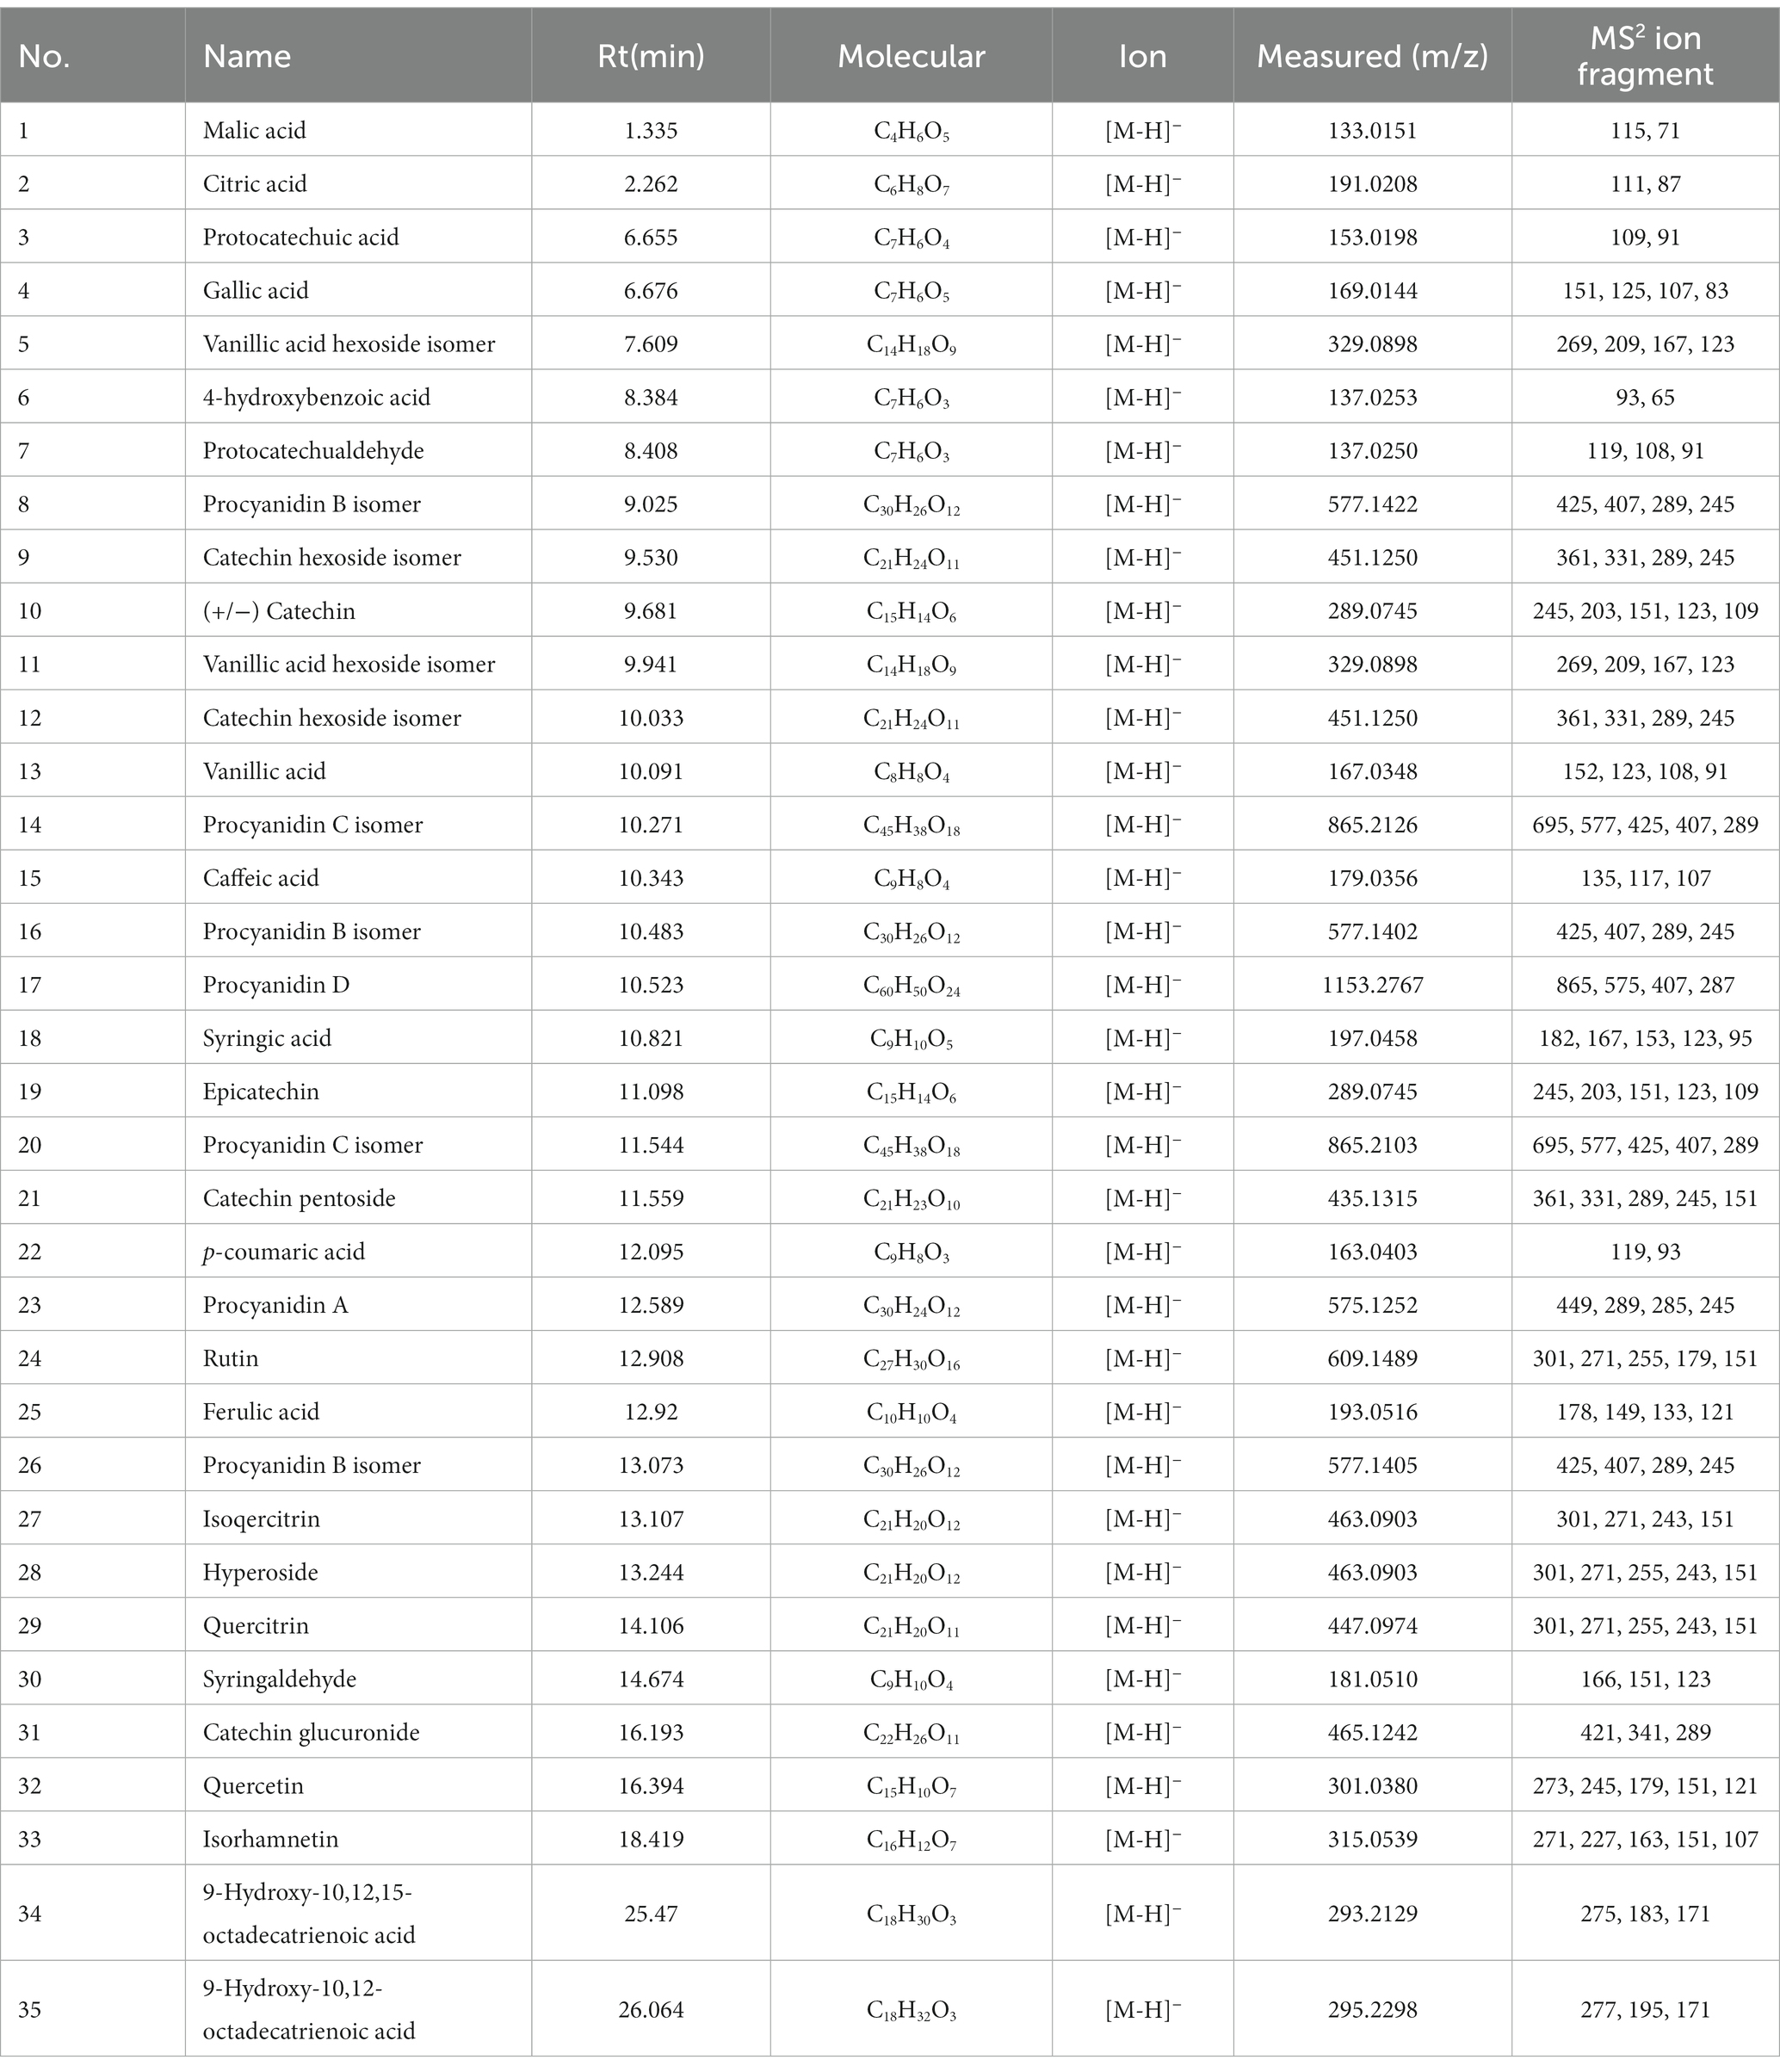
Table 5. The chemical composition identified in A. villosum extracts based on the UPLC-ESI-QTOF-MS/MS analysis.
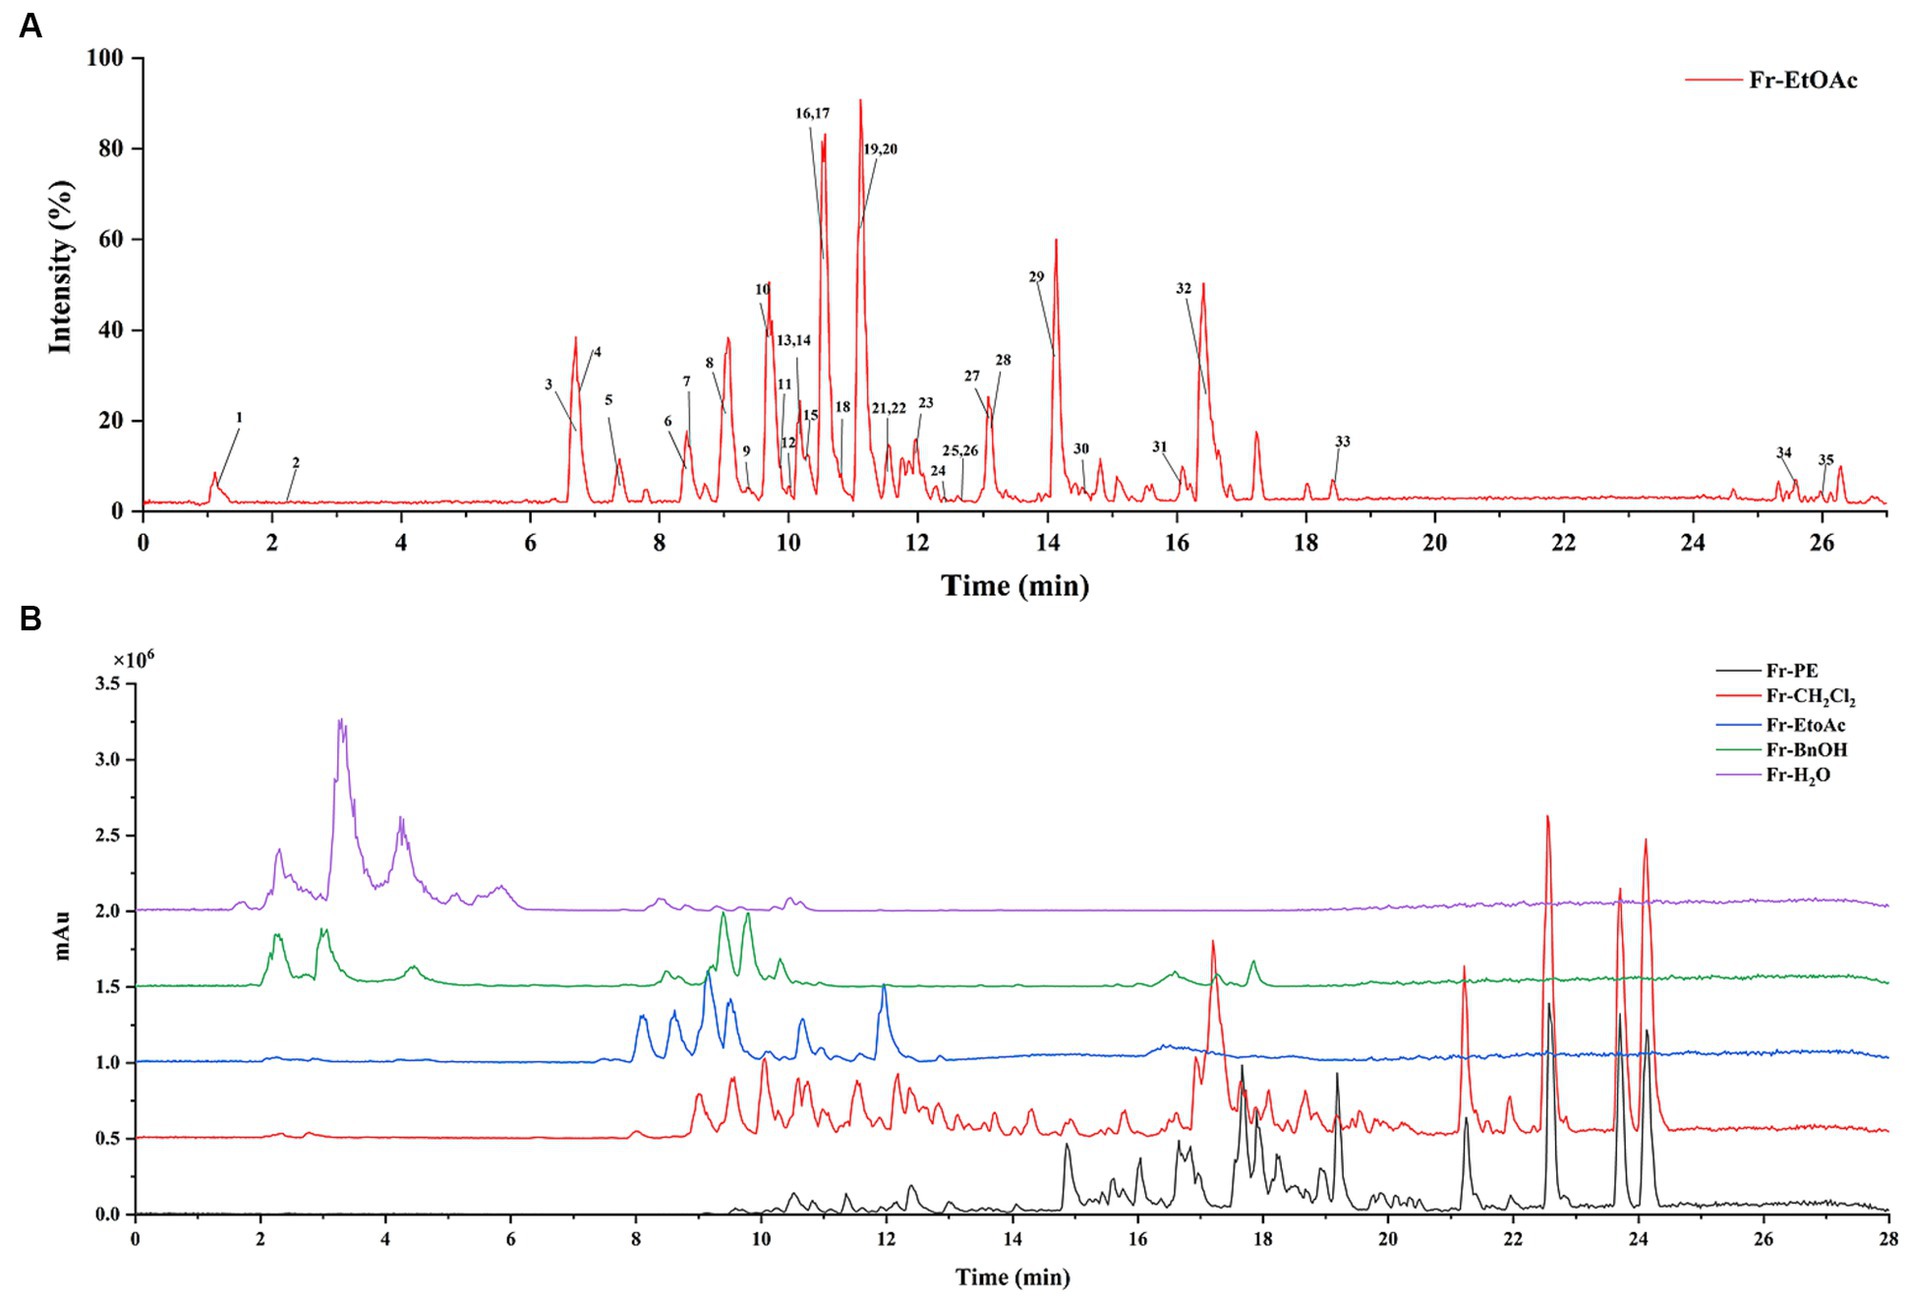
Figure 4. (A) Represented the UHPLC-ESI-QTOF-MS/MS base peak chromatogram for A. villosum extracts. (B) Denoted the DAD spectra of five fractions.
3.3.1 Organic acids
As shown in Figure 4A, peaks 1 and 2 presented characteristic MS2 fragment ions at m/z 115 and 111, respectively, resulting from the loss of a water molecule from malic acid and the absence of a water molecule as well as a CO2 group from citric acid, which had been verified by Oldoni et al. (28). These compounds had also been reported in apple (29), grape (30) and Elaeagnus angustifolia L. flower (31). It is worth noting that malic acid and citric acid are the important intermediates of the tricarboxylic acid cycle, which participate in regulating the metabolism of sugars, fatty acids and amino acids (32). Additionally, the content of organic acids can also be responsible for the organoleptic character, storage and preservation of food.
3.3.2 Phenolic acids and its derivatives
3.3.2.1 Hydroxybenzoic acids
Peaks 3, 4, 6, 13, and 18 showed precursor fragment peaks at m/z 153.0198, 169.0144, 137.0253, 167.0348 and 197.0458 [M-H]−, respectively, and characteristic MS2 fragment ions at m/z 109, 125, 93, 123 and 153 due to the loss of CO2 [M-H-44]−. Compared with the previous literatures, peaks 3, 4 and 6 were identified as protocatechuic acid (33), gallic acid (28) and 4-hydroxybenzoic acid (34). In addition, peak 13 also presented characteristic MS2 fragment ions at m/z 152 [M-H-CH3]− and 108 [M-H-CO2-CH3]−, suggesting peak 13 was vanillic acid according to a previous report in ribes stenocarpum by Jiang et al. (33). The MS2 fragment ions of peak 18 further showed characteristic MS2 fragment ions at m/z 182 and 166, resulting from the loss of- CH3 (15) and -OCH3 (31) in negative ion mode, respectively, in the structures, which presented a characteristic fragmentation behavior of syringic acid (35).
3.3.2.2 Hydroxycinnamic acids
Peak 22 (RT = 12.095 min) showed a deprotonated molecule ion at m/z 163.0403 [M-H]−, which produced a MS2 fragment ion at m/z 119 [M-H-CO2]−, corresponding to the p-coumaric acid as the report by Ali et al. (36). Furthermore, it could be observed that peak 15 presented a characteristic MS2 fragment ion at m/z 135 that indicated the addition of a oxygen atom compared with peak 22, suggesting peak 15 was caffeic acid, which was agreed with the characteristic fragment ions of caffeic acid in adlay bran (34). Moreover, it was inferred that peak 25 was formed by the introduction of -OCH3 into the benzene ring of peak 15 compared with the molecular weight. And peak 25 was further identified based on the MS2 fragment ions at m/z 178 and 149, suggesting the loss of -CH3 and CO2 from the precursor ion at m/z 193.0403 [M-H]− (36), respectively. Thus, peak 25 was identified as ferulic acid.
3.3.2.3 Other phenolic acids derivatives
Peaks 5 (RT = 7.609 min) and 11 (RT = 9.941 min) exhibited the same precursor ion [M-H]− at m/z 329.0898 with the same MS2 fragment ions at m/z 269, 209, 167, 123, suggesting that peaks 5 and 11 were structural isomers. It also could be observed a characteristic MS2 fragment ion at m/z 167 originated from the loss of glucose (162 Da), which corresponded to a glucose linked to a vanillic acid moiety (33). Therefore, peaks 5 and 11 were identified as vanillic acid hexoside isomer. Peak 7 was tentatively identified as protocatechualdehyde via its MS2 fragment ion at m/z 108, resulting from the loss of -CHO from parent ion 137.0250 [M-H]− (37). Peak 30 was characterized as syringaldehyde due to two characteristic MS2 fragment ions at m/z 166 and 151, implying the loss of one or two methyl groups (38).
3.3.3 Flavonoids and its derivatives
3.3.3.1 Flavonols
Peaks 24, 27, and 29 exhibited deprotonated molecule ions at m/z 609.1489, 463.0903 and 447.0974 [M-H]−, which produced the same MS2 fragment ion at m/z 301 (C15H9O7, the same with that of peak 32), indicating the loss of a rutinosyl disaccharide moiety (162 + 146 Da), glucoside group (162 Da) and rhamnose residue (146 Da), respectively. Therefore, peaks 24, 27, 29, and 32 could be easily identified as rutin, isoqercitrin, quercitrin and quercetin, respectively, which corresponded to the previous research (39, 40). According to the report by Zhong et al. (41), peak 28 was characterized as hyperoside due to the same deprotonated ion with peak 27 at m/z 463.0903 [M-H]− and a characteristic MS2 fragment ion at m/z 255. Zhou et al. (42) suggested deprotonated ion at m/z 315.0539 [M-H]− and MS2 fragment ion at m/z 151 as characteristic fragment ions in the identification of isorhamnetin in ginkgo biloba fallen leaves, providing the tentative analysis of peak 33.
3.3.3.2 Flavanols
Peaks 10 and 19 presented the same parent ion at m/z 289.0745 [M-H]− with different retention times, which gave MS2 fragment ions at m/z 245 [M-H-CO2]− and 109 [M-H-C9H8O4]−, indicating that both peaks were isomers, corresponding to catechin and epicatechin as report by Liu et al. (43) who investigated the phenolic compounds in the internal fruit septum of walnuts.
3.3.3.3 Other flavonoid derivatives
Peaks 9 and 12 exhibited the same deprotonated molecule ion at m/z 451.1250 [M-H]− and the entire same MS2 fragment ions at m/z 361, 331, 289 and 245, leading to the fact that peaks 9 and 12 were isomers. Furthermore, the characteristic MS2 fragment ions at m/z 245 and 109, suggesting the loss of CO2 and C9H8O4, respectively from parent ion, indicating peaks 9 and 12 were catechin and epicatechin (43). Peak 21 was characterized as a catechin-pentoside isomer, owing to the precursor ion at m/z 435.1315 [M-H]− (C21H23O10), and MS2 fragment ions at m/z 331 and 289, indicating the addition of a pentose to catechin (44). Peak 31, with parent ion at m/z 465.1242 [M-H]−, was identified as catechin glucuronide, and it was further confirmed by the MS2 fragment ion at m/z 421 [M-H-CO2]− and 289 (catechin) (44).
3.3.4 Procyanidins
Procyanidins are formed by the polymerization of different amounts of catechin or epicatechin. Obviously, the fragment ions of procyanidins contain the parent ions of catechin or epicatechin. In this study, peak 23 was speculated to be procyanidin A, owing to the precursor ion at m/z 575.1252 [M-H]− (C30H24O12), and MS2 fragment ion at m/z 289 assigned to catechin (45). Moreover, peaks 8, 16 and 26 exhibited the same parent ion at m/z 577.1349 [M-H]− (C30H26O12) and base peak fragment ions at m/z 425, 407, 289 and 245, suggesting that the three peaks should be isomers of procyanidin B (9), respectively. Peaks 14 and 20 were characterized as procyanidin C due to the parent ion at m/z 865.2103 [M-H]− presented a characteristic fragmentation behavior of procyanidin C at m/z 695, 577, 425, 407 and 289 (43). Piątczak et al. (46) suggested that parent ion at m/z 1153.2767 [M-H]− and the characteristic MS2 fragment ions at m/z 865, 575 and 287 demonstrated the existence of monomer dimeric and trimeric of catechin and its multiple, respectively. Thus, peak 17 was identified as procyanidin D.
3.3.5 Oxylipins
Peak 34 presented a precursor ion at 293.2129 [M-H]− and MS2 fragment ions at 275, 183 (C11H19O2) and 171 (C9H16O3), indicating the breakage occurred at C9-C10 bond, and suggesting the absence of a C=C bond at C1-C9 and the presence of two or three C=C bonds on C10-C18. And then it was speculated as 9-hydroxy-10,12,15-octadecatrienoic acid (47). Analogously, peak 35 (295.2298 [M-H]−, C18H32O3) with diagnostic MS2 fragment ions at m/z 277,195 and 171 and was proposed as 9-hydroxy-10,12-octadecadienoic acid (47).
3.4 Quantification of phenolic compounds in five Amomum villosum fractions
In the present work, phenolic compounds in five A. villosum fractions were quantified using an UHPLC-ESI-QTOF-MS/MS. As shown in Figure 4B, a total of 17 major phenolic compounds from A. villosum were successfully quantified, including quercitrin, vanillic acid, gallic acid, syringic acid, protocatechuic acid, catechin, epicatechin, isorhamnetin, rutin, ferulic acid, caffeic acid, hyperoside, isoquercitrin, protocatechualdehyde, quercetin, p-coumaric acid and 4-hydroxybenzoic acid, which was very essential to identify the phenolic compounds composition for the further utilization of A. villosum.
As depicted in Table 3, the highest phenolic compound content was found in Fr-EtOAc (337.03 mg/g DW), followed by Fr-nBuOH (14.85 mg/g DW), Fr-CH2Cl2 (3.18 mg/g DW), Fr-H2O (0.31 mg/g DW) and Fr-PE, which were consistent with the results of TPC and TFC (Figure 3). Interestingly, Fr-EtOAc contained all of the 17 quantified phenolic compounds, while only 9, 3 and 2 kinds of the quantified phenolic compounds were found in Fr-nBuOH, Fr-CH2Cl2 and Fr-H2O, respectively. Interestingly, Fr-EtOAc contained all of the 17 quantified phenolic compounds, while only 9, 3 and 2 kinds of the quantified phenolic compounds were found in Fr-nBuOH, Fr-CH2Cl2 and Fr-H2O, respectively. Strangely, among the 17 quantified phenolic compounds, no phenolic compounds were determined in Fr-PE. On one hand, low TPC and TFC of Fr-PE (Figure 3) were responsible for the results. On the other hand, it might be due to the polarity difference between quantified phenolic compounds and the mobile phase of UHPLC, resulting in the poor solubility of target phenolic compounds in the mobile phase.
For individual phenolic compounds, mostly individual phenolic compound contents (except rutin) of Fr-EtOAc were higher than the other four fractions. Meanwhile, the predominant phenolic compounds in Fr-EtOAc were vanillic acid (93.70 mg/g DW), catechin (72.67 mg/g DW), epicatechin (69.87 mg/g DW) and protocatechuic acid (38.93 mg/g DW), accounting for 81.65% of 17 phenolic compounds. In other words, Fr-EtOAc was rich in phenolic compounds with hydroxybenzoic acids and flavonols as major phenolic compounds. Similar results were also found in the report by Fan et al. (13) who found that catechin and epicatechin were the predominant phenolic compounds in Fr-EtOAc of A. tsaoko. Although some reports confirmed that the water extract of A. villosum had many biological activities (7, 8), there was not much research on the composition of phenolic compounds from A. villosum. And this is the first time to report the composition of phenolic compounds from the seeds of A. villosum. Additionally, the quantitative results confirmed that Fr-EtOAc was the best fraction for the further utilization of phenolic compounds from A. villosum.
3.5 Antioxidant activities
It was well known that each evaluation method of antioxidant activity has its particularities. Therefore, the ABTS, DPPH and FRAP assays (48, 49) were used to evaluate the antioxidant activities of phenolic compounds in five fractions of A. villosum. It was noted that the results of ABTS and DPPH assays were expressed by IC50 values in this study, which represented the concentration of phenolic compounds when the scavenging rate of ABTS+ or DPPḤ free radicals was 50%. Thus, the lower IC50 value indicates stronger free radicals scavenging capacities and antioxidant activities. Meanwhile, the VCE was used to express the FRAP value, which was positively correlated with the antioxidant activities.
As shown in Figure 5, the antioxidant activities of five fractions were 0.23–7.67 mg/mL, 0.08–2.11 mg/mL and 0.84–322.91 mg VCE/100 g DW for DPPH, ABTS and FRAP assays, respectively. Thus, five fractions exhibited a significant difference in antioxidant activities, and the Fr-EtOAc displayed the highest scavenging capacities of ABTS+ and DPPH∙ free radicals and reducing ability of Fe3+, followed by Fr-nBuOH and Fr-CH2Cl2, which agreed with the results of TPC and TFC (Figure 3). Similar findings had also been reported by Clodoveo et al. (50) who evaluated the antioxidant activities of phenolic compounds in sweet cherry pulp. Meanwhile, the ABTS+ and DPPH∙ free radicals scavenging capacities of five fractions were lower than vitamin C, but Fr-EtOAc and Fr-nBuOH exhibited excellent antioxidant activities with low IC50 values of DPPH (0.23, 0.38 mg/mL) and ABTS (0.08, 0.16 mg/mL) assays. Additionally, the IC50 value (DPPH) of Fr-EtOAc was lower than cascara (0.43 mg/mL) (51) and Piper chaba stem methanolic extract (0.31 mg/mL) (52). Previously, phenolic compounds could act through different antioxidant mechanisms to scavenge free radicals and reduce the high valence ions to lower valence ions (53). Furthermore, the extract of medicinal plants was also reported to remove oxidant precursors to reduce or prevent oxidative damage (54). However, the extract of the seeds of A. villosum was a complex mixture, and it was necessary to further explore the specific phenolic compounds that played an important role in the antioxidant activities by correlation analysis.
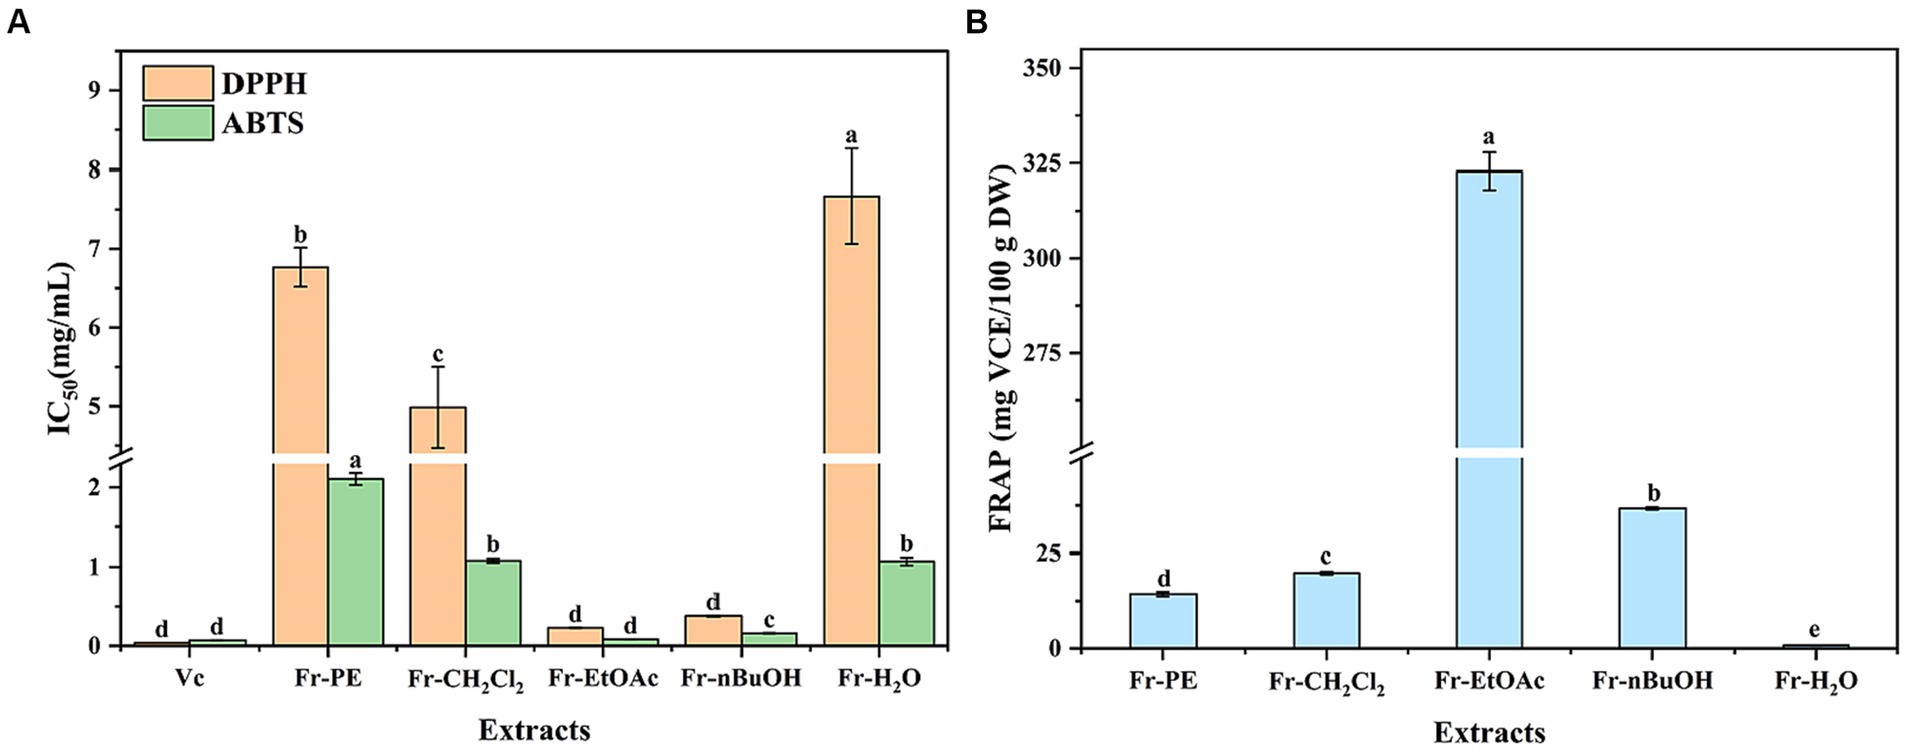
Figure 5. The effects of extraction methods on antioxidant activities of five fractions (Fr-PE: petroleum ether fraction, Fr-CH2Cl2: dichloromethane fraction, Fr-EtOAc, ethyl acetate fraction, Fr-nBuOH, n-butanol fraction, Fr-H2O, H2O: H2O fraction) of A. villosum, including 1,1-Dipheyl-2-picryl-hydrazyl (DPPH) and 2,2′-azinobis (3-ethylbenzothiazoline-6-sulphonic acid) (ABTS) free radical scavenging capacity and ferric ion reducing antioxidant power (FRAP). VCE, vitamin C equivalent, DW: dried weight. Superscript letters in each column indicated significant differences between different letters (p < 0.05).
3.6 Cytotoxicity and antitumor activity
Amomum villosum, as a medicinal and edible plant in China, can display various biological activities, including antitumor activity. Firstly, the cytotoxicity of five fractions was evaluated by measuring the cell viability of HUVE cells using a CCK8 assay. This assay is based on an analysis of the mitochondrial activity of the cells. The CCK8 assay is more sensitive than the MTT assay, which is also often used to ascertain cell viability (55). As depicted in Figure 6A, the cell viability of the HUVE cells was greater than 90% when treated with 100, 500 and 1,000 μg/mL of five fractions, respectively, indicating that these concentrations would not be considered to be cytotoxic (56). As a result, 100–1,000 μg/mL of five fractions were used in subsequent experiments because they did not promote cytotoxicity.
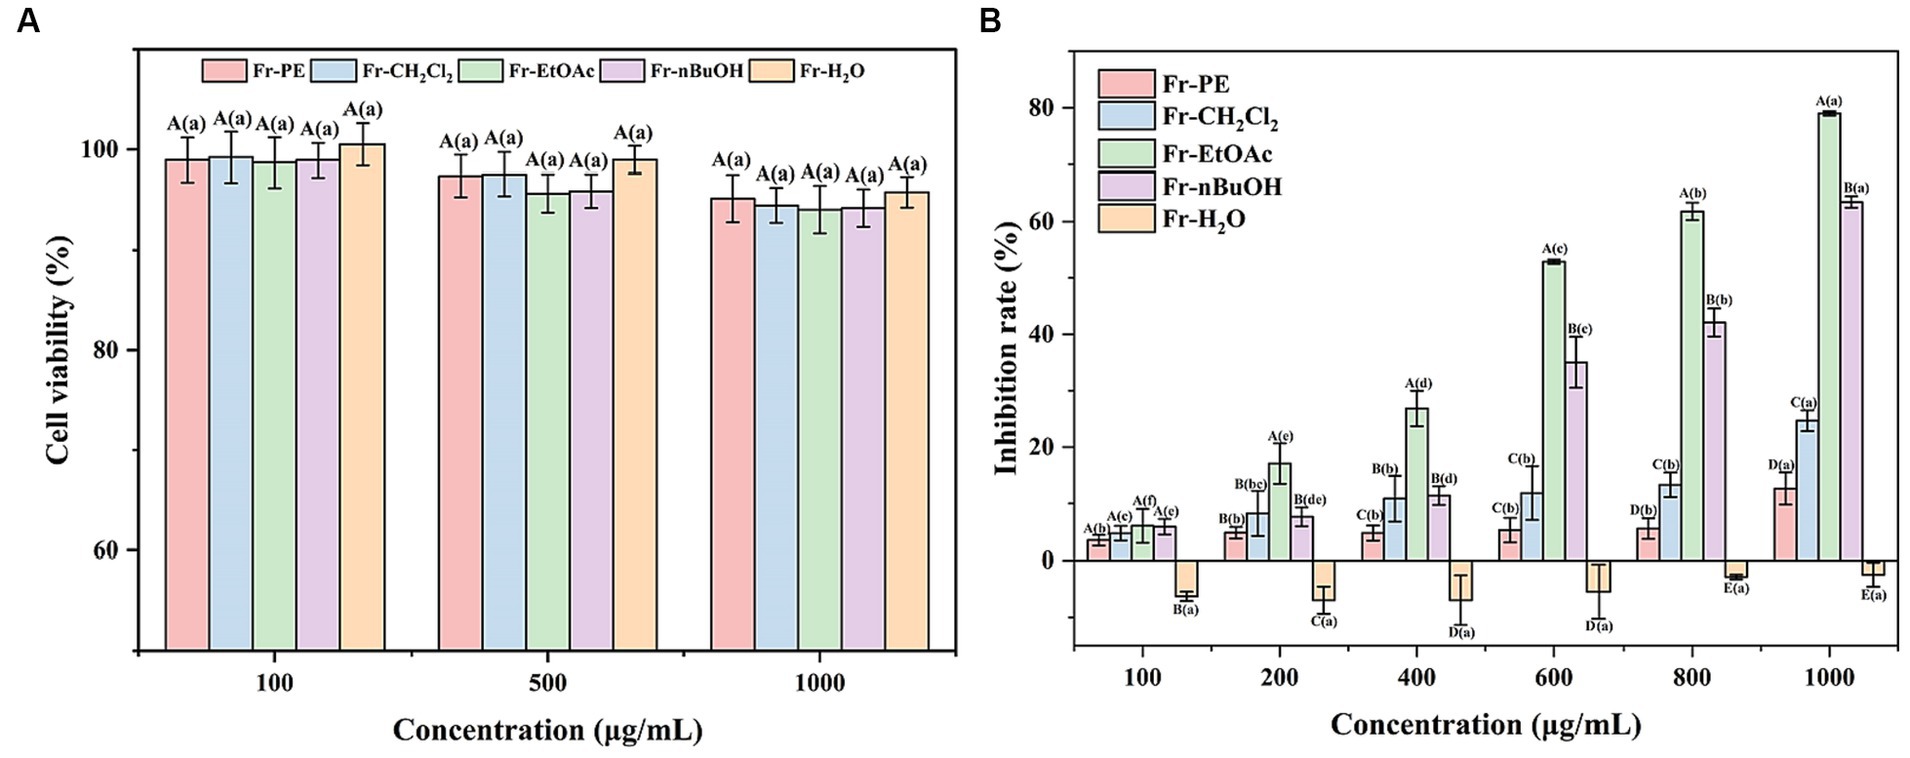
Figure 6. (A) Represented the effects of five fractions of A. villosum on the human umbilical vein endothelial cells viability. (B) Denoted the antitumor activities of five fractions of A. villosum. Superscript letters in each column indicated significant differences between different letters (p < 0.05). Fr-PE, petroleum ether fraction; Fr-CH2Cl2, dichloromethane fraction; Fr-EtOAc, ethyl acetate fraction; Fr-nBuOH, n-butanol fraction; Fr-H2O, H2O fraction. Capital letters represented the significant differences between different samples at the same concentration (p < 0.05). Lowercase letters denoted the significant differences at different concentrations of the same sample (p < 0.05).
Subsequently, CCK8 method was further employed to evaluate the effect of five fractions on HeLa cells proliferation at concentrations of 100–1,000 μg/mL, and the results were shown in Figure 6B. The results showed that the inhibition of five fractions on the proliferation of HeLa cells was in a dose-dependent manner (100–1,000 μg/mL). Meanwhile, it was also observed that Fr-EtOAc exhibited the highest inhibition rate, followed by Fr-nBuOH, Fr-CH2Cl2, Fr-PE and Fr-H2O, which fitted well the trends of TPC and TFC values (Figure 3) and antioxidant activities (Figure 5). Moreover, the Fr-H2O had no inhibitory effect on the proliferation of HeLa cells at the test concentration (100–1,000 μg/mL).
Excitingly, in the present work, Figure 6B depicted that the inhibition rates of Fr-EtOAc and Fr-nBuOH on HeLa cells increased sharply from 6.02 to 79.04% and 5.86 to 63.45%, respectively, when the concentration increased from 100 μg/mL to 1,000 μg/mL. However, Fr-CH2Cl2 and Fr-PE displayed a slightly inhibitory effect on HeLa cells proliferation. Additionally, a previous study had also shown that ethanol extract of Euphorbia lathyris exhibited good antitumor activity at low concentrations (57). Therefore, the phenolic constituents of the extract may be responsible for the antitumor activity. Meanwhile, Pu et al. (58) demonstrated that ferulic acid, chlorogenic acid, caffeic acid and feruloysinapic acid in jackfruit pulp provided a significant positive contribution to the antitumor effect. Overall, the results provided foundation support for the further development of novel antitumor drugs.
3.7 Correlation analysis
Correlation analysis has been proved to be a useful method to evaluate the correlation between individual compounds and bioactivities, which is very important to the further utilization of biological components. In this study, the correlation analysis between individual phenolic compounds and antioxidant activities (ABTS, DPPH, FRAP) was depicted in Figure 7. Intuitively, DPPH and ABTS presented a negative correlation with TPC, TFC and 17 individual phenolic compounds, while FRAP had a positive correlation with them, resulting from the results of DPPH and ABTS assays were expressed by IC50 values (Section 3.5). Specifically, TPC and TFC were extremely significantly (p < 0.01) positive correlated with FRAP and showed a negative correlation with DPPH (r = −0.67, −0.67, respectively) and ABTS (r = −0.63, −0.62, respectively). And these results also confirmed the fact that Fr-EtOAc had the highest antioxidant activities due to the highest TPC and TFC. Furthermore, it was observed that FRAP depicted extremely significant (p < 0.01) positive correlated with 16 individual compounds (except rutin), while DPPH was significantly (p < 0.05) negative correlated with rutin. Similar results were also reported by Clodoveo et al. (50) who evaluated the correlation between phenolic compounds from sweet cherry pulp and antioxidant activities (DPPH and ABTS assays). And the results of the present work demonstrated and confirmed the speculations of several recent researches on some unique phenolic compounds that contributed to higher antioxidant activities (59, 60).
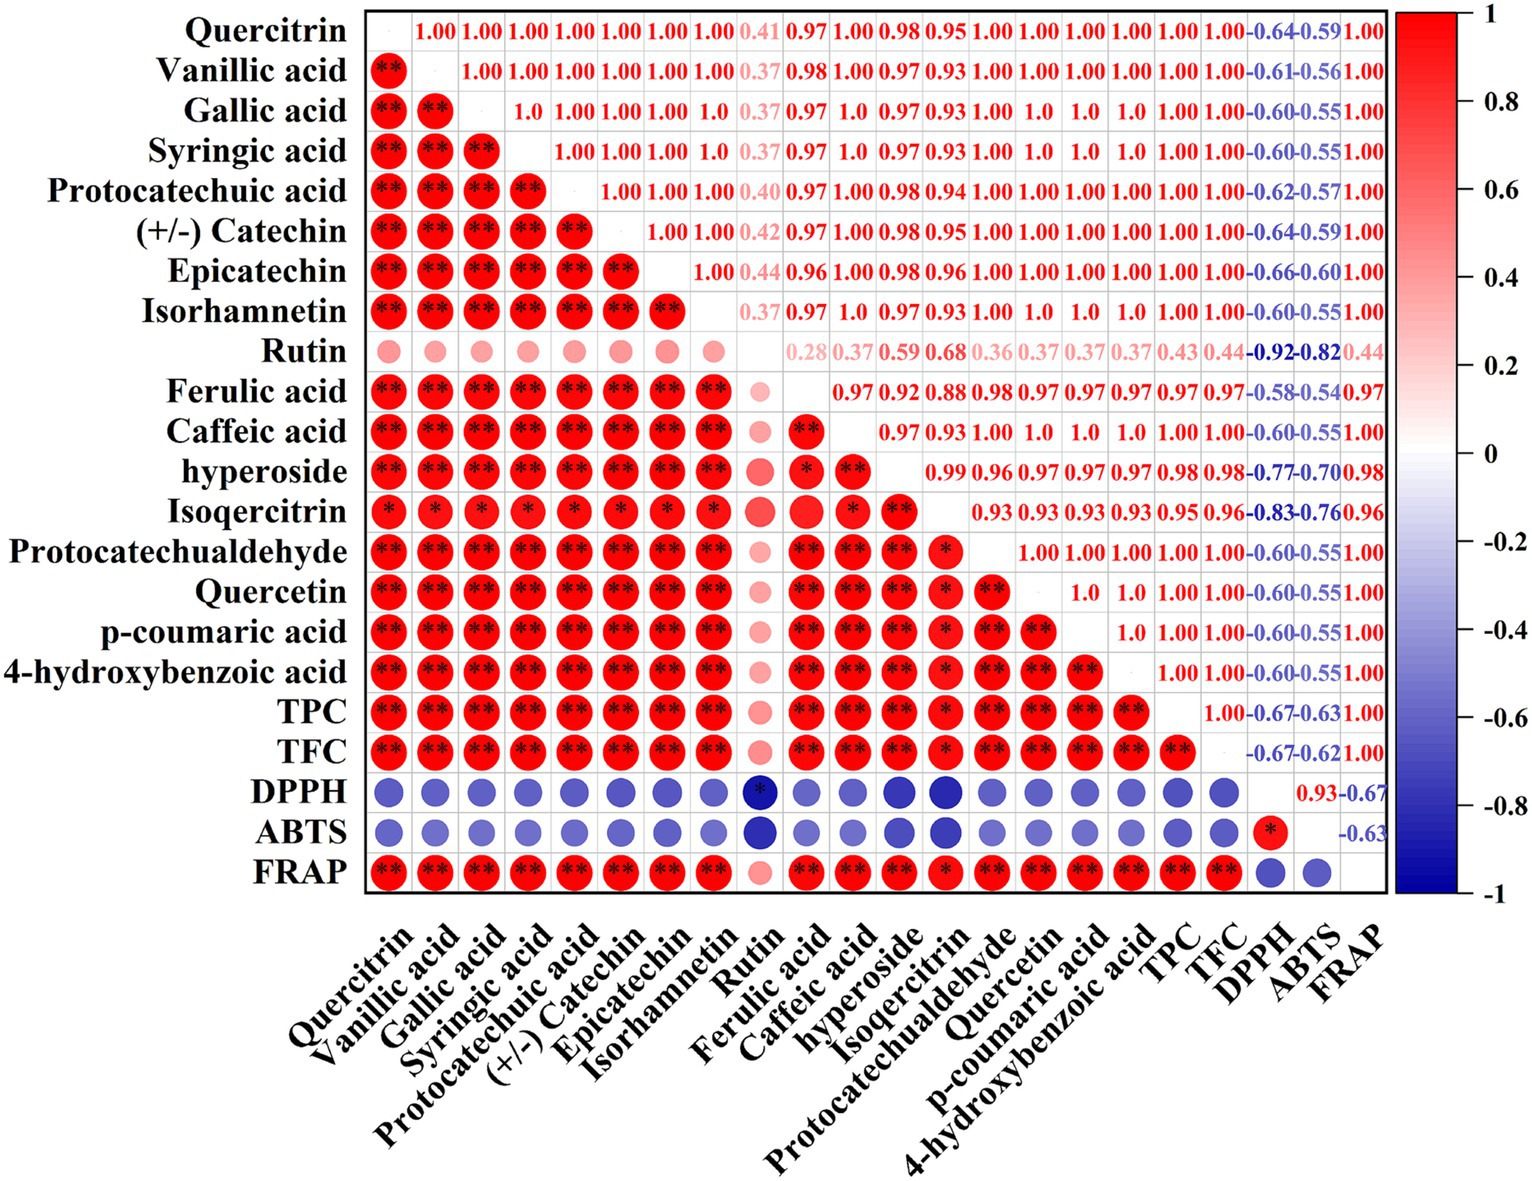
Figure 7. Correlation between the phenolic compounds, TPC, TFC, DPPH, ABTS, and FRAP. TPC, total phenolic content; TFC, total flavonoid content; DPPH, 1,1-Dipheyl-2-picryl-hydrazyl free radical scavenging capacity; ABTS, 2,2′-azinobis (3-ethylbenzothiazoline-6-sulphonic acid) free radical scavenging capacity; FRAP, ferric ion reducing antioxidant power. Red indicated a positive correlation, blue indicated a negative correlation, and the color intensity is proportional to the correlation coefficient. *, correlation is significant at p < 0.05, **, correlation is extremely significant at p < 0.01.
4 Conclusion
In this work, five fractions were obtained from ethanol extract of the seeds of A. villosum by fractional extraction method, and the identification, quantification and biological activities (antioxidant and antitumor) of bioactive compounds in five fractions were evaluated. This study was the first report on the composition of phenolic compounds from the seeds of A. villosum. And the results revealed that the seeds of A. villosum were rich in phenolic compounds, mainly including vanillic acid, catechin, epicatechin, protocatechuic acid, quercetin and quercitrin. Meanwhile, the extract of the seeds of A. villosum represented excellent antioxidant and antitumor activities, which confirmed the fact that A. villosum had the potential to be an antitumor drug or antioxidant. However, further research is required to be conducted to better understand the antioxidant and antitumor mechanisms.
Data availability statement
The original contributions presented in the study are included in the article/supplementary materials, further inquiries can be directed to the corresponding authors.
Ethics statement
Ethical approval was not required for the studies on humans in accordance with the local legislation and institutional requirements because only commercially available established cell lines were used. Ethical approval was not required for the studies on animals in accordance with the local legislation and institutional requirements because only commercially available established cell lines were used.
Author contributions
MZ: Data curation, Methodology, Writing – original draft. X-xS: Methodology, Writing – review & editing. ZW: Software, Writing – original draft. T-tD: Visualization, Writing – review & editing. C-bW: Writing-review & editing, Data curation, Investigation. YL: Validation, Writing – review & editing. J-jH: Resources, Writing – review & editing. L-qD: Conceptualization, Funding acquisition, Project administration, Writing – review & editing.
Funding
The author(s) declare financial support was received for the research, authorship, and/or publication of this article. This research was funded by the Hainan Provincial Natural Science Foundation of China (No. 322QN376), the Open Competition Program of Top Ten Critical Priorities of Agricultural Science and Technology Innovation for the 14th Five-Year Plan of Guangdong Province (No. 2022SDZG07), and the Key realm R&D Program of Guangdong Province (No. 2020B020221001).
Acknowledgments
We thank the South Subtropical Crop Research Institute, China Academy of Tropical Agricultural Sciences, and Key Laboratory of Hainan Province for Postharvest Physiology and Technology of Tropical Horticultural Products (Zhanjiang), and State Key Laboratory of Food Science and Resources, Nanchang University, for their expert technical assistance.
Conflict of interest
The authors declare that the research was conducted in the absence of any commercial or financial relationships that could be construed as a potential conflict of interest.
The reviewer EG declared a past co-authorship with the author TD to the handling editor.
Publisher’s note
All claims expressed in this article are solely those of the authors and do not necessarily represent those of their affiliated organizations, or those of the publisher, the editors and the reviewers. Any product that may be evaluated in this article, or claim that may be made by its manufacturer, is not guaranteed or endorsed by the publisher.
References
1. Gao, CF, Zhu, M, Xu, W, Wang, YL, Xiong, LL, Sun, DJ, et al. Chemical constituents from the stems and leaves of Amomum villosum Lour. And their anti-inflammatory and antioxidant activities. Bioorg Chem. (2023) 131:106281. doi: 10.1016/j.bioorg.2022.106281
2. Ai, ZP, Mowafy, S, and Liu, YH. Comparative analyses of five drying techniques on drying attributes, physicochemical aspects, and flavor components of Amomum villosum fruits. LWT Food Sci Technol. (2022) 154:112879. doi: 10.1016/j.lwt.2021.112879
3. Cai, RB, Yue, XY, Wang, YL, Yang, YY, Sun, DJ, Li, H, et al. Chemistry and bioactivity of plants from the genus Amomum. J Ethnopharmacol. (2021) 281:114563. doi: 10.1016/j.jep.2021.114563
4. Tang, CL, Chen, JL, Zhou, Y, Ding, P, He, GZ, Zhang, LX, et al. Exploring antimicrobial mechanism of essential oil of Amomum villosum Lour through metabolomics based on gas chromatography-mass spectrometry in methicillin-resistant Staphylococcus aureus. Microbiol Res. (2021) 242:126608. doi: 10.1016/j.micres.2020.126608
5. Liu, HF, Zhuang, SS, Liang, CR, He, JJ, Brennan, CS, Brennan, MA, et al. Effects of a polysaccharide extract from Amomum villosum Lour. On gastric mucosal injury and its potential underlying mechanism. Carbohydr Polym. (2022) 294:119822. doi: 10.1016/j.carbpol.2022.119822
6. Yao, YB, Mi, WJ, Cao, GZ, Yang, RQ, Chen, HR, Liu, Y, et al. The absorption characteristics of nonvolatile components in a water extraction from amomi fructus as determined by in situ single-pass intestinal perfusion and high-performance liquid chromatography. Front Pharmacol. (2020) 11:711. doi: 10.3389/fphar.2020.00711
7. Kim, HR, Antonisamy, P, Kim, YS, Kwon, YG, Ryu, DG, Lee, YR, et al. Amomum villosum Lour. Fruit extract ameliorates high-fat diet-induced body mass gain and adipogenic pathways in C57BL/6 mice. J King Saud Univ Sci. (2021) 33:101473. doi: 10.1016/j.jksus.2021.101473
8. Kim, YS, Kim, HR, Antonisamy, P, Lee, YR, Lee, G, Jung, HJ, et al. Amomum villosum Lour. Fruit extract mitigates hyperlipidemia through SREBP-2/LDLR/HMGCR signaling in high-cholesterol diet-fed mice. J King Saud Univ Sci. (2022) 34:102230. doi: 10.1016/j.jksus.2022.102230
9. Yeo, J, and Shahidi, F. Identification and quantification of soluble and insoluble-bound phenolics in lentil hulls using HPLC-ESI-MS/MS and their antioxidant potential. Food Chem. (2020) 315:126202. doi: 10.1016/j.foodchem.2020.126202
10. Zou, H, Ben, TT, Wu, P, Waterhouse, GIN, and Chen, YL. Effective anti-inflammatory phenolic compounds from dandelion: identification and mechanistic insights using UHPLC-ESI-MS/MS, fluorescence quenching and anisotropy, molecular docking and dynamics simulation. Food Sci Hum Wellness. (2023) 12:2184–94. doi: 10.1016/j.fshw.2023.03.031
11. Lahlou, A, Chileh-Chelh, T, Lyashenko, S, Rincón-Cervera, MÁ, Rodríguez-García, I, López-Ruiz, R, et al. Arecaceae fruits: fatty acids, phenolic compounds and in vitro antitumor activity. Food Biosci. (2022) 50:102181. doi: 10.1016/j.fbio.2022.102181
12. Chen, SK, Lin, HF, Wang, X, Yuan, Y, Yin, JY, and Song, XX. Comprehensive analysis in the nutritional composition, phenolic species and in vitro antioxidant activities of different pea cultivars. Food Chem X. (2023) 17:100599. doi: 10.1016/j.fochx.2023.100599
13. Fan, HQ, Chen, MS, Dai, TT, Deng, LZ, Liu, CM, Zhou, W, et al. Phenolic compounds profile of Amomum tsaoko Crevost et Lemaire and their antioxidant and hypoglycemic potential. Food Biosci. (2023) 52:102508. doi: 10.1016/j.fbio.2023.102508
14. Herrera-Pool, E, Ramos-Díaz, AL, Lizardi-Jiménez, MA, Pech-Cohuo, S, Ayora-Talavera, T, Cuevas-Bernardino, JC, et al. Effect of solvent polarity on the ultrasound assisted extraction and antioxidant activity of phenolic compounds from habanero pepper leaves (Capsicum chinense) and its identification by UPLC-PDA-ESI-MS/MS. Ultrason Sonochem. (2021) 76:105658. doi: 10.1016/j.ultsonch.2021.105658
15. Oreopoulou, A, Tsimogiannis, D, and Oreopoulou, V. Extraction of polyphenols from sromatic and medicinal plants: an overview of the methods and the effect of extraction parameters. Polyphenols Plants. (2019) 15:243–59. doi: 10.1016/B978-0-12-813768-0.00025-6
16. Bondam, AF, Diolinda da Silveira, D, Pozzada dos Santos, J, and Hoffmann, JF. Phenolic compounds from coffee by-products: extraction and application in the food and pharmaceutical industries. Trends Food Sci Technol. (2022) 123:172–86. doi: 10.1016/j.tifs.2022.03.013
17. Shraim, AM, Ahmed, TA, Rahman, MM, and Hijji, YM. Determination of total flavonoid content by aluminum chloride assay: a critical evaluation. LWT Food Sci Technol. (2021) 150:111932. doi: 10.1016/j.lwt.2021.111932
18. Zhou, YF, Cao, YX, Li, JX, Agar, OT, Barrow, C, Dunshea, F, et al. Screening and characterization of phenolic compounds by LC-ESI-QTOF-MS/MS and their antioxidant potentials in papaya fruit and their by-products activities. Food Biosci. (2023) 52:102480. doi: 10.1016/j.fbio.2023.102480
19. da Costa, CAR, Machado, GGL, Rodrigues, LJ, de Barros, HEA, Natarelli, CVL, and Boas, EVBV. Phenolic compounds profile and antioxidant activity of purple passion fruit's pulp, peel and seed at different maturation stages. Sci Hortic. (2023) 321:112244. doi: 10.1016/j.scienta.2023.112244
20. Pourshoaib, SJ, Rajabzadeh Ghatrami, E, and Shamekhi, MA. Comparing ultrasonic- and microwave-assisted methods for extraction of phenolic compounds from Kabkab date seed (Phoenix dactylifera L.) and stepwise regression analysis of extracts antioxidant activity. Sustain Chem Pharm. (2022) 30:100871. doi: 10.1016/j.scp.2022.100871
21. Tian, YC, Nusantara, AC, Hamoh, T, Mzyk, A, Tian, XB, Perona Martinez, F, et al. Permentier HP, Schirhagl R, functionalized fluorescent nanodiamonds for simultaneous drug delivery and quantum sensing in heLa cells. ACS Appl Mater Interfaces. (2022) 14:39265–73. doi: 10.1021/acsami.2c11688
22. Pu, YW, Zhu, JM, Xu, J, Zhang, ST, and Bao, YX. Antitumor effect of a polysaccharide from Pseudostellaria heterophylla through reversing tumor-associated macrophages phenotype. Int J Biol Macromol. (2022) 220:816–26. doi: 10.1016/j.ijbiomac.2022.08.111
23. Wang, RS, Dong, PH, Shuai, XX, and Chen, MS. Evaluation of different black mulberry fruits (Morus nigra L.) based on phenolic compounds and antioxidant activity. Foods. (2022) 11:1252. doi: 10.3390/foods11091252
24. Zhu, B, Wang, KH, Liang, ZL, Zhu, ZJ, and Yang, J. Transcriptome analysis of glutathione response: RNA-seq provides insights into balance between antioxidant response and glucosinolate metabolism. Antioxidants. (2022) 11:1322. doi: 10.3390/antiox11071322
25. Sim, YY, Jess Ong, WT, and Nyam, KL. Effect of various solvents on the pulsed ultrasonic assisted extraction of phenolic compounds from Hibiscus cannabinus L. leaves. Ind Crop Prod. (2019) 140:111708. doi: 10.1016/j.indcrop.2019.111708
26. Bhardwaj, P, Naryal, A, Thakur, MS, Aggarwal, NK, Saxena, S, Chaurasia, OP, et al. Comparative antioxidant, antibacterial, and GC-MS analysis of methanol extract’s fractions and isolation of luteolin from leaves of trans-Himalayan Codonopsis clematidea. Ind Crop Prod. (2020) 144:112046. doi: 10.1016/j.indcrop.2019.112046
27. Dias, ALB, Sergio, CSA, Santos, P, Barbero, GF, Rezende, CA, and Martínez, J. Ultrasound-assisted extraction of bioactive compounds from dedo de Moca pepper (Capsicum baccatum L.): effects on the vegetable matrix and mathematical modeling. J Food Eng. (2017) 198:36–44. doi: 10.1016/j.jfoodeng.2016.11.020
28. Oldoni, TLC, Merlin, N, Karling, M, Carpes, ST, Alencar, SM, Morales, RGF, et al. Bioguided extraction of phenolic compounds and UHPLC-ESI-Q-TOF-MS/MS characterization of extracts of Moringa oleifera leaves collected in Brazil. Food Res Int. (2019) 125:108647. doi: 10.1016/j.foodres.2019.108647
29. Kim, I, Ku, KH, Jeong, MC, Kwon, SI, and Lee, J. Metabolite profiling and antioxidant sctivity of 10 new early- to mid-season apple cultivars and 14 traditional cultivars. Antioxidants. (2020) 9:443. doi: 10.3390/antiox9050443
30. Ju, YL, Xu, XL, Yu, YK, Liu, M, Wang, WN, Wu, JR, et al. Effects of winemaking techniques on the phenolics, organic acids, and volatile compounds of Muscat wines. Food Biosci. (2023) 54:102937. doi: 10.1016/j.fbio.2023.102937
31. Zhang, JN, Ma, MH, Ma, XL, Ma, FL, Du, QY, Liu, JN, et al. A comprehensive study of the effect of drying methods on compounds in Elaeagnus angustifolia L. flower by GC-MS and UHPLC-HRMS based untargeted metabolomics combined with chemometrics. Ind Crop Prod. (2023) 195:116452. doi: 10.1016/j.indcrop.2023.116452
32. Zhang, J, Zhang, Q, Liang, YP, Qian, LY, Wu, W, Wen, YG, et al. Probiotics for the treatment of docetaxel-related weight gain of breast cancer patients—a single-center, randomized, double-blind, and placebo-controlled trial. Front Nutr. (2021) 8:762929. doi: 10.3389/fnut.2021.762929
33. Jiang, SR, Zhao, XH, Liu, C, Dong, Q, Mei, LJ, Chen, C, et al. Identification of phenolic compounds in fruits of Ribes stenocarpum maxim. By UHPLC-QTOF/MS and their hypoglycemic effects in vitro and in vivo. Food Chem. (2021) 344:128568. doi: 10.1016/j.foodchem.2020.128568
34. Lin, LZ, Yang, QY, Zhao, K, and Zhao, MM. Identification of the free phenolic profile of Adlay bran by UPLC-QTOF-MS/MS and inhibitory mechanisms of phenolic acids against xanthine oxidase. Food Chem. (2018) 253:108–18. doi: 10.1016/j.foodchem.2018.01.139
35. Ren, MC, Xu, W, Zhang, YP, Ni, L, Lin, YF, Zhang, XQ, et al. Qualitative and quantitative analysis of phenolic compounds by UPLC-MS/MS and biological activities of Pholidota chinensis Lindl. J Pharm Biomed Anal. (2020) 187:113350. doi: 10.1016/j.jpba.2020.113350
36. Ali, A, Cottrell, JJ, and Dunshea, FR. Identification and characterization of anthocyanins and non-anthocyanin phenolics from Australian native fruits and their antioxidant, antidiabetic, and anti-Alzheimer potential. Food Res Int. (2022) 162:111951. doi: 10.1016/j.foodres.2022.111951
37. Liu, HS, Shu, B, Zhang, RF, Dong, LH, Zhang, J, Shen, YB, et al. Newly formed phenolics selectively bound to the graded polysaccharides of lychee pulp during heat pump drying using UPLC-ESI-QqQ-TOF-MS/MS. Int J Biol Macromol. (2023) 250:126258. doi: 10.1016/j.ijbiomac.2023.126258
38. da Silva, AA, ESP, DN, Cardoso, DR, and Franco, DW. Coumarins and phenolic fingerprints of oak and Brazilian woods extracted by sugarcane spirit. J Sep Sci. (2009) 32:3681–91. doi: 10.1002/jssc.200900306
39. Li, SJ, Wang, RM, Hu, XP, Li, CF, and Wang, L. Bio-affinity ultra-filtration combined with HPLC-ESI-qTOF-MS/MS for screening potential α-glucosidase inhibitors from Cerasus humilis (Bge.) Sok. Leaf-tea and in silico analysis. Food Chem. (2022) 373:131528. doi: 10.1016/j.foodchem.2021.131528
40. Xie, LW, Lin, QL, Guo, KK, Tong, CY, Shi, SY, and Shi, FY. HPLC–DAD–QTOF-MS/MS based comprehensive metabolomic profiling of phenolic compounds in Kalimeris indica anti-inflammatory fractions. Ind Crop Prod. (2019) 140:111636. doi: 10.1016/j.indcrop.2019.111636
41. Zhong, JH, Wang, Y, Li, C, Yu, Q, Xie, JH, Dong, RB, et al. Natural variation on free, esterified, glycosylated and insoluble-bound phenolics of Rubus chingii Hu: correlation between phenolic constituents and antioxidant activities. Food Res Int. (2022) 162:112043. doi: 10.1016/j.foodres.2022.112043
42. Zhou, GS, Ma, JY, Tang, YP, Wang, XM, Zhang, J, and Duan, JA. Multi-response optimization of ultrasonic assisted enzymatic extraction followed by macroporous resin purification for maximal recovery of flavonoids and ginkgolides from waste Ginkgo biloba fallen leaves. Molecules. (2018) 23:1029. doi: 10.3390/molecules23051029
43. Liu, PZ, Li, LL, Song, LJ, Sun, XT, Yan, SJ, and Huang, WJ. Characterisation of phenolics in fruit septum of Juglans regia Linn. By ultra performance liquid chromatography coupled with Orbitrap mass spectrometer. Food Chem. (2019) 286:669–77. doi: 10.1016/j.foodchem.2019.02.054
44. Santos, UP, Campos, JF, Torquato, HFV, Paredes-Gamero, EJ, Carollo, CA, Estevinho, LM, et al. Antioxidant, antimicrobial and cytotoxic properties as well as the phenolic content of the extract from Hancornia speciosa Gomes. PLoS One. (2016) 11:e0167531. doi: 10.1371/journal.pone.0167531
45. Yan, FF, Zhao, L, Chen, WB, Lu, Q, Tang, C, Wang, CM, et al. Comparison of the inhibitory effects of procyanidins with different structures and their digestion products against acrylamide-induced cytotoxicity in IPEC-J2 cells. J Funct Foods. (2020) 72:104073. doi: 10.1016/j.jff.2020.104073
46. Piątczak, E, Dybowska, M, Płuciennik, E, Kośla, K, Kolniak-Ostek, J, and Kalinowska-Lis, U. Identification and accumulation of phenolic compounds in the leaves and bark of Salix alba (L.) and their biological potential. Biomolecules. (2020) 10:1391. doi: 10.3390/biom10101391
47. Zhang, L, Tu, ZC, Xie, X, Wang, H, Wang, H, Wang, ZX, et al. Jackfruit (Artocarpus heterophyllus lam.) peel: a better source of antioxidants and a-glucosidase inhibitors than pulp, flake and seed, and phytochemical profile by HPLC-QTOF-MS/MS. Food Chem. (2017) 234:303–13. doi: 10.1016/j.foodchem.2017.05.003
48. Viturat, S, Thongngam, M, Lumdubwong, N, Zhou, W, and Klinkesorn, U. Ultrasound-assisted formation of chitosan-glucose Maillard reaction products to fabricate nanoparticles with enhanced antioxidant activity. Ultrason Sonochem. (2023) 97:106466. doi: 10.1016/j.ultsonch.2023.106466
49. Zhang, MQ, Zhang, J, Zhang, YT, Sun, JY, Prieto, MA, Simal-Gandara, J, et al. The link between the phenolic composition and the antioxidant activity in different small berries: a metabolomic approach. LWT Food Sci Technol. (2023) 182:114853. doi: 10.1016/j.lwt.2023.114853
50. Clodoveo, ML, Crupi, P, Muraglia, M, Naeem, MY, Tardugno, R, Limongelli, F, et al. The main phenolic compounds responsible for the antioxidant capacity of sweet cherry (Prunus avium L.) pulp. LWT Food Sci Technol. (2023) 185:115085. doi: 10.1016/j.lwt.2023.115085
51. Abduh, MY, Nofitasari, D, Rahmawati, A, Eryanti, AY, and Rosmiati, M. Effects of brewing conditions on total phenolic content, antioxidant activity and sensory properties of cascara. Food Chem Adv. (2023) 2:100183. doi: 10.1016/j.focha.2023.100183
52. Rahman, MM, Dipti, TT, Islam, MN, Abdullah, ATM, Jahan, S, Alam, MM, et al. Chemical composition, antioxidant and antibacterial activity of Piper chaba stem extracts with preservative effects on storage of raw beef patties. Saudi J Biol Sci. (2023) 30:103663. doi: 10.1016/j.sjbs.2023.103663
53. Kumar, RS, Rajkapoor, B, and Perumal, P. Antioxidant activities of Indigofera cassioides Rottl. Ex. DC. Using various in vitro assay models. Asian Pac J Trop Biomed. (2012) 2:256–61. doi: 10.1016/S2221-1691(12)60019-7
54. Sharifi-Rad, M, Kumar, NVA, Zucca, P, Varoni, EM, and Sharifi-Rad, J. Lifestyle, oxidative stress, and antioxidants: Back and forth in the pathophysiology of chronic diseases. Front Physiol. (2020) 11:694. doi: 10.3389/fphys.2020.00694
55. Wang, YG, Jiang, WJ, Shen, J, Wang, W, Niu, YX, Zhao, W, et al. Detoxification modification of coal-tar pitch by ultraviolet & microwave radiation-enhanced chemical reaction and toxicity evaluation by chemical index and cytotoxicity assay in vitro. J Hazard Mater. (2021) 410:124648. doi: 10.1016/j.jhazmat.2020.124648
56. Cannella, V, Altomare, R, Chiaramonte, G, Di Bella, S, Mira, F, Russotto, L, et al. Cytotoxicity evaluation of endodontic pins on L929 cell line. Biomed Res Int. (2019) 2019:3469525. doi: 10.1155/2019/3469525
57. Mesas, C, Martínez, R, Doello, K, Ortiz, R, López-Jurado, M, Bermúdez, F, et al. In vivo antitumor activity of Euphorbia lathyris ethanol extract in colon cancer models. Biomed Pharmacother. (2022) 149:112883. doi: 10.1016/j.biopha.2022.112883
58. Pu, SM, Chen, WD, Zhang, YJ, Li, JH, Zhou, W, Chen, J, et al. Comparative investigation on the phytochemicals and biological activities of jackfruit (Artocarpus heterophyllus lam.) pulp from five cultivars. Plant Food Hum Nutr. (2023) 78:76–85. doi: 10.1007/s11130-022-01018-6
59. Antognoni, F, Potente, G, Mandrioli, R, Angeloni, C, Freschi, M, Malaguti, M, et al. Fruit quality characterization of new sweet cherry cultivars as a good source of bioactive phenolic compounds with antioxidant and neuroprotective potential. Antioxidants. (2020) 9:677. doi: 10.3390/antiox9080677
Keywords: Amomum villosum Lour., phenolic compounds, UPLC-ESI-QTOF-MS/MS, antioxidant, antitumor
Citation: Zhang M, Shuai X-x, Wei Z, Dai T-t, Wei C-b, Li Y, He J-j and Du L-q (2024) Characterization, antioxidant and antitumor activities of phenolic compounds from Amomum villosum Lour. Front. Nutr. 11:1327164. doi: 10.3389/fnut.2024.1327164
Edited by:
Runqiang Yang, Nanjing Agricultural University, ChinaReviewed by:
Pedro Ferreira Santos, University of Minho, PortugalEr Sheng Gong, Gannan Medical University, China
Copyright © 2024 Zhang, Shuai, Wei, Dai, Wei, Li, He and Du. This is an open-access article distributed under the terms of the Creative Commons Attribution License (CC BY). The use, distribution or reproduction in other forums is permitted, provided the original author(s) and the copyright owner(s) are credited and that the original publication in this journal is cited, in accordance with accepted academic practice. No use, distribution or reproduction is permitted which does not comply with these terms.
*Correspondence: Chang-bin Wei, emJ3Y2JAMTYzLmNvbQ==; Jun-jun He, aGJqNDZAMTYzLmNvbQ==; Li-qing Du, ZHVsaXFpbmc5Mjc2MThAMTYzLmNvbQ==
†These authors share first authorship