 Mehrsa Emkani
 Sylvie Moundanga
 Bonastre Oliete
 Rémi Saurel
94% of researchers rate our articles as excellent or good
Learn more about the work of our research integrity team to safeguard the quality of each article we publish.
Find out more
ORIGINAL RESEARCH article
Front. Nutr., 02 November 2023
Sec. Nutrition and Food Science Technology
Volume 10 - 2023 | https://doi.org/10.3389/fnut.2023.1284413
Pea albumins are promising for their nutritional, biological, and techno-functional properties. However, this fraction is usually discarded in the industry due to its low protein content compared to globulin fraction and the presence of some anti-nutritional compounds. In the present study, we used an alternative method of pea protein extraction based on alkaline solubilization/isoelectric precipitation in which the reduction of pH was achieved by lactic acid fermentation using specific starters instead of mineral acids. Hence, the main objective of this study was to examine the protein profile and the content of anti-nutritional and nutritional active compounds in pea albumin-rich fractions obtained by the isoelectric extraction method without (control) or with fermentation with different lactic acid bacteria (Streptococcus thermophilus, Lactiplantibacillus plantarum, and their co-culture). Different pea cultivars (Cartouche, Ascension, and Assas) were used here for their differences in protein profile. The results revealed a higher total nitrogen content in albumin-rich fraction for fermented samples and, in particular, for co-culture. The majority of total nitrogen was determined as non-protein (~50%), suggesting the degradation of proteins by LAB to small peptides and amino acids, which were solubilized in the soluble fraction (albumin) as confirmed by size exclusion chromatography (SEC-HPLC) analysis. Moreover, the higher antioxidant activity of fermented albumin samples was attributed to the production of small peptides during extraction. Lactic acid fermentation also resulted in a significant reduction of trypsin inhibitor activity, α-galactoside, and phytic acid content of this fraction compared to control.
Over the past decade, there has been a significant interest in pea ingredients for their high protein content, good quality amino acids, and low allergenicity. However, the application of pea protein in the food industry is still challenging because of its low solubility, imperfect sensorial properties, and the presence of antinutritional factors (1–3).
Peas can be used either as grain components (e.g., flour milled from grains) or as enriched protein ingredients such as protein concentrate (50–55% protein) and protein isolate (80–90% protein) (4, 5). The majority of pea proteins are globulins (60–70%) and albumins (15–20%). Due to their unique solubility characteristics, albumin and globulin fractions can be separated and purified. Globulins are salt-soluble, while albumins are water-soluble. Other compounds such as trypsin inhibitors, lipoxygenase, phytate, lectine, and α-galactosides are also soluble in water and are mainly recovered in the soluble albumin fraction after separation from globulin (6, 7). These compounds are considered non-nutritive compounds since they interfere with nutrient availabilities or cause host digestive discomfort or health problems. For instance, trypsin inhibitors are low molecular weight (Mw) proteins capable of binding to the digestive enzyme (i.e., trypsin) and inactivating it, reducing the digestibility of protein, reducing the absorption of amino acids, and reducing the availability of minerals (8). The α-galactosides of sucrose, also known as the raffinose family of oligosaccharides (RFOs), are the second most abundant soluble carbohydrate in legumes (9). α-galactosides are responsible for digestive discomfort and flatulence due to their fermentation by gut bacteria in the large intestine (10). Phytic acid [myo-inositol hexaphosphoric acid (IP6)] consists of a cyclic ring (C6H6O6) where each oxygen is connected to a phosphate group (P(OH)3) (11). The unique structure of phytic acid enables it to bind with various molecules such as proteins through different types of interactions, affecting protein solubility (12). Phytic acid can also bind to enzymes and certain minerals, reducing their absorption in the gut. This can lead to iron deficiency anemia in individuals with high daily pulse consumption (13, 14).
Differences in the composition and structure of pea proteins can be achieved due to agronomical conditions (cultivar, weather conditions, etc.) or due to technological processes during extraction or functionalization (physical, chemical, or biological processes). First and foremost, the genetic and phenotypic variation of pea cultivars can affect the ratio of globulins (i.e., 11S/7S) and globulin to albumin fraction (15). The variation of protein fractions can modify the properties of the protein. For instance, the less compact structure of vicilin offers better functional properties compared to legumin (16). Nevertheless, the limited presence of sulfur amino acids in vicilin diminishes its nutritional value (17).
Protein composition and structure are also determined by the extraction method where normally physical and chemical processes are applied. Different methods have been proposed for the extraction of protein from pea flour, including alkaline extraction/isoelectric precipitation (AEIEP), salt extraction dialysis, micellar precipitation, and aqueous extraction (pH > 7) (18, 19). AEIEP is a common technique with a high yield for producing pea protein isolates in the food industry (20). The method separates albumins and globulins since both legumin and vicilin have high solubility at alkaline pH and minimal solubility at their isoelectric point (pI), while albumin remains soluble in a large pH range (21). Globulin fraction obtained by this method is exploited in the form of isolates by industry. Other fractions such as albumins are discarded as by-products.
Biological processes such as lactic acid fermentation can be as important as the other factors (cultivar and extraction methods) in modifying the composition and structure of protein. Indeed, lactic acid bacteria (LAB) during fermentation can have different enzymatic activities such as proteolysis, resulting in the production of small peptides and amino acids (22, 23). The small peptides released by LAB might possess many beneficial health activities such as angiotensin l-converting enzyme (ACE)-inhibitory activity and opioid, antioxidant, antidiabetic, immunomodulatory, and antimicrobial activities (24–26). As a result, fermentation is commonly employed with legume protein ingredients to enhance their physicochemical, nutritional, functional, and sensory properties (26–34).
A recent study in our group has proposed an alternative extraction method based on AEIEP (35). In this method, lactic acid fermentation by using LAB commercial starters was applied during the acid precipitation step. This way, the reduction of pH was obtained thanks to the production of organic acid by specific starters during fermentation, which leads to the precipitation of non-soluble fractions (globulins) and their separation from the soluble ones (albumins). This study showed that the albumin fraction obtained during fermentation had higher protein content than the one obtained by the traditional AEIEP method. Albumin fraction is generally discarded in the industry due to the presence of non-protein soluble compounds and antinutritional components, the possible allergenic activity of this fraction, and, most importantly, the lower content of protein compared to globulin fraction (36–39). This fraction can be interesting from a nutritional point of view since it is considered to have a higher content of sulfur-containing amino acids (40, 41). Moreover, previous studies on pea albumin fraction reported good emulsion and foam-stabilizing properties (42). Especially, interface and foam-stabilizing properties of this fraction seem to be promising compared to globulin, owing to the smaller Mw, lower protein charge, and the specific distribution in hydrophobicity of albumin fraction (39, 43).
Hence, the objective of this study was to evaluate more precisely the effects of fermentation with specific LAB strains on the under-valorized pea albumin fraction obtained with the previously proposed extraction method assisted by fermentation. Protein and peptide contents and other nutritional aspects (α-galactoside and phytic acid contents, and trypsin inhibitor and antioxidant activities) were further discussed in this study. Here, we aimed to use different pea cultivars with contrasted initial protein composition in 7S, 11S, and 2S fractions to observe whether the method could preferentially lead to the enrichment of certain protein fractions. Two LAB strains (S. thermophilus and L. plantarum) were applied either alone or in co-culture for their promising impact on legume protein properties. L. plantarum is a facultative heterofermentative bacteria (44). It is famous for its versatility and its adaptability in different substrates and conditions (45). It has been used numerously in pea ingredient fermentation (27, 28, 46–48). S. thermophilus is a homofermentative aerotolerant and is widely used in the dairy industry for its high acidification rate and its contribution to organoleptic properties (49, 50). There are several pieces of evidences of high growth and acidification of this strain in pea substrate, either alone or in co-culture (35, 51–53).
All the chemicals were of analytical grade and supplied by Honeywell FlukaTM (Gillman, SA, Australia) or Thermo Fisher Scientific (Dardilly, France) unless the contrary was indicated. Three different pea cultivars (Cartouche, Ascension, and Assas) with different grain characteristics and polypeptide profiles were used. The cultivars were provided by INRAE (UMR Agroécologie, Dijon, France) as part of the Peavalue project ANR-19-CE21-0008-03. The cultivars were chosen for their protein composition determined by INRAE AgroEcologie laboratory (Table 1). Cartouche (CAR) was rich in vicilins, Ascension (AC) was rich in convicilin, and Assas (AS) was rich in legumin and albumin PA2. Two freeze-dried lactic acid bacteria including, S. thermophilus (102303T) (ST) and L. plantarum (CNRZ211) (LP), were purchased from the International Center for Microbial Resources-food Associated Bacteria (CIRM-BIA, Rennes, France).
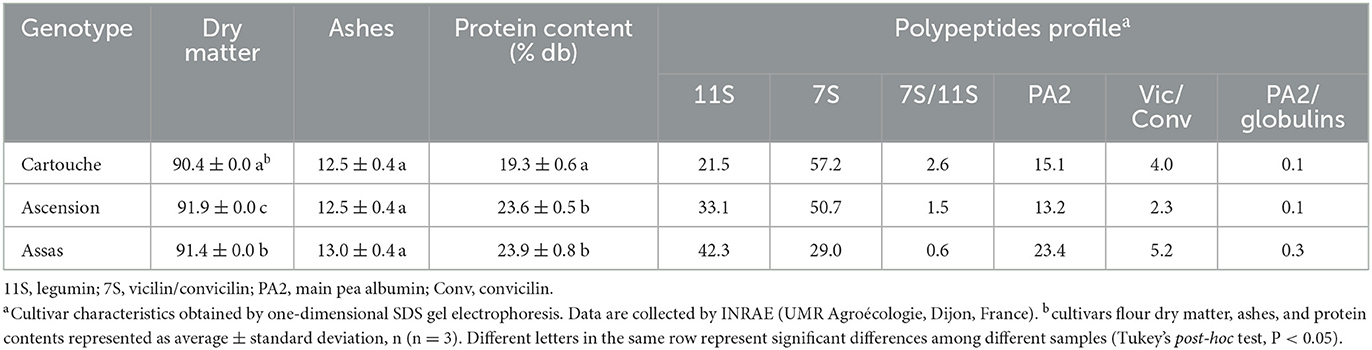
Table 1. Dry matter, ashes, and protein contents of pea flour from three cultivars (Cartouche, Ascension, and Assas).
LAB were received freeze-dried. After rehydration in their optimal liquid growth medium (MRS for LP and M17 for ST), the bacteria were incubated for 24 h at the optimal growth temperature of 37°C for LP and 43°C for ST. Cells were then isolated on an agar medium. A single colony was added to 10 mL of liquid medium and incubated for 24 h. A culture was prepared by inoculating 10 mL of broth medium with 1 mL of this pre-culture and was stopped at the beginning of the stationary phase (around 12 h for LP and 7 h for ST). The cell suspension was centrifuged (Eppendorf® Centrifuge 5804/5804R, USA) (4,000 ×g, 20°C, 5 min) and the pellet was resuspended in 1 mL of fresh optimal broth medium. Glycerol 30% was added to this suspension (1:1 ratio), and the contents were transferred to a cryotube. Cryotubes were stored at −80°C as stock culture.
For protein extraction experiments, the contents of a cryotube were transferred to a sterile Eppendorf tube. Glycerol was removed from the bacteria by centrifugation (4,000 ×g, 5 min, 4°C) and replaced by 1 mL of fresh broth medium. The pellet was washed three times. Then, the entire contents were added to 10 mL of fresh broth medium and incubated for 24 h at the optimal growth temperature of the bacteria. After that, 1 mL of pre-culture was added to 10 mL of fresh medium and incubated until the beginning of the stationary phase. Bacteria were harvested at a cell density of 107 CFU/mL for monoculture. For co-culture (STLP), ST and LP were added at a concentration of 0.5×10⁷ CFU/mL each in a 1:1 ratio. Bacteria were centrifuged (4,000 ×g, 10 min, 4°C), and the pellet was resuspended in 5 mL phosphate-buffered saline (PBS) before being added to the protein solution.
The seeds from CAR, AC, and AS cultivars were cracked in a Rotor Beater Mill SK300 (RETSCH GmbH, Haan, Germany) to coarsely break grains and separate the hull. The hull was removed by blowing air. Dehulled cracked grains were milled in the same Rotor Beater Mill SK300 (RETSCH GmbH, Haan, Germany) up to a particle size of <1 mm. Flours from the different varieties were then sieved (<800 μm). Table 1 represents the characteristics of pea cultivars flour. The protein content of flour was determined by the Kjeldahl method [conversion factor 5.4 (54)]. Ashes and dry matter contents of flour were determined by the 942.05 AOAC method (55) and the 935.29 AOAC method (56), respectively.
The method of extraction is shown in Figure 1.
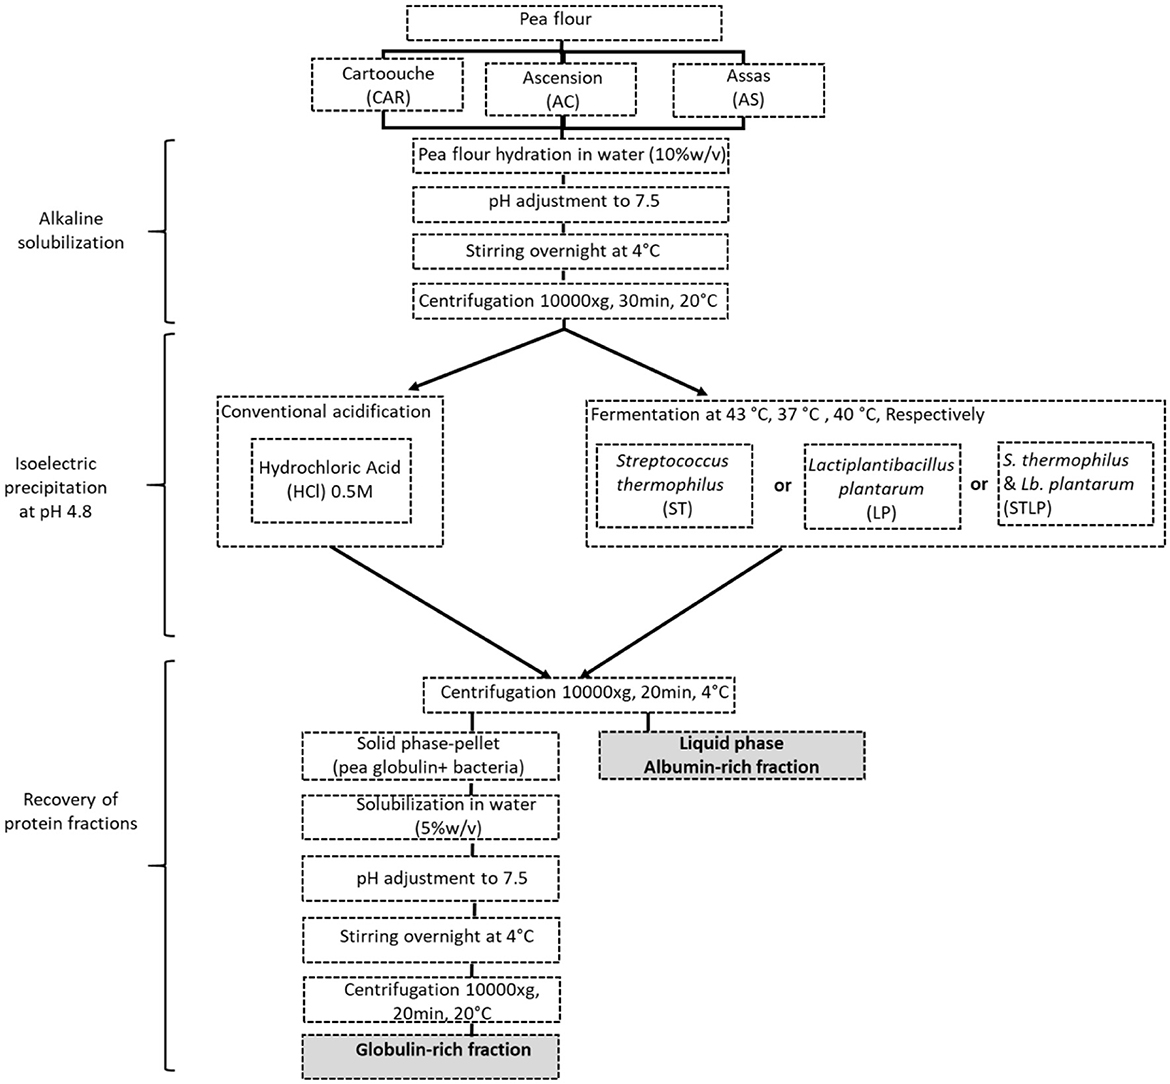
Figure 1. Schematic view of pea protein extraction.
The extraction method followed the protocol proposed by Emkani et al. (35). In brief, the pea flour was mixed with water (10% w/w), and the pH was adjusted to 7.5 by NaOH (0.5 M) addition. The solution was stirred overnight, and the pH was readjusted to 7.5. Insoluble material was removed by centrifugation (10,000 ×g, 30 min, 20°C), and the supernatant (protein extract) was collected. Acidification up to the isoelectric point of globulins (pH=4.8) was applied to separate the globulin fraction from the albumin fraction. The conventional acidification method used HCl addition. In the newly proposed method, acidification was achieved by fermentation. The selected lactic acid bacteria were added to the protein solution either as mono- or co-culture. While the pH was monitored automatically, the protein solution was incubated at an optimal growth temperature of the bacteria, which was 37, 43, and 40°C for LP, ST, and STLP, respectively. The acidification was stopped at pH 4.8, which corresponds to the isoelectric point of the globulins (57). The soluble part which is the albumin fraction was separated from the non-soluble part by centrifugation (10,000 ×g, 30 min, 4°C). The obtained pellet contained mainly globulins together with biomass. To obtain the globulin-rich fraction, the pellet was solubilized in water (5% w/v), and the pH was adjusted to 7.5 by NaOH 0.5 M. The sample was stirred overnight and the pH was readjusted to 7.5. The solution was again centrifuged (10,000 ×g, 20 min, 20°C), and the supernatant was collected. All the samples were freeze-dried (Heto PowerDry PL6000, Thermo Scientific, Waltham, MA, USA) and stored at −5°C until analysis. The freeze-drying conditions were the same as indicated by Oliete et al. (58). The total nitrogen and non-protein nitrogen content of the obtained protein fractions was determined by the Kjeldahl method according to Emkani et al. (35).
The acidification kinetic parameters were characterized according to Spinnler and Corrieu (59). The evolution of pH in protein extract was measured automatically at 5 min intervals (pH meter 3310, WTW GmbH, Weilheim, Germany) and carried out in triplicates. The time variation of pH (dpH/dt) was then calculated, and the maximum rate of acidification (Vmax) was expressed as pH units/h. The other kinetic parameters include time (tvmax) and pH (pHVmax) at which the maximum acidification rate was observed, final pH (pHf) at which the pH was stable, and time (tpHf) and (tpH4.8) required to reach pHf and pH 4.8, respectively, were also measured.
The polypeptide composition of albumin and globulin fractions was characterized by SDS-PAGE for all the extraction conditions. NovexTM electrophoresis gels at 10%−20% Tris-Glycine were used. Samples were diluted by at least half in the sample buffer: 187.5 mM Tris-HCl, pH 8.9, 10% (w/v) glycerol, 2% (w/v) SDS, and 0.05% (w/v) bromophenol blue, in the presence (reducing conditions) or absence (non-reducing conditions) of 2% (w/v) dithiothreitol (DTT). The samples under reducing conditions were heated in a water bath for 10 min at 95°C. All the samples were prepared and then deposited in the wells of the gel to have 10 μg of protein per well. The Mw protein markers from Sigma–AldrichR (SigmaMarkerTM S8445, wide range, Mw 6.5 to 200 kDa) were used for all samples except the samples obtained by STLP, which were obtained from Thermo Fisher Scientific (Thermo Scientific™, PageRuler™ unstained broad range protein ladder, Mw 5 to 250). The migration was carried out at 35 mA per gel, with the following migration buffer: 0.3% (w/v) trizma base, 1.45% (w/v) glycine, and 0.1% (w/v) SDS, in a ScientificR Mini Gel Tank of Migration (Thermo Fisher Scientific Inc.). The gels were then rinsed with distilled water, and the fixation was performed in four successive distilled water baths heated for 1 min in a microwave at 550 W. The staining of the gels was performed with Coomassie blue, Thermo Scientific™ PageBlue™ Protein Staining Solution, overnight. The discoloring was then achieved in several baths of distilled water, until the desired color. The gels were then scanned using the Odyssey infrared imaging system (LI-COR Biosciences, https://www.licor.com). Protein band detection was performed using CLIQS (TotalLab, http://www.totallab.com).
The size distribution of the peptides in the albumin fraction was determined by high-pressure liquid chromatography (HPLC Shimadzu Corporation, Kyoto, Japan). The HPLC system was equipped with an isocratic pump (Shimadzu LC-20AT), a UV-visible detector (Shimadzu SPD-20AV), and a size exclusion column, as Protein-Pak SEC Column, 60 Å, 10 μm (7.8 mm X 300 mm, 500–20K) (Waters, Milford, MA). The column was equilibrated at 25°C with a mobile phase, including a phosphate buffer (Na2HPO4) 100 mM and a pH 7 containing 0.3 M NaCl filtered through a 0.22-μm Durapore® Membrane Filter (filter hydrophilic PVDF, 47 mm membrane) (Sigma Alrich, Merk SA, Darmstadt, Germany). The column was pre-calibrated by the protein standards including Insulin B chain, Leucine, Myoglobin, and Cytochrome C from a bovine heart, supplied by Sigma Aldrich (Merk SA, Darmstadt, Germany) to determine the elution volume. Solution of standard and freeze-dried protein samples were dissolved in filtered phosphate buffer (Na2HPO4) 100 mM and a pH 7 containing 0.3 M NaCl with a concentration of ~1 mg/mL. The Mw fraction less than 10 kDa was separated from the protein solution by centrifugal filters (Amicon Ultra-15 Centrifugal Filter Unit, Merk SA, Darmstadt, Germany), and then they were filtered through a syringe filter (0.45 μm, 13 mm, Restek France, Lisses, France). The standard and protein solutions were then injected (20 μl) at a flow rate of 0.1 mL.min−1 for 120 min. The absorbance was then measured at different wavelengths 214, 280, and 254 nm. The wavelength at 254 was used to assess the interference with phenolic compounds. The best results were achieved at 214 nm due to the better absorption coefficient of protein. Tests were performed in triplicate. A calibration curve was obtained over a range of 0.3 to 16.7 kDa. The calibration curve equation and the correlation coefficients were y = −0.18x + 1.503, R2 = 0.986. Chromatograms were recorded and processed by LabSolution LC (HPLC Shimadzu Corporation, Kyoto, Japan).
Oligosaccharides of the raffinose family (RFOs), consisting of raffinose, stachyose, and verbascose, as well as the sucrose and D-glucose contents, were measured in the protein solution after alkaline solubilization and in the albumin fractions by an enzyme-based assay kit (Megazyme Raffinose/d-Glucose Assay Kit, Megazyme International, Ireland). The kit consisted of α-galactosidase (from A. niger), invertase (from yeast), and glucose determination reagent, i.e., glucose oxidase/peroxidase (GOPOD) for colorimetric estimation of sucrose and RFOs contents. The kit is based upon the principle of stepwise hydrolysis of complex soluble carbohydrates to glucose followed by its colorimetric measurement. Soluble sugars such as sucrose and RFOs were hydrolyzed with α-galactosidase and invertase into D-glucose, D-galactose, and D-fructose. D-glucose concentration was determined using GOPOD reagent. The concentration of raffinose, stachyose, verbascose, and other higher homologs of the RFOs in samples was measured as a group because α-galactosidase hydrolyses all members of the RFO family. Since 1 mole of each of the RFO contains 1 mole of D-glucose, the RFO concentrations were presented on a molar basis (mmol/100 g sample).
In brief, 0.5 g of each sample was treated with 95% ethanol (to digest the endogenous enzymes completely) at 85°C for 20 min, and the final volume was made up to 50 mL using sodium acetate buffer (50 mM, pH 4.5). The obtained digested mixture was incubated at room temperature for 20 min and vortexed to obtain a uniform slurry. Subsequently, 2 mL chloroform was added to the 5-mL slurry obtained and vortexed for 15 s followed by centrifugation at 1,000 ×g for 10 min. A volume of 0.2 mL from the aqueous phase of the supernatant was taken in three tubes (namely, A, B, and C). A volume of 0.2 mL sodium acetate buffer (50 mM, pH 4.5), 0.2 mL of invertase (8.3 U/mL), and a mixture of invertase + α-galactosidase (invertase 8 U/mL and α-Galactosidase 40 U/mL) was added into tubes A, B, and C, respectively. All three tubes were incubated at 50°C for 20 min. Reagent blank (0.4 mL sodium acetate buffer) and glucose control (0.1 mL standard glucose solution, which contained 0.556 μmol of glucose + 0.3 mL sodium acetate buffer) were also taken simultaneously. Subsequently, 3 mL of GOPOD reagent was added in all of the tubes and incubated again at 50°C for 20 min. The glucose concentration for tubes A, B, and C and glucose control was determined by measuring the change in absorbance at 510 nm against the reagent blank using a spectrophotometer (UV/Visible Jenway 6305, Barloworld Scientific, Dunmov, UK). Glucose, sucrose, and RFOs concentrations were shown in mmol/100 g sample. The concentrations of glucose, sucrose, and RFOs were calculated as follows:
where ΔA, ΔB, and ΔC were the absorbance of the sample plus sodium acetate buffer, sample plus invertase, and α-Galactosidase enzyme solution, respectively.
F = Factor to convert from absorbance to μmol of glucose= 0.556 (μmol of glucose)/GOPOD absorbance for 0.556 μmol of glucose; 250 = conversion to 50 mL of extract; 200 =conversion from 0.5 to 100 g of sample; and 1/1,000 = conversion from μmol to mmol.
All enzymatic assays were performed in three technical replicates (n = 3) for each sample. The consumption patterns of D-glucose, sucrose, and RFOs in the albumin fraction of samples obtained without fermentation (control) and with added fermentation by ST, LP, and STLP were shown as a ratio calculated from the content of these sugars in the initial protein extract.
The content of the free amino group was measured by trinitrobenzene sulfonic acid (TNBS) following the method of Adler-Nissen (60). In brief, globulin and albumin fractions with a concentration of 50 mg protein/mL (measured by the Kjeldhal method with a nitrogen conversion factor of 5.4) were prepared in phosphate buffer 0.1 M pH 8.2, 2% SDS w/v. A volume of 250 μL of the sample was added to 2 mL of TNBS reagent (0.5 g/L) and 1.75 mL phosphate buffer 0.2 M pH 8. The TNBS reagent was prepared immediately before use. This solution was incubated for 60 min at 50°C, and the absorbance at 340 nm was measured after the addition of 4 mL HCl 0.1 M to stop the reaction. A standard curve was obtained by sing L-leucine (at a concentration of 0–3 mM) as control.
Trolox equivalent antioxidant capacity (TEAC) was analyzed in albumin fractions by a total antioxidant capacity assay kit (MAK187, Sigma-Aldrich, Merk SA, Darmstadt, Germany) according to the manufacturer's instructions. The method is based on the reduction of Cu2+ to Cu+ by antioxidant molecules, which give an absorbance at 570 nm. In brief, 100 μL of albumin fractions were added to a 96-well plate with a clear flat bottom. Different dilutions of samples were also prepared and the volume was adjusted to 100 μL by distilled water to ensure that the readings were within the standard value range. Then, 100 μL of Cu2+ reagent was added to the samples and incubated in darkness at room temperature for 90 min, and the absorbance was measured at 570 nm using a microplate reader (Paradigm Detection Platform, Beckman Coulter, Harbor, Oregon, USA). Trolox solutions ranging from 0 to 20 nmol per well were used to prepare a calibration curve. The antioxidant activity was expressed as nmol Trolox equivalents per μL sample (nmol Trolox/μL).
2,2-diphenyl-picrylhydrazyl (DPPH) free radical scavenging ability was performed according to the method proposed by Brand-Williams et al. (61). In this assay, antioxidant compounds present in the sample reduced the DPPH· radicals, which had an absorption maximum of 517 nm. The DPPH· radical solution was prepared by dissolving 10 mg of DPPH in 25 mL of 80% methanol. First, the extinction of the disposable cuvette with 250 μL of the methanolic DPPH· solution and 2.1 mL of 80% methanol was measured as blank. Then, 100 μL of the sample was added to 250 μL of the methanolic DPPH· solution and 2 mL of 80% methanol. The mixture was shaken and allowed to stay at room temperature in the dark for 20 min. The decrease in absorbance of the resulting solution was monitored at 517 nm for 20 min using a spectrophotometer (UV/Visible Jenway 6305, Barlo world scientific, Dunmov, UK). The results were expressed as a percentage of reduction of the initial DPPH absorption.
Trypsin inhibitory activity of pea flour and albumin fraction was determined following the method described by Smith et al. (62) with some modifications. In brief, 10 mg of finely ground pea flour or freeze-dried albumin fraction was mixed with 5 mL of NaOH 10 mM (pH adjusted to ~9 by NaOH 1M) for 3 h at room temperature. The solution (called extract shown by V) was centrifuged (10,000 ×g, 30 min, 20°C), and the supernatant was separated. Trypsin (20 μg/mL) (trypsin from bovine pancreas, Merck/MilliporeSigma, Burlington, MA, United States) solution was dissolved in Tris-HCL buffer (20 mM pH 7.5). An amount of 200 μL of prepared sample was mixed with 200 μL of trypsin and incubated for 10 min at 37°C. The reaction started by the addition of 500 μL of 1 mM Nα-benzoyl-DL-arginine-ρ-nitroanilide (BApNA) (Merck/MilliporeSigma, Burlington, MA, United States) prepared in 1% (v/v) of dimethyl sulfoxide and Tris-HCL buffer (20 mM pH 7.5). The BApNA reagent was prepared immediately before use. The assay tubes were then incubated for 10 min at 37°C. The reaction was stopped by adding 100 μL of 30% acetic acid (v/v). It was then centrifuged at 2,000 ×g for 10 min. The absorbance of samples was measured at 410 nm and symbolized as. The absorbance was compared to a trypsin standard, which was determined by using the same procedure except for replacing the extracted trypsin inhibitors with water. The corresponding absorbance was symbolized as Ac. A trypsin inhibitor unit (TIU) was defined as an increase of 0.02 absorbance at 410 nm. With this definition, trypsin inhibitor activity (TIA) is defined as TIU per mg sample and it was calculated as follows:
where As was the absorbance of the sample, Ac was the absorbance of standard, V was the volume (mL) of extract (5 mL), and m was the mass (mg) of the sample. Trypsin inhibitor activity assay was performed in triplicate.
The determination of the phytate content of pea flour and albumin fractions was done according to the method developed by Davies and Reid (63) with some modifications. In brief, 0.5 g of pea flour and freeze-dried albumin samples were mixed with 20 mL of HNO3 0.5 M, and the suspensions were put under continuous stirring for 3 h. Each sample was then filtered with a Whatman No.1 filter paper to obtain the extract. The stock solution of ferric ammonium sulfate (FAS) (2.16 mg/mL) was prepared freshly. The working solution was prepared by diluting one volume of stock solution into 24 volumes of distilled water. Then, 0.2 mL of the previous extract was mixed with 0.2 mL of the working solution of FAS in a test tube, and the test tube was kept in a boiling water bath for 20 min. After the tube cooled to room temperature, 1 mL isoamyl alcohol was added to the tube followed by 0.02 mL of ammonium thiocyanate (5 g/50 mL). The tube was centrifuged (3,000 ×g, 10 min). Finally, the intensity of the color in the isoamyl alcohol layer was determined at 465 nm using a spectrophotometer against an isoamyl alcohol “blank”, exactly 15 min after the addition of the HN4CNS. Since the principle of this method is based on an indirect measurement of phytic acid, the idea is to precipitate the ferric ion complex with phytate at acidic pH. The excess of ferric ions will later make a characteristic pink complex with thiocyanate ions. The extinction at 465 nm in the amyl layer is inversely related to the phytate anion concentration. The phytate content can be obtained by reference to a calibration curve prepared with the same quantities of iron, thiocyanate acid, and a standard phytate preparation. The standard stock solution was prepared by dissolving 50 mg sodium phytate in 20 mL of distilled water and making the final volume of 100 mL with distilled water. The working solution was of 0.5 mg/mL concentration. Under these conditions, an inverse linear relationship was found over a range of 0 to 500 μg of phytate.
One-way analysis of variance (ANOVA) was performed using Statistica software, version 12 (Tulsa, OK, USA). Tukey's post-hoc least significant differences method was used to describe means with 95% confidence intervals.
Figure 2 shows the pH evolution during the fermentation of soluble pea protein extracts obtained from pea flours of three different varieties (CAR, AC, and AS) by ST, LP, and their co-culture. The diagrams showed that pea protein suspensions were a suitable substrate since all the bacteria were able to grow and reduce the pH. However, the time required to reduce the pH was quite different between the strains.
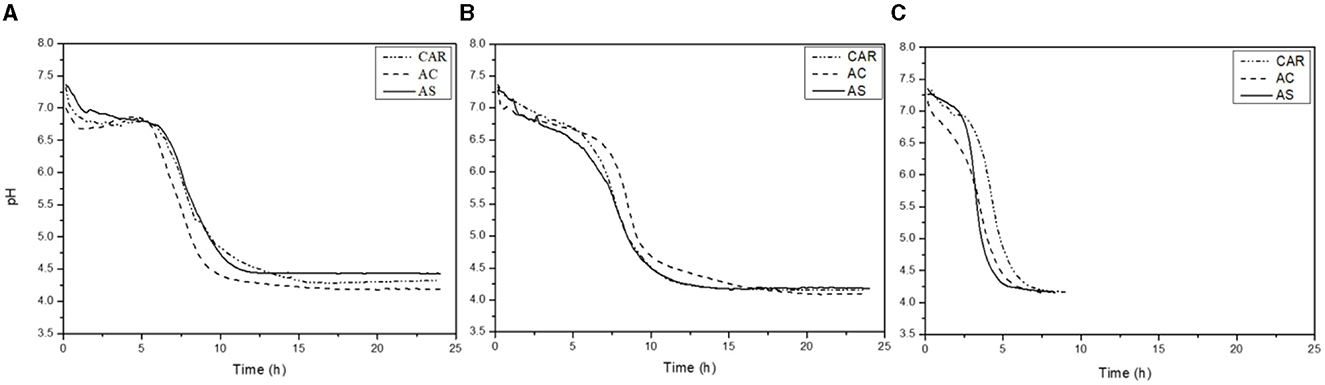
Figure 2. Acidification kinetics of LAB strains [S. thermophilus (ST) (A), L. plantarum (LP) (B), and S. thermophilus+ L. plantarum (STLP) (C)] in protein extracts obtained from different pea cultivars (CAR, AC, and AS).
Table 2 shows the acidification kinetic parameters in protein extracts from three pea cultivars fermented with mono- or co-culture. The highest acidification rate (Vmax~1.2–2.5 pH units/h) and lowest tVmax (~3.6 h) values were related to the co-culture compared to the mono-cultures (Vmax ~0.8–0.9 pH units/h; tVmax=7.5–8.5 h) with significant differences. The highest Vmax value (2.5 pH units/h) in co-culture was related to the variety AS. While there was no significant difference between the varieties in mono-cultures, the pHVmax represents the pH at the maximum acidification rate, corresponding to the maximum acid-producing ability of the strains. There was no significant difference in pHVmax (~5–6) and between any variety fermented either with mono- or co-cultures. The pHf represents the final reducing pH after which the pH was stable. The value of pHf was higher with ST (~4.2–4.4) compared to LP and co-culture (~4.1), indicating lower acidification. The time required to reach this pH (tpHf) was higher in mono-cultures (~14–16 h) compared to co-culture (~7–7.5 h). The tpH4.8, indicating the time required to reach pH 4.8 (isoelectric point of globulins), had a higher value with ST (~9.5–10.1 h), followed by LP (~9–9.5 h). Co-culture (~3.9–4.7 h) showed the lowest tpH4.8 compared to the mono-cultures.
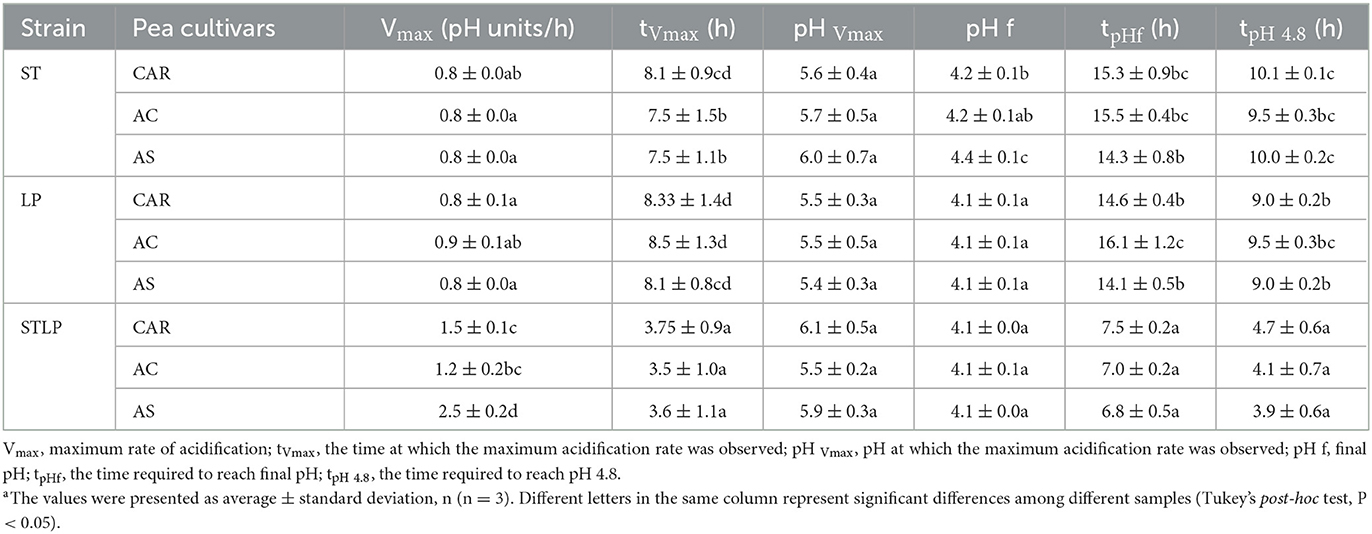
Table 2. Acidification kinetic parameters for fermented pea protein suspensions obtained from flours of different varieties (CAR, AC, and AS) with mono-cultures and co-cultures of S. thermophilus (ST) and L. plantarum (LP).
The highest Vmax, the lowest tVmax, pHf, tpHf, and tpH4.8 observed in the co-culture could be explained by the synergetic effect of the combined bacteria culture. Probably, the secretion of bioactive substances by one or both LAB used in the study would improve the growth performance and the acid lactic production. This behavior has been pointed out by many authors. Mishra and Mishra (64) observed that both S. thermophilus and L. plantarum, once in combination, resulted in an increased rate of fermentation and reduced fermentation time. Emkani et al. (35) showed the mixed culture of S. thermophilus, with L. acidophilus and B. lactis having a better acidification profile in pea protein compared to the mono-cultures. Li et al. (65) reported that the combination of S. thermophilus and L. plantarum in milk fermentation had higher pH reduction compared to the co-culture of S. thermophilus and B. lactis. The higher value of pHf and tpH4.8 in ST could be explained by the lower acidification capacity of this strain compared to LP. Indeed, the acidification capacity is a strain-dependent metabolic feature that could be influenced by many factors such as the metabolism of sugar and the proteolytic system (50, 66). Metabolism of sugar by LAB leads to the production of organic acids and reduction of pH.
Therefore, the ratio (relative content) of recovered glucose, sucrose, and RFOs (Figures 3A–C, respectively) was measured in albumin fractions obtained without (control) and with fermentation with ST, LP, and their co-culture (STLP) and was calculated from the initial protein extract of different pea cultivars (CAR, AC, and AS). In control, the ratio of these carbohydrates was close to 1. Indeed, these carbohydrates are all water soluble, and their majority is supposed to be found in albumin fraction after the acidification step. The content of glucose, sucrose, and RFOs in albumin fractions obtained by control was ~0.038 M (6.8 g/L), 0.016–0.02 M (5.4 g/L), and 0.03–0.045 M, respectively. No significant differences were observed in the content of glucose between the cultivars obtained by control. However, cultivar AC had a higher relative content of sucrose and RFOs in control.
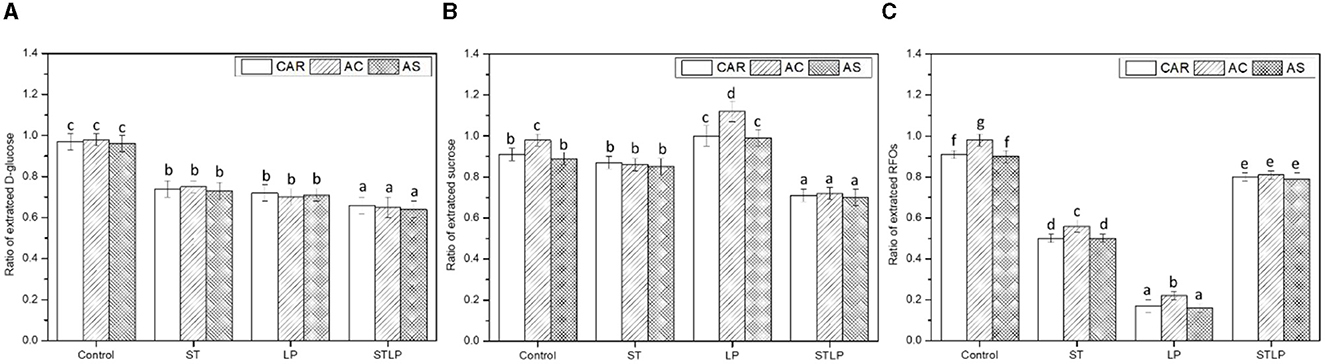
Figure 3. Ratio of recovered glucose (A), sucrose (B), and RFOs (C) of albumin fractions obtained without (control) or with added fermentation by S. thermophilus (ST), L. plantarum (LP) or their mixture (STLP), calculated from initial protein extract. Comparison between different pea cultivars: CAR, AC, and AS. Different letters represent significant differences among different samples (Tukey's post-hoc test, P < 0.05).
In fermented samples, LAB were able to reduce the content of these sugars by consuming them as a source of energy for growth, causing the release of organic acids. The relative content of glucose was reduced by all the strains (Figure 3A). The lowest value of glucose and sucrose was related to STLP. The ability of S. thermophilus and L. plantarum to consume glucose was reported previously (49, 67). Both ST and LP had α-galactosidase activities since they were able to reduce the content of RFOs (Figure 3C). The α-galactosidase activity of S. thermophilus (68, 69) and L. plantarum (70, 71) have been shown previously. However, the activity of this enzyme seemed to be strain-dependent. The highest consumption of α-galactosides was associated with the fermentation with LP. The reduction of RFOs was ~70% in LP and ~40% in ST, regardless of the pea cultivar. In samples obtained by ST and LP, cultivar AC had a higher content of RFOs compared to the two other cultivars. The lowest α-galactoside consumption was observed for the co-culture (<20%). In general, the optimum pH for bacterial α-galactosidases is in the range of 6.0–7.5 (72). It could be then suggested that the rapid reduction of pH in co-culture limited the action of this enzyme. The decrease of pH in the co-culture would be thus related to the consumption of the other soluble carbohydrates present in pea flour, which was higher compared to the mono-culture samples (Figures 3A, B). Simultaneously to the α-galactoside content reduction, an increase (~10%) in sucrose content was measured for LP, especially with cultivar AC (Figure 3B). This result could be related to the combination of two effects: (i) the noticeable reduction in RFO content increased sucrose release due to the α-galactosidase activity and (ii) LP is not able to catabolize sucrose efficiently as already indicated by Wang et al. (73). Moreover, no significant change in sucrose content was observed for ST compared to control. It is known that S. thermophilus species can consume sucrose (49). The consumption of sucrose by ST would be counteracted by the release of sucrose resulting from the hydrolysis of RFOs. The increase in the content of sucrose during fermentation has been previously reported for the fermentation of soymilk by L. fermentum (74).
The isoelectric precipitation extraction method was applied to recover albumin and globulin fractions from pea flour of three different cultivars (CAR, AC, and AS) without (control) or with fermentation using mono-cultures of ST and LP and their co-culture. The total nitrogen (TN) content of albumin and globulin fractions was shown in Figure 4. The results indicated that, in albumin fractions (Figure 4A), TN content was significantly higher for fermented samples (~4–5%) compared to control (~3%). Moreover, co-culture (~5%) had higher values compared to mono-cultures (~3.7–4.5%), while there was no significant difference between the mono-cultures of ST and LP. Comparing pea varieties, it seemed that AS (~4.5%) fermented with both ST and LP had the highest content of TN in albumin fraction. This is not surprising since the variety AS was initially richer in PA2. Regarding the globulin fractions (Figure 4B), the TN content was higher in control (~14.3–14.7%) compared to the fermented samples with co-culture (~12%) having the lowest value. This result was coherent with what was observed in albumin fractions. The decrease in the TN content of globulin fraction was supposed to result from the hydrolysis of some pea proteins to smaller polypeptide chains, which probably solubilized during the extraction process and were recovered in the albumin fraction.

Figure 4. Total nitrogen content of albumin (A) and globulin (B) fractions obtained without (control) or with added fermentation by S. thermophilus (ST), L. plantarum (LP), or their mixture (STLP). Comparison between different pea cultivars: CAR, AC, and AS. Different letters represent significant differences in total nitrogen content among different samples (P < 0.05).
Non-protein nitrogen (NPN) content of albumin (Figure 5A) and globulin (Figure 5B) fractions of pea cultivars obtained by both control and fermentation was measured. The results showed that fermented samples had the highest content of NPN compared to the control (albumin: ~0.8% and globulin: ~0.3%) in both fractions. In addition, the co-culture (albumin: ~2.6% and globulin: ~0.7%) sample had the highest values in both protein fractions compared to the mono-culture ones. NPN in fermented samples represented ~5% and 50% of TN in globulin and albumin fractions, respectively, which was approximately two-fold higher than control. An increase in the content of NPN could be explained by the hydrolysis of protein during fermentation (75–77). Generally, the content of NPN depends on cultivars (78). However, in this study, there were no significant differences between the varieties.
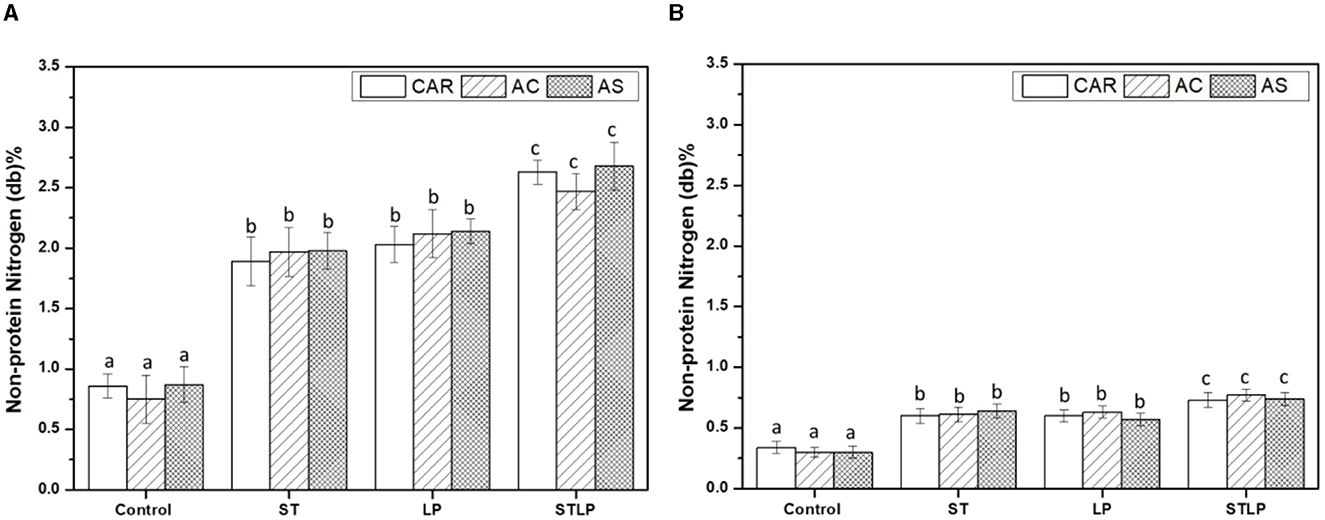
Figure 5. Non-protein nitrogen content of albumin (A) and globulin (B) fractions obtained without (control) or with added fermentation by S. thermophilus (ST), L. plantarum (LP), or their mixture (STLP). Comparison between different pea cultivars: CAR, AC, and AS. Different letters represent significant differences in non-protein nitrogen content among different samples (Tukey's post-hoc test, P < 0.05).
It is worth saying that, despite the application of fermentation in the isoelectric precipitation step, the total protein content in globulin fractions was ~72% in fermented samples compared to ~77% in control, considering the N-to-protein conversion factor of 5.4. By applying an N-to-protein conversion factor of 6.25 classically used for commercial pea protein isolates, these contents were ~83% and 88%, respectively, in the range of values usually observed by applying the AEIEP method (18).
Free amino groups were measured to evidence the proteolysis effect occurring in fermented samples. The content of free amino groups in albumin and globulin fractions obtained without (control) or with fermentation with ST, LP, and their co-culture from different pea cultivars (CAR, AC, and AS) was shown in Figures 6A, B, respectively.
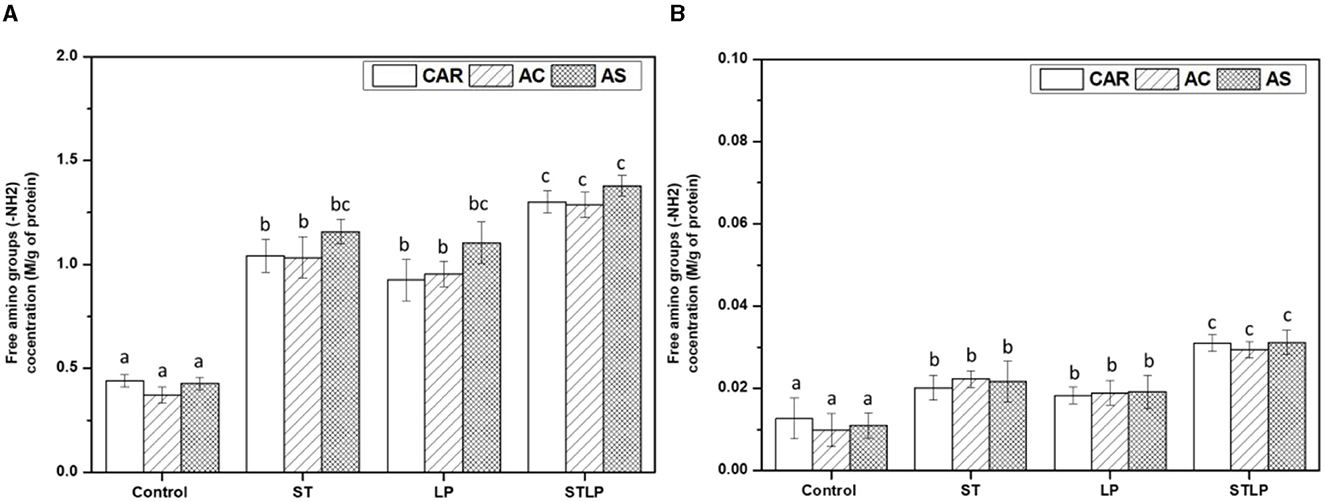
Figure 6. Free amino group content of albumin (A) and globulin (B) fraction obtained without (control) or with added fermentation by S. thermophilus (ST), L. plantarum (LP), or their mixture (STLP). Comparison between different pea cultivars: CAR, AC and AS. Different letters represent significant differences in free amino group content among different samples (Tukey's post-hoc test, P < 0.05).
Free amino group content was significantly lower in control albumin (~0.4 M/g protein) and globulin (~0.01 M/g protein) fractions compared to the fermented samples in agreement with the previous NPN data. Additionally, the samples fermented with co-culture seemed to have a higher content of free amino groups in albumin (~1.3 M/g protein) and globulin (~0.03 M/g protein) fractions compared to the mono-culture samples (albumin: ~1 M/g protein and globulin: ~0.02 M/g protein). Higher content of free amino groups in fermented samples could be explained by the proteolytic activity of the bacterial strains, leading to the release of peptides and amino acids during fermentation. A strong proteolytic activity was reported in some previous studies for L. plantarum. Rui et al. (79) reported the high proteolytic activity of L. plantarum in the fermentation of soy protein, causing an increase in the content of peptides. Oyedoh et al. (80) also observed high proteolysis and high concentration of peptides when cowpea was fermented with L. plantarum. S. thermophilus is known for its high proteolytic activity in milk (49). Moreover, there are some pieces of evidence of its proteolytic activity in legumes. For instance, Hati et al. (81) reported a maximum proteolysis and peptide generation for S. thermophilus in the fermentation of both bovine milk and soy milk. Boulay et al. (82) studied the role of cell envelope protease (CEP) in the growth of S. thermophilus in soy protein, and they observed a high proteolytic activity of S. thermophiles, resulting in the generation of more peptides and, consequently, a better growth of this strain. The increase in proteolytic activity of these LAB once in a co-culture has been reported previously. For instance, Madjirebaye et al. (83) observed an increase in the content of small peptides for the co-culture of S. thermophilus and L. plantarum compared to their mono-culture in the fermentation of soy milk. Li et al. (84) also reported a higher proteolytic activity of the co-culture of S. thermophilus and L. plantarum compared to the mono-culture of S. thermophilus or its co-culture with B. animalis, which led to the production of more free amino groups in fermented milk. Although the proteolytic activity and acid production capacity of the bacteria are known to be strain-dependent (85), there was no difference between the samples fermented with ST and LP. Despite the initial differences in the protein profile of the pea cultivars, there was no significant difference in their free amino group content. In albumin fraction, AS fermented with ST and LP had a slightly higher content of free amino groups content compared to the two other cultivars, but differences did not reach to be significant.
Additionally, the content of free amino groups was ~40–60 times lower in globulin fraction compared to the albumin ones, as the released peptides during fermentation are more soluble and are mostly recovered in the latter fraction.
SDS-PAGE was performed in non-reducing and reducing conditions to determine the effect of the extraction method on the protein composition of the recovered albumin and globulin fractions of different pea cultivars (CAR, AC, and AS). In non-reducing conditions (NR), the polypeptide profile of albumin (Figure 7) showed the presence of bands ranging from ~6 to ~99 kDa. In control, the bands corresponding to lipoxygenase (LOX, ~94 kDa) (86), convicilin (CV, ~71 kDa) (86), and vicilin monomer (Vαβγ, ~50 kDa) and the cleavage-resulting polypeptides (Vαβ, ~30–36 kDa; Vα, ~20 kDa; Vβ, ~13kDa; Vγ, ~12–16 kDa) (87, 88), lectine (Lect, ~17 kDa) (89), and the main 2S albumin subunits (PA2, ~26kDa; PA1, ~6kDa) (87, 90) were observed. While in fermented samples, CV and Vαβγ were absent. Other globulin contamination could be observed depending on LAB strains and cultivars. For instance, Vβγ (~25–30 kDa) was mainly observed in cultivars CAR and AC fermented with ST and LP. These two cultivars initially had a higher content of 7S globulin compared to cultivar AS. Different vicilin subunits (Vα, ~20 kDa; Vβ, ~13kDa; Vγ, ~12–16 kDa) were mainly observed for cultivars fermented with co-culture. The presence of legumin acidic subunit (Lα, ~40 kDa) (91), which was separated from legumin monomer (Lαβ ~60kDa) under reducing condition (R) (Figure 7), was observed for cultivars fermented with co-culture and cultivars AS and AC fermented with both ST or LP. The high intensity of bands smaller than 20 kDa in the electrophoretic profile of co-culture could indicate the presence of more peptides in this region. Production of small protein fractions and the disappearance of high Mw proteins was related to the proteolytic activity of LAB as revealed before by amino group quantification. The disappearance of high Mw protein in the electrophoretic profile after lactic acid fermentation has been previously shown in pea flour (92) and pea protein isolate (35). Boulay et al. (82) explained the proteolytic activity of ST in soy protein by the disappearance of high Mw protein and the presence of low Mw compounds in the polypeptide profile.
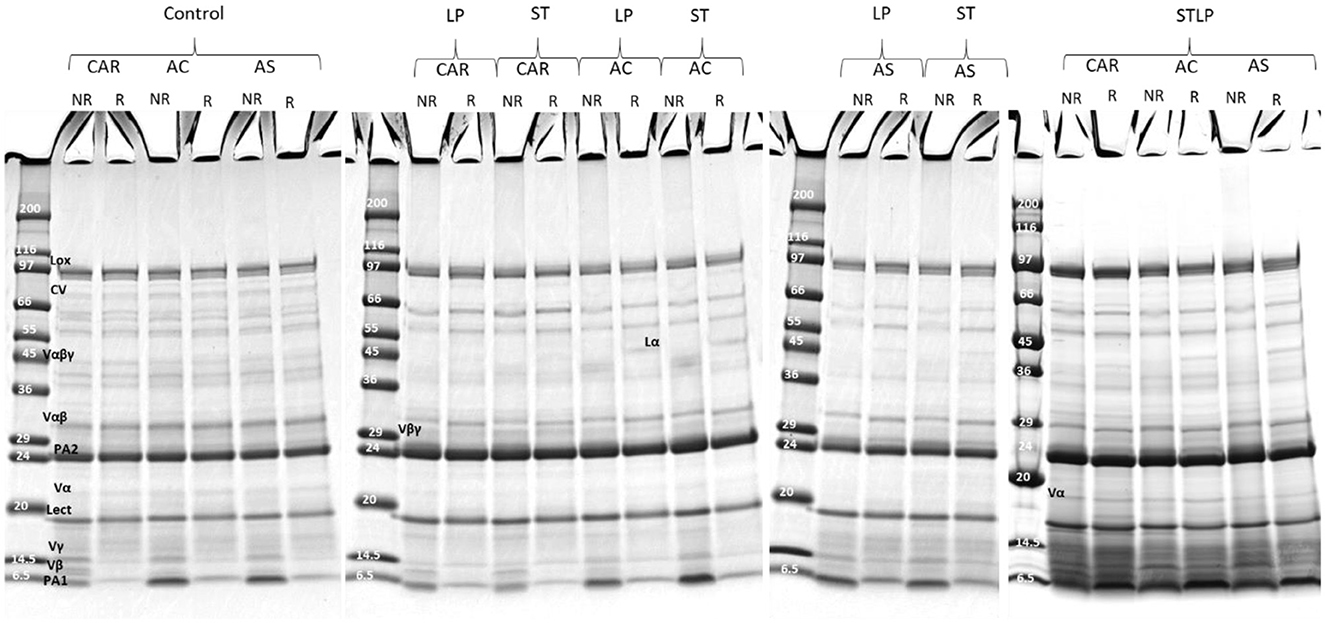
Figure 7. Electrophoresis profile of albumin fractions obtained without (control) or with added fermentation by S. thermophilus (ST), L. plantarum (LP), or their mixture (STLP). Comparison between different pea cultivars: CAR, AC, and AS in non-reducing (NR) and reducing (R) conditions.
The polypeptide profile of globulin fraction (Figure 8) in non-reducing conditions revealed the presence of bands ranging from ~10 to ~99 kDa. In globulin fraction, the 2S albumin subunits (PA2, ~26kDa; PA1, ~6kDa) (87, 90) were clearly absent for all the samples, while different groups of Vαβγ (~50 kDa) and derived subunits, Lαβ (~60 kDa) and its acidic (Lα, ~40 kDa) and basic (Lβ, ~20 kDa) subunits, CV, and LOX were observed for all the samples. As expected, the band corresponding to Lαβ disappeared under reducing conditions while Lα and Lβ bands enlarged significantly. The band corresponding to Vγ (~12–16 kDa) was absent in cultivar AC obtained without fermentation (control) and with co-culture, while this fraction was present for AC obtained by ST and LP. This could be related to the hydrolysis of vicilin monomer by ST and LP. The bands corresponding to vicilin subunits (<24 kDa) in the globulin fraction of co-culture seemed to be narrow, which might also result from the proteolysis of vicilin. At the same time, this could explain why different groups of vicilin subunits were observed in albumin fractions related to co-culture samples.
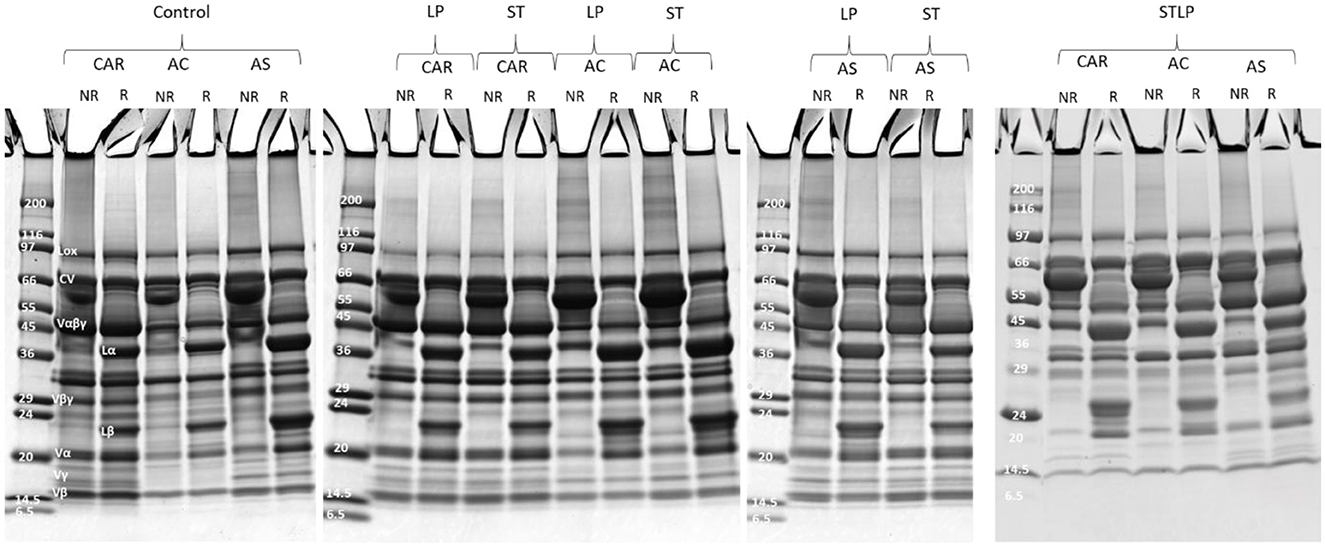
Figure 8. Electrophoresis profile of globulin fractions obtained without (control) or with added fermentation with S. thermophilus (ST), L. plantarum (LP), or their mixture (STLP). Comparison between different pea cultivars: CAR, AC, and AS in non-reducing (NR) and reducing (R) conditions.
SEC-HPLC was performed to study in detail the Mw distribution of peptides (<10 kDa) in the albumin fraction. Figure 9 showed the representative chromatograms for albumin fractions obtained without (control) and with fermentation with ST, LP, and STLP, by comparing the three different pea varieties. Seven different classes of Mw were distinguished in terms of their elution volume. The area of the peaks corresponding to each class was integrated to define the proportions corresponding to the different fractions, considering their sum equal to 100% (Table 3).
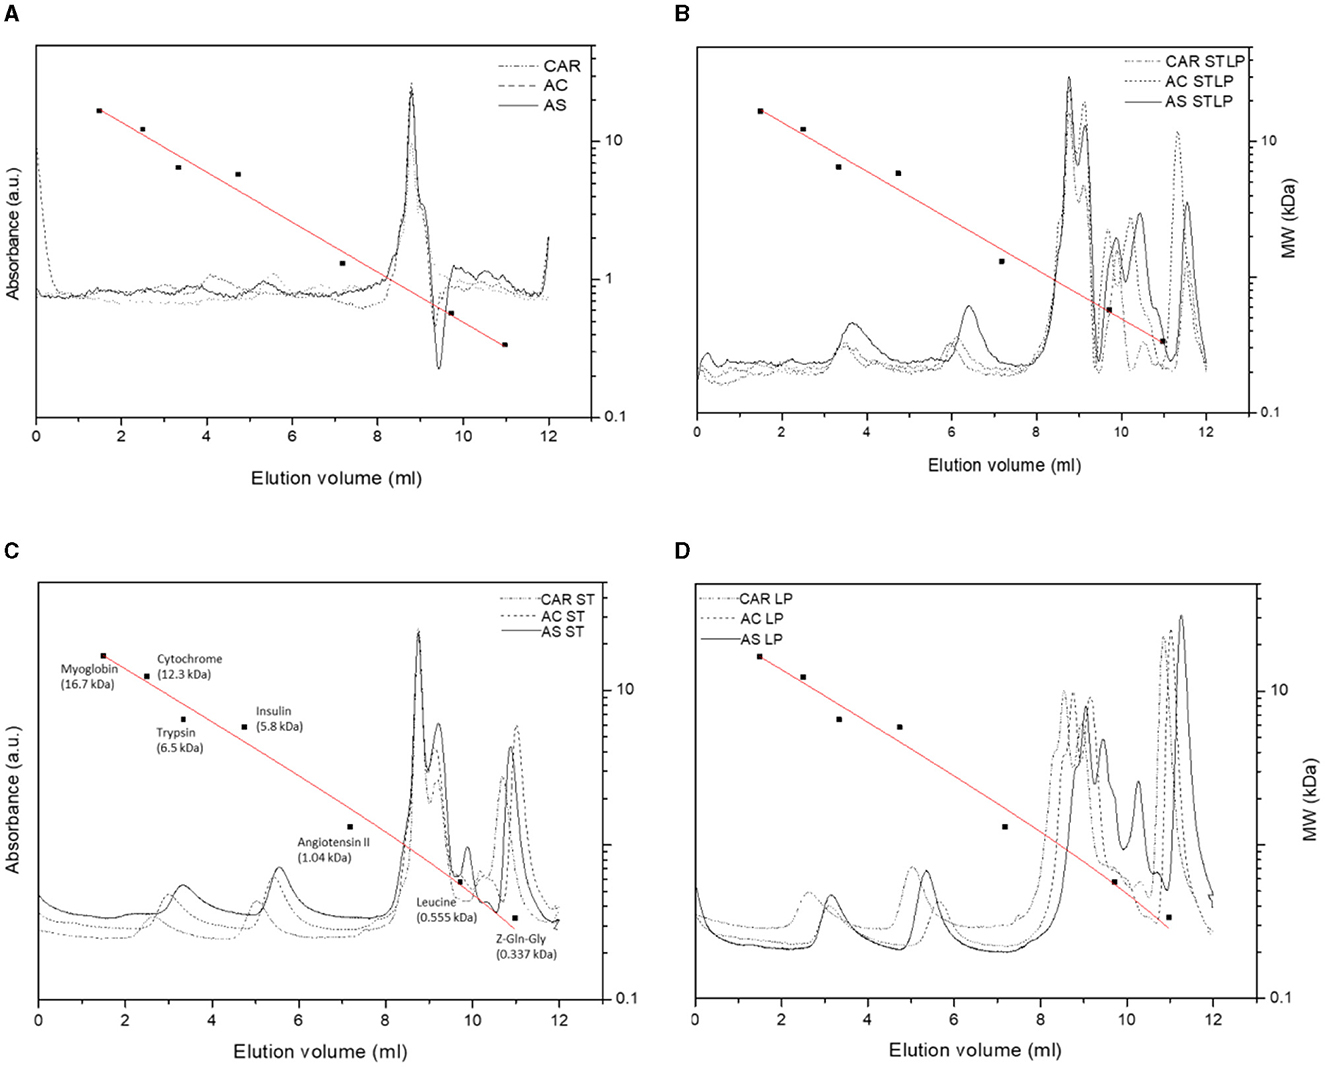
Figure 9. SEC-HPLC chromatograms of albumin fractions obtained without (control) (A) or with added fermentation by S. thermophilus (ST) (C), L. plantarum (LP) (D), or their mixture (STLP) (B). Comparison between different pea cultivars: CAR, AC, and AS. The calibration curve was represented as a red line. Standards names with their corresponding Mw (■) were given in (C). The calibration curve equation and the correlation coefficients were y = −0.18x + 1.503, R2 = 0.986.
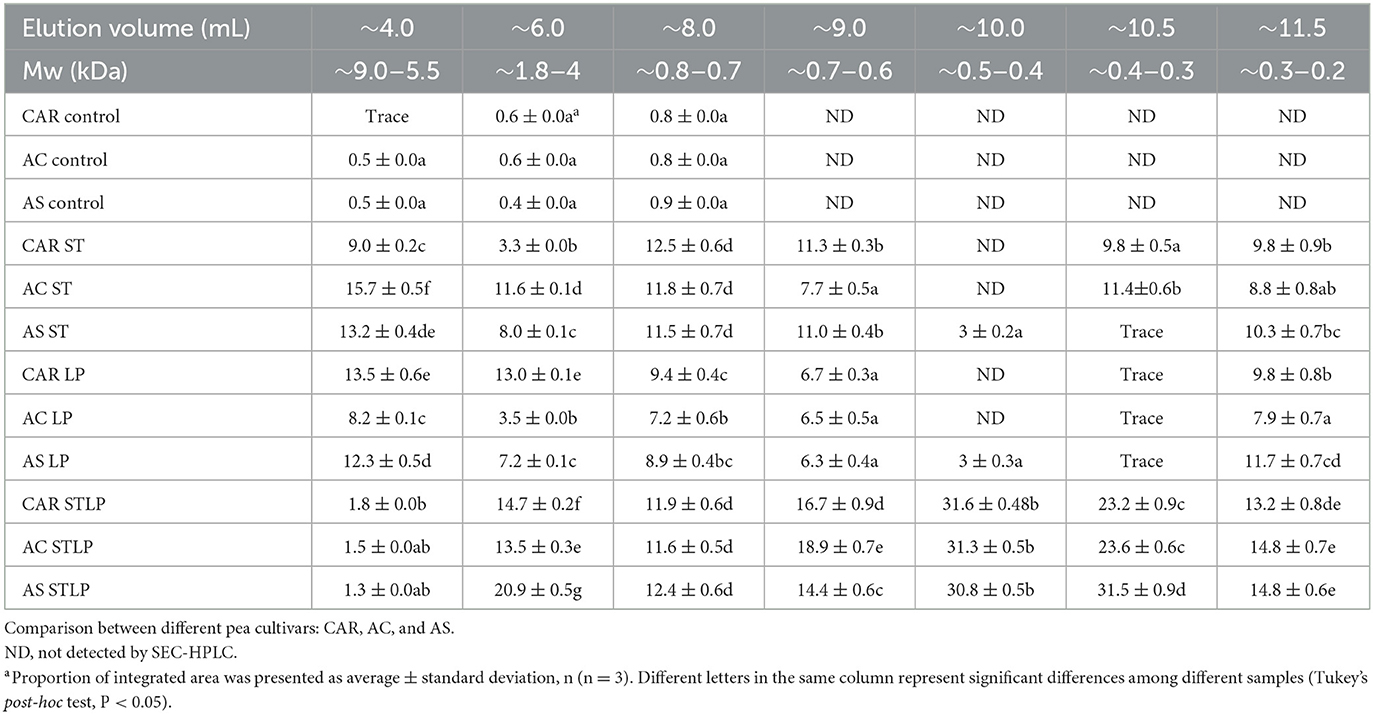
Table 3. Percentage of the integrated area of SEC-HPLC chromatograms at different elution volumes for albumin fractions obtained without (control) or with added fermentation by S. thermophilus (ST), L. plantarum (LP), or their mixture (STLP).
The elution profiles of pea albumin fractions corresponding to control samples (Figure 9A) showed three major peaks (from ~4 to ~10 mL). Two minor peaks at ~,4 and 6 mL elution volume were related to the highest Mw protein components (>2 kDa) of the samples. These two peaks could be assigned to the PA1 protein, which was also observed in the electrophoresis pattern of all the samples at Mw at ~4–6 kDa. These calculated values matched with the ones from the literature (93, 94). The percentage of the integrated area of these two peaks was significantly lower for control (~0.5%) compared to the fermented samples (~13%) (Table 3), which could indicate the occurrence of new polypeptides resulting from LAB proteolytic activity. The third peak was the sharp one, which was observed for all the samples at ~8 mL elution volume representing peptides with Mw of ~0.8 kDa, representing ~0.8% of the integrated area for the control samples. This peak had a higher integrated area for the samples fermented with STLP and ST (~12%) compared to LP (~7.2–9.4%). The four other peaks at higher elution volumes (~9, ~10, ~10.5, and ~11.5 mL) representing lower Mw peptides and amino acids (<0.8 kDa) were only present for fermented samples. The proportion of these peaks was significantly different between the strains and cultivars (Table 3). Fermentation with co-culture led to a higher proportion of these peaks compared to the mono-cultures. A peak at ~10 mL elution volume was only observed for samples fermented with STLP (~31%) and cultivar AS fermented with ST and LP (~3%). In the last case (i.e., for AS), the proportion of this peak seemed to be higher in co-culture compared to ST and LP mono-cultures. The next two peaks at around 10.5 (STLP: ~23–30%, ST: ~9–11%, LP: trace) and 11.5 (STLP: ~13–14%, ST: ~9–10%, LP: ~7–11%) mL elution volume were detected for all the samples. These peaks had higher integrated areas for the samples fermented with STLP compared to mono-cultures. To resume, fermentation, especially with the co-culture, released small oligopeptides/peptides (with Mw ranging from 0.8 to 0.2 kDa) in a higher proportion compared to the controls. These results are in agreement with those obtained before in the SDS-PAGE pattern, and NPN and free amino group content reveal a proteolytic effect. The majority of these peptides were in the range of 0.8 to 0.2 kDa.
Regarding cultivars, the most significant differences were observed at elution volumes ~4 and ~6 mL which belonged to the polypeptides higher than 2 kDa. At elution volume ~4, the highest value was related to AC fermented with ST, followed by CAR fermented with LP. While cultivar AS seemed to have a richer profile in lower Mw peptides than the other two cultivars. Higher production of small peptides and amino acids in AS cultivars was coherent with the results obtained by NPN and free amino group content data.
Trypsin inhibitor activity (TIA) was measured for pea flours of three cultivars (CAR, AC, and AS) and the corresponding albumin fractions obtained without (control) or with fermentation with ST, LP, or their co-culture (STLP) (Figure 10). The amount of TIA in pea flours was around ~14.8 TIU/mg sample with no significant differences between the cultivars. In general, pea is known for having a lower amount of trypsin inhibitor compared to other legumes (8). However, the amount of TIA can be significant in some cultivars and it can vary from 1 to 15 TIU/mg sample depending on the cultivars (95–97). The analysis also showed that the value of TIA in control (~15 TIU/mg sample) of albumin fraction samples did not change significantly from pea flours. This result confirmed the fact that trypsin inhibitor was recovered in the albumin fraction during extraction (98, 99). However, the TIA decreased to around ~8 TIU/mg sample for the fermented albumin fraction samples with again no significant difference within pea varieties. This result might be related to the proteolytic activity of LAB that could affect the native protein structure of trypsin inhibitors. The decreased level of TIA after fermentation with LAB in pea has been reported previously. For instance, Ma et al. (100) reported a reduction of ~50% in TIA of pea seeds fermented with a mixed LAB culture (containing S. thermophilus, L. bulgaricus, and L. acidophilus). Cabuk et al. (27) observed that the content of TIA in pea protein isolate dropped around 18% to 50% (as the fermentation time increased) after fermentation with L. plantarum. Byanju et al. (101) reported the fermentation of green pea with L. plantarum reduced TIA by ~47%. In the present study, no significant difference was observed between the mono-culture samples. However, the value of TIA was lower for the samples fermented with co-culture (~6.8 TIU/mg sample) compared to the mono-culture samples, pointing out again higher proteolytic activity of STLP compared to ST or LP alone; as it was previously observed in soy milk fermentation with co-culture of S. thermophilus and L. plantarum by Madjirebaye et al. (83).
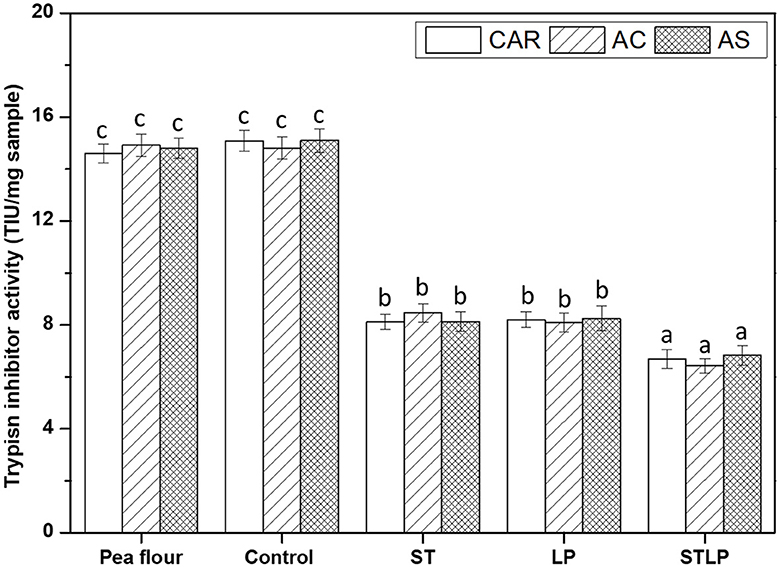
Figure 10. Trypsin inhibitor activity (trypsin inhibitor unit/mg sample) of albumin fractions obtained without (control) or with added fermentation by S. thermophilus (ST), L. plantarum (LP), or their mixture (STLP). Comparison between different pea cultivars: CAR, AC, and AS. Different letters represent significant differences among different samples (Tukey's post-hoc test, P < 0.05).
The antioxidant activity of albumin samples obtained without (control) and with fermentation with ST, LP, and their co-culture (STLP) was evaluated to determine whether the evidenced production of small peptides could induce enhanced antioxidant activity. As shown in Figure 11, DPPH scavenging activity (Figure 11A) and TEAC (Figure 11B) in fermented samples was ~2–3 times higher than control. This indicated a correlation between the two methods used for measuring antioxidant activity. The value of DPPH scavenging was ~23% in control, while this value was ~45% for mono-cultures and ~56% for co-cultures. TEAC was ~0.1 (nmol Trolox equivalent/μL sample) for control. In fermented samples, this value was ~0.5 (nmol Trolox equivalent/μL sample) for mono-cultures and ~0.65 (nmol Trolox equivalent/μL sample) for co-cultures. The improved antioxidant activity for fermented samples could be associated with the production of peptides during fermentation. Release of small peptides with antioxidant activity from legumes has been reported several times. For instance, Leksono et al. (102) reported an increase in the antioxidant activity of black soybean milk fermented with S. thermophilus and L. plantarum mono-cultures. They also observed a similar pattern in increasing the antioxidant activity between the strains. Sáez et al. (103) observed that chickpea fermented with L. plantarum had a 40% increase in antioxidant activity compared to control. Torino et al. (104) also reported an increase in the antioxidant capacity of lentil fermented with LP. Naprasrt et al. (105) observed that the antioxidant activity of fermented red bean milk was two times higher than unfermented red bean milk, and the highest value among different LAB was related to L. plantarum. Contrary to the results of the present study, Lee et al. (106) reported that, in the fermentation of black soymilk with S. thermophilus and its co-culture with L. plantarum, the highest antioxidant activity belonged to mono-culture compared to co-culture.
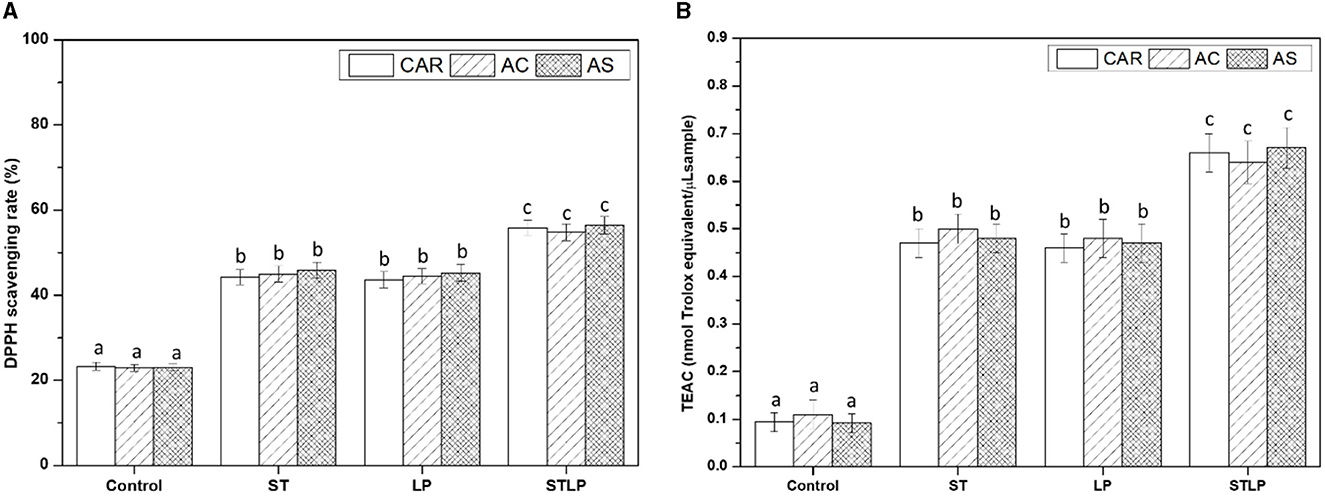
Figure 11. DPPH radical scavenging capacity (A) and Trolox equivalent antioxidant capacity (TEAC) (B) of albumin fractions obtained without (control) or with added fermentation by S. thermophilus (ST), L. plantarum (LP), or their mixture (STLP). Comparison between different pea cultivars: CAR, AC, and AS. Different letters represent significant differences among different samples (Tukey's post-hoc test, P < 0.05).
Phytic acid content was measured for pea flour of the three cultivars (CAR, AC, and AS), and the corresponding albumin fractions were obtained without (control) or with fermentation with ST, LP, or their mixture (STLP) (Figure 12). The content of phytic acid in pea cultivars AS and AC was ~0.9 mg/g of flour sample on a dry basis, while this value was significantly lower in CAR (~0.8 mg/g flour). In addition, there was a significant reduction in the amount of phytic acid for albumin fractions in control (~0.2 mg/g freeze-dried albumin sample) compared to flour. It could be possible that, during the extraction of pea protein, phytic acid initially present in protein bodies was not totally solubilized or that insoluble complexes were formed with other compounds such as globulins and divalent cations (11). The reduction of phytic acid in albumin fractions can also be explained by the endogenous phytase activity of legumes, as phytase is primarily located in the protein bodies (107). The content of phytic acid in fermented (~0.06–0.09 mg/g freeze-dried albumin sample) samples was 2–3 times lower than control. The degradation of phytic acid in fermented samples could be mainly related to the microbial phytase activity of both ST and LP (108). LP and ST are both able to produce phytase. Sumengen et al. (109) reported high intra- and extra-cellular phytase activity for L. plantarum. A high phytase activity was also reported for S. thermophilus by Priyodip and Balaji (110, 111). However, in the present study, no significant differences were observed between the strains, which could suggest the similar activity of phytase among ST and LP. Several articles have proven the phytic acid reduction in other fermented legume samples by these bacteria species. For instance, Xing et al. (112) showed the degradation of phytic acid in chickpea protein concentrate after fermentation with different LAB species. Fritsch et al. (30) also observed a reduction of phytic acid content by more than half in lupin protein isolate fermented with L. plantarum. Rui et al. (113) reported a reduction of 50% in the content of phytic acid (~3 mg/g sample) for soy seeds fermented with L. plantarum. Mefleh et al. (114) reported ~70% reduction in phytic acid content for chickpea protein isolate fermented with S. thermophilus mono-culture and its co-culture with L. plantarum.

Figure 12. The phytic acid content of albumin fractions obtained without (control) or with added fermentation by S. thermophilus (ST), L. plantarum (LP), or their mixture (STLP). Comparison between different pea cultivars: CAR, AC, and AS. Different letters represent significant differences among different samples (Tukey's post-hoc test, P < 0.05).
The results from the study supported the hypothesis that AEIEP extraction assisted by LAB fermentation improves the nutritional quality of albumin fraction extracted from peas compared to the traditional AEIEP method without impairing the protein profile of the globulin fraction. Using ST, LP, and their co-culture allowed modifications in protein composition by increasing nitrogen and peptide contents, increasing antioxidant activity, and reducing antinutritional compounds such as trypsin inhibitors, α-galactosides, and phytic acid. These effects were mainly associated with the enzymatic activity of the selected LAB strains during fermentation. However, these changes depended on the microorganism used. In particular, the co-culture showed the highest level of proteolysis and the highest production of small peptides, which was related to the synergetic effect of the bacteria. Moreover, the main properties studied in this report did not seem to be pea genotype-dependent. These results indicate the possibility of tailoring properties of the still underutilized albumin fraction depending on its application. Despite the nitrogen enrichment of this fraction, the protein content remains low (~25–30%) to be considered as a protein ingredient, indicating the necessity for additional purification. While the primary focus of this study centered on the nutritional aspects of the albumin fraction, it would be intriguing to explore the presence of these antinutritional compounds in the globulin fraction as well, which is the most used fraction. Additionally, evaluating the physicochemical and functional properties of both fractions is essential to comprehensively assess the impact of fermentation. Furthermore, considering fermentation as a means to enhance the sensory attributes of these pea protein fractions could be advantageous for their increased utilization in plant-based food products.
The original contributions presented in the study are included in the article/supplementary material, further inquiries can be directed to the corresponding author.
ME: Investigation, Methodology, Validation, Visualization, Writing—original draft. SM: Investigation, Methodology, Validation, Visualization, Writing—review & editing. BO: Conceptualization, Methodology, Supervision, Writing—review & editing. RS: Conceptualization, Methodology, Project administration, Supervision, Writing—review & editing.
The author(s) declare financial support was received for the research, authorship, and/or publication of this article. This work was supported by the French Agence Nationale de la Recherche (ANR PEAVALUE project, grant ANR-19-CE21-0008-03) and by the European Regional Development Fund (FEDER-FSE Bourgogne 2014/2020, grant No. BG0025913).
The authors would like to thank the DIVVA (Développement Innovation Vigne Vin Aliments) platform for the access to the equipment. The authors also thank Mariane Rizkallah for her help during the experiments.
The authors declare that the research was conducted in the absence of any commercial or financial relationships that could be construed as a potential conflict of interest.
All claims expressed in this article are solely those of the authors and do not necessarily represent those of their affiliated organizations, or those of the publisher, the editors and the reviewers. Any product that may be evaluated in this article, or claim that may be made by its manufacturer, is not guaranteed or endorsed by the publisher.
1. Arbab Sakandar H, Chen Y, Peng C, Chen X, Imran M, Zhang H. Impact of fermentation on antinutritional factors and protein degradation of legume seeds: a review. Food Rev Int. (2023) 39:1227–49. doi: 10.1080/87559129.2021.1931300
2. Fang L, Xiang H, Sun-Waterhouse D, Cui C, Lin J. Enhancing the usability of pea protein isolate in food applications through modifying its structural and sensory properties via deamidation by glutaminase. J Agric Food Chem. (2020) 68:1691–7. doi: 10.1021/acs.jafc.9b06046
3. Ge J, Sun CX, Corke H, Gul K, Gan RY, Fang Y. The health benefits. Functional properties, modifications, and applications of pea (Pisum sativum L) protein: Current status, challenges, and perspectives. Compr Rev Food Sci Food Saf. (2020) 19:1835–76. doi: 10.1111/1541-4337.12573
4. Barać MB, Pešić MB, Stanojević SP, Kostić AŽ, Cabrilo SB. Techno-functional properties of pea (Pisum sativum) protein isolates: a review. APTEFF. (2015) 46:1–18. doi: 10.2298/APT1546001B
5. Boye J, Aksay S, Roufik S, Ribéreau S, Mondor M, Farnworth E, et al. Comparison of the functional properties of pea, chickpea and lentil protein concentrates processed using ultrafiltration and isoelectric precipitation techniques. Food Res Int. (2010) 43:537–46. doi: 10.1016/j.foodres.2009.07.021
6. Le Gall M, Quillien, Sève B, Guéguen J, Lallès JP. Weaned piglets display low gastrointestinal digestion of pea (Pisum sativum L.) lectin and pea albumin 2. J Anim Sci. (2007) 85:2972–81. doi: 10.2527/jas.2006-795
7. Szymanowska U, Jakubczyk A, Baraniak B, Kur A. Characterisation of lipoxygenase from pea seeds (Pisum sativum var. Telephone L). Food Chem. (2009) 116:906–10. doi: 10.1016/j.foodchem.2009.03.045
8. Bacon J, Lambert N, Matthews P, Arthur A, Duchene C. Genotype, environment and genotype × environment effects on trypsin inhibitor in peas. J Sci Food Agric. (1995) 67:101–8. doi: 10.1002/jsfa.2740670116
9. Jones D, DuPont MS, Ambrose M, Frías J, Hedley CL. The discovery of compositional variation for the raffinose family of oligosaccharides in pea seeds. Seed Sci Res. (1999) 9:305–10. doi: 10.1017/S0960258599000318
10. Teixeira JS, McNeill V, Gänzle MG. Levansucrase and sucrose phoshorylase contribute to raffinose, stachyose, and verbascose metabolism by lactobacilli. Food Microbiol. (2012) 31:278–84. doi: 10.1016/j.fm.2012.03.003
11. Amat T, Assifaoui A, Schmitt C, Saurel R. Importance of binary and ternary complex formation on the functional and nutritional properties of legume proteins in presence of phytic acid and calcium. Crit Rev Food Sci Nutr. (2022) 1–23. doi: 10.1080/10408398.2022.2098247
12. Urbano G, Lopez-Jurado M, Aranda P, Vidal-Valverde C, Tenorio E, Porres J. The role of phytic acid in legumes: antinutrient or beneficial function? J. Physiol Biochem. (2000) 56:283–94. doi: 10.1007/BF03179796
13. Samtiya M, Aluko RE, Dhewa T. Plant food anti-nutritional factors and their reduction strategies: an overview. Food Prod Proc Nutr. (2020) 2:1–14. doi: 10.1186/s43014-020-0020-5
14. Tiwari BK, Singh N. Pulse Chemistry and Technology. Cambridge, UK: Royal Society of Chemistry. (2012). doi: 10.1039/9781839169038
15. Schroeder HE. Quantitative studies on the cotyledonary proteins in the genus Pisum. J Sci Food Agric. (1982) 33:623–33. doi: 10.1002/jsfa.2740330707
16. Tzitzikas EN, Vincken J-P, de Groot J, Gruppen H, Visser RG. Genetic variation in pea seed globulin composition. J Agric Food Chem. (2006) 54:425–33. doi: 10.1021/jf0519008
17. Wang N, Daun JK. Effect of variety and crude protein content on nutrients and certain antinutrients in field peas (Pisum sativum). J Sci Food Agric. (2004) 84:1021–9. doi: 10.1002/jsfa.1742
18. Lam A, Can Karaca A, Tyler R, Nickerson M. Pea protein isolates: Structure, extraction, and functionalityPea protein isolates: Structure, extraction, and functionality. Food Rev Int. (2018) 34:126–47. doi: 10.1080/87559129.2016.1242135
19. Owusu-Ansah YJ, McCurdy SM. Pea proteins: a review of chemistry, technology of production, and utilization. Food Rev Int. (1991) 7:103–34. doi: 10.1080/87559129109540903
20. Tanger C, Engel J, Kulozik U. Influence of extraction conditions on the conformational alteration of pea protein extracted from pea flour. Food Hydrocoll. (2020) 105949. doi: 10.1016/j.foodhyd.2020.105949
21. Djemaoune Y, Cases E, Saurel R. The effect of high-pressure microfluidization treatment on the foaming properties of pea albumin aggregates. J Food Sci. (2019) 84:2242–9. doi: 10.1111/1750-3841.14734
22. Klupsaite D, Juodeikiene G, Zadeike D, Bartkiene E, Maknickiene Z, Liutkute G. The influence of lactic acid fermentation on functional properties of narrow-leaved lupine protein as functional additive for higher value wheat bread. LWT. (2017) 75:180–6. doi: 10.1016/j.lwt.2016.08.058
23. Meinlschmidt P, Ueberham E, Lehmann J, Schweiggert-Weisz U, Eisner P. Immunoreactivity, sensory and physicochemical properties of fermented soy protein isolate. Food Chem. (2016) 205:229–38. doi: 10.1016/j.foodchem.2016.03.016
24. Aderinola TA, Duodu KG. Production, health-promoting properties and characterization of bioactive peptides from cereal and legume grains. BioFactors. (2022) 48:972–92. doi: 10.1002/biof.1889
25. Malaguti M, Dinelli G, Leoncini E, Bregola V, Bosi S, Cicero AF, et al. Bioactive peptides in cereals and legumes: agronomical, biochemical and clinical aspects. Int J Mol Sci. (2014) 15:21120–35. doi: 10.3390/ijms151121120
26. Stanisavljevic N, Vukotic G, Pastor F, Suznjevic D, Jovanovic Z, Strahinic I, et al. Antioxidant activity of pea protein hydrolysates produced by batch fermentation with lactic acid bacteria. Arch Biol Sci. (2015) 67:1033–42. doi: 10.2298/ABS150130066S
27. Cabuk B, Nosworthy MG, Stone AK, Korber DR, Tanaka T, House JD, et al. Effect of fermentation on the protein digestibility and levels of non-nutritive compounds of pea protein concentrate. Food Technol Biotechnol. (2018) 56:257–64. doi: 10.17113/ftb.56.02.18.5450
28. Cabuk B, Stone AK, Korber DR, Tanaka T, Nickerson MT. Effect of Lactobacillus plantarum fermentation on the surface and functional properties of pea protein-enriched flour. Food Technol Biotechnol. (2018) 56:411–20. doi: 10.17113/ftb.56.03.18.5449
29. De Pasquale I, Pontonio E, Gobbetti M, Rizzello CG. Nutritional and functional effects of the lactic acid bacteria fermentation on gelatinized legume flours. Int J Food Microbiol. (2020) 316:108426. doi: 10.1016/j.ijfoodmicro.2019.108426
30. Fritsch C, Vogel RF, Toelstede S. Fermentation performance of lactic acid bacteria in different lupin substrates—influence and degradation ability of antinutritives and secondary plant metabolites. J Appl Microbiol. (2015) 119:1075–88. doi: 10.1111/jam.12908
31. Rui X, Zhang Q, Huang J, Li W, Chen X, Jiang M, et al. Does lactic fermentation influence soy yogurt protein digestibility: a comparative study between soymilk and soy yogurt at different pH. J Sci Food Agric. (2019) 99:861–7. doi: 10.1002/jsfa.9256
32. Schindler S, Wittig M, Zelena K, Krings U, Bez J, Eisner P, et al. Lactic fermentation to improve the aroma of protein extracts of sweet lupin (Lupinus angustifolius). Food Chem. (2011) 128:330–7. doi: 10.1016/j.foodchem.2011.03.024
33. Schindler S, Zelena K, Krings U, Bez J, Eisner P, Berger RG. Improvement of the aroma of pea (Pisum sativum) protein extracts by lactic acid fermentation. Food Biotechnol. (2012) 26:58–74. doi: 10.1080/08905436.2011.645939
34. Shi Y, Singh A, Kitts D, Pratap-Singh A. Lactic acid fermentation: A novel approach to eliminate unpleasant aroma in pea protein isolates. LWT. (2021) 111927. doi: 10.1016/j.lwt.2021.111927
35. Emkani M, Oliete B, Saurel R. Pea protein extraction assisted by lactic fermentation: Impact on protein profile and thermal properties. Foods. (2021) 10:549. doi: 10.3390/foods10030549
36. Malley A, Baecher L, Mackler B, Perlman F. The isolation of allergens from the green pea. J Allergy Clin Immunol. (1975) 56:282–90. doi: 10.1016/0091-6749(75)90102-5
37. Moreno FJ, Clemente A. 2S albumin storage proteins: what makes them food allergens? Open Biochem J. (2008) 2:16. doi: 10.2174/1874091X00802010016
38. Sell M, Steinhart H, Paschke A. Influence of maturation on the alteration of allergenicity of green pea (Pisum sativum L.). J Agric Food Chem. (2005) 53:1717–22. doi: 10.1021/jf030801w
39. Yang J, Kornet R, Diedericks CF, Yang Q, Berton-Carabin CC, Nikiforidis CV, et al. Rethinking plant protein extraction: albumin—From side stream to an excellent foaming ingredient. Food Structure. (2022) 31:100254. doi: 10.1016/j.foostr.2022.100254
40. Croy RR, Hoque MS, Gatehouse JA, Boulter D. The major albumin proteins from pea (Pisum sativum L). Purification and some properties. Biochem J. (1984) 218:795–803. doi: 10.1042/bj2180795
41. Davies DR. Variation in the storage proteins of peas in relation to sulphur amino-acid content. Euphytica. (1976) 25:717–24. doi: 10.1007/BF00041611
42. Lu BY, Quillien L, Popineau Y. Foaming and emulsifying properties of pea albumin fractions and partial characterisation of surface-active components. J Sci Food Agric. (2000) 80:1964–72. doi: 10.1002/1097-0010(200010)80:13<1964::AID-JSFA737>3.0.CO;2-J
43. Kornet R, Yang J, Venema P, van der Linden E, Sagis LM. Optimizing pea protein fractionation to yield protein fractions with a high foaming and emulsifying capacity. Food Hydrocoll. (2022) 126:107456. doi: 10.1016/j.foodhyd.2021.107456
44. Mandha J, Shumoy H, Devaere J, Schouteten JJ, Gellynck X, De Winne A, et al. Effect of lactic acid fermentation on volatile compounds and sensory characteristics of mango (Mangifera indica) juices. Foods. (2022) 11:383. doi: 10.3390/foods11030383
45. Smetanková J, Hladíková Z, Valach F, Zimanová M, Kohajdová Z, Greif G, et al. Influence of aerobic and anaerobic conditions on the growth and metabolism of selected strains of Lactobacillus plantarum. Acta Chimica Slovaca. (2012) 5:204. doi: 10.2478/v10188-012-0031-1
46. Arteaga VG, Leffler S, Muranyi I, Eisner P, Schweiggert-Weisz U. Sensory profile, functional properties and molecular weight distribution of fermented pea protein isolate. Curr Res Food Sci. (2021) 4:1–10. doi: 10.1016/j.crfs.2020.12.001
47. Czarnecka M, Czarnecki Z, Nowak J, Roszyk H. Effect of lactic fermentation and extrusion of bean and pea seeds on nutritional and functional properties. Food/Nahrung. (1998) 42:7–11.
48. Li C, Chen X, Jin Z, Gu Z, Rao J, Chen B. Physicochemical property changes and aroma differences of fermented yellow pea flours: role of Lactobacilli and fermentation time. Food Funct. (2021) 12:6950–63. doi: 10.1039/D1FO00608H
49. Galia W, Perrin C, Genay M, Dary A. Variability and molecular typing of Streptococcus thermophilus strains displaying different proteolytic and acidifying properties. Int Dairy J. (2009) 19:89–95. doi: 10.1016/j.idairyj.2008.08.004
50. Iyer R, Tomar S, Maheswari TU, Singh R. Streptococcus thermophilus strains: Multifunctional lactic acid bacteria. Int Dairy J. (2010) 20:133–41. doi: 10.1016/j.idairyj.2009.10.005
51. Ben-Harb S, Saint-Eve A, Panouillé M, Souchon I, Bonnarme P, Dugat-Bony E, et al. Design of microbial consortia for the fermentation of pea-protein-enriched emulsions. Int J Food Microbiol. (2019) 293:124–36. doi: 10.1016/j.ijfoodmicro.2019.01.012
52. Narala VR, Jugbarde MA, Orlovs I, Masin M. Inulin as a prebiotic for the growth of vegan yoghurt culture in pea protein-based vegan yoghurt-ice cream, while improving the textural properties. Appl Food Research. (2022) 2:100136. doi: 10.1016/j.afres.2022.100136
53. Yousseef M, Lubbers S, Housson F, Valentin D. Sensory evaluation as a tool in assessing the quality of new fermented products. J Sci Technol Dev. (2014) 17:63–71. doi: 10.32508/stdj.v17i3.1501
54. Sosulski F, Holt N. Amino acid composition and nitrogen-to-protein factors for grain legumes. Can J Plant Sci. (1980) 60:1327–31. doi: 10.4141/cjps80-187
55. Windham W. AOAC Official Method 942.05, Ash of Animal Feed. Official Methods of Analysis of AOAC International. McLean, VA: AOAC INTERNATIONAL (1995).
56. AOAC. Moisture in Malt Gravimetric Method (935.29). Gaithersburg, MD: AOAC INTERNATIONAL (2000).
57. Derbyshire E, Wright D, Boulter D. Legumin and vicilin, storage proteins of legume seeds. Phytochemistry. (1976) 15:3–24. doi: 10.1016/S0031-9422(00)89046-9
58. Oliete B, Yassine SA, Cases E, Saurel R. Drying method determines the structure and the solubility of microfluidized pea globulin aggregates. Food Res Int. (2019) 119:444–54. doi: 10.1016/j.foodres.2019.02.015
59. Spinnler HE, Corrieu G. Automatic method to quantify starter activity based on pH measurement. J Dairy Res. (1989) 56:755–64. doi: 10.1017/S0022029900029332
60. Adler-Nissen J. Determination of the degree of hydrolysis of food protein hydrolysates by trinitrobenzenesulfonic acid. J Agric Food Chem. (1979) 27:1256–62. doi: 10.1021/jf60226a042
61. Brand-Williams W, Cuvelier M-E, Berset C. Use of a free radical method to evaluate antioxidant activity. LWT. (1995) 28:25–30. doi: 10.1016/S0023-6438(95)80008-5
62. Smith C, Van Megen W, Twaalfhoven L, Hitchcock C. The determination of trypsin inhibitor levels in foodstuffs. J Sci Food Agric. (1980) 31:341–50. doi: 10.1002/jsfa.2740310403
63. Davies N, Reid H. An evaluation of the phytate, zinc, copper, iron and manganese contents of, and Zn availability from, soya-based textured-vegetable-protein meat-substitutes or meat-extenders. Br J Nutr. (1979) 41:579–89. doi: 10.1079/BJN19790073
64. Mishra S, Mishra H. Effect of synbiotic interaction of fructooligosaccharide and probiotics on the acidification profile, textural and rheological characteristics of fermented soy milk. Food Bioproc Technol. (2013) 6:3166–76. doi: 10.1007/s11947-012-1021-4
65. Li S, Tang S, He Q, Hu J, Zheng J. In vitro antioxidant and angiotensin-converting enzyme inhibitory activity of fermented milk with different culture combinations. J Dairy Sci. (2020) 103:1120–30. doi: 10.3168/jds.2019-17165
66. Mital BK, Steinkraus KH. Fermentation of soy milk by lactic acid bacteria. A Review J Food Prot. (1979) 42:895–9. doi: 10.4315/0362-028X-42.11.895
67. Cui Y, Wang M, Zheng Y, Miao K, Qu X. The carbohydrate metabolism of Lactiplantibacillus plantarum. Int J Mol Sci. (2021) 22:13452. doi: 10.3390/ijms222413452
68. Donkor ON, Henriksson A, Vasiljevic T, Shah N. α-Galactosidase and proteolytic activities of selected probiotic and dairy cultures in fermented soymilk. Food Chem. (2007) 104:10–20. doi: 10.1016/j.foodchem.2006.10.065
69. Simović M, Banjanac K, Corović M, Jakovetić S, Milivojević A, Vukašinović-Sekulić M, et al. Selection of lactic acid bacteria strain for simultaneous production of α-and β-galactosidases. Zaštita materijala. (2016) 57:265–73. doi: 10.5937/ZasMat1602265c
70. Delgado-Fernandez P, Plaza-Vinuesa L, Hernandez-Hernandez O, de Las Rivas B, Corzo N, Muñoz R, et al. Unravelling the carbohydrate specificity of MelA from Lactobacillus plantarum WCFS1: an α-galactosidase displaying regioselective transgalactosylation. Int J Biol Macromol. (2020) 153:1070–9. doi: 10.1016/j.ijbiomac.2019.10.237
71. Silvestroni A, Connes C, Sesma F, De Giori GS, Piard J-C. Characterization of the melA locus for α-galactosidase in Lactobacillus plantarum. Appl Environ Microbiol. (2002) 68:5464–71. doi: 10.1128/AEM.68.11.5464-5471.2002
72. Anisha GS. Microbial α-galactosidases: Efficient biocatalysts for bioprocess technology. Bioresour Technol. (2022) 344:126293. doi: 10.1016/j.biortech.2021.126293
73. Wang R, Sun J, Lassabliere B, Yu B, Liu SQ. Green tea fermentation with Saccharomyces boulardii CNCM I-745 and Lactiplantibacillus plantarum 299V. LWT. (2022) 157:113081. doi: 10.1016/j.lwt.2022.113081
74. Garro MS, de Valdez GF, Oliver G, de Giori GS. Growth characteristics and fermentation products of Streptococcus salivarius subsp. Thermophilus, Lactobacillus casei and L fermentum in soymilk. Zeitschrift für Lebensmitteluntersuchung und-Forschung A. (1998) 206:72–5. doi: 10.1007/s002170050217
75. Ibrahim FS, Babiker EE, Yousif NE, El Tinay AH. Effect of fermentation on biochemical and sensory characteristics of sorghum flour supplemented with whey protein. Food Chem. (2005) 92:285–92. doi: 10.1016/j.foodchem.2004.07.024
76. Soni SK, Sandhu DK. Fermentation of Idli: effects of changes in raw material and physico-chemical conditions. J Cereal Sci. (1989) 10:227–38. doi: 10.1016/S0733-5210(89)80052-9
77. Yousif NE, El Tinay AH. Effect of fermentation on sorghum protein fractions and in vitro protein digestibility. Plant Foods Hum Nutr. (2001) 56:175–82. doi: 10.1023/A:1011140602122
78. Periago M, Ros G, Martinez C, Rincón F. Variations of non-protein nitrogen in six Spanish legumes according to the extraction method used. Food Res Int. (1996) 29:489–94. doi: 10.1016/S0963-9969(96)00053-1
79. Rui X, Huang J, Xing G, Zhang Q, Li W, Dong M. Changes in soy protein immunoglobulin E reactivity, protein degradation, and conformation through fermentation with Lactobacillus plantarum strains. Lwt. (2019) 99:156–65. doi: 10.1016/j.lwt.2018.09.034
80. Oyedoh P, Oshoma C, Ikenebumeh M. Antibacterial metabolites obtained from fermentation of peanut and cowpea by Lactobacillus Spp. J Appl Sci Environm Manage. (2020) 24:1827–34. doi: 10.4314/jasem.v24i10.18
81. Hati S, Patel N, Mandal S. Comparative growth behaviour and biofunctionality of lactic acid bacteria during fermentation of soy milk and bovine milk. Probiotics Antimicrob Proteins. (2018) 10:277–83. doi: 10.1007/s12602-017-9279-5
82. Boulay M, Al Haddad M, Rul F. Streptococcus thermophilus growth in soya milk: Sucrose consumption, nitrogen metabolism, soya protein hydrolysis and role of the cell-wall protease PrtS. Int J Food Microbiol. (2020) 335:108903. doi: 10.1016/j.ijfoodmicro.2020.108903
83. Madjirebaye P, Peng F, Huang T, Liu Z, Mueed A, Pahane MM, et al. Effects of fermentation conditions on bioactive substances in lactic acid bacteria-fermented soymilk and its storage stability assessment. Food Biosci. (2022) 50:102207. doi: 10.1016/j.fbio.2022.102207
84. Li S, Tang S, He Q, Hu J, Zheng J. Changes in proteolysis in fermented milk produced by Streptococcus thermophilus in co-culture with Lactobacillus plantarum or Bifidobacterium animalis subsp. lactis during refrigerated storage. Molecules. (2019) 24:3699. doi: 10.3390/molecules24203699
85. Lim YH, Foo HL, Loh TC, Mohamad R, Abdullah N. Comparative studies of versatile extracellular proteolytic activities of lactic acid bacteria and their potential for extracellular amino acid productions as feed supplements. J Anim Sci Biotechnol. (2019) 10:1–13. doi: 10.1186/s40104-019-0323-z
86. Shand P, Ya H, Pietrasik Z, Wanasundara P. Physicochemical and textural properties of heat-induced pea protein isolate gels. Food Chem. (2007) 102:1119–30. doi: 10.1016/j.foodchem.2006.06.060
87. Dziuba J, Szerszunowicz I, Nałecz D, Dziuba M. Proteomic analysis of albumin and globulin fractions of pea (Pisum sativum L.) seeds. Acta Scientiarum Polonorum Technologia Alimentaria. (2014) 13:181–90. doi: 10.17306/J.AFS.2014.2.7
88. Gatehouse JA, Lycett G, Croy R, Boulter D. The post-translational proteolysis of the subunits of vicilin from pea (Pisum sativum L.). Biochem J. (1982) 207:629–32. doi: 10.1042/bj2070629
89. Crévieu I, Berot S, Guéguen J. Large scale procedure for fractionation of albumins and globulins from pea seeds. Food/Nahrung. (1996) 40:237–44. doi: 10.1002/food.19960400502
90. Gruen LC, Guthrie RE, Blagrove RJ. Structure of a major pea seed albumin: implication of a free sulphydryl group. J Sci Food Agric. (1987) 41:167–78. doi: 10.1002/jsfa.2740410210
91. Liang H-N, Tang C-H. pH-dependent emulsifying properties of pea [Pisum sativum (L.)] proteins. Food Hydrocolloids. (2013) 33:309–19. doi: 10.1016/j.foodhyd.2013.04.005
92. Barkholt V, Jorgensen PB, Sorensen D, Bahrenscheer J, Haikara A, Lemola E, et al. Protein modification by fermentation: effect of fermentation on the potential allergenicity of pea. Allergy. (1998) 53:106–8. doi: 10.1111/j.1398-9995.1998.tb04976.x
93. Eyraud V, Karaki L, Rahioui I, Sivignon C, Da Silva P, Rahbé Y, et al. Expression and biological activity of the cystine knot bioinsecticide PA1b (Pea Albumin 1 Subunit b). PLoS One. (2013) 8:e81619. doi: 10.1371/journal.pone.0081619
94. Gressent F, Da Silva P, Eyraud V, Karaki L, Royer C. Pea Albumin 1 subunit b (PA1b), a promising bioinsecticide of plant origin. Toxins (Basel). (2011) 3:1502–17. doi: 10.3390/toxins3121502
95. Bacon J, Wanigatunga S, An J, Fenwick G. A microassay for the analysis of trypsin inhibitor activity in peas. Food Chem. (1995) 52:77–80. doi: 10.1016/0308-8146(94)P4184-H
96. Griffiths DW. The trypsin and chymotrypsin inhibitor activities of various pea (Pisum spp.) and field bean (Vicia faba) cultivars. J Sci Food Agric. (1984) 35:481–6. doi: 10.1002/jsfa.2740350502
97. Wang X, Warkentin TD, Briggs CJ, Oomah BD, Campbell CG, Woods S. Trypsin inhibitor activity in field pea (Pisum sativum L.) and grass pea (Lathyrus sativus L.). J Agric Food Chem. (1998) 46:2620–3. doi: 10.1021/jf971007b
98. Park SJ, Kim TW, Baik BK. Relationship between proportion and composition of albumins and in vitro protein digestibility of raw and cooked pea seeds (Pisum sativum L). J Sci Food Agric. (2010) 90:1719–25. doi: 10.1002/jsfa.4007
99. Reinkensmeier A, Bußler S, Schlüter O, Rohn S, Rawel HM. Characterization of individual proteins in pea protein isolates and air classified samples. Food Res Int. (2015) 76:160–7. doi: 10.1016/j.foodres.2015.05.009
100. Ma Z, Boye JI, Hu X. Nutritional quality and techno-functional changes in raw germinated and fermented yellow field pea (Pisum sativum L) upon pasteurization. Lwt. (2018) 92:147–54. doi: 10.1016/j.lwt.2018.02.018
101. Byanju B, Hojilla-Evangelista MP, Lamsal BP. Fermentation performance and nutritional assessment of physically processed lentil and green pea flour. J Sci Food Agric. (2021) 101:5792–806. doi: 10.1002/jsfa.11229
102. Leksono BY, Cahyanto MN, Rahayu ES, Yanti R, Utami T. Enhancement of antioxidant activities in black soy milk through isoflavone aglycone production during indigenous lactic acid bacteria fermentation. Fermentation. (2022) 8:326. doi: 10.3390/fermentation8070326
103. Sáez GD, Sabater C, Fara A, Zárate G. Fermentation of chickpea flour with selected lactic acid bacteria for improving its nutritional and functional properties. J Appl Microbiol. (2021) 131:181–99. doi: 10.1111/jam.15401
104. Torino MI, Limón RI, Martínez-Villaluenga C, Mäkinen S, Pihlanto A, Vidal-Valverde C, et al. Antioxidant and antihypertensive properties of liquid and solid state fermented lentils. Food Chem. (2013) 136:1030–7. doi: 10.1016/j.foodchem.2012.09.015
105. Naprasrt J, Suttisansanee U, Kemsawasd V. Single and mixed lactic acid bacteria culture fermentation in red bean milk for development of a functional beverage. Malaysian Applied Biology. (2019) 48:139–45. Retrieved from https://jms.mabjournal.com/index.php/mab/article/view/1888
106. Lee M, Hong G-E, Zhang H, Yang C-Y, Han K-H, Mandal PK, et al. Production of the isoflavone aglycone and antioxidant activities in black soymilk using fermentation with Streptococcus thermophilus S10. Food Sci Biotechnol. (2015) 24:537–44. doi: 10.1007/s10068-015-0070-7
107. Scott JJ. Alkaline phytase activity in nonionic detergent extracts of legume seeds. Plant Physiol. (1991) 95:1298–301. doi: 10.1104/pp.95.4.1298
108. Noureddini H, Dang J. Degradation of phytates in distillers' grains and corn gluten feed by Aspergillus niger phytase. Appl Biochem Biotechnol. (2009) 159:11–23. doi: 10.1007/s12010-008-8365-2
109. Sumengen M, Dincer S, Kaya A. Production and characterization of phytase from Lactobacillus plantarum. Food Biotechnol. (2013) 27:105–18. doi: 10.1080/08905436.2013.781507
110. Priyodip P, Balaji S. Microbial degradation of myo-inositol hexakisphosphate (IP6): specificity, kinetics, and simulation. 3 Biotech 8. (2018) 268. doi: 10.1007/s13205-018-1302-3
111. Priyodip P, Balaji S. Probiotic validation of a non-native, thermostable, phytase-producing bacterium: Streptococcus thermophilus. Curr Microbiol. (2020) 77:1540–9. doi: 10.1007/s00284-020-01957-w
112. Xing Q, Dekker S, Kyriakopoulou K, Boom RM, Smid EJ, Schutyser MAI. Enhanced nutritional value of chickpea protein concentrate by dry separation and solid state fermentation. Innov Food Sci Emerg Technol. (2020) 59:102269. doi: 10.1016/j.ifset.2019.102269
113. Rui X, Wang M, Zhang Y, Chen X, Li L, Liu Y, et al. Optimization of soy solid-state fermentation with selected lactic acid bacteria and the effect on the anti-nutritional components. J Food Process Preserv. (2017) 41:e13290. doi: 10.1111/jfpp.13290
Keywords: pea albumin, lactic acid bacteria, isoelectric precipitation, peptides, antinutritional factors
Citation: Emkani M, Moundanga S, Oliete B and Saurel R (2023) Protein composition and nutritional aspects of pea protein fractions obtained by a modified isoelectric precipitation method using fermentation. Front. Nutr. 10:1284413. doi: 10.3389/fnut.2023.1284413
Received: 28 August 2023; Accepted: 09 October 2023;
Published: 02 November 2023.
Edited by:
Eleni Naziri, University of the Aegean, GreeceReviewed by:
Malgorzata Ziarno, Warsaw University of Life Sciences, PolandCopyright © 2023 Emkani, Moundanga, Oliete and Saurel. This is an open-access article distributed under the terms of the Creative Commons Attribution License (CC BY). The use, distribution or reproduction in other forums is permitted, provided the original author(s) and the copyright owner(s) are credited and that the original publication in this journal is cited, in accordance with accepted academic practice. No use, distribution or reproduction is permitted which does not comply with these terms.
*Correspondence: Rémi Saurel, cmVtaS5zYXVyZWxAYWdyb3N1cGRpam9uLmZy
Disclaimer: All claims expressed in this article are solely those of the authors and do not necessarily represent those of their affiliated organizations, or those of the publisher, the editors and the reviewers. Any product that may be evaluated in this article or claim that may be made by its manufacturer is not guaranteed or endorsed by the publisher.
Research integrity at Frontiers
Learn more about the work of our research integrity team to safeguard the quality of each article we publish.