 Yongye Song
 Yue Zhang1
 Jianfen Zhang
 Na Zhang
 Guansheng Ma
- 1Department of Nutrition and Food Hygiene, School of Public Health, Peking University, Beijing, China
- 2YIDO AI Technology (Shandong) Co., Ltd., Jinan, China
- 3Laboratory of Toxicological Research and Risk Assessment for Food Safety, Peking University, Beijing, China
Background: Fluid intake in the elderly may influence urination behaviors and further influence their health status. This study investigated the behaviors of fluid intake, urination and their relationships among the elderly in China.
Methods: Stratified random sampling was used to recruit the elderly participants who met the inclusion criteria from five cities in China. Participants’ total fluid intake (TFI) level was investigated using a validated 7-day 24 h fluid intake questionnaire. Their urination behaviors in real time were also recorded using a validated 7-day 24 h urination behavior record.
Results: A total of 524 participants completed the study, including 233 males and 291 females. The average age was 69.7 years. The median daily TFI was 1,241 mL, with a frequency of 8.1 times per day. Approximately 73.3% of the participants did not reach the amount of adequate fluid intake (1.7 L for males and 1.5 L for females) recommended in China. Fluid intake in the morning, afternoon, and evening among participants was 594 mL, 305 mL and 342 mL, with a frequency of 3.0 times, 1.7 times, and 2.0 times, respectively. The median urination frequency was 7.4 times per day. The percentage of participants who urinated >7 times during the day was 44.3%. The percentage of participants who urinated ≥1 time at night was 77.5%. Age and BMI were not the main influence factors for fluid intake and urination behaviors. The preliminary analysis showed that higher TFI, plain water intake, dairy products intake, and fluid intake frequency were significantly associated with higher urination frequency (t = 6.553, p < 0.05; t = 5.291, p < 0.05; t = 4.667, p < 0.05; t = 13.413, p < 0.05). Higher fluid intake per time was significantly associated with lower urination frequency (t = −3.562, p < 0.05). Correlations between TFI, fluid intake frequency, fluid intake in night, fluid intake frequency in night and urination at night were also found (r = 0.114, p < 0.05; r = 0.091, p < 0.05; r = 0.146, p < 0.05; r = 0.331, p < 0.05).
Conclusion: Fluid intake was inadequate in terms of the elderly participants. Participants with higher fluid intake and frequency in night had a greater incidence of nocturia. Thus, correcting fluid intake behaviors can improve urination behavior and promote health.
Clinical trial registration: https://www.chictr.org.cn/searchprojEN.html, identifier CTR1900023355.
1 Introduction
Water is the main component of the human body, accounting for 60 ~ 70% of the total body mass (1). It is one of the most important nutrients for the maintenance of health and life (2). Water acts as a medium to support numerous metabolic functions: lubricating organs and transporting nutrients, hormones, and heat (3). The three water input sources include fluid intake from water and beverages, water intake from food, and endogenous water. The four pathways of water output include loss through urine through the urinary system, sweat through the surface of the skin, breath the through respiratory system, and feces through the digestive system (3, 4). There exists a balance between water input and water output. The two main sources of water input are fluid intake in the form of water and beverages and water from food. Similarly, urination accounts for about 60% of water output. It is widely recognized that proper hydration status is crucial for normal physiological function maintenance, including nutrient transport, excretion and body temperature regulation (5, 6). Recent research has revealed that insufficient fluid intake and dehydration can result in reduced physical and cognitive performances in the short term (7–10). In the long term, dehydration proved to be associated with the risk of chronic kidney disease, lithiasis, diabetes, and cardiovascular disease (11–14).
With aging, many physical functions decline to varying degrees in the elderly (15). The decline in digestion function may affect the absorption of water from food (16). Renal function declines, as a result, their glomerular filtration rate (GFR) and renal tubular function in terms of concentration, dilution, and transport decrease (17). Therefore, the proportion of water output from different sources may change (18). The body mass of the elderly undergoes changes due to the fact that the muscle mass decreases around the age of 40, leading to a gradual decrease in the overall water content of the body (19). The body water content of an elderly male individual accounts for approximately 47–67% of their body weight, while that of an elderly female individual accounts for approximately 39–57% of their body weight, which are lower than that of young adults (20–22). In addition, the physical activity level of the elderly reduces, leading to a decrease in the demand for energy (22), and, the energy consumption and metabolic rate of the elderly also decrease. According to the relationship between energy metabolism and water demand, the water demand of the elderly may be lower than that of young adults (23). In addition, the thirst center of the elderly decreases physiologically (24–26). As a result, they have a weaker sensation of thirst, while they do have the demand for fluid intake. This may lead to insufficient fluid intake among the elderly. Renal fluid conservation mechanisms were impaired among the elderly, leading to weakened responses to heat and cold stress (27, 28). Some other factors that may cause fluid restriction include urinary incontinence problems (29). A previous study has shown that fluid intake behaviors were influenced by various factors, including gender, age, body mass index (BMI), and environmental factors, such as temperature and humidity (30). Decreased fluid intake and increased water losses commonly cause dehydration in the elderly (6).
However, previous studies have shown that fluid intake in the elderly was less than that in younger individuals. A study conducted in Poland assessed water intake from food and beverages in 138 free-living elderly people aged 60 ~ 90 years old. The results showed that about 75% of elderly men and 51% of elderly women were under the recommended amount in terms of adequate water intake (including water intake from food and beverages; 2.5 L/d for elderly men and 2 L/d for elderly women aged 51 ~ 75 years and older) in Poland (2). Researchers assessed the total fluid intake (TFI) of 4,020 independent, community-living elderly people aged 65 years and above in Germany, which showed that the TFI level of elderly men was 700 mL, while that of women was 600 mL. The proportion of the elderly individuals aged 65–74 years who did not reach the recommended amount of adequate fluid intake (1,310 mL/d) in Germany was 44% of those aged 75 to 84 and 51% of those aged 85 and above (31). A study carried out in America using 24-h dietary recall data indicated that the TFI level (including plain water and moisture in beverages) for the elderly (≥60 years old) was 2071 mL, which was lower than the levels of adults aged 20 ~ 39 years (2,736 mL) and 40 ~ 59 years (2,797 mL) (32). The recommended amount of adequate fluid intake for elderly individuals in China is the same as adults: 1.7 L/d for males and 1.5 L/d for females, with a total water intake level of 3.0 L/d and 2.7 L/d, respectively (33). A study conducted in 2012 investigated daily TFI and dietary consumption status among 413 participants aged 50 ~ 75 years with chronic diseases in China. The results found that the average daily TFI level was 950 mL/d, as 55% of the participants did not meet fluid intake recommendations (1.2 L/d for the elderly according to Chinese Dietary Reference Intakes 2007) (34, 35). The values set at of 2007 were much lower than the currently recommended amount of adequate fluid intake (1.7 L/d for males and 1.5 L/d for females). Data from China Nutrition and Health Surveys (2015 ~ 2017) showed that the total intake of plain water and tea for the elderly aged 60 ~ 74 years was 846 mL/d (36, 37). Thus, it can be seen that few studies have provided data on fluid intake for the elderly and that the phenomena of insufficient fluid intake is widespread among the global elderly population. Moreover, there is a lack of in-depth analysis on the frequency and types of fluid intake in relation to elderly individuals (38). Besides fluid intake from water and beverages, food is another main source of water. However, residents in European and American countries consume about 20% of their daily water intake from food, while residents in China can reach 40–49% (39, 40). Although the data from other countries can provide references as a basis for fluid intake behaviors of the elderly in China, it cannot be used to determine the adequate water intake for Chinese people. Research on elderly people aged more than 65 years in China is needed.
Urine is the main pathway for water excretion, accounting for approximately 60% of total daily water excretion. Declining kidney function weakens fluid balance regulation (20, 22, 41). Urination behaviors refer to the behaviors of the body’s excretion of urine after sensing the volume of urine in the bladder (42). These behaviors relate to the volume of urine being excreted, the frequency of urination, urinary urgency, and place of urination (43, 44). Urine indicators and urination behaviors can be used to determine hydration status (45–47). A decrease in urine volume indicates a risk of dehydration (48). Unhealthy urination behaviors also can be risk factors for urinary system diseases (44). A study conducted on 636 female nurses indicated an association between unhealthy toileting behaviors and susceptibility to lower urinary tract symptoms (49). Increased urination promotes bacteria elimination from the urinary tract and bacterial proliferation reduction in the bladder (50–52). Previous studies have explored the urination behaviors among Chinese women and students in different stages (53–55), while few studies focused on the elderly. Moreover, the association between fluid intake behaviors and urination behaviors remains unclear. A survey of European adults has shown that individuals with higher water intake levels tended to have higher urine volume (56). Another study conducted on 87 young adults evaluated urination number within 24 h as a possible indicator of hydration status. The results indicated that dehydrated individuals had higher 24 h urine volume (1933 versus 967 mL), a great number of urination (five versus three times), lower urine specific gravity (1.012 versus 1.025) and lower urine osmolality (457 versus 874, mOsm/kg) (57). However, research on the relationship between fluid intake behaviors and urination behaviors among the elderly in China has not been carried out yet.
In this study, the primary objective was to investigate the fluid intake behaviors and urination behaviors of the elderly in China. The influence factors of age and BMI were also analyzed. Further, the associations between fluid intake behaviors and urination behaviors were analyzed. The results of the study can provide scientific reference data for fluid intake and urination behaviors for the elderly in China. Moreover, it contributes to possible strategies that can be used to promote healthy fluid intake and urination behaviors.
2 Methods
2.1 Study design
The survey was conducted from October 1 to October 31, 2019. Considering the influence of the relatively large geographical span of China, five cities from different geographical regions were selected in our present study, including Taiyuan, Jinan, Hefei, Nanchang, and Guangzhou. Jinan, Hefei, and Nanchang are located in Central China, while Jinan is located in the north, while Hefei and Nanchang are located in the south. Taiyuan is located in North China, and Guangzhou is located in South China. A stratified random sampling method was used to recruit the elderly. Participants from five cities in China were enrolled in this study.
2.2 Sample size calculation
In our study, the sample size (n) was calculated using the following formula: n = t2P(1–P)/e2 (58). In the formula, “t” represents the corresponding statistic value when the confidence was set as 95%, that is, α = 0.05 and t = 1.96. In addition, “e” represents the error and was set as 5%. One study conducted among the elderly in China revealed that the detection rate (P) of adults with a fluid intake under the recommended amount of adequate fluid intake was 32.4% (59). The prevalence of frequent or urgent urination found in 1164 patients, which was 24.3% (60). The calculated sample size was 337 when P was set as 32.4%; and the calculated sample size was 283 when P was 24.3%. Considering stratification (five cities) and a missed follow-up rate of 10%, at least 374 participants were required for the study to achieve validity.
2.3 Participants
In October 2019, recruitment notices targeting the elderly in these five cities were published online. The inclusion and exclusion criteria, as well as an introduction to the research, were displayed. The inclusion criteria were as follows: age range between 60 and 80 years; living or working in Jinan, Taiyuan, Hefei, Nanchang, or Guangzhou for 3 months or more before study; having a good mental state; and the capacity to fill in questionnaires independently. The exclusion criteria were as follows: diseases relating to cognitive dysfunction, schizophrenia, other mental disorders, chronic kidney disease, or urinary system diseases; damage to the nervous system; having a pacemaker or other embedded electronic medical devices; having physical activity disorders; receiving treatment involving a restricted diet or fluid intake; having a history of using any diuretics or related medications; and having a history or habit of excessive drinking. Registration information was collected using electronic questionnaires. After being included in the study, all participants signed informed consent forms.
2.4 Ethical standards
The study protocol was reviewed and approved by the Ethical Review Committee of Peking University. The ethical approval project identification code is IRB 00001052-18039. The study protocol was registered on the Chinese Clinical Trial Registry website under trial registration number Chi CTR 1900023355. The study was conducted in accordance with the principles of the Declaration of Helsinki. Prior to the beginning of the study, written informed consent forms were obtained from all the participants before the study voluntarily. The participants and the researchers each reserved one copy of the informed consent form.
2.5 Study procedure
Participants’ height and weight were measured after they were enrolled. After training by the researchers, fluid intake behaviors and urination behaviors were recorded for 7 consecutive days by the participants. From day 1 to day 7, their fluid intake behaviors were recorded using the 7-day 24 h fluid intake questionnaire in real time under free-living conditions (61). Participants’ TFI values were evaluated and recorded by themselves using a uniformly customized cup with a scale to the nearest 10 mL as a reference. However, the water intake level from food was not measured or recorded. Using the validated 7-day 24 h urination behavior record, the participants’ urination behaviors was recorded by themselves in real time, including frequency of urination, time of urination, and urinary urgency. During the study period, the researchers guided the participants to complete the questionnaire and took photos for verification. Participants’ completed questionnaires were checked by the researchers every day. The indicators collected during different study time points are presented in Table 1.
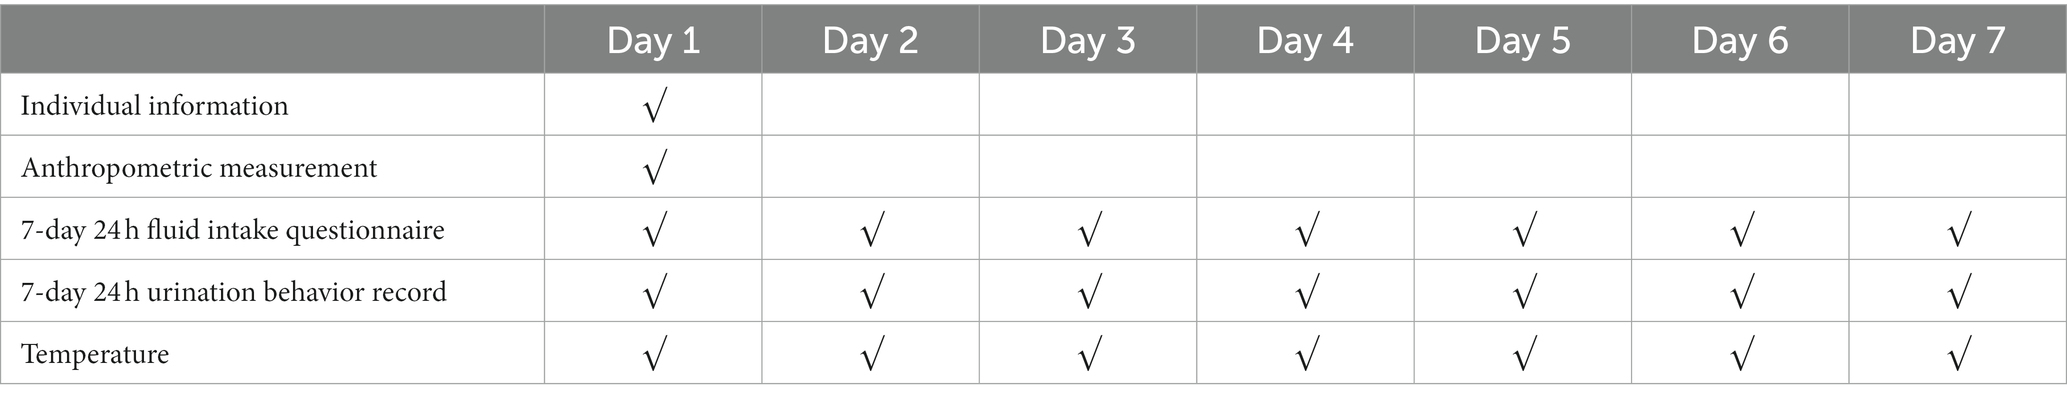
Table 1. The indicators collected at different time points in the study.
2.6 Anthropometric measurements
A height–weight meter (HDM-300, Huajun, Zhejiang, China) was used to measure participants’ height and weight under fasting status. The participants were dressed in light clothing and stood barefoot on the meter with their backs facing the scale, their torsos naturally straight, and their heads remaining upright throughout the process. The height and weight of the participants were measured twice to the nearest 0.1 cm and 0.1 kg, respectively. The averages for height and weight were calculated. Then, their BMI values were calculated: BMI (kg/m2) = weight (kg)/height (m) squared.
2.7 Measurement of daily total fluid intake behaviors
In our study, total water intake includes two parts, namely, fluid intake from water and beverages (accounting for 50% approximately) and water intake from food (accounting for 40% approximately) (22). Daily TFI refers to the amount of fluid intake from water and beverages, excluding water from food. A 7-day 24 h fluid intake questionnaire was used to record fluid intake behaviors, including daily TFI and patterns of fluid intake. This questionnaire has been validated and applied in a large body of research and practical work (62–64). It is an authoritative and commonly used questionnaire in different countries in the field of fluid intake. It has undergone consultation with experts and repeated argumentation, and expert consensus has been reached. It was based on the validated questionnaire used in previous studies, which was revised in line with the purpose of this survey (65, 66). After undergoing standardized training by the researchers, TFI levels were collected and recorded using the 7-day 24 h fluid intake questionnaire by the participants. A customized cup was used to measure the fluid intake level for each time period over the 7 consecutive days, whose scale was accurate to 10 mL. According to the General Standard for Beverages of China (GB/T 1-789-2015) and the methods used in previous studies, all the drinking fluids were classified into plain water, dairy products, tea, sugar-sweetened beverages, plant protein beverages, fruit/vegetable juices, and other beverages (67–69). The types of plain water included in the study referred to tap, packaged, or mineral and purified. The types of dairy products referred to pure milk, yogurt, and other dairy products without the addition of sugar in the production process. Sugar-sweetened beverages (SSBs) refer to beverages with the addition of sugar in the beverage production process, including carbonated, coffee, plant-based, flavored, protein, and special-purpose beverages. Plant protein beverages refer to products made using plant fruits, seeds, or kernels with a certain amount of protein as raw materials, with or without the addition of other food raw materials, including soymilk, soybean milk, soybean milk beverages, and coconut milk. The types of tea included self-made green, scented, and black, excluding tea beverages that include added sugar. Fruit and vegetable juice refers to beverages made from various fruits and vegetables through grinding, pressing, and other processes, excluding beverages with added sugar, fruit- and vegetable-flavored beverages. Beverages that do not belong to the above classification were classified as other beverages. The time and location of fluid intake behaviors were recorded by the participants. The records were captured and sent to the investigators using a mobile phone every day, which were then reviewed to ensure the accuracy and completeness of the fluid intake records.
Regarding time periods of fluid intake, the day was divided into eight time periods: before breakfast, during breakfast, after breakfast, during lunch, after lunch, during dinner, after dinner, and at night. The morning referred to “before breakfast,” “during breakfast,” and “after breakfast” periods, whereas the afternoon referred to “during lunch” and “after lunch” periods, while the evening referred to “during dinner,” “after dinner,” and “night” periods.
2.8 Measurement of urination behaviors
A 7-day 24 h urination behavior record was used to record the information regarding participants’ urination behaviors after training. The record was designed based on a previous questionnaire through expert consultation and was concerned with the frequency of urination, time of urination, and urinary urgency (43, 54).
The frequency of urination was recorded as the number of times the participant urinated per day, from the first urination of the day after waking up to the last urination before waking up the next day. The 7-day average frequency of urination was calculated from these numbers.
Regarding the time periods of urination, the day was divided into eight time periods: before breakfast, during breakfast, after breakfast, during lunch, after lunch, during dinner, after dinner, and at night. The morning referred to “before breakfast,” “during breakfast,” and “after breakfast” periods, whereas the afternoon referred to “during lunch” and “after lunch” periods, while the evening referred to “during dinner,” “after dinner,” and “night” periods.
According to the International Continence Society report on urinary function, frequent urination was defined as urinating more than 7 times during the day (70), and nocturia was defined as urinating more than 1 time at night (71).
2.9 Temperature
According to data from the China Meteorological Administration, the daily minimum and maximum temperatures in the five cities, including Taiyuan, Jinan, Hefei, Nanchang, and Guangzhou, during the survey period were recorded. The temperature of the day was defined as the median temperature, and the average temperature in each city during the study period was calculated.
2.10 Quality control
A unification procedure was established before the study. This survey was conducted after unified training for researchers and participants. Study guidance was developed for the study, including the research protocol, questionnaire and records, methods, and procedures. Effective and convenient methods of communication between the participants and investigators were used to improve the follow-up rate and quality of the data, such as home visits and telephone calls. The time and reasons for dropout were also recorded in detail. Throughout the study period, all the procedures were strictly supervised by researchers for quality control. Double-checking was performed on the completed questionnaires each day. Before data inputting, the researchers coded and checked each item in the questionnaire and cleared the error items.
2.11 Statistical analysis
The EpiData 3.1 software was used to establish the database, and data entry was carried out via the double-entry method to check and clean up the wrong items promptly. SPSS Statistics 26.0 (IBM Crop, Armok, NC, USA) was used to perform the statistical analysis. The participants were divided into four groups according to the quartile of their sex. The data were subjected to normality tests. The results were reported as mean ± standard deviation (SD) if the data were normally distributed. If not, then the median and quartile ranges (M and Q) were used to reveal the data. Differences in the normally distributed data (reported as mean ± SD), such as age, height, weight, and BMI, were compared using one-way ANOVA among different groups. Kruskal–Wallis rank-sum tests were used to compare the differences in the non-normally distributed data (shown as M and Q) among different groups. Count data were described as n (percentage), and a chi-square test was used to compare the differences in these indexes. The Student–Newman–Keuls (SNK) method (p < 0.05) was used to compare the differences evident between each of the two groups. Linear regression models were used to examine the relationships between urination frequency and fluid intake behaviors in 24 h. Spearman’s correlations were used to analyze the correlations between night urination frequency and fluid intake behaviors. Since urination in the night is a binary variable, point biserial correlations were used to analyze the correlations between fluid intake behaviore and urination at night. The significance level was set at 0.05 (p < 0.05).
3 Results
3.1 Participants’ characteristics and temperature
A total of 551 participants from five cities who met the inclusion criteria were enrolled in this study. No participant lost contact during the investigation period. Among them, 27 dropped out voluntarily due to incomplete data. After invalid questionnaires were eliminated, the data of 524 participants remained for analysis, with a completion rate of 95.1% (Table 2).
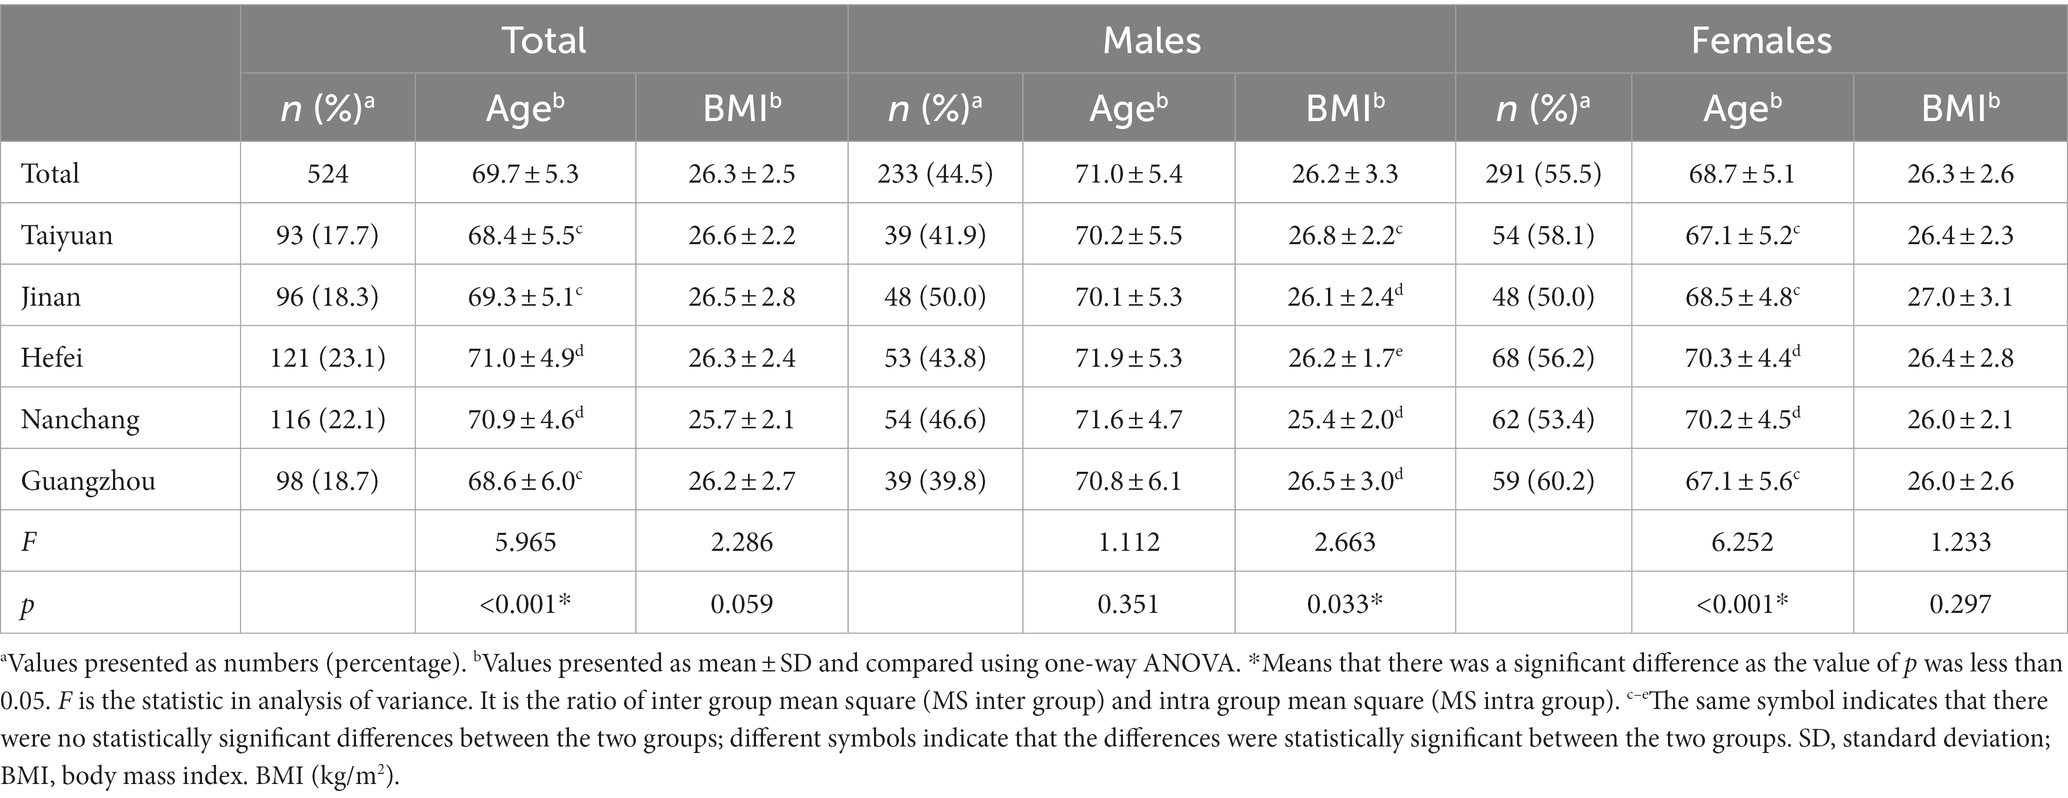
Table 2. Characteristic of the participants.
The participants included 233 men (44.5%) and 291 women (55.5%). Their average age was 69.7 years, which differed significantly between the participants from five cities (F = 5.965 p < 0.05). Their average BMI was 26.3 ± 2.5 kg/m2. Participants were divided into four groups according to the quartiles of their BMI (Q1: 17.8 ~ 24.4, Q2: 24.5 ~ 25.7, Q3: 25.8 ~ 27.7, Q4: 27.7 ~ 36.6) (Tables 3–5).
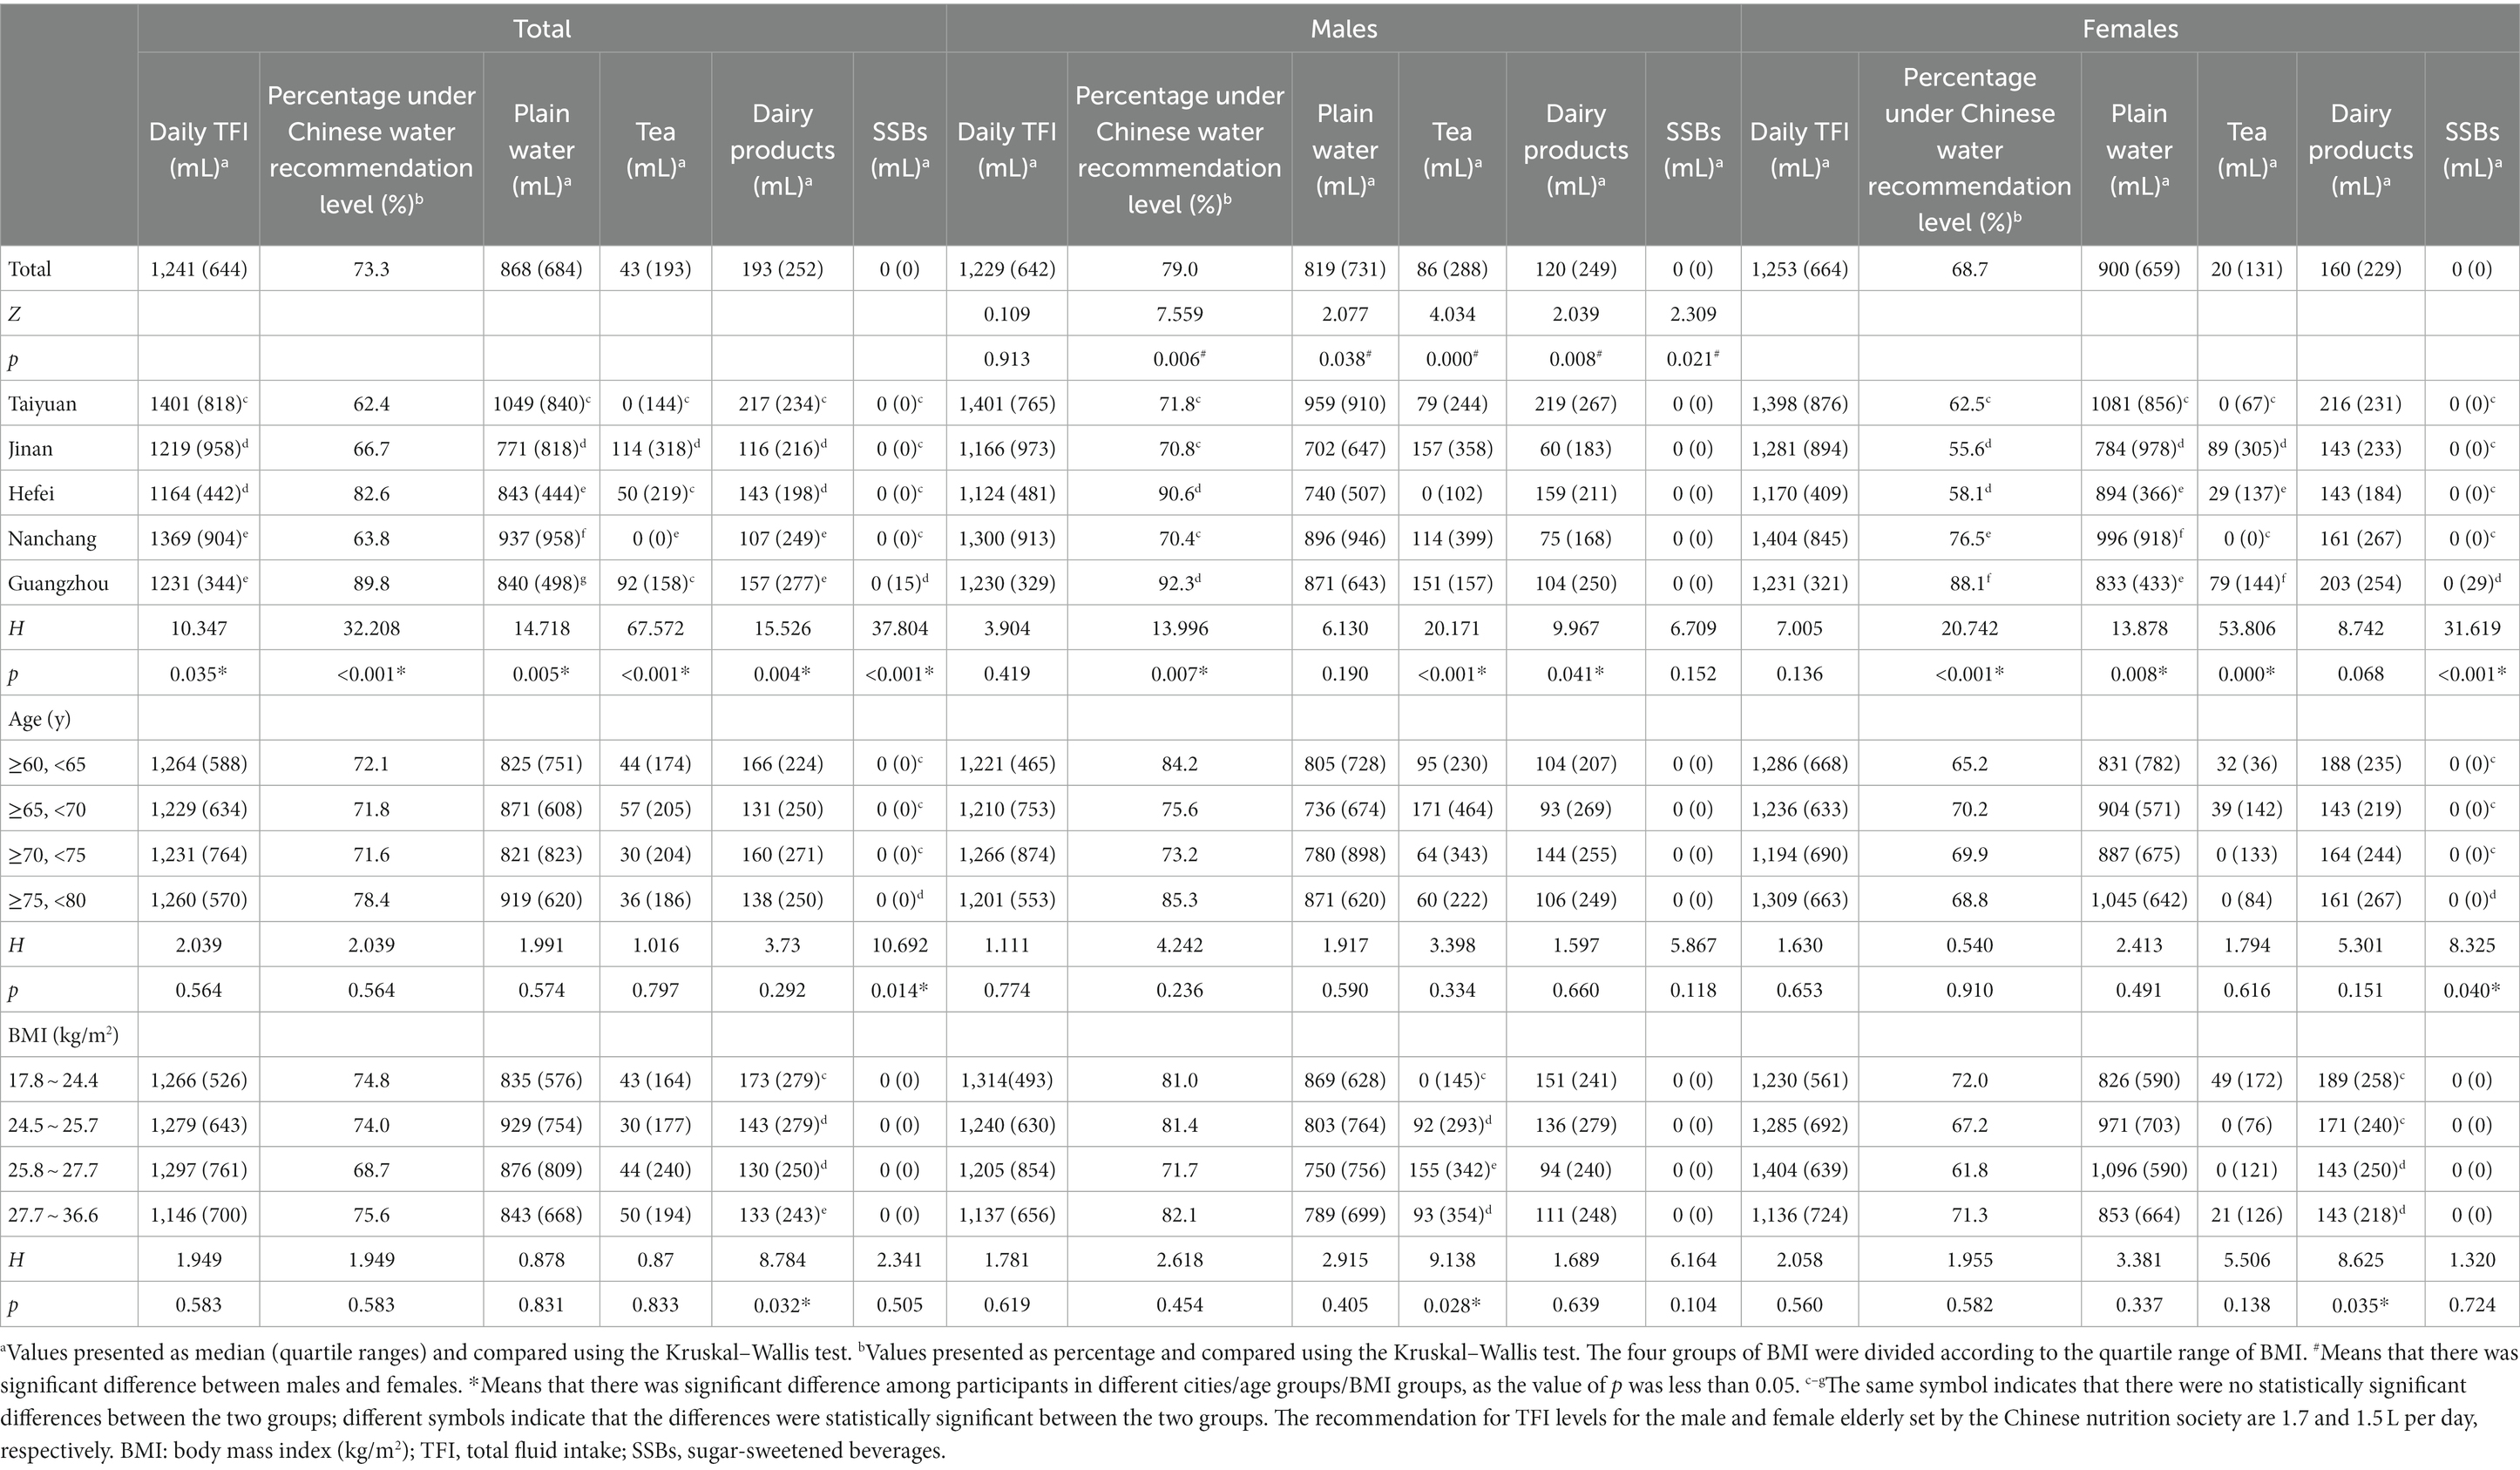
Table 3. Fluid intake patterns of the participants with different characteristics.
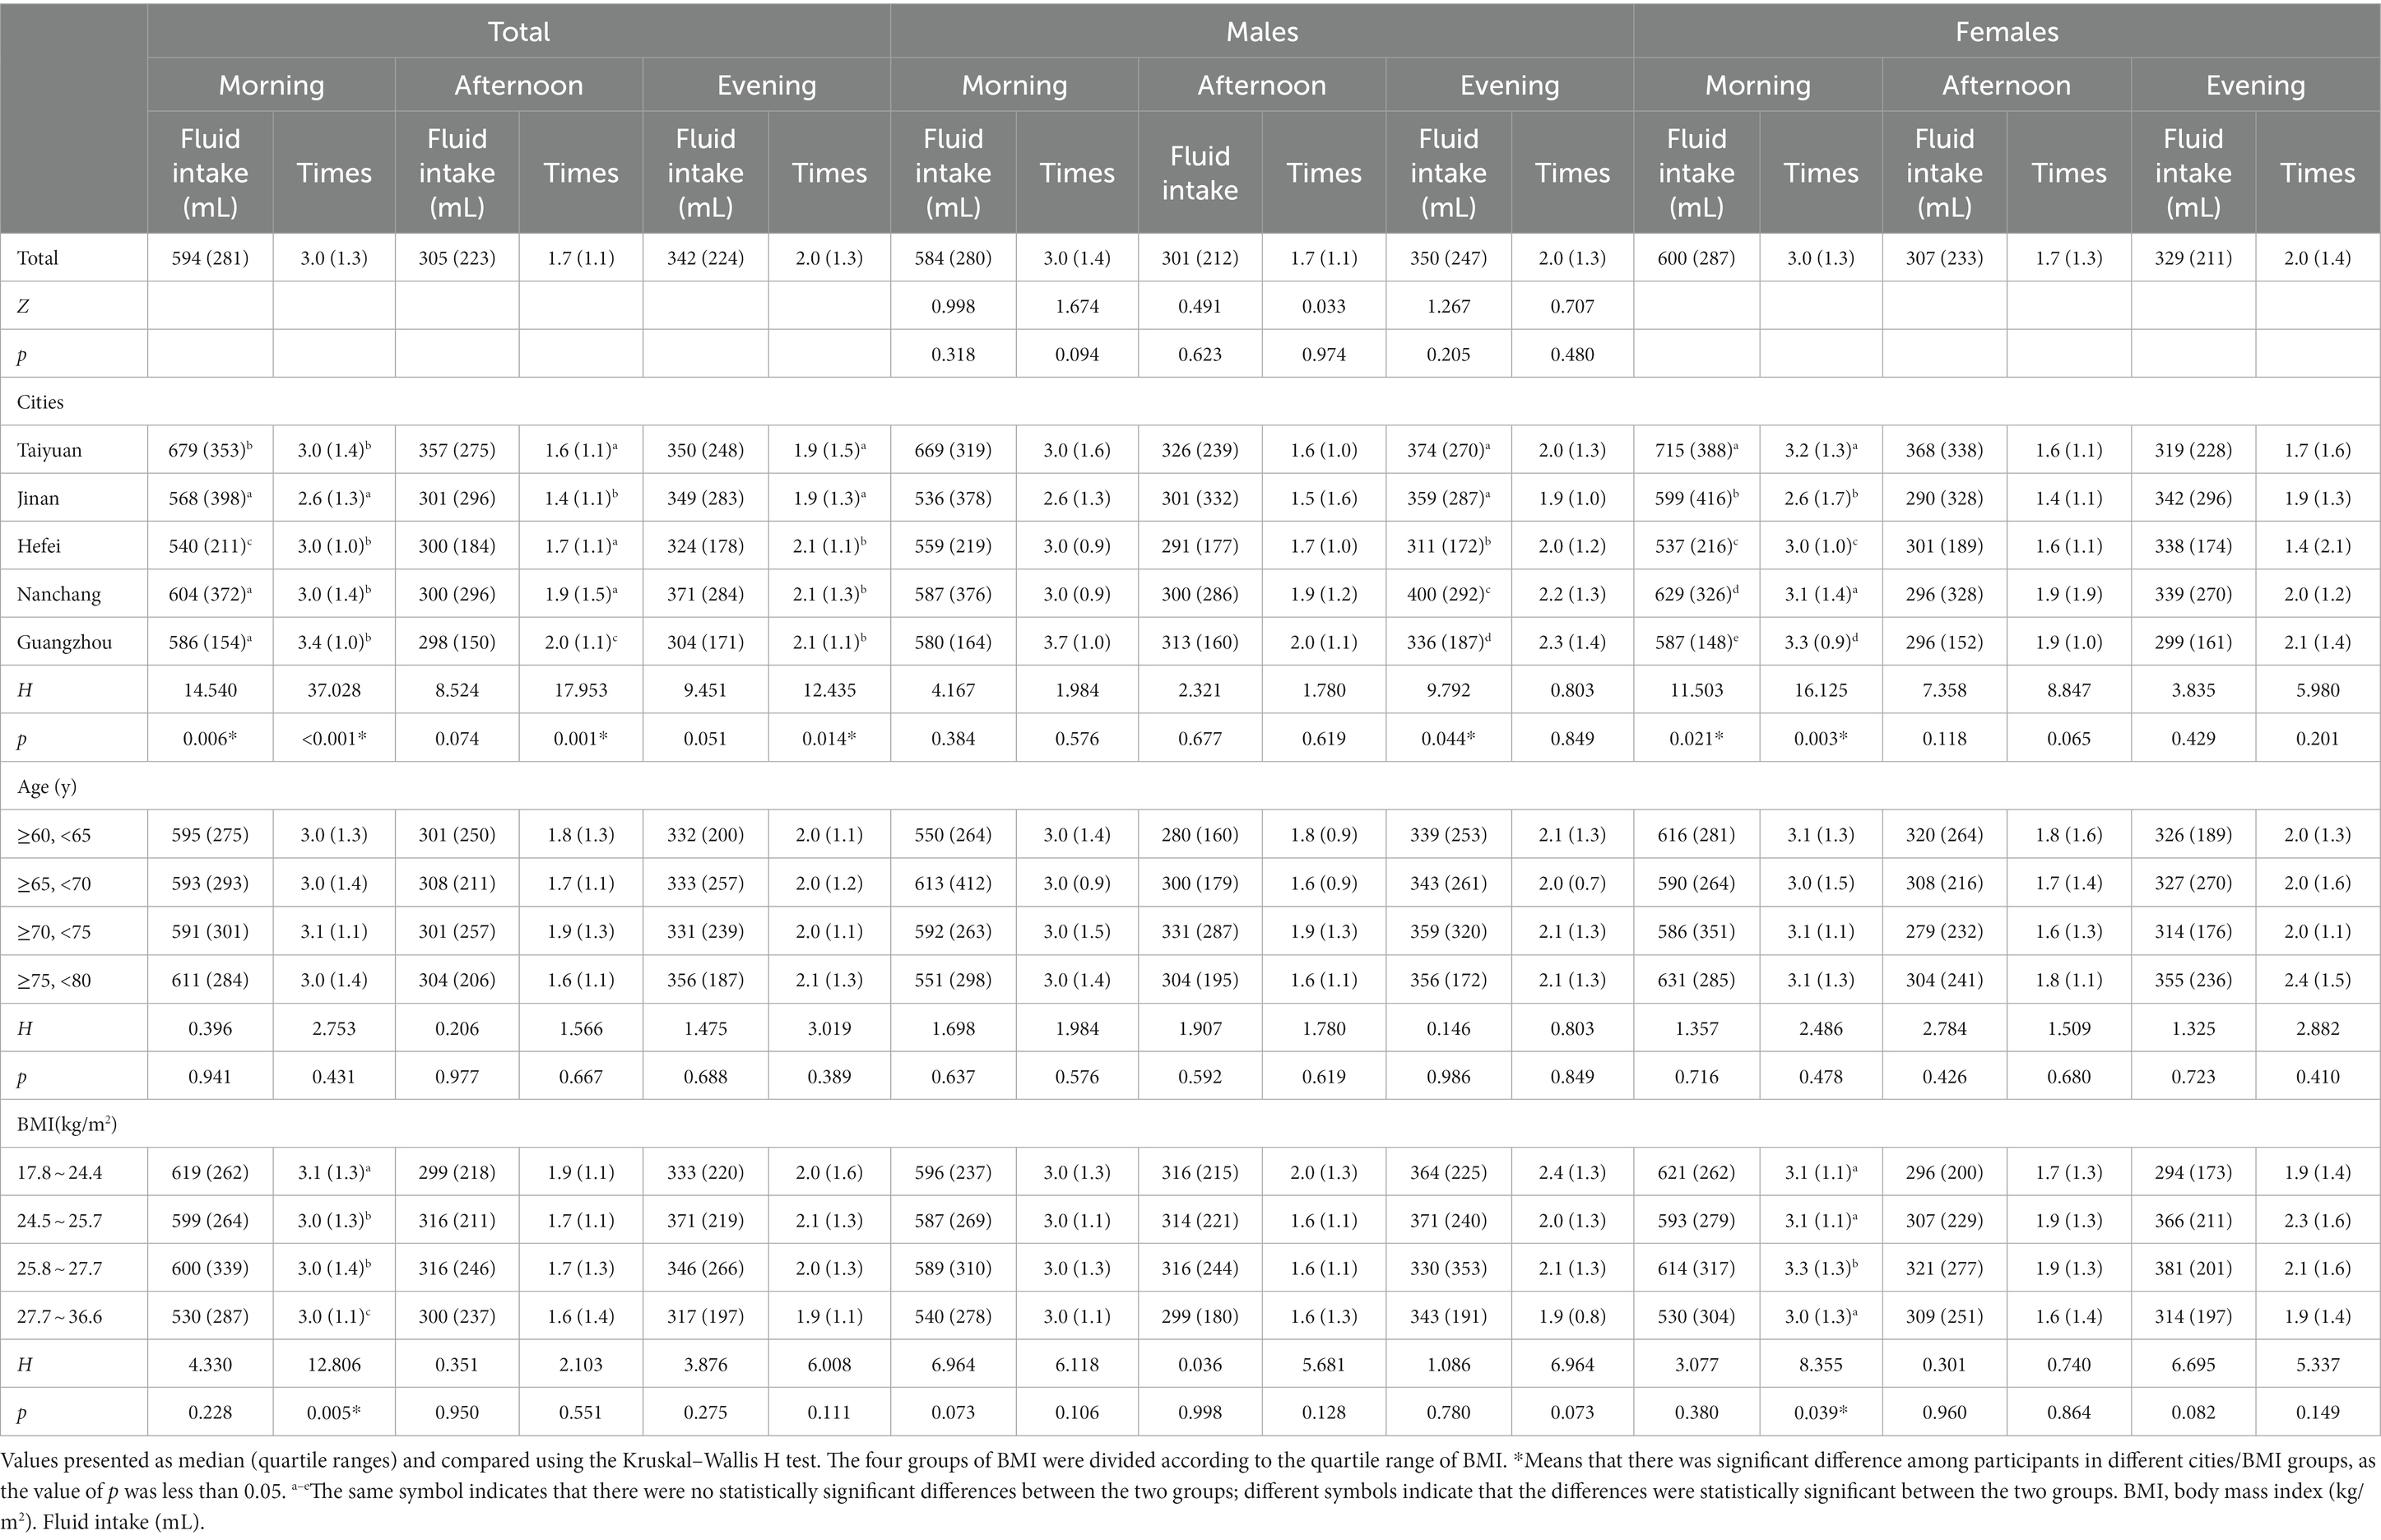
Table 4. Daily fluid intake of participants with different characteristics in different time periods.
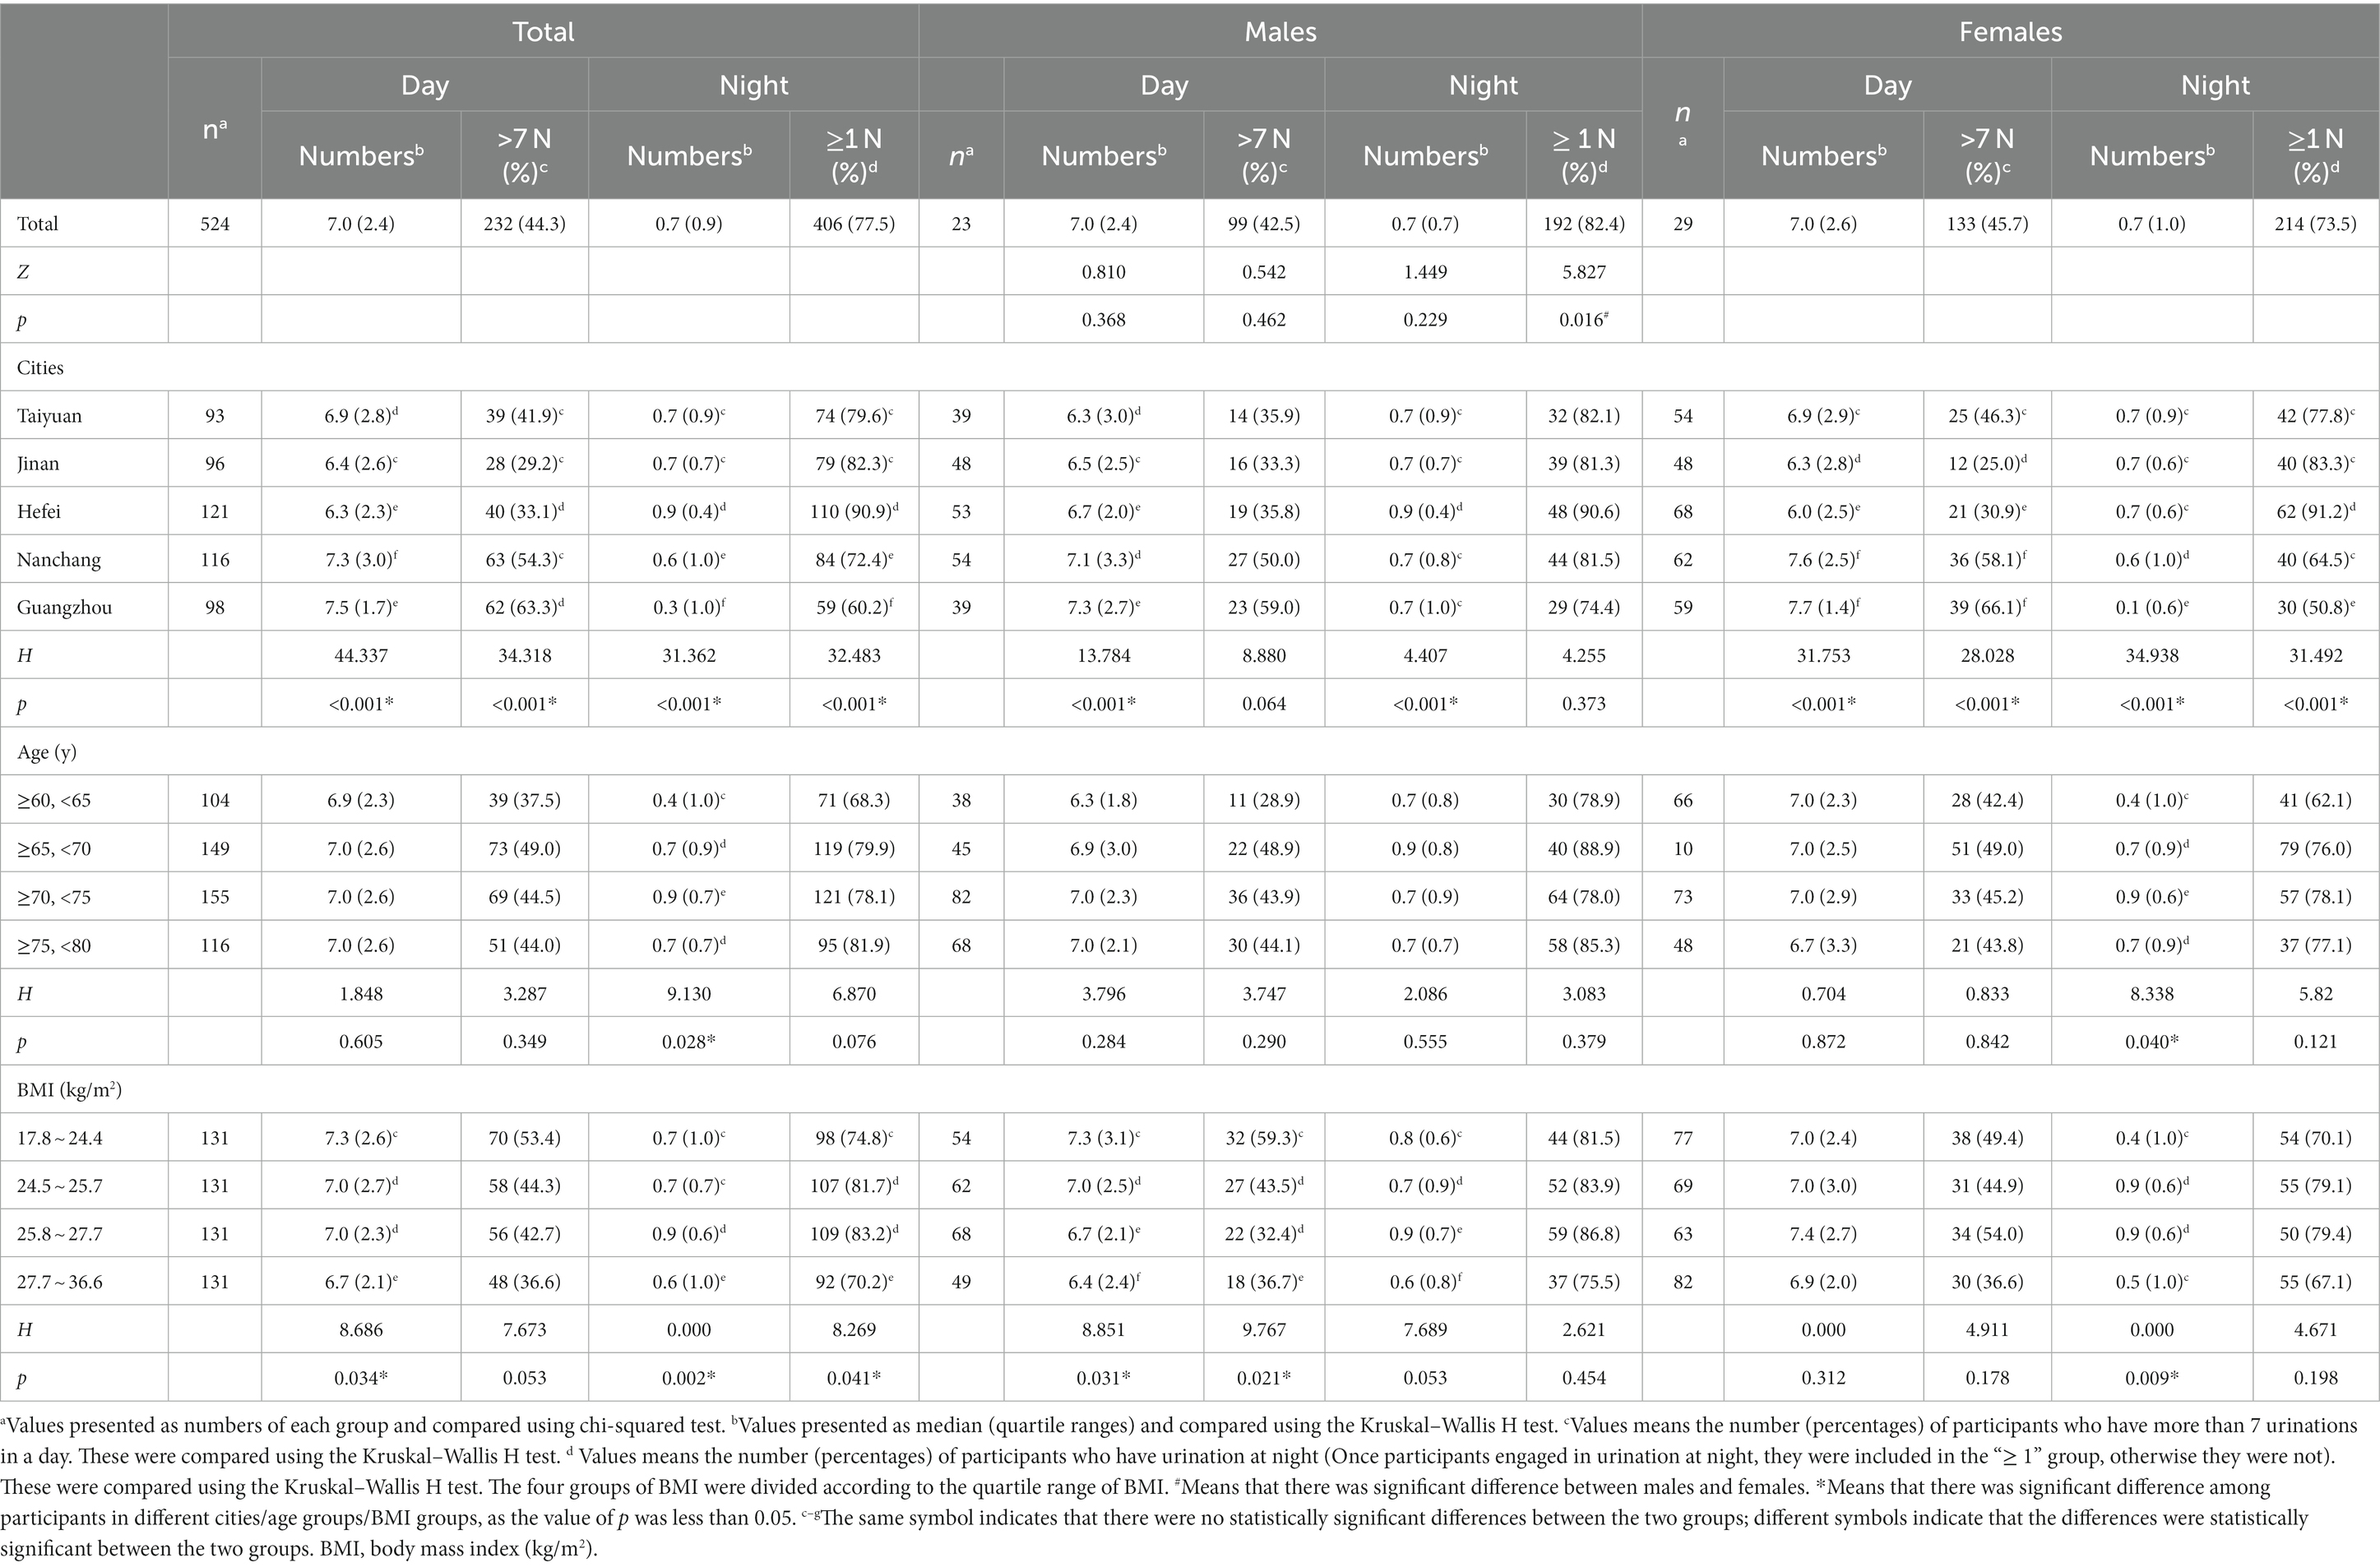
Table 5. Description of urination behaviors with different characteristics.
During the study period, the average temperatures calculated in Jinan, Taiyuan, Nanchang, Hefei, and Guangzhou were 17°C, 13°C, 22°C, 19°C, and 26°C, respectively.
3.2 Fluid intake patterns of the participants with different characteristics
Among the 524 participants, the median daily TFI was 1,241 mL, as the median values for five cities were 1,401 mL, 1,219 mL, 1,164 mL, 1,369 mL, and 1,231 mL, respectively. The results showed that participants from Taiyuan had the highest median of TFI, while those from Hefei had the lowest one (H = 10.347, p < 0.05). Comparing the TFI of male participants and female participants, no significant differences were found between the participants in the two groups (p < 0.05), while the fluid intake of different types differed significantly (all p < 0.05). The percentage of participants who had not meet the recommendations of adequate fluid intake level in China was 73.3% (79.0% for male participants, 68.7% for female participants), based on a fluid intake of 1.7 L for male adults and 1.5 L for female adults by the Chinese Nutrition Society (72). Plain water was the main source of fluid intake, accounting for 69.9%. By comparing the results of five cities, it was found that the participants of Taiyuan had the highest intake levels of plain water and dairy products (1,049 mL, 217 mL, respectively). The participants of Jinan had the highest levels of tea intake (M = 114 mL). The elderly in all five cities had low intake levels of SSBs (Table 3).
Regarding BMI, dairy product intake between the total participants and female participants differed significantly between the four groups (H = 8.784, p < 0.05, H = 8.625, p < 0.05). Participants with normal BMI (17.8 ~ 24.4) had the highest dairy products intake level. The intake level of tea was significantly different among the four groups of male participants (H = 9.138, p < 0.05).
Few people consumed soybean milk, fruit/vegetable juices, and other beverages, and the intake levels were very small. Therefore, the data are not presented in the table (Table 3).
3.3 Daily fluid intake of participants with different characteristics in different time periods
The median TFIs of the participants in morning, afternoon, and evening were 594 mL, 305 mL, and 342 mL, respectively. There existed statistically significant differences in terms of fluid intake between the three periods (H = 619.948, p < 0.05). Significant differences were found in the frequency of fluid intake between the morning, afternoon, and evening periods (H = 660.417, p < 0.05). Among all participants, fluid intake and fluid intake frequency in the morning had the highest median values. The fluid intake in the morning differed significantly among the participants in the five cities (H = 14.540, p < 0.05). No significant differences were observed in terms of fluid intake in the afternoon and evening among the participants in the five cities (both p > 0.05). The fluid intake frequency of the participants of the five cities in three periods differed significantly (all p < 0.05). The participants with a BMI between 17.8 and 24.4 kg/m2 had the highest fluid intake frequency in the morning (M = 3.1) (Table 4).
3.4 Urination behaviors of participants with different characteristics
The median frequency of urination of all participants was 7.0 times during the day and 0.7 times in night. There was no statistically significant difference in the frequency of urination between male and female participants (7.0 times per day and 0.7 times per night for both). The frequency of urination differed significantly between participants from five cities (H = 44.337, p < 0.05) and among the BMI groups (H = 8.686, p < 0.05). Approximately 4.3% of the participants urinated more than seven times during the day, and 77.5% of participants urinated one time or more during the night across the five cities. For total and female participants, the percentage who urinated more than seven times during the day differed significantly between different cities (H = 34.318, p < 0.05; H = 28.028, p < 0.05). For female participants, there existed significant differences in the percentage who urinated more than seven times during the day between the four groups of BMI (H = 9.767, p < 0.05). The percentage of participants who urinated more than once during the night differed significantly between males and females (H = 5.827, p < 0.05) and between different cities (H = 32.483, p < 0.05) (Table 5).
3.5 Correlations between fluid intake behaviors and urination behaviors
Linear analysis showed that higher TFI, plain water intake, dairy products intake, and fluid intake frequency were significantly associated with higher urination frequency (t = 6.553, p < 0.05; t = 5.291, p < 0.05; t = 4.667, p < 0.05; t = 13.413, p < 0.05). Inatead, higher fluid intake per time was significantly associated with lower urination frequency (t = −3.562, p < 0.05) (Table 6).
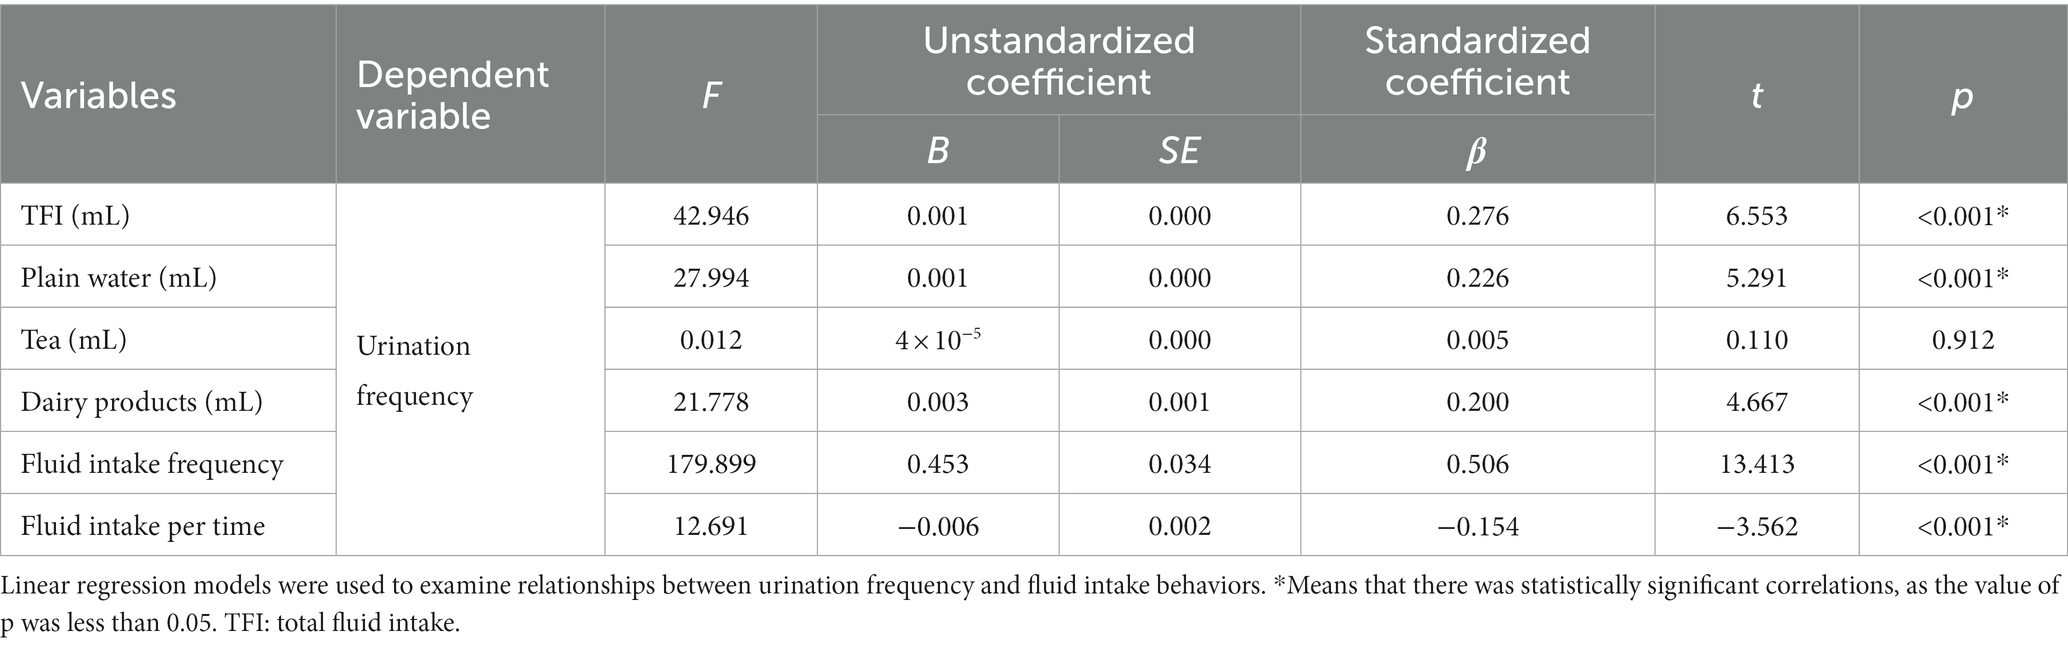
Table 6. Correlations between urination frequency and fluid intake behaviors in 24 h.
The correlations of urination frequency, urination in night and fluid intake behaviors were also analyzed in the present study. The results showed that there exist correlations between urination frequency and TFI, fluid intake in afternoon, fluid intake frequency in afternoon, and fluid intake in night, and fluid intake frequency in night (all p < 0.05). Correlations were found between urination in night and TFI, fluid intake frequency, fluid intake in night, and fluid intake frequency in night (all p < 0.05) (Table 7).
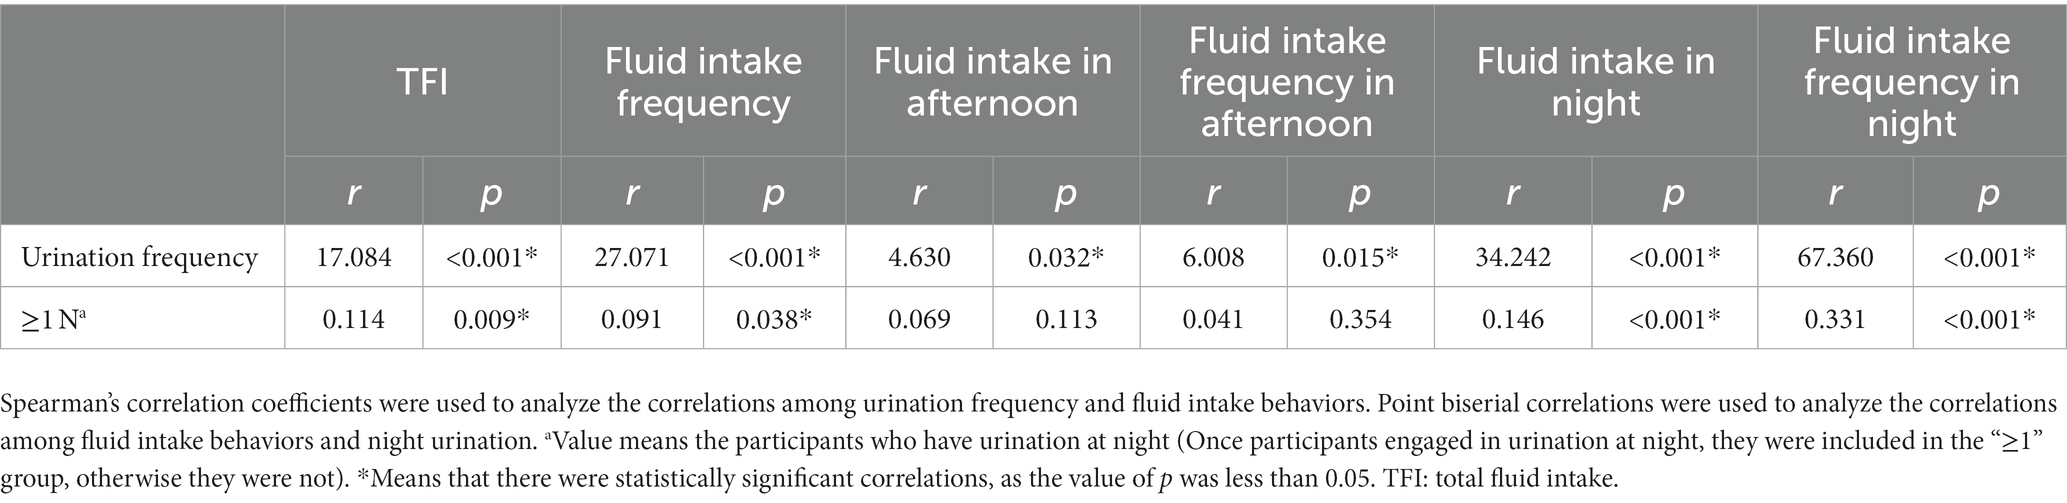
Table 7. Correlations between fluid intake and urination behavior at night.
4 Discussion
In the present study, over half of the participants did not meet the recommended amount of adequate fluid intake in China (excluding water from food, 1.7 L/d for male adults and 1.5 L/d for female adults). Statistical differences between the participants from different cities exist. This may be influenced by the inhabitants’ habit of drinking soup or eating rice soaked in soup in Guangzhou, which may increase the proportion of water intake in food sources, leading to a decrease in fluid intake levels (73). In addition, considering the temperature differences of five cities (up to even 13°C), the fluid intake behaviors may be influenced by water loss caused by sweating and heat dissipation. This was similar to the result of a study showing that fluid intake from beverages was positively associated with temperature. The results obtained in this study suggest that attention should be paid to promoting knowledge and skills related to fluid intake of the elderly through health education. A survey conducted on 413 middle-aged and elderly people aged 50 ~ 75 years in Jinan, China, found that the median TFI of people over 60 years old ranged from 950 to 1,050 mL. This was lower than the median TFI of the elderly in Jinan city (1,219 mL) in our study. This may be influenced by different study methods, as a 24-h recording method for 7 consecutive days was used in our study, while recording across four consecutive days was used in the previous one (34). The water requirements of the elderly were affected by many factors, including micro-environment (temperature, humidity, wind speed), individual health status, and physical activity (21, 22). This study found that plain water was the main source of TFI for participants, accounting for 69.9%. This was similar to the results gathered among adults in different stages in China (74–76). Dairy products were the second-highest contributors to fluid intake among the participants. However, the milk intake level (M = 193 mL) was much lower than the recommended amount by the Chinese Nutrition Society (300 mL) (22). Compared with previous studies conducted in China, the elderly had higher tea intake than young adults and pregnant women (74, 75). It should be noted that there existed differences in fluid intake patterns between the five cities, which suggested that health education and strategies suiting local conditions should be conducted. Besides, it was revealed that the fluid intake level in the morning was much higher than the levels in afternoon and evening (Table 4). This may be due to the Chinese dietary habits, as breakfast often goes with congee (a Chinese rice gruel eaten for breakfast).
The frequency of urination in healthy adults is 4 ~ 8 times per day (77). Frequent urination was defined as urinating more than seven times during the day (70). Nocturia was defined as urinating more than once at night to urinate, according to the International Continence Society report on urinary function (71). In our study, the percentage of participants urinating more than seven times per day was 44.3%, and the incidence of nocturia was 77.5%. Compared with earlier studies conducted in China, the incidence of frequent urination and nocturia in our study is higher than the results among female senior citizens (25, 40%) (78) and college students (25, 40%) (79). The results were consistent with those observed in previous studies, which have revealed that frequent urination and nocturia have a higher incidence in the elderly. A study on the hospitalized elderly in Rome showed that the incidence of frequent urination was 67% (80). This may possibly be due to the decrease in bladder storage capacity with age, resulting in an increase in urination frequency. Furthermore, it is worth noting that frequent urination and nocturia are manifestations of kidney diseases such as chronic kidney disease and overactive bladder and may also be caused by mental stimulation or excessive drinking water (81). A study conducted on the elderly in Sweden showed that the incidence of nocturia was approximately 70% (82). Another study suggests that urinating at night in the elderly is a normal feature of physical decline (83). For the elderly, frequent urination can lead to multiple visits to the toilet. Urination at night influences sleep quality and increases the risk of falls and fractures (84).
It should be noted that the result of our study revealed that correlations exist between fluid intake frequency and nocturia. This suggests that nocturia in the elderly can be improved by limiting their fluid intake behaviors before bedtime, including volume and frequency. Thus, the sleep quality of the elderly could be improved in this way. In recent years, many studies on fluid intake and urination have been carried out in many countries on individuals of different ages. Some of them explored the effect of fluid intake on the urinary system in order to seek economic, safe, and simple approaches for the prevention or treatment of urinary system diseases (85, 86). The results in our present study were consistent with the results obtained from a controlled trial study on the elderly (87). The studies modified their lifestyles and restricted fluid intake to seek measurements in treating nocturia. The results showed that mean nocturnal urination times and volume decreased significantly from 3.6 to 2.7 times and from 923 to 768 mL, respectively. Another study revealed that guidance on water intake had an effect on the degree of nocturia, which concluded that fluid restriction should be performed not only in the evening but also during daytime (88). However, few studies found that there was no clear association between fluid intake and nocturia (89). The possible reason may be that the subjects were patients with urinary system disorders, and the urine metabolism had been disturbed. A previous study collected short-term urination, which was separated within 24 h, revealed that there were daily fluctuations in urine production (90). Influenced by the circadian pattern of arginine vasopressin release, urine volume was lower overnight, throughout the morning, and in the evening before going to sleep (91). These physiological factors should be considered when developing fluid intake strategies to improve urination behaviors. In addition, urine osmolality was always chosen as the indicator to evaluate hydration status when exploring the influence of fluid intake on hydration status. However the time period of urine collection and testing is worth considering as an influencing factor.
A previous study found that participants’ hydration status may be closely correlated with their fluid intake, urination behavior, and urine indicators. Research conducted on young people in China also revealed similar results (77, 92). Therefore, it is of great importance to explore suitable urine indicators to evaluate hydration status. Considering climate factors, fluid intake surveys should be conducted among the elderly of different age groups in other cities, which could represent seven major geographical divisions in China in the future. Daily losses of sweat, urine, and respiratory water, as well as the sensation of thirst caused by fluid consumption, can lead to a response to the physiological regulation of total body water. From the available literature and clinical findings, it is suggested that increasing fluid intake may play a potential role in altering the concentration of biomarkers in plasma, such as copeptin (93). Previous studies have indicated that individuals with habitually higher fluid intake have higher 24 h urine volume, higher urination frequency and higher urine concentration (94, 95). According to the above results, meeting the recommended amount of adequate fluid intake and allocating the appropriate frequency are challenges to the fluid intake literacy concerning the elderly.
Regarding the strengths of this study, to our knowledge, it was the first to investigate fluid intake patterns and urination behaviors among healthy elderly people in China. In the present study, the fluid intake patterns of the participants were investigated in detail, including different fluid types, frequency, and time. Moreover, we assessed the influence of fluid intake on urination behaviors at night so as to develop measures from the perspective of forming scientific water intake behaviors to improve the sleep quality of the elderly. In addition, a real-time recording for 7 consecutive days was used in this study to investigate urination behaviors. This could not only get more detailed, accurate, and dynamic data but also avoid the recall bias that commonly existed in retrospective investigations. Finally, we explored the association between fluid intake behaviors and urination behaviors in this study. This could reveal urination behaviors’ possibility of being indicators in evaluating fluid behaviors and hydration status. Despite the advantages mentioned above, the study did have some limitations. It is rather remarkable that only fluid intake levels were examined in the current study, as the levels of water obtained from food were not investigated. However, our previous research has shown that this was an important component of total water intake, which accounts for 50.7 to 51.5% (96). Participants with different TFI levels may have differences in water intake levels from food. Hence, i great importance is attached to conduct research on the dietary intake of participants to obtain the total water intake value. In addition, a previous study demonstrated that 24 h urine volume could be affected by fluid intake patterns, while the data were not collected in our study. Another concern about the findings was that the five cities in this study were not well-distributed, and the fluid intake levels of their inhabitants may be seasonally affected. As a result, this may lead to a limitation in the comprehensiveness of the time-point data obtained from this cross-sectional survey (97). Therefore, fluid intake research conducted across different times and different geographical regions in China should be considered. In this survey, the urine color of the participants was not explored and analyzed through objective and accurate measurements. Previous studies conducted on different participants indicated that differences in urine color were related to dehydration and hydration status (98–100). From these observations, great importance is attached to further exploring whether urine color can be an indicator of dehydration. In addition, blood and urine biomarkers were not tested in the present study. Hence, it is hard to assess the hydration status of the elderly so as to further explore the relationship between their fluid intake level and dehydration. In future studies, urine biomarkers, especially urine-specific gravity, should be tested to identify dehydration accurately and to explore its role in evaluating hydration status.
5 Conclusion
The TFI was inadequate for the elderly, with 73.3% of participants under the recommended amount of adequate fluid intake in China. The elderly exhibited several unhealthy urination behaviors, including urination at night. Participants with lower fluid intake levels had lower urination frequency, and participants with higher fluid intake and frequency experienced incidence of nocturia. Age and BMI were not the main influencing factors for fluid intake and urination behaviors. The results can contribute to strategies for promoting healthy fluid intake and urination behaviors, further improving the health of the elderly. Further studies for nationally representative data with more detailed detection of fluid intake, urine biomarkers, and hydration status are necessary to effectively analyze their impact on health for the elderly.
Data availability statement
The original contributions presented in the study are included in the article/supplementary material, further inquiries can be directed to the corresponding author.
Ethics statement
The studies involving humans were approved by the Ethical Review Committee of Peking University, identification code IRB 00001052-16071. The studies were conducted in accordance with the local legislation and institutional requirements. The participants provided their written informed consent to participate in this study.
Author contributions
YS: Conceptualization, Data curation, Formal analysis, Writing – original draft, Writing – review & editing. YZ: Data curation, Formal analysis, Investigation, Writing – review & editing. YL: Resources, Writing – review & editing. JZ: Data curation, Investigation, Methodology, Project administration, Writing – review & editing. JL: Investigation, Software, Writing – review & editing. XW: Investigation, Resources, Software, Writing – review & editing. NZ: Data curation, Funding acquisition, Investigation, Methodology, Project administration, Supervision, Validation, Visualization, Writing – review & editing. GM: Funding acquisition, Methodology, Project administration, Supervision, Validation, Visualization, Writing – review & editing.
Funding
The author(s) declare financial support was received for the research, authorship, and/or publication of this article. This work was supported by YIDO AI Technology (Shandong) Co., Ltd. YIDO AI Technology (Shandong) Co., Ltd. The funder was not involved in the study design, collection, analysis, interpretation of data, the writing of this article or the decision to submit it for publication.
Acknowledgments
The authors thank the YIDO AI Technology (Shandong) Co., Ltd., for funding the project. The authors thank all the participants who collaborated in this research. In addition, Yongye Song wants to thank the patience, care and support of Guansheng Ma and Na Zhang. Yongye Song also wants to thank Zhen He for enlightening her.
Conflict of interest
YL was employed by YIDO AI Technology (Shandong) Co., Ltd. The authors declare that this study received funding from YIDO Technology (Shandong) Co., Ltd.
The remaining authors declare that the research was conducted in the absence of any commercial or financial relationships that could be construed as a potential conflict of interest.
Publisher’s note
All claims expressed in this article are solely those of the authors and do not necessarily represent those of their affiliated organizations, or those of the publisher, the editors and the reviewers. Any product that may be evaluated in this article, or claim that may be made by its manufacturer, is not guaranteed or endorsed by the publisher.
Abbreviations
BMI, Body mass index; TFI, Total fluid intake; SSB, Sugar-sweetened beverage.
References
1. Armstrong-Esther, CA, Browne, KD, Armstrong-Esther, DC, and Sander, L. The institutionalized elderly: dry to the bone! Int J Nurs Stud. (1996) 33:619–28. doi: 10.1016/s0020-7489(96)00023-5
2. Drywień, ME, and Galon, K. Assessment of water intake from food and beverages by elderly in Poland. Rocz Panstw Zakl Hig. (2016) 67:399–408.
3. Senterre, C, Dramaix, M, and Thiébaut, I. Fluid intake survey among schoolchildren in belgium. BMC Public Health. (2014) 14:1–10. doi: 10.1186/1471-2458-14-651
4. Zhang, N, Zhang, F, Chen, S, Han, F, Lin, G, Zhai, Y, et al. Associations between hydration state and pregnancy complications, maternal-infant outcomes: protocol of a prospective observational cohort study. BMC Pregnancy Childbirth. (2020) 20:82–92. doi: 10.1186/s12884-020-2765-x
5. Wu, L, Chen, W, Liaw, F, Sun, Y, Yang, H, Wang, C, et al. Association between fluid intake and kidney function, and survival outcomes analysis: a nationwide population-based study. BMJ Open. (2016) 6:e010708–9. doi: 10.1136/bmjopen-2015-010708
6. Jéquier, E, and Constant, F. Water as an essential nutrient: the physiological basis of hydration. Eur J Clin Nutr. (2010) 64:115–23. doi: 10.1038/ejcn.2009.111
7. Pross, N, Demazières, A, Girard, N, Barnouin, R, Metzger, D, Klein, A, et al. Effects of changes in water intake on mood of high and low drinkers. PLoS One. (2014) 9:e94754. doi: 10.1371/journal.pone.0094754
8. Salvadó, JS, Eizaguirre, FM, Rodríguez-Mañas, L, de Pipaón, MS, Miñana, IV, and Aznar, LM. The importance of water consumption in health and disease prevention: the current situation. Nutr Hosp. (2020) 37:1072–86. doi: 10.20960/nh.03160
9. Masento, NA, Golightly, M, Field, DT, Butler, LT, and van Reekum, CM. Effects of hydration status on cognitive performance and mood. Br J Nutr. (2014) 111:1841–52. doi: 10.1017/S0007114513004455
10. Beck, AM, Seemer, J, Knudsen, AW, and Munk, T. Narrative review of low-intake dehydration in older adults. Nutrients. (2021) 13:1–16. doi: 10.3390/nu13093142
11. Strippoli, GFM, Craig, JC, Rochtchina, E, Flood, VM, Wang, JJ, and Mitchell, P. Fluid and nutrient intake and risk of chronic kidney disease. Nephrology (Carlton). (2011) 16:326–34. doi: 10.1111/j.1440-1797.2010.01415.x
12. Curhan, GC, Willett, WC, Knight, EL, and Stampfer, MJ. Dietary factors and the risk of incident kidney stones in younger women: nurses' health study ii. Arch Intern Med. (2004) 164:885–91. doi: 10.1001/archinte.164.8.885
13. Roussel, R, Fezeu, L, Bouby, N, Balkau, B, Lantieri, O, Alhenc-Gelas, F, et al. Low water intake and risk for new-onset hyperglycemia. Diabetes Care. (2011) 34:2551–4. doi: 10.2337/dc11-0652
14. Armstrong, LE, and Johnson, EC. Water intake, water balance, and the elusive daily water requirement. Nutrients. (2018) 10:1–25. doi: 10.3390/nu10121928
16. Russell, RM. Changes in gastrointestinal function attributed to aging. Am J Clin Nutr. (1992) 55:1203S–7S. doi: 10.1093/ajcn/55.6.1203S
18. Denic, A, Glassock, RJ, and Rule, AD. Structural and functional changes with the aging kidney. Adv Chronic Kidney Dis. (2016) 23:19–28. doi: 10.1053/j.ackd.2015.08.004
20. Popkin, BM, D'Anci, KE, and Rosenberg, IH. Water, hydration, and health. Nutr Rev. (2010) 68:439–58. doi: 10.1111/j.1753-4887.2010.00304.x
21. Zhang, N, and Ma, G. Water intake among senior citizen: current status and future directions. Acta Nutrimenta Sinica. (2023) 45:21–6. doi: 10.13325/j.cnki.acta.nutr.sin.2023.01.009
22. Chinese Nutrition Society. Chinese dietary reference intakes 2023. Beijing, China: Science Press (2023).
23. Ma, G, and Zuo, J. Adequate water intakes. Chin J Prev Med. (2011) 45:675–6. doi: 10.3760/cma.j.issn.0253-9624.2011.08.001
24. Hooper, L, Bunn, D, Jimoh, FO, and Fairweather-Tait, SJ. Water-loss dehydration and aging. Mech Ageing Dev. (2014) 136-137:50–8. doi: 10.1016/j.mad.2013.11.009
25. Phillips, PA, Rolls, BJ, Ledingham, JG, Forsling, ML, Morton, JJ, Crowe, MJ, et al. Reduced thirst after water deprivation in healthy elderly men. N Engl J Med. (1984) 311:753–9. doi: 10.1056/NEJM198409203111202
26. Mack, GW, Weseman, CA, Langhans, GW, Scherzer, H, Gillen, CM, and Nadel, ER. Body fluid balance in dehydrated healthy older men: thirst and renal osmoregulation. J Appl Physiol (1985). (1994) 76:1615–23. doi: 10.1152/jappl.1994.76.4.1615
28. Thompson-Torgerson, CS, Holowatz, LA, and Kenney, WL. Altered mechanisms of thermoregulatory vasoconstriction in aged human skin. Exerc Sport Sci Rev. (2008) 36:122–7. doi: 10.1097/JES.0b013e31817bfd47
29. Zhang, L, and Zhang, X. Investigation of urination disorder in parkinson's disease. Chin Med J. (2015) 128:2906–12. doi: 10.4103/0366-6999.168049
30. Ma, G. Hydration status and health. Chin J Prevent Med. (2019) 53:337–41. doi: 10.3760/cma.j.issn.0253-9624.2019.04.001
31. Volkert, D, Kreuel, K, and Stehle, P. Fluid intake of community-living, independent elderly in Germany--a nationwide, representative study. J Nutr Health Aging. (2005) 9:305–9.
32. Kant, AK, Graubard, BI, and Atchison, EA. Intakes of plain water, moisture in foods and beverages, and total water in the adult us population--nutritional, meal pattern, and body weight correlates: national health and nutrition examination surveys 1999-2006. Am J Clin Nutr. (2009) 90:655–63. doi: 10.3945/ajcn.2009.27749
33. Chinese Nutrition Society. Dietary guidelines for chinese residents: 2022. Beijing, China: People's Medical Publishing House (2022).
34. Chen, Y. The study on the relationship between water intake and other dietary factors and common chronic diseases in middle-aged and elderly people [D]. Shandong: Shandong University (2014).
35. Chinese Nutrition Society. Chinese dietary reference intakes 2007. Beijing: Science press (2007).
36. Cai, S, Ju, L, Zhao, L, Piao, W, Fang, H, Xu, X, et al. Water intake among Chinese residents aged 60-74 in China. Food and Nutrition in China. (2022) 28:5–8. doi: 10.19870/j.cnki.11-3716/ts.20220321.001
37. Yu, D, Zhao, L, Zhang, J, Yang, Z, Yang, L, Huang, J, et al. China nutrition and health surveys (1982–2017). China CDC Wkly. (2021) 3:193–5. doi: 10.46234/ccdcw2021.058
38. Morin, C, Gandy, J, Brazeilles, R, Moreno, LA, Kavouras, SA, Martinez, H, et al. Fluid intake patterns of children and adolescents: results of six liq.in(7) national cross-sectional surveys. Eur J Nutr. (2018) 57:113–23. doi: 10.1007/s00394-018-1725-y
39. Qian, Z, Xiao-Qi, H, Jiao-Lei, Z, Hui, P, and Guan-Sheng, M. Water intake of adults in four cities of China in summer. Chin J Prev Med. (2011) 45:677–82.
40. Institute Of Medicine. Dietary reference intakes for water, potassium, sodium, chloride, and sulfate. California: National Academy Press (2005).
41. Ma, G. Hydration and health. Chin. J. Prevent. Med. (2019) 4:337–41. doi: 10.26914/c.cnkihy.2019.036947
42. Wang, K, and Palmer, MH. Women's toileting behaviour related to urinary elimination: concept analysis. J Adv Nurs. (2010) 66:1874–84. doi: 10.1111/j.1365-2648.2010.05341.x
43. Zhang, N, Zhang, J, and Ma, G. Associations of water drinking and voiding behaviors with health. Chin J School Health. (2019) 40:1289–92. doi: 10.16835/j.cnki.1000-9817.2019.09.003
44. Zhang, N, He, H, Zhang, J, Chi, R, Li, Y, Zhang, Y, et al. Urination behaviours of senior citizens in five chinese cities: results of a cross-sectional survey. Int J Clin Pract. (2021) 75:e14285–12. doi: 10.1111/ijcp.14285
45. Bar-David, Y, Urkin, J, and Kozminsky, E. The effect of voluntary dehydration on cognitive functions of elementary school children. Acta Paediatr. (2005) 94:1667–73. doi: 10.1080/08035250500254670
46. Perrier, ET, Buendia-Jimenez, I, Vecchio, M, Armstrong, LE, Tack, I, and Klein, A. Twenty-four-hour urine osmolality as a physiological index of adequate water intake. Dis Markers. (2015) 2015:1–8. doi: 10.1155/2015/231063
47. Stookey, JD, Brass, B, Holliday, A, and Arieff, A. What is the cell hydration status of healthy children in the Usa? Preliminary data on urine osmolality and water intake. Public Health Nutr. (2012) 15:2148–56. doi: 10.1017/S1368980011003648
48. Malmgren, L, Mcguigan, FE, Christensson, A, and Akesson, KE. Kidney function and its association to imminent, short- and long-term fracture risk-a longitudinal study in older women. Osteoporos Int. (2020) 31:97–107. doi: 10.1007/s00198-019-05152-x
49. Wan, X, Wu, C, Xu, D, Huang, L, and Wang, K. Toileting behaviours and lower urinary tract symptoms among female nurses: a cross-sectional questionnaire survey. Int J Nurs Stud. (2017) 65:1–7. doi: 10.1016/j.ijnurstu.2016.10.005
50. Beetz, R. Mild dehydration: a risk factor of urinary tract infection? Eur J Clin Nutr. (2003) 57:S52–8. doi: 10.1038/sj.ejcn.1601902
51. Tian, Y, Cai, X, Wazir, R, Wang, K, and Li, H. Water consumption and urinary tract infections: an in vitro study. Int Urol Nephrol. (2016) 48:949–54. doi: 10.1007/s11255-016-1262-7
52. Lotan, Y, Daudon, M, Bruyère, F, Talaska, G, Strippoli, G, Johnson, RJ, et al. Impact of fluid intake in the prevention of urinary system diseases: a brief review. Curr Opin Nephrol Hypertens. (2013) 22 Suppl 1:S1–S10. doi: 10.1097/MNH.0b013e328360a268
53. Zhang, N, He, H, Cai, H, Zhang, J, and Ma, G. Voiding behaviors among primary and middle students in nine districts in Beijing. Chin J Sch Health. (2018) 39:1624–7. doi: 10.16835/j.cnki.1000-9817.2018.11.007
54. Zhang, N, Du, S, Tang, Z, Zheng, M, Yan, R, and Ma, G. Questionnaire survey on knowledge, attitude and practice of urinary elimination among college students in Hebei. Chin J Sch Health. (2016) 37:1624–6. doi: 10.16835/j.cnki.1000-9817.2016.11.008
55. Wan, X, Zhang, Y, Liu, Y, Wu, C, and Wang, K. Female nurse's toileting behaviors related to urinary elimination and its influencing factors. J Nurs Sci. (2014) 29:76–9. doi: 10.3870/hlxzz.2014.01.076
56. Kapsokefalou, M, Malisova, O, Pepa, A, Athanasatou, A, Husemann, M, Domnik, K, et al. Water intake and hydration indices in healthy adults; the european hydration research study (ehrs). Nutr Hosp. (2015) 32:1–12. doi: 10.3305/nh.2015.32.sup2.10265
57. Burchfield, JM, Ganio, MS, Kavouras, SA, Adams, JD, Gonzalez, MA, Ridings, CB, et al. 24-h void number as an indicator of hydration status. Eur J Clin Nutr. (2015) 69:638–41. doi: 10.1038/ejcn.2014.278
58. Li, Y, Zhang, N, He, H, Yan, Y, Zhang, J, and Ma, G. Fluids intake, volume of urine and hydration status among male college athletics in one university of Beijing in spring. Chin J School Health. (2020) 41:337–44. doi: 10.16835/j.cnki.1000-9817.2020.03.005
59. Zhang, Q, Hu, X, Zou, S, Zuo, J, Liu, Z, Pan, Q, et al. Water intake of adults in four cities of China in summer. Chinese Journal of Preventive Medicine. (2011) 45:677–82. doi: 10.3760/cma.j.issn.0253-9624.2011.08.002
60. Zhang, Y, Wang, X, Song, Y, Peng, R, Tang, T, Li, M, et al. Epidemiology of frequent/urgent urination in older adults in China: a multicenter, cross-sectional study. Front Public Health. (2021) 9:1–12. doi: 10.3389/fpubh.2021.669070
61. Zhang, N, Du, S, Zhang, J, He, H, Cai, H, and Ma, G. Summary and evaluation on methods of water-intake survey among population. Chin. J. Prevent. Med. (2019) 53:421–5. doi: 10.3760/cma.j.issn.0253-9624.2019.04.019
62. Ma, G, Zhang, Q, Liu, A, Zuo, J, Zhang, W, Zou, S, et al. Fluid intake of adults in four chinese cities. Nutr Rev. (2012) 70:S105–10. doi: 10.1111/j.1753-4887.2012.00520.x
63. Zhang, N, Morin, C, Guelinckx, I, Moreno, LA, Kavouras, SA, Gandy, J, et al. Fluid intake in urban China: results of the 2016 liq.In (7) national cross-sectional surveys. Eur J Nutr. (2018) 57:77–88. doi: 10.1007/s00394-018-1755-5
64. Zhang, N, He, H, Li, Y, Yan, Y, Zhang, J, and Ma, G. Analysis of the amount and types of fluid intake among male college students in spring. Chin J Sch Health. (2020) 41:329–32. doi: 10.16835/j.cnki.1000-9817.2020.03.003
65. Shahnazi, M, Tagavi, S, Hajizadeh, K, and Khalili, AF. The effects of intravenous hydration on amniotic fluid index in pregnant women with preterm premature rupture of membranes: a randomized clinical trial. J Caring Sci. (2013) 2:47–52. doi: 10.5681/jcs.2013.006
66. Zhang, J, Zhang, N, Liang, S, Wang, Y, Liu, S, Liu, S, et al. The amounts and contributions of total drinking fluids and water from food to total water intake of young adults in Baoding, China. Eur J Nutr. (2019) 58:2669–77. doi: 10.1007/s00394-018-1814-y
67. Technical Working Committee of China Beverage Industry Association. General standard for beverage. In: General Administration of Quality Supervision, inspection and quarantine of the People's Republic of China; China National Standardization Administration. Beijing, China: (2015)
68. Adams, WM, Zaplatosch, ME, Glenn, SE, Butts, CL, and Scarneo-Miller, SE. Characterizing fluid intake and physical activity in university students within the United States during the COVID-19 pandemic. Eur J Nutr. (2023) 62:1165–84. doi: 10.1007/s00394-022-03058-9
69. Fausnacht, AG, Myers, EA, Hess, EL, Davy, BM, and Hedrick, VE. Update of the bevq-15, a beverage intake questionnaire for habitual beverage intake for adults: determining comparative validity and reproducibility. J Hum Nutr Diet. (2020) 33:729–37. doi: 10.1111/jhn.12749
70. Kannan, N, and Kellum, JA. Physiology of urine volume In: J Vincent and JB Hall, editors. Encyclopedia of intensive care medicine. Berlin, Heidelberg: Springer Berlin Heidelberg (2012). 1732–4.
71. Goessaert, A, Schoenaers, B, Opdenakker, O, Hoebeke, P, Everaert, K, and Walle, JV. Long-term followup of children with nocturnal enuresis: increased frequency of nocturia in adulthood. J Urol. (2014) 191:1866–71. doi: 10.1016/j.juro.2013.12.051
72. Chinese Nutrition Society. Dietary guidelines for chinese residents: 2022. Beijing: People's Medical Publishing House (2022).
73. Zuo, J. Current status water intake of adults in four cities of China [D]. Beijing: Chinese Center for Diseases Control and Prevention (2011).
74. Song, Y, Zhang, F, Lin, G, Wang, X, He, L, Li, Y, et al. A study of the fluid intake, hydration status, and health effects among pregnant women in their second trimester in China: a cross-sectional study. Nutrients. (2023) 15:1–19. doi: 10.3390/nu15071739
75. Zhang, N, Zhang, J, Wang, X, Li, Y, Yan, Y, and Ma, G. Behaviors of water intake, hydration status, and related hydration biomarkers among physically active male young adults in Beijing, China: a cross-sectional study. Int J Clin Pract. (2022) 2022:1–13. doi: 10.1155/2022/9436186
76. Zhang, JF, Zhang, N, Liu, SF, Du, SM, and Ma, GS. Young adults with higher salt intake have inferior hydration status: a cross-sectional study. Nutrients. (2022) 14:1–13. doi: 10.3390/nu14020287
77. Zhang, N. Study of hydration status among adult male college students and the effect of hydration on cognitive performances [D]. Beijing, China: Chinese Center for Disease Control and Prevention (2017).
78. Chen, Y, Wu, X, Chen, L, and Xie, M. Study of influencing factors for urinary frequency in community-dwelling women. Chin Gen Pract. (2012) 15:1023–7. doi: 10.3969/j.issn.1007-9572.2012.09.023
79. Zhang, J, Liu, S, Zhang, N, Ma, L, He, H, Yan, X, et al. Analysis of the urination behaviour in spring among college students in Hebei province. Chin J Sch Health. (2019) 40:1304–7. doi: 10.16835/j.cnki.1000-9817.2019.09.007
80. Capisizu, A, Aurelian, J, Zamfirescu, A, Mihalache, R, and Sorina, MA. Outcomes in sensitivity of uropathogens in romanian elderly population: pilot study. J. Eur Geriatr Med. (2020) 11:S278.
81. Maserejian, NN, Kupelian, V, Mcvary, KT, Doshi, M, Link, CL, and Mckinlay, JB. Prevalence of post-micturition symptoms in association with lower urinary tract symptoms and health-related quality of life in men and women. BJU Int. (2011) 108:1452–8. doi: 10.1111/j.1464-410X.2010.10014.x
82. Asplund, R. Hip fractures, nocturia, and nocturnal polyuria in the elderly. Arch Gerontol Geriatr. (2006) 43:319–26. doi: 10.1016/j.archger.2005.12.002
83. Sudo, N. Disorder of urination and defecation in elderly. Nihon Ronen Igakkai Zasshi. (2012) 49:582–5. doi: 10.3143/geriatrics.49.582
84. Jensen, J, Lundin-Olsson, L, Nyberg, L, and Gustafson, Y. Falls among frail older people in residential care. Scand J Public Health. (2002) 30:54–61. doi: 10.1177/14034948020300011201
85. Hooton, TM, Vecchio, M, Iroz, A, Tack, I, Dornic, Q, Seksek, I, et al. Effect of increased daily water intake in premenopausal women with recurrent urinary tract infections: a randomized clinical trial. JAMA Intern Med. (2018) 178:1509–15. doi: 10.1001/jamainternmed.2018.4204
86. Spigt, MG, Knottnerus, JA, van de Beek, C, van Kerrebroeck, PE, van Amelsvoort, LG, and van Schayck, CPO. Short-term effects of increased urine output on male bladder function and lower urinary tract symptoms. Urology. (2004) 64:499–503. doi: 10.1016/j.urology.2004.04.010
87. Soda, T, Masui, K, Okuno, H, Terai, A, Ogawa, O, and Yoshimura, K. Efficacy of nondrug lifestyle measures for the treatment of nocturia. J Urol. (2010) 184:1000–4. doi: 10.1016/j.juro.2010.05.038
88. Tani, M, Hirayama, A, Torimoto, K, Matsushita, C, Yamada, A, and Fujimoto, K. Guidance on water intake effectively improves urinary frequency in patients with nocturia. Int J Urol. (2014) 21:595–600. doi: 10.1111/iju.12387
89. Zimmern, P, Litman, HJ, Mueller, E, Norton, P, Goode, P, and Network, UIT. Effect of fluid management on fluid intake and urge incontinence in a trial for overactive bladder in women. BJU Int. (2010) 105:1680–5. doi: 10.1111/j.1464-410X.2009.09055.x
90. Perrier, E, Demazières, A, Girard, N, Pross, N, Osbild, D, Metzger, D, et al. Circadian variation and responsiveness of hydration biomarkers to changes in daily water intake. Eur J Appl Physiol. (2013) 113:2143–51. doi: 10.1007/s00421-013-2649-0
91. George, CP, Messerli, FH, Genest, J, Nowaczynski, W, Boucher, R, and Orofo-Oftega, MK. Diurnal variation of plasma vasopressin in man. J Clin Endocrinol Metab. (1975) 41:332–8. doi: 10.1210/jcem-41-2-332
92. Zhang, N, Du, S, Tang, Z, Zheng, M, Yan, R, Zhu, Y, et al. Hydration, fluid intake, and related urine biomarkers among male college students in Cangzhou, China: a cross-sectional study-applications for assessing fluid intake and adequate water intake. Int J Environ Res Public Health. (2017) 14:1–12. doi: 10.3390/ijerph14050513
93. Lemetais, G, Melander, O, Vecchio, M, Bottin, JH, Enhörning, S, and Perrier, ET. Effect of increased water intake on plasma copeptin in healthy adults. Eur J Nutr. (2018) 57:1883–90. doi: 10.1007/s00394-017-1471-6
94. Perrier, E, Vergne, S, Klein, A, Poupin, M, Rondeau, P, Le Bellego, L, et al. Hydration biomarkers in free-living adults with different levels of habitual fluid consumption. Br J Nutr. (2013) 109:1678–87. doi: 10.1017/S0007114512003601
95. Armstrong, LE, Pumerantz, AC, Fiala, KA, Roti, MW, Kavouras, SA, Casa, DJ, et al. Human hydration indices: acute and longitudinal reference values. Int J Sport Nutr Exerc Metab. (2010) 20:145–53. doi: 10.1123/ijsnem.20.2.145
96. Zhang, J, Ma, G, Du, S, Liu, S, and Zhang, N. Effects of water restriction and supplementation on cognitive performances and mood among young adults in Baoding, China: a randomized controlled trial (rct). Nutrients. (2021) 13:1–19. doi: 10.3390/nu13103645
97. Fan, Y, Li, Z, and Loh, YC. Evaluation and education of hydration and sodium status in a cool environment among Chinese athletes. Eur Rev Med Pharmacol Sci. (2022) 26:6896–903. doi: 10.26355/eurrev_202210_29869
98. Mckenzie, AL, Muñoz, CX, Ellis, LA, Perrier, ET, Guelinckx, I, Klein, A, et al. Urine color as an indicator of urine concentration in pregnant and lactating women. Eur J Nutr. (2017) 56:355–62. doi: 10.1007/s00394-015-1085-9
99. Zhang, N, Du, S, Zheng, M, Tang, Z, Yan, R, Zhu, Y, et al. Urine color for assessment of dehydration among college men students in Hebei, China - a cross-sectional study. Asia Pac J Clin Nutr. (2017) 26:788–93. doi: 10.6133/apjcn.052017.09
Keywords: the elderly, fluid intake, urination behaviors, hydration status, cross-sectional study
Citation: Song Y, Zhang Y, Liu Y, Zhang J, Lu J, Wang X, Zhang N and Ma G (2024) Analysis on fluid intake and urination behaviors among the elderly in five cities in China: a cross-sectional study. Front. Nutr. 10:1280098. doi: 10.3389/fnut.2023.1280098
Edited by:
Domenico Sergi, University of Ferrara, ItalyReviewed by:
Fabiana Baggio Nerbass, Fundacão Pró-Rim, BrazilAgata Bialecka-Debek, Warsaw University of Life Sciences, Poland
Copyright © 2024 Song, Zhang, Liu, Zhang, Lu, Wang, Zhang and Ma. This is an open-access article distributed under the terms of the Creative Commons Attribution License (CC BY). The use, distribution or reproduction in other forums is permitted, provided the original author(s) and the copyright owner(s) are credited and that the original publication in this journal is cited, in accordance with accepted academic practice. No use, distribution or reproduction is permitted which does not comply with these terms.
*Correspondence: Na Zhang, emhhbmduYUBiam11LmVkdS5jbg==