 Nompumelelo Gumede
 Andile Khathi
- Department of Human Physiology, School of Laboratory Medicine and Medical Sciences, College of Health Sciences, University of KwaZulu-Natal, Durban, South Africa
Introduction: Type 2 diabetes mellitus (T2DM) is associated with an increased risk of cardiovascular diseases (CVD). However, the onset of T2DM is preceded by prediabetes, which is associated with sedentary lifestyles and consumption of high-calorie diets. Studies have shown that impaired glucose homeostasis creates an environment for developing T2DM-related complications. Using a high-fat-high-carbohydrate diet-induced prediabetes animal model, this study sought to assess the risk factors of coronary heart disease (CHD) in diet-induced prediabetes and identify biomarkers that can be used for early detection of prediabetes-associated CHD.
Methods: Male Sprague Dawley rats were randomly grouped into two groups and were kept on different diets for 20 weeks (n = 6 in each group). One group was fed standard rat chow to serve as a non-prediabetes (NPD) control, while the other group consumed a high-fat-high-carbohydrate diet to induce prediabetes (PD). Post induction, the homeostasis model assessment- insulin resistance (HOMA-IR) and glycated haemoglobin (HbA1c) was used to test for insulin resistance. Body weight, mean arterial pressure (MAP), resting heart rate (HR), inflammatory cytokines (C-reactive protein (CRP), tumor necrosis factor (TNF-α), interleukin-6 (IL-6)), lipids (total cholesterol (TC), triglyceride (TG), lipoproteins (HDL, LDL, VLDL)), endothelial function (endothelial nitric oxide (eNOS), endothelin -1 (ET-1)), fibrinolysis (plasminogen activator inhibitor-1 (PAI-1)) were all measured to assess the risk of CHD. All data were expressed as means ± S.E.M. Statistical comparisons were performed with Graph Pad. Instat Software using Student’s two-sided t-test. The Pearson correlation coefficient and linear regression were calculated to assess the association. The value of p < 0.05 was considered statistically significant.
Results: There was significant insulin resistance accompanied by significantly increased HbA1c and body weight in PD compared to NPD. Simultaneously, there was a significant increase in inflammatory cytokines in PD compared to NPD. This was accompanied by significantly increased TG and VLDL and endothelial dysfunction in PD. The association between HOMA-IR and PAI-1 was insignificantly positive in NPD, whereas a significantly strong positive association was observed in PD.
Conclusion: There is a positive correlation between insulin resistance and PAI-1 during prediabetes; therefore, suggesting that prediabetes increases the risk of developing vascular thrombosis. The current therefore study warrants further investigation on PAI-1 and other markers of fibrinolysis for the early detection of thrombosis and risk of CHD in prediabetes.
Introduction
Type 2 diabetes mellitus (T2DM)-related complications have been shown to begin during prediabetes, an asymptomatic state of intermediate hyperglycemia where blood glucose levels are above normal but below the threshold of T2DM (1). Prediabetes can be described as having impaired fasting glucose (IFG), impaired glucose tolerance (IGT) as well as glycated haemoglobin (HbA1c) (2). However, the inclusion criteria and cut-off values for the diagnosis of prediabetes vary within organizations such as the American Diabetes Association (ADA), World Health Organization (WHO) and the International Diabetes Federation (IDF) and this affects the prevalence and incidence data for this condition (3). The global prevalence of prediabetes in 20-79-year-olds defined by IGT in 2021 was 9.1% (464 million) and is projected to reach 10.0% (638 million) in 2045. When defined by IFG, the prevalence was 5.8% (298 million) and is projected to reach 6.5% (414 million) in 2045 (4). Shockingly, it is reported that the prevalence of prediabetes is 13.9 and 24.6% in children (4–9.9 years) and adolescents (10–17.9 years), respectively and it is increased by the class of obesity (5). The rising burden of prediabetes is postulated to be due to chronic consumption of unhealthy diets, thus leading to obesity and insulin resistance (6, 7). Impaired glucose handling due to insulin resistance produces hyperglycemia, a conducive environment for developing cardiovascular diseases (CVD) (8). Prediabetes is associated with an increased risk of composite CVD and all-cause mortality (8). Hyperglycemia increases diacylglycerol and protein kinase C (PKC) activation in vascular cells. This is associated with inflammation through the activation of nuclear factor κ-В(NF-κв) (9). Activation of NF-Κв stimulates the expression and release of inflammatory cytokines, which injure the vascular endothelium (9). Monocytes infiltrate the site of injury and become macrophages (10). Macrophages engulf activated LDL and become foam cells, which form a fatty streak and ultimately an atherosclerotic plug (10–14). Rupture of the atherosclerotic plug may cause acute vascular infarction (11). Hyperglycaemia, as shown in T2DM, also results in the upregulation of endothelin 1 (ET-1) while reducing nitric oxide (NO) secretion, thus creating an imbalance between endothelial vasoconstrictors and vasodilators (15). Macrophages and vascular smooth muscle cells further increase ET-1 as they also secret ET-1 under hyperglycaemic conditions. This favors vasoconstriction, increased blood pressure and abnormal blood flow (16, 17). Alternatively, fibrinolysis is impaired in T2DM (18, 19). Plasminogen activator inhibitor (PAI-1), which plays a regulatory role in fibrinolysis, is elevated in the arterial wall of diabetic patients (10, 20, 21). An increase in PAI-1 levels causes coronary thrombosis and it isassociated with an increased risk of CHD (22). Assessing the level of PAI-1 during prediabetes, a reversible condition, could help predict the onset or progression of CHD. Using an HFHC diet-induced prediabetes animal developed in our laboratory, previous studies have demonstrated that some T2DM complications begin during prediabetes (23–26). Biomarkers are helpful in predicting a disease’s onset and identifying its presence when fully developed (27). Therefore, there is a need to assess CHD biomarkers during prediabetes for early intervention and prevention. This study aimed to determine the risk factors of CHD in diet-induced prediabetes and identify biomarkers that can be used for the early detection of prediabetes-associated CHD.
Materials and methods
Animals
Male Sprague–Dawley rats (150–180 g) were obtained from the biomedical research unit (BRU), University of KwaZulu Natal (UKZN) and kept under standard experimental conditions at room temperature (22±2°C), humidity (55 5%), and 12 h day:12 h night cycle. The animals consumed a standard rat chow (Meadow Feeds, South Africa) and water ad libitum for 2 weeks to acclimatize before being exposed to an experimental diet (high-fat, high carbohydrate). The high-fat high carbohydrate (HFHC) is composed of carbohydrates (55%kcal/g), fats (30%kcal/g), and proteins (15%kcal/g) as previously described (26, 28). All experimental procedures were conducted in line with the ARRIVE guidelines and according to the ethics and animal care guidelines of the Animal Research Ethics (AREC) Committee of the University of KwaZulu Natal, Durban, South Africa (Ethics No: AREC024/018D).
Experimental design
After 2 weeks of acclimatization, the animals were grouped into a normal diet group (n = 6) and a high-fat high carbohydrate diet group (n = 6). The normal diet group was fed a standard rat chow and water ad libitum. The high-fat high carbohydrate (HFHC) group was fed an HFHC diet and water supplemented with fructose (15%) for 20 weeks to induce prediabetes. After 20 weeks, the animals were all tested for prediabetes using the American Diabetes Association (ADA) criteria for diagnosis of prediabetes. The ADA criteria involve the use of HbA1c, which has several advantages compared to using FBG and OGTT. Animals with fasting blood glucose (FBG) concentrations of 5.60–7.10 mmol/L, oral glucose tolerance test (OGTT) 2 h glucose concentration of 7.1–11.1 mmol/L and glycated haemoglobin (Hb1Ac) concentration of 5.7–6.4% were considered prediabetic. FBG was determined after a 12 h fasting period using the tail-prick method and measured using a One-Touch select glucometer (Lifescan, Malta, United Kingdom). This was also recorded as time 0 for OGTT. OGTT was conducted as per laboratory-established protocol (29–31). Glucose (0.86 g/kg, p.o.) was loaded into the animals via oral gavage (18-gauge gavage needle, 38 mm long curved with 21/4 mm ball end). Glucose concentrations were measured at 15-, 30-, 60-, and 120-min following glucose loading. HbAc was measured using an ELISA kit. The body weights of all animals were measured at the end of the induction period. At the end of the 20 weeks, the animals kept on a normal diet were found to be non-prediabetic and were termed the non-prediabetes group (NPD), while those kept on an HFHC diet were found to be prediabetic and were termed the prediabetic group (PD).
The homeostasis model assessment
At the end of the induction period, the Homeostasis Model assessment was used to measure HOMA-IR to assess insulin resistance using the HOMA2 Calculator v2.2.3 program (32). In the homeostasis model assessment (HOMA), insulin resistance is expressed as HOMA-IR value <1.0 = insulin sensitive, > 1.9 = early insulin resistance, > 2.9 = significant insulin resistance (32).
Blood pressure and heart rate
Blood pressure and heart rate were measured using the non-invasive MRBP IITC Model 31, Life Sciences multichannel tail-cuff blood pressure system (Life Sciences, Woodland Hills, CA), as previously described (28). Briefly, the animals were placed in a restrainer (3 ID (75 mm)- 12” length) while the tail was attached to the tail cuff. All the rats in the restrainer were placed in a warming chamber (IITC Model 303sc Animal Test Chamber, Life Sciences, Woodland Hills, CA) maintained at 32°C. The blood pressure, as well as the heart rate, were measured by occlusion or deflation of the tail-cuff, which detects alteration of blood flow in the tail artery. An average of 3 measured sessions comprising 15 cycles was used for statistical analysis.
Blood collection and tissue harvesting
The animals were placed in a gas chamber (BRU, UKZN, South Africa) and anesthetized with 100 mg/kg of Isofor (Safeline Pharmaceuticals Ltd., Roodepoort, South Africa) for 3 min to collect blood samples. Blood samples were collected by cardiac puncture into precooled heparinized containers in an unconscious state. The blood samples were centrifuged (Eppendorf centrifuge 5,403, Germany) at 4°C, 503 g for 15 min to collect plasma. The plasma was stored at −80°C in a Bio Ultra freezer (Snijers Scientific, Tilburg, Holland). The hearts of all the animals were excised, rinsed with cold standard saline solution, weighed, and snapped frozen in liquid nitrogen before storage in a Bio Ultra freezer at −80°C for biochemical analysis (28, 31).
Biochemical analysis
Inflammatory cytokines
Inflammatory cytokines (IL-6, TNF-α and CRP) concentration was measured in plasma using their respective rat sandwich ELISA kits (IL-6: E-EL-R0015) (TNF-α: E-EL-R2856) (CRP: E-EL-R0506) according to the manufacturer’s protocol (Elabscience Biotechnology Co., Ltd., Houston, TXA, United States). Briefly, 100 μL of plasma from NPD and PD was pipetted in duplicate in the micro-ELISA plated precoated with a specific antibody. Then, specific biotinylated detection and Avidin-Horseradish Peroxidase (HRP) conjugate were added successively to each microplate well and incubated. Unbound components were washed away. The substrate solution was then added to each well. Only those wells containing rat IL-6/TNF-6/CRP, biotinylated detection antibody and Avidin-HRP conjugated appeared blue.
The enzyme-substrate reaction was terminated by adding a stop solution and the color turned yellow. The optical density (OD) was read spectrophotometrically at a wavelength of 450 nm (Spectrostar Nano spectrophotometer) (BMG Labtech, Ortenburg, LGBW Germany). The OD values of each well were averaged, and the average of the blank was subtracted. The concentration of the samples was interpolated from the standard curve, normality test, descriptive statistics and unpaired t-test was performed on Graph Pad Instat Software (version 8.00, GraphPad Software, Inc., San Diego, California, United States).
Lipid profile
The total plasma cholesterol (TC), high-density lipoprotein (HDL) cholesterol and triglycerides (TG) were analyzed using colorimetric assays according to the instructions from the manufacturer (TC: E-BC-K109-S) (HDL: E-BC-K222-S) (TG: E-BC-K261-S) (Elabscience Biotechnology Co., Ltd., Houston, TXA, United States). The optical density values were measured via a Spectrostar Nano spectrophotometer (BMG Labtech, Ortenburg, LGBW Germany). Very low-density lipoprotein (VLDL) and low-density lipoprotein (LDL) cholesterol were calculated using Friedewald’s formula: VLDL cholesterol = TG0.2 and LDL cholesterol = TC (VLDL cholesterol HDL cholesterol) (33).
Endothelial function
The endothelial function was evaluated from plasma by determining endothelial nitric oxide synthase (eNOS) and endothelin-1 (ET-1) concentration using specific sandwich ELISA kits (eNOS: E-EL-R0367) (ET-1: E-EL-R1458) as per the manufacturer’s protocol (Elabscience Biotechnology Co., Ltd., Houston, TX, United States). Briefly, 100 μL of plasma from NPD and PD was added in duplicate in the micro-ELISA plated precoated with a specific antibody. Then, specific biotinylated detection and Avidin-Horseradish Peroxidase (HRP) conjugate were pipetted successively to each microplate well and incubated. Unbound components were washed away. The substrate solution was then added to each well. Only those wells that contained rat ET-1/eNOS, biotinylated detection antibody and Avidin-HRP conjugated appeared blue in color. The enzyme-substrate reaction was terminated by adding a stop solution and the color turned yellow. The optical density (OD) was read spectrophotometrically at a wavelength of 450 nm (Spectrostar Nano spectrophotometer) (BMG Labtech, Ortenburg, LGBW Germany). The OD values of each well were averaged, and the average of the blank was subtracted. The concentration of the samples was interpolated from the standard curve, normality test, descriptive statistics and unpaired t-test was performed on Graph Pad Instat Software (version 8.00, GraphPad Software, Inc., San Diego, California, United States).
Fibrinolysis
Fibrinolysis was evaluated from the plasma using rat PAI-1 sandwich ELISA (ab201283) according to the manufacturer’s protocol (Abcam Inc., Cambridge, United Kingdom). Briefly, 50 μL of plasma from the NPD and PD samples was diluted in a 1:4 ratio with a Sample Diluent NS. The samples were pipetted in duplicates into separate wells in the micro-ELISA plate. 50 μL of antibody cocktail was pipetted into each well. The plate was then sealed and incubated for 1 h at room temperature on a plate shaker set at 400 rpm (Titramax 1,000, Heidolph Instruments company, Schwabach, Germany). The plate was then washed three times. A 100 μL TMB solution was pipetted into each well and incubated for 10 min in the dark on a plate shaker set at 400 rpm. A 100 μL stop solution was added, and the plate was placed on a plate shaker for 1 min to mix. The OD values were read at the endpoint at a wavelength of 450 nm (Spectrostar Nano spectrophotometer) (BMG Labtech, Ortenburg, LGBW Germany). The OD values of each well were averaged, and the average of the blank was subtracted. The concentration of the samples was interpolated from the standard curve. The concentrations were multiplied by four, the dilution factor. Normality test, descriptive statistics and unpaired t-test were performed on Graph Pad Instat Software (version 8.00, GraphPad Software, Inc., San Diego, California, United States).
Statistical analysis
All data were expressed as means ± S.E.M. Statistical comparisons were performed with Graph Pad Instat Software (version 8.00, GraphPad Software, Inc., San Diego, California, United States) using Student’s unpaired two-sided t-test. Pearson correlation coefficient and linear regression were calculated to assess the relationship between HOMA-IR and CRP, HOMA-IR and PAI-1, HbA1c and CRP, as well as HbA1c and PAI-1. A value of p < 0.05 was considered statistically significant.
Results
HOMA-IR
At the end of the prediabetes induction period (20 weeks), body weights, fasting blood glucose (FBG), plasma insulin and insulin resistance were assessed in the NPD and PD groups. Table 1 shows a significant increase (p < 0.0001) in body weights, FBG, plasma insulin and HOMA-IR in the PD group compared to the NPD group. The mean FBG concentration (6.72 ± 0.12 mmol/L) in the PD group was within the ADA prediabetes diagnosis FBG range (5.60–7.10 mmol/L), whereas, for the NPD group, it was below (4.40 ± 0.20 mmol/L). The HOMA-IR value for the NPD was within the insulin sensitivity range (<1.0), whereas it was significantly higher for the PD group and within the insulin resistance range.
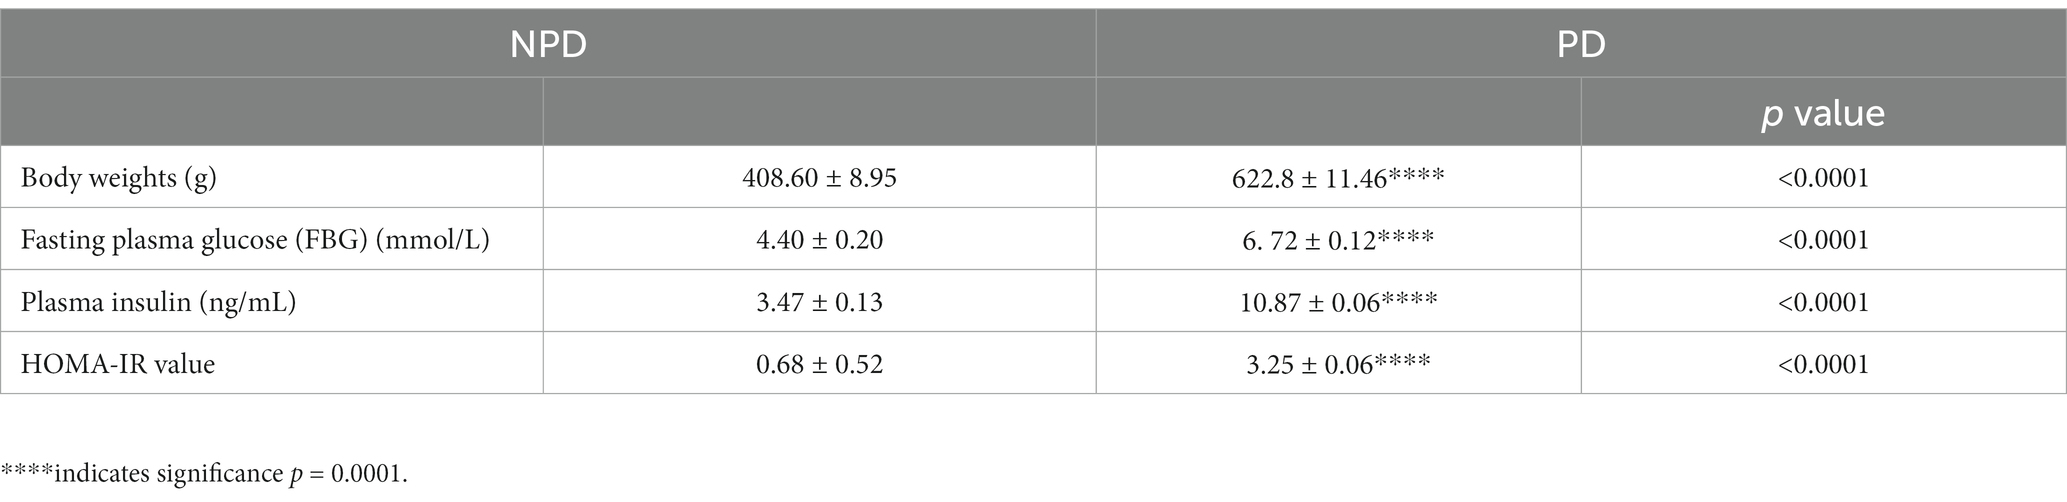
Table 1. Fasting blood glucose, plasma insulin, and HOMA-IR value between NPD and PD.
Glycated haemoglobin
The concentration of HbA1c was measured at the end of the prediabetes induction period between the NPD and PD groups. Figure 1 shows a significant increase (p = 0.0443) in the concentration of HbA1c in the PD group compared to the NPD group. The mean HbA1c concentration (6.49 ± 0.32 mmol/mol) of the NPD group was within the prediabetes HbA1c diagnosis range (5.70–7.10%), whereas the mean HbA1c concentration (4.32 ± 0.89 mmol/mol) of the NPD group was below the range.
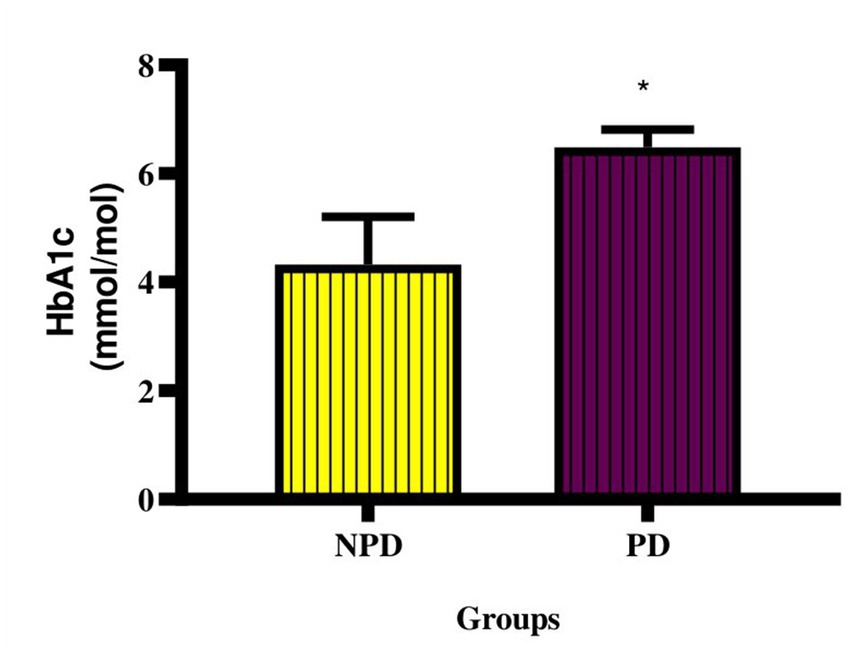
Figure 1. Concentration of HbA1c between the NPD and PD groups. Values are presented as mean ± SEM (n = 6 in each group). * Indicates p = 0.0443. NPD, non-prediabetes; PD, prediabetes; HbA1c, glycated haemoglobin.
Mean arterial pressure and resting heart rate measurement
The MAP and resting HR were measured at week 20 between the NPD and PD groups. Figure 2A shows a significant increase (p < 0.0001) in MAP (NPD: 92.80 ± 5.14 mmHg; PD: 143.40 ± 3.20 mmHg) and Figure 2B shows a significant increase (p < 0.0001) in resting HR (NPD: 195.0 ± 15.07 BPM; PD: 340.30 ± 4.77 BPM) between the NDP and the PD group.
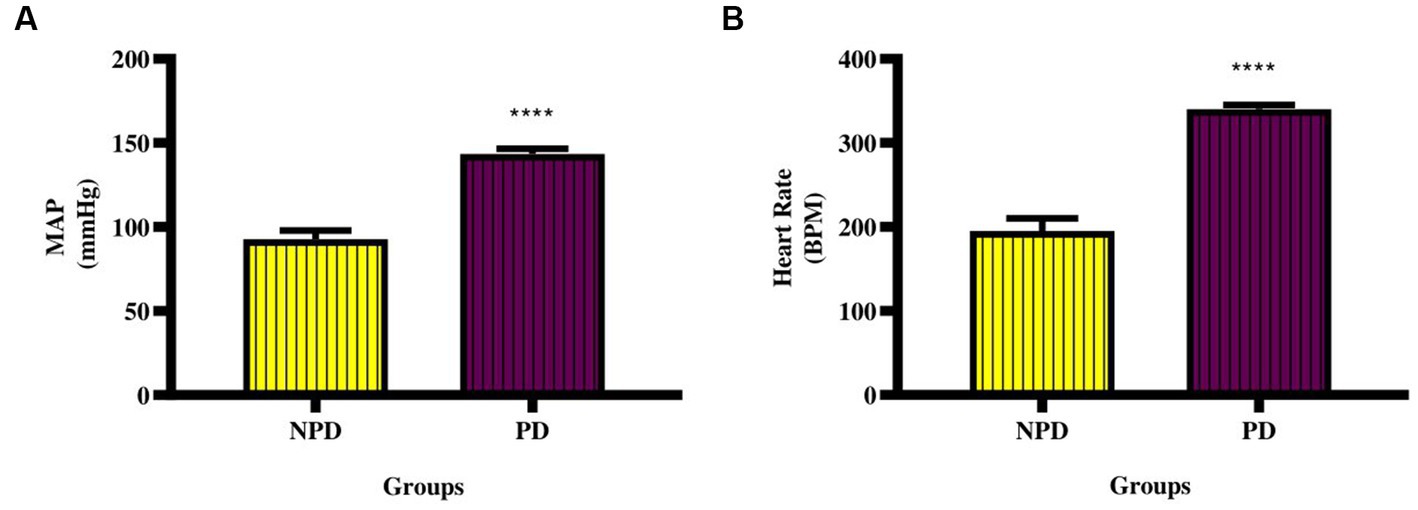
Figure 2. Mean arterial pressure and resting heart rate between the NPD and PD. Values are presented as mean ± SEM (n = 6 in each group). (A) ****indicates p < 0.0001; (B) ****indicates p < 0.0001 NPD, non-prediabetic; PD, prediabetes; MAP, mean arterial pressure; HR, resting heart rate.
Inflammatory cytokines
The CRP, TNF-α and IL-6 concentration was measured in plasma at week 20 between the NPD and PD groups. Figure 3A shows a significant increase (p < 0.0001) in CRP (NPD: 9.39 ± 0.29 ng/mL; PD: 16.74 ± 0.53 ng/mL), Figure 3B shows a significant increase (p = 0.0369) in TNF-α (NPD: 189.60 ± 2.34 pg./mL; PD: 234.60 ± 14.42 pg./mL), and Figure 3C shows a significant increase (p = 0.0078) in IL-6 (NPD: 321.60 ± 5.60 pg./mL; PD: 384.90 ± 11.50 pg./mL) in the PD group compared to the NPD group.
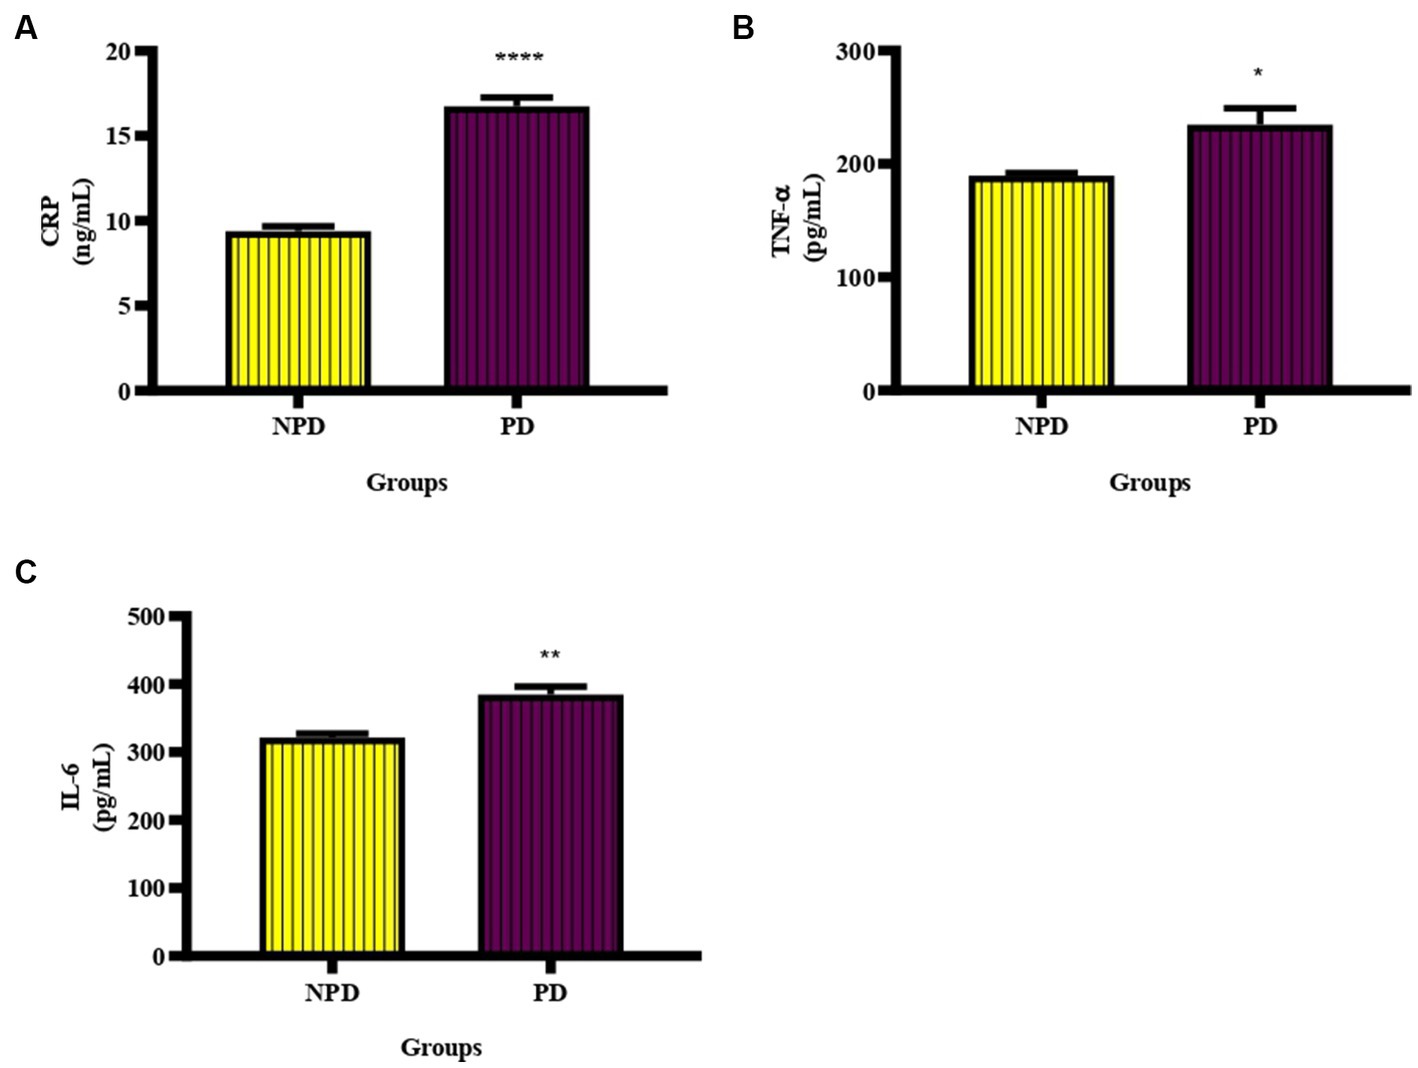
Figure 3. The CRP, TNF- α and IL-6 concentration between the NPD and PD groups. Values are presented as mean ± SEM (n = 6 in each group). (A) ****indicates p < 0.0001, (B) *indicates p = 0.0369, (C) **indicates p = 0.0078. NPD, non-prediabetic; PD, prediabetic; CRP, C-reactive protein, TNF-α, tumor necrosis factor alpha; IL-6, interleukin 6.
Lipid profile
The TG, TC and HDL concentration between the NPD and PD groups was measured in plasma at week 20. The concentration of LDL and VLDL was calculated using Friedewald’s formula. Table 2 shows a significant increase in the concentration of TG and VLDL in the PD compared to the NPD group, while there was a significant decrease in the concentration of LDL in the PD compared to the NPD.
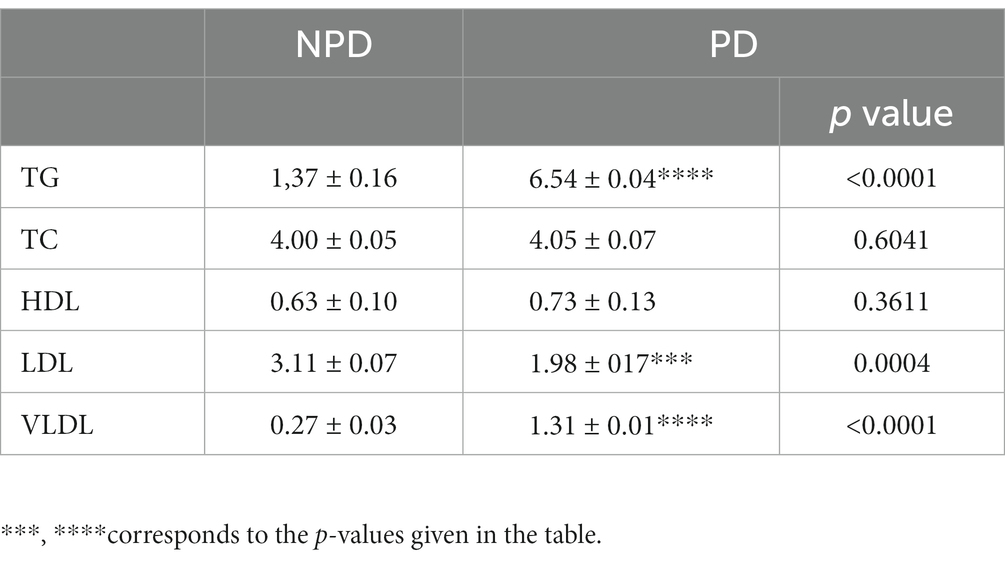
Table 2. Lipid concentration between NPD and PD groups.
Endothelial function
The concentration of eNOS and ET-1 was measured in plasma at week 20 between the NPD and PD groups. In Figure 4A shows a significant decrease (p = 0.0338) in eNOS (NPD: 9.97 ± 0.03 pg./mL; PD: 7.04 ± 0.93 pg./mL) and Figure 4B shows a significant increase (p = 0.0463) in ET-1 (NPD: 0.89 ± 0.03 pg./mL; PD: 1.71 ± 0.32 pg./mL) in the PD group compared to the NPD group.
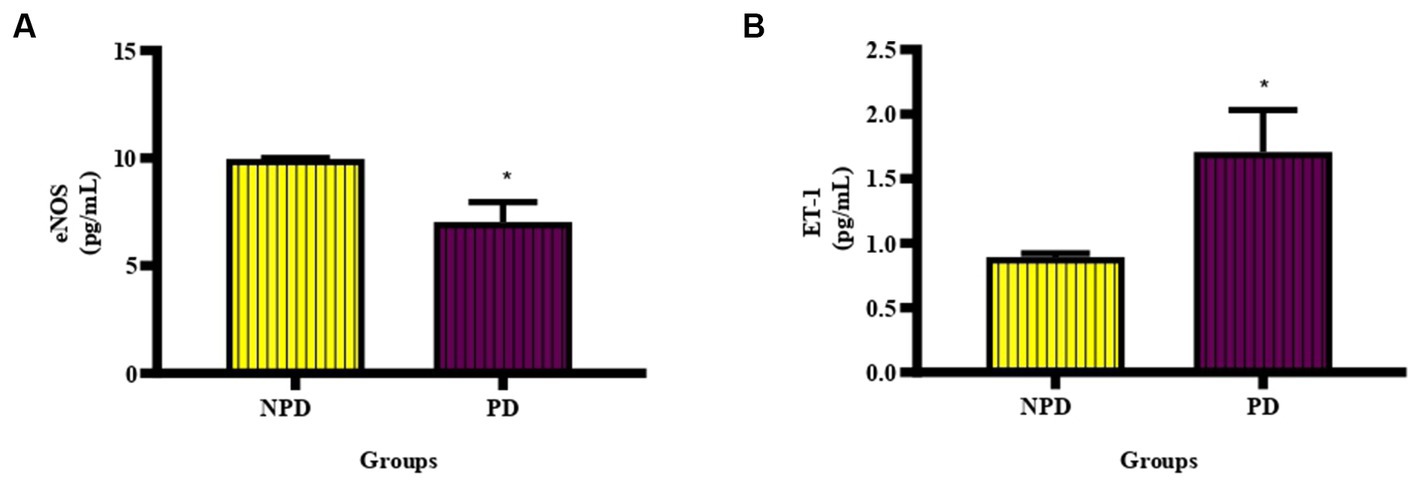
Figure 4. The concentration of eNOS and ET-1 between the NPD and PD groups. Values are presented as mean ± SEM (n = 6 in each group). (A) *Indicates p = 0.0338, (B) *indicates p = 0.0463; NPD, non-prediabetic; PD, prediabetes; eNOS, endothelial nitric oxide synthase; ET-1, endothelin-1.
Fibrinolysis
The concentration of PAI-1 was analyzed in plasma at the end of week 20 between the NPD and PD groups. Figure 5 shows a box and whisker plot for the concentration of PAI-1 between the NPD and PD groups. The mean concentration of PAI-1 (3077 ± 664.30 pg./mL) in the PD group was higher compared to the NPD group (1821 ± 78.91 pg./mL); however, the increase was insignificant (p = 0.1336).
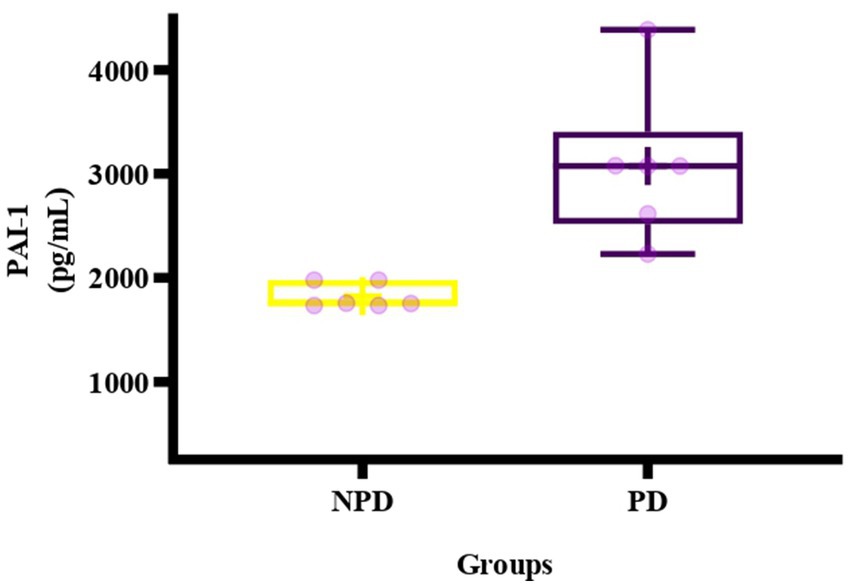
Figure 5. Box plot of the concentration of PAI-1 in the NPD and PD groups. The top of the box represents the 75th percentile, the bottom of the box represents the 25th percentile, and the line in the middle of the box represents the 50th percentile. The whiskers represent the highest and lowest values. + in the middle of the box shows the mean. NPD, non-prediabetes; PD, prediabetes; PAI-1, plasminogen activator inhibitor-1.
Correlation and linear regression analysis
Correlation and linear regression between HOMA-IR and CRP, HOMA-1R and PAI-1, between HbA1c and CRP, as well as HbA1c and PAI-1, was calculated between the NPD and PD groups. Table 3 shows an insignificant positive association between HOMA-IR and CRP concentration of the NPD group (r = 0.40, p = 0.6047) and the PD group (r = 0.93, p = 0.0682). Regression results depicted that the model predicts a 16% (R2 = 0.16, p = 0.6047) change in CRP in the NPD group compared to an 87% change in the PD group (R2 = 0.87, p = 0.0682). There was an insignificant positive association between HOMA-IR and PAI-1 concentration in the NPD (r = 0.05, p = 0.9690). In contrast, the PD group had a strong positive and significant association with PAI-1 concentration (r = 1, p = 0.0227). Regression analysis showed that the model predicts a 0% (R2 = 0.00, p = 0.9690) relationship between HOMA-IR and PAI-1 in the NPD group. In contrast, there was a 99.87% (R2 = 0.9987, p = 0.0227) relationship between HOMA-IR and PAI-1 in the PD group. The association between HbA1c and CRP concentration was positive and insignificant in the NPD (r = 0.85, p = 0.1472) and PD groups (r = 0.09, p = 0.9145). Regression analysis showed a 73% (R2 = 0.73, p = 0.1472) and a 10% (R2 = 0.01, p = 0.9145) relationship between HbA1c and CRP in the NPD and PD groups, respectively. The association between HbA1c and the concentration of PAI was insignificant in the NPD group (r = 0.38, p = 0.7550) and PD group (r = 0.76, p = 0.4512). Regression analysis showed that the model predicts a 14% (R2 = 0.14, p = 0.7750) and a 58% (R2 = 0.58, p = 0.4512) change in PAI-1 in the NPD and PD groups, respectively.
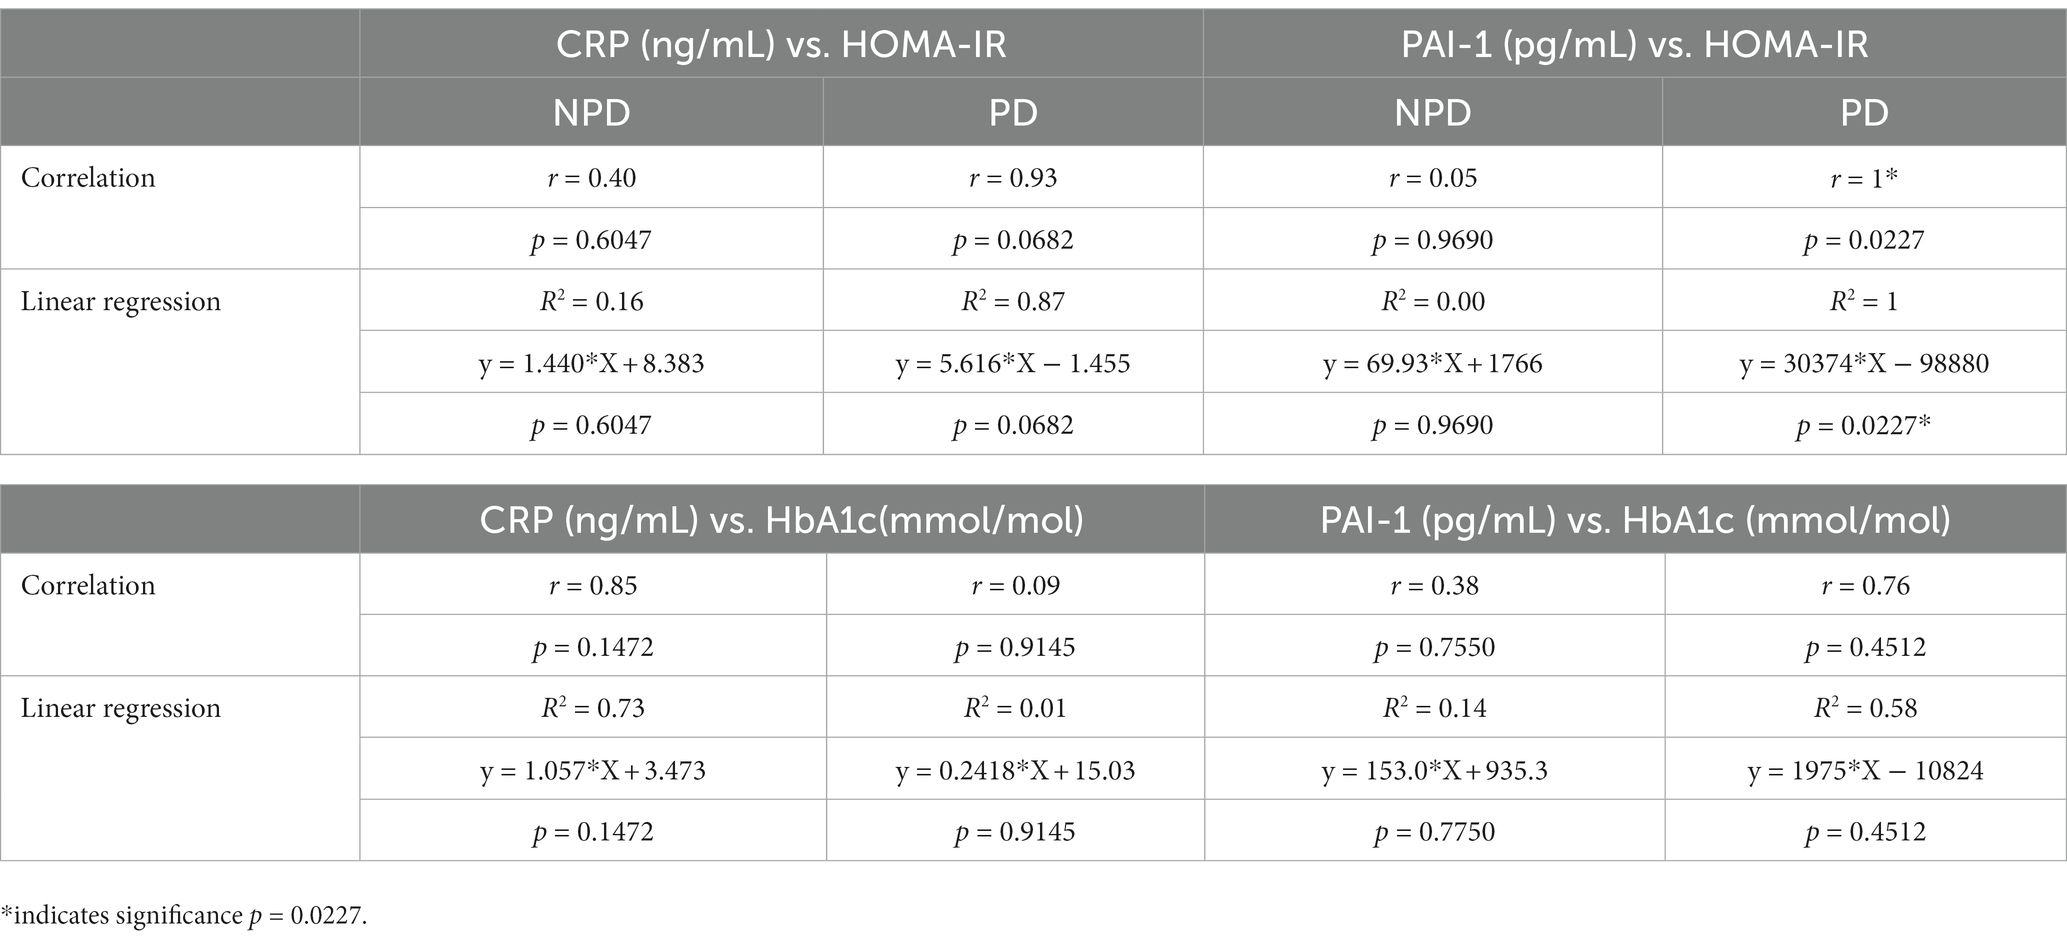
Table 3. Correlation and linear regression analysis between insulin resistance markers with C-reactive protein and plasminogen activator inhibitor -1.
Discussion
Chronic consumption of high-calorie diets is associated with a high prevalence of T2DM and its complications (34). Studies have shown that the complications of T2DM begin during prediabetes (35). Indeed, studies in our laboratory using an HFHC-diet-induced prediabetes model have demonstrated early diabetic nephropathy, HPA axis dysregulation and non-alcoholic fatty liver disease (23, 36). However, the risk factors and biomarkers associated with CVD development have not been assessed. Therefore, this study sought to determine the risk factors of CHD in diet-induced prediabetes as well as identify biomarkers that can be used for the early detection of prediabetes-associated CHD.
Insulin is crucial in stimulating glucose uptake and oxidation in the heart, skeletal muscle, liver and adipose tissue (37). Insulin resistance is the inability of target tissues to respond to insulin due to defects in insulin receptors, thus decreasing insulin-mediated glucose regulation (38). Defects are reported in the IR, IRS, PI3K, and Akt pathways in insulin signaling and GLUT4 expression (38). Obesity, which can occur due to several factors such as overconsumption of high-calorie diets, physical inactivity, genetics and age, has been identified as the leading cause of insulin resistance (39). Indeed, in the present study, animals in the PD group who consumed a high-calorie diet (HFHC diet) became obese, as indicated by a significant increase in body weight compared to the NPD animals that consumed a standard rat chow. Obesity is associated with chronic low-grade inflammation and is responsible for insulin resistance (39).
The role of obesity in insulin resistance is through the release of free fatty acids (FFA) and inflammatory mediators. The binding of FFA to toll-like receptors (TLR) downregulates PI3K (phosphatidylinositol 3 kinase) and Akt, leading to reduced expression of GLUT4 and, subsequently, the response to insulin binding (15). The HOMA-IR index is used to assess insulin resistance (32). The concentration of HbA1c is used to determine the average plasma glucose over an extended period (40). In this study, the PD group’s HOMA-IR value was higher than the NPD group and in the range of significant insulin resistance. The PD’s FBG and plasma insulin concentrations were also significantly elevated compared to the NPD group. These results suggest insulin resistance in PD. Furthermore, the concentration of HbA1c was significantly increased in the PD group compared to the NPD. These results concur with the finding of a study by Luvuno et al., in which chronic consumption of HFHC diet-induced prediabetes evidenced by insulin resistance and increased HbA1c (28).
Inflammation is the normal homeostatic response of the body during infection from pathogens (41). The normal inflammatory response is acute and involves activating immune and non-immune cells (42). Immune and vascular cells produce cytokines such as TNF-α and IL-6 during an inflammatory immune response (43). TNF-α is a proinflammatory cytokine that functions in cytokine expression, tumor necrosis, and neutrophil activation. Conversely, IL-6 functions in cell proliferation and differentiation of B-cells into plasma cells and is also pro-atherogenic (43). Hyperglycemia promotes low-grade inflammation by upregulating NF-kВ (9, 42). Inflammation is one of the mechanisms associated with CVD development in prediabetes and T2DM (44). Increased concentration of inflammatory cytokines causes injury to the vascular endothelium (45). Elevated IL-6 is associated with initiating chronic inflammation (46). Çakar and colleagues reported that CRP has a positive association with e-selectin, a marker of endothelial injury (47). These studies indicate that inflammatory cytokines cause vascular endothelium injury. The damage to the vascular endothelium initiates the process of atherosclerosis, which is the underlying cause of ischaemic heart disease (45, 48). Elevated CRP levels are associated with an increased risk of plaque rupture and vascular thrombosis (49). In this study, intermediate hyperglycaemia caused a significant increase in CRP, TNF-α and IL-6 concentration in the PD compared to the NPD group.
These results coincide with a study by Mzimela et al., in which prediabetes had significantly increased CRP, TNF-α, and IL-6 with increased lymphocytes, neutrophils and monocytes (25). In Table 3, we reported a positive correlation between HbA1c and CRP in the NPD and PD groups and a linear regression that predicts a 73% positive relationship between HbA1c and CRP in the NPD and a 10% relationship in the PD group. InThere was an insignificant positive correlation between HOMA-IR and CRP in the NPD and PD and a linear regression that predicts a 16% relationship between HOMA-IR and CRP in the NDP group and an 87% relationship in the PD group. Veerasak and Warangkana found a significant positive correlation between CRP and HbA1c in obese T2DM individuals with HbA1c concentrations of 7.36 1.23% and 8.77 ± 1.78% (50). The subjects in this study are obese and diabetic. The significant positive correlation could be due to obesity and high HbA1c concentrations. In the current study, the animals were obese, prediabetic and had lower HbA1c concentrations than T2DM. Wang et al. reported an insignificant positive correlation between CRP and HOMA-IR in individuals with prediabetes (51). These results align with the findings of the current study. The result of the present study further demonstrates that the concentration of CRP increases with increasing levels of insulin resistance during prediabetes. This also indicates that prediabetic individuals are at risk of developing CHD and the severity is dependent on the duration of prediabetes and the level of insulin resistance. Prediabetic individuals should be tested for inflammatory biomarkers and be advised on therapeutic or dietary methods to reverse prediabetes or reduce inflammation.
Lipids and lipoproteins are responsible for cholesterol metabolism (52). HDL removes cholesterol from peripheral tissues for excretion through the liver (53). HDL is viewed as anti-atherosclerotic, anti-inflammatory, and anti-thrombogenic and plays a role in vasodilation (53). LDLs and VLDLs transport fat molecules to all peripheral tissues, whereas TGs act as an energy source and transporters of dietary fats (54). Central adiposity is associated with dyslipidaemia and insulin resistance; conversely, insulin resistance increases the production of FFA and TG while decreasing HDL (55). In T2DM, insulin resistance results in abnormal FFA metabolism and elevated hepatic output of TG (56). Insulin resistance increases TG by increasing hepatic VLDLs and low levels of lipoprotein lipase (57). This study showed a significant increase in TG and VLDL in the diet-induced prediabetic animals compared to the NPD group. Interestingly, there was a significant decrease in LDL in the PD group compared to the NPD. Increased concentration of TG and VLDL is reported in previously published papers (31, 58, 59). In a study by Katzke et al. TC, apoB-100 and TG were positively associated with MI. Furthermore, high levels of TG were associated with an increased risk of stroke (52). ApoE (apolipoprotein E) and AIP1(apoptosis signal-regulating 1 interacting protein 1) knockout mice fed a Western-type diet demonstrated elevated inflammatory cytokines (TNF-α, IL-6, IL-10 and IL-12) and lipoproteins (VLDL and LDL). Photomicrographs of the aorta of the ApoE and AIP1 knockout mice showed a greater area of atherosclerosis plague development compared to ApoE knockout mice (60). This study demonstrates the role of inflammation-induced hyperlipidaemia as well as atherosclerosis.
Numerous studies have documented lipids and lipoproteins as risk factors for CVDs, with LDL stated to be a strong predictor of atherosclerosis and CVD development (61–63). However, Hsu et al. recently reported that small dense LDL cholesterol (sdLDL-C) is a stronger CVD risk predictor than LDL. The level of sdLDL-C can detect individuals at low risk based on LDL levels. Furthermore, sdLDL-C is strongly associated with inflammation, thrombosis, haematological biomarkers and prediabetes (64). VLDL was shown to have a stronger association with coronary artery calcification than TG in the Penn Diabetes Heart Study (PDHS) (65, 66). VLDLs are minuscule and, therefore, enter the vascular wall and are trapped in the intima, resulting in the development of atherosclerosis through foam cell formation and low-grade inflammation (67).
The endothelium is the internal layer of the blood vessels, cardiac valves and other body cavities (68). The endothelium plays a vital role in regulating vascular tone, inflammation, and thrombosis by releasing vasoactive substances (68). NO is a potent vasodilator synthesized by eNOS and opposes the vasoconstrictive effects of ET-1 (69). Besides being a vasodilator, NO suppresses leukocyte adhering, platelet activation and PAI-1 expression (70). ET-1 is a potent endothelium-derived vasoconstrictor with pro-fibrotic, pro-oxidative, and proinflammatory properties (71). Insulin resistance contributes to endothelial dysfunction in prediabetes and T2DM (72). Endothelium dysfunction is also attributed to chronic inflammation; conversely, endothelial dysfunction also results in inflammation (70). This study showed a significant increase in inflammatory mediators, which could have caused vascular endothelium dysfunction. Endothelium dysfunction is an early sign of atherosclerosis and a CVD risk factor (70). Hyperglycaemia results in the upregulation of ET-1 while inhibiting eNOS through the activation of PKC (15, 71). It has been reported that ETA and ETB impair insulin-mediated vasorelaxation in the aorta and are improved by administering ETA and ETB antagonists (73). Indeed, in this study, there was a significant decrease in the concentration of eNOS and a significant increase in the concentration of ET-1. Decreased eNOS concentration coincides with previously published papers’ findings (31, 74, 75). Sachidanandam and colleagues reported a significant increase in the concentration of ET-1 in Wistar and Goto-Kakizaki (GK) rats in their study evaluating the differential effects of HFD-induced dyslipidaemia and hyperglycaemia on resistance mesenteric artery structure (76). Sud and Black demonstrated that ET-1 reduces the expression of eNOS and NO secretion in endothelial cells through PKCδ-mediated STAT3 activation (77). This endothelial dysfunction is associated with atherosclerosis and reduced blood vessel diameter (78, 79). This study observed that prediabetes does not only decrease NO synthesis and secretion. However, it also increases the concentration of ET-1. Elevation of ET-1, a potent vasoconstrictor, could be considered a risk factor for CHD.
An intact vascular wall and a balance between procoagulants and anticoagulants maintain blood fluidity (80). An anticoagulant state is maintained by (1) antithrombin, (2) thrombomodulin secreted by an intact endothelium, and (3) fibrinolysis by plasmin (81–83). Fibrin stabilizes the platelet plug at the site of injury in the vessel, thus preventing blood loss (84). When the blood vessel has healed, plasmin is generated by tPA or u-PA to lyse fibrin (84). PAI-1 is the primary inhibitor of tPA and uPA (72). Elevated levels of PAI-1 are associated with coronary thrombosis and have been reported to be associated with an increased risk of MI (85). The concentration of PAI-1 is increased by insulin resistance, endothelium dysfunction and inflammation (86). Insulin resistance, endothelial dysfunction and inflammation have been reported in the is study. In the Insulin Resistance Atherosclerosis Study (IRAS), the odds ratio of nondiabetic subjects with risks of developing diabetes correlated with an increase in PAI-1 and CRP (87). A decrease in NO, such as in endothelial dysfunction, has been linked with platelet aggregation and increased PAI-1 (70, 88). In the present study, there was an increase in the concentration of PAI-1 in the PD compared to the NPD, but it was not statistically different. We noted a vast difference in the SEMs, with the PD group having a high SEM. The spread of data points in the PD could be the reason for non-significance. These findings differ from results published by Sundaram et al., in which a high-fat (HF) diet supplemented with PUFA significantly increased the concentration of PAI-1 in plasma in mice compared to a low-fat (LF) diet (89). Most studies evaluate PAI-1 in obese, PAI-1 knockout animal models or obese human subjects (90–93). The increase in adipose tissue could be why these studies reported statistically significant results, as the adipose tissue releases PAI-1 in parallel with increased fat mass (90). Though there was an increase in BMI and insulin resistance in prediabetes, we speculate that it was insufficient to increase PAI-1 concentration significantly. Table 3 shows an insignificant positive correlation between HbA1c and PAI-1 in the NPD and PD groups. Table 3 also shows a 14% and a 58% relationship between HbA1c and PAI-1 in the NPD and PD groups, respectively. There was a significant, positive correlation between HOMA-IR and PAI-1 in the PD group but insignificant in the NPD. Linear regression analysis showed a 0% relationship between HOMA-IR and PAI-1 in the NPD group and a 99.87% relationship in the PD group. Elevated concentration of PAI-1 has been reported in prediabetic individuals classified according to the ADA criteria (94). Pallela and colleagues recently reported a significant positive correlation between PAI-1 and HbA1c in T2DM individuals with HbA1c < 7% and those with HbA1c ≥ 7% (95). These results concur with those published by Nkansah and colleagues, who reported a significant positive correlation between PAI-1 and HbA1c in T2DM individuals with HbA1c < 7% and those with HbA1c ≥ 7% (96). These studies were conducted in a large population of T2DM individuals with a long history of diabetes. This could be why they found evidence of statistical difference, whereas we did not. Prediabetes was induced over a period of 20 weeks.
Overt metabolic changes were not yet present; the compensatory mechanism is not yet dysfunctional. In newly diagnosed (≤ 3 years) T2DM individuals, Kahn and colleagues reported a significant positive association between the concentration of PAI-1 and HOMA-IR and argued that changes in adipose and fibrinolysis markers are due to adipose tissue and not insulin resistance in newly diagnosed T2DM (97). In a study evaluating the difference in PAI-1 levels in metabolically healthy and unhealthy obese individuals, the concentration of PAI-1 had a significant positive correlation with HOMA-IR (98). These studies show a significant correlation between PAI-1 and HOMA-IR in T2DM and human studies. According to our knowledge, it is the first time that a positive and significant correlation between PAI-1 and HOMA-IR has been reported in diet-induced prediabetes. These results indicate that PAI-1 levels are elevated in relation to insulin resistance in prediabetes. Therefore, assessing the levels of PAI-1 during prediabetes could potentially help in the early detection of CHD risks.
A systolic blood pressure (SBP) of 130–139 mmHg and a diastolic blood pressure (DBP) of 85–89 mmHg is considered high normal, whereas that of SBP and DBP is grade 3 hypertension and an increased risk of CVD (99). Vascular inflammation has been linked with hypertension through CRP, directly decreasing the expression of eNOS (100, 101). Impaired NO-mediated vasodilation increases BP (102). Elevated ET-1 has been shown to reduce ANP-mediated vasorelaxation in the aorta through cGMP reduction, thus increasing BP (103, 104). The current study showed a significant increase in MAP and resting HR. These results align with the results published by Luvuno et al. (105) and Akilen et al. (106). Increased BP if left untreated overt to hypertension (107). Furthermore, hypertension is a significant risk factor for atherosclerosis in coronary blood vessels (107).
Conclusion
Chronic consumption of a HFHC diet induced prediabetes through obesity and insulin resistance which in turn led to inflammation and endothelial dysfunction which are risk factors of CHD. There is a positive correlation between insulin resistance and PAI-1 as shown by HOMA-IR and PAI-1 therefore suggesting that prediabetes increases the risk of developing vascular thrombosis. While there are several other markers of fibrinolysis, this study showed PAI-1 has potential for use as a biomarker in the development of prediabetes-associated CHD. The current therefore study warrants further investigation on PAI-1 and other markers of fibrinolysis for the early detection of thrombosis and risk of CHD in prediabetes.
Limitations
Biochemical analyses were done soon after prediabetes induction; therefore, the study is based on changes that occur early on in prediabetes. We believe extending the duration and increasing the number of animals per group could give a better view of the biomarkers. The analytes measured in the study were not assessed directly in the heart. Therefore, it is unknown if the change in biomarkers is also present in the heart. Only PAI-1 was used to determine fibrinolysis; we could have added more indicators of fibrinolysis.
Future recommendations
Future studies should delve into changes in cardiac physiology, histology and therapy to determine if the cardiac function and structure are compromised in prediabetes and if the currently available treatment is beneficial in preventing cardiac injury and progression to overt CHD.
Data availability statement
The raw data supporting the conclusions of this article will be made available by the authors, without undue reservation.
Ethics statement
The animal study was approved by Animal Research Ethics (AREC) Committee of the University of KwaZulu Natal, Durban, South Africa (Ethics No: AREC024/018D). The study was conducted in accordance with the local legislation and institutional requirements.
Author contributions
NG: Formal analysis, Investigation, Writing – original draft. AK: Conceptualization, Formal analysis, Funding acquisition, Methodology, Supervision, Writing – review & editing.
Funding
The author(s) declare financial support was received for the research, authorship, and/or publication of this article. This study was funded by the University of KwaZulu Natal College of Health Science (CHS) and the National Research Foundation NRF (UID142054).
Acknowledgments
The authors would like to acknowledge Kogi Moodley and Dennis Makhubela for their technical assistance, the Biomedical Research Unit of the University of KwaZulu Natal for providing animals and assistance and the National Research Fund Scholarship, South Africa, for financial support.
Conflict of interest
The authors declare that the research was conducted in the absence of any commercial or financial relationships that could be construed as a potential conflict of interest.
Publisher’s note
All claims expressed in this article are solely those of the authors and do not necessarily represent those of their affiliated organizations, or those of the publisher, the editors and the reviewers. Any product that may be evaluated in this article, or claim that may be made by its manufacturer, is not guaranteed or endorsed by the publisher.
References
1. Schlesinger, S, Neuenschwander, M, Barbaresko, J, Lang, A, Maalmi, H, Rathmann, W, et al. Prediabetes and risk of mortality, diabetes-related complications and comorbidities: umbrella review of meta-analyses of prospective studies. Diabetologia. (2022) 65:275–85. doi: 10.1007/s00125-021-05592-3
2. Echouffo-Tcheugui, JB, and Selvin, E. Prediabetes and what it means: the epidemiological evidence. Annu Rev Public Health. (2021) 42:59–77. doi: 10.1146/annurev-publhealth-090419-102644
3. Hostalek, U. Global epidemiology of prediabetes – present and future perspectives. Clin Diabetes Endocrinol. (2019) 5:5. doi: 10.1186/s40842-019-0080-0
4. Rooney, MR, Fang, M, Ogurtsova, K, Ozkan, B, Echouffo-Tcheugui, JB, Boyko, EJ, et al. Global prevalence of prediabetes. Diabetes Care. (2023) 46:1388–94. doi: 10.2337/dc22-2376
5. Pedicelli, S, Fintini, D, Ravà, L, Inzaghi, E, Deodati, A, Spreghini, MR, et al. Prevalence of prediabetes in children and adolescents by class of obesity. Pediatr Obes. (2022) 17:e12900. doi: 10.1111/ijpo.12900
6. Madlala, SS, Hill, J, Kunneke, E, Kengne, AP, Peer, N, and Faber, M. Dietary diversity and its association with nutritional status, cardiometabolic risk factors and food choices of adults at risk for type 2 diabetes mellitus in Cape Town, South Africa. Nutrients. (2022) 14:3191. doi: 10.3390/nu14153191
7. Sharma, MD, and Garber, AJ. What is the best treatment for prediabetes? Curr Diab Rep. (2009) 9:335–41. doi: 10.1007/s11892-009-0053-2
8. Huang, Y, Cai, X, Mai, W, Li, M, and Hu, Y. Association between prediabetes and risk of cardiovascular disease and all cause mortality: systematic review and meta-analysis. BMJ. (2016) 355:i5953. doi: 10.1136/bmj.i5953
9. Chait, A, and Bornfeldt, KE. Diabetes and atherosclerosis: is there a role for hyperglycemia? J Lipid Res. (2009) 50:S335–9. doi: 10.1194/jlr.R800059-JLR200
10. Cheung, BM, and Li, C. Diabetes and hypertension: is there a common metabolic pathway? Curr Atheroscler Rep. (2012) 14:160–6. doi: 10.1007/s11883-012-0227-2
11. Fowler, MJ. Microvascular and macrovascular complications of diabetes. Clin Diabetes. (2011) 29:116–22. doi: 10.2337/diaclin.29.3.116
12. Forbes, JM, and Cooper, ME. Mechanisms of diabetic complications. Physiol Rev. (2013) 93:137–88. doi: 10.1152/physrev.00045.2011
13. Park, YM, Febbraio, M, and Silverstein, RL. CD36 modulates migration of mouse and human macrophages in response to oxidized LDL and may contribute to macrophage trapping in the arterial intima. J Clin Invest. (2009) 119:136–45. doi: 10.1172/JCI35535
14. Curtiss, LK. Reversing atherosclerosis? N Engl J Med. (2009) 360:1144–6. doi: 10.1056/NEJMcibr0810383
15. Huang, D, Refaat, M, Mohammedi, K, Jayyousi, A, Al Suwaidi, J, and Abi, KC. Macrovascular complications in patients with diabetes and prediabetes. Biomed Res Int. (2017) 2017:1–9. doi: 10.1155/2017/7839101
16. Li, W, Abdul, Y, Ward, R, and Ergul, A. Endothelin and diabetic complications: a brain-centric view. Physiol Res. (2018) 67:S83–94. doi: 10.33549/physiolres.933833
17. Banting Lecture, BM. The pathobiology of diabetic complications. A unifying mechanism. Diabetes. (2004) 54:1615–25. doi: 10.2337/diabetes.54.6.1615
18. Undas, A, Wiek, I, Stêpień, E, Zmudka, K, and Tracz, W. Hyperglycemia is associated with enhanced thrombin formation, platelet activation, and fibrin clot resistance to lysis in patients with acute coronary syndrome. Diabetes Care. (2008) 31:1590–5. doi: 10.2337/dc08-0282
19. Dunn, E, Philippou, H, Ariëns, R, and Grant, P. Molecular mechanisms involved in the resistance of fibrin to clot lysis by plasmin in subjects with type 2 diabetes mellitus. Diabetologia. (2006) 49:1071–80. doi: 10.1007/s00125-006-0197-4
20. Pandolfi, A, Cetrullo, D, Polishuck, R, Alberta, M, Calafiore, A, Pellegrini, G, et al. Plasminogen activator inhibitor type 1 is increased in the arterial wall of type II diabetic subjects. Arterioscler Thromb Vasc Biol. (2001) 21:1378–82. doi: 10.1161/hq0801.093667
21. Soares, AL, Sousa, MO, Fernandes, A, and Carvalho, MG. Hemostatic changes in patients with type 2 diabetes mellitus. Rev Bras Hematol Hemoter. (2010) 32:482–8. doi: 10.1590/S1516-84842010000600013
22. Tofler, GH, Massaro, J, O'Donnell, CJ, Wilson, PWF, Vasan, RS, Sutherland, PA, et al. Plasminogen activator inhibitor and the risk of cardiovascular disease: the Framingham heart study. Thromb Res. (2016) 140:30–5. doi: 10.1016/j.thromres.2016.02.002
23. Gamede, M, Mabuza, L, Ngubane, P, and Khathi, A. Preventing the onset of diabetes-induced chronic kidney disease during prediabetes: the effects of oleanolic acid on selected markers of chronic kidney disease in a diet-induced prediabetic rat model. Biomed Pharmacother. (2021) 139:111570. doi: 10.1016/j.biopha.2021.111570
24. Mkhize, BC, Mosili, P, Ngubane, PS, Sibiya, NH, and Khathi, A. Dietinduced prediabetes: Effects on the activity of the renin-angiotensin-aldosterone system in selected organs. Journal of Diabetes Investigation. (2022) 13:768–780. doi: 10.1111/jdi.13690
25. Mzimela, NC, Ngubane, PS, and Khathi, A. The changes in immune cell concentration during the progression of pre-diabetes to type 2 diabetes in a high-fat high-carbohydrate diet-induced pre-diabetic rat model. Autoimmunity. (2019) 52:27–36. doi: 10.1080/08916934.2019.1575820
26. Luvuno, M, Mbongwa, H, and Khathi, A. Development of a novel prediabetes animal model using a high fat high carbohydrate diet: implications for type 2 diabetes. PLoS One. (2017) 13:8–14.
27. Aronson, JK, and Ferner, RE. Biomarkers—a general review. Curr Protoc Pharmacol. (2017) 76:9.23.1–9.23.17. doi: 10.1002/cpph.19
28. Luvuno, M, Mabandla, M, and Khathi, A. Voluntary ingestion of a high-fat high-carbohydrate diet: a model for prediabetes. Ponte Int Sci Res J. (2018) 74:74. doi: 10.21506/j.ponte.2018.5.11
29. Khathi, A, Serumula, MR, Myburg, RB, Van Heerden, FR, and Musabayane, CT. Effects of Syzygium aromaticum-derived triterpenes on postprandial blood glucose in streptozotocin-induced diabetic rats following carbohydrate challenge. PLoS One. (2013) 8:e81632. doi: 10.1371/journal.pone.0081632
30. Gamede, M, Mabuza, L, Ngubane, P, and Khathi, A. The effects of plant-derived oleanolic acid on selected parameters of glucose homeostasis in a diet-induced pre-diabetic rat model. Molecules. (2018) 23:794. doi: 10.3390/molecules23040794
31. Akinnuga, AM, Siboto, A, Khumalo, B, Sibiya, NH, Ngubane, P, and Khathi, A. Bredemolic acid improves cardiovascular function and attenuates endothelial dysfunction in diet-induced prediabetes: effects on selected markers. Cardiovasc Ther. (2020) 2020:1–9. doi: 10.1155/2020/1936406
32. Wallace, TM, Levy, JC, and Matthews, DR. Use and abuse of HOMA modeling. Diabetes Care. (2004) 27:1487–95. doi: 10.2337/diacare.27.6.1487
33. Friedewald, WT, Levy, RI, and Fredrickson, DS. Estimation of the concentration of low-density lipoprotein cholesterol in plasma, without use of the preparative ultracentrifuge. Clin Chem. (1972) 18:499–502. doi: 10.1093/clinchem/18.6.499
34. Tabák, AG, Herder, C, Rathmann, W, Brunner, EJ, and Kivimäki, M. Prediabetes: a high-risk state for diabetes development. Lancet. (2012) 379:2279–90. doi: 10.1016/S0140-6736(12)60283-9
35. Vistisen, D, Witte, DR, Brunner, EJ, Kivimäki, M, Tabák, A, Jørgensen, ME, et al. Risk of cardiovascular disease and death in individuals with prediabetes defined by different criteria: the Whitehall II study. Diabetes Care. (2018) 41:899–906. doi: 10.2337/dc17-2530
36. Mosili, P, Mkhize, BC, Ngubane, P, Sibiya, N, and Khathi, A. The dysregulation of the hypothalamic-pituitary-adrenal axis in diet-induced prediabetic male Sprague Dawley rats. Nutr Metab (Lond). (2020) 17:104. doi: 10.1186/s12986-020-00532-1
37. Abel, ED, O'Shea, KM, and Ramasamy, R. Insulin resistance: metabolic mechanisms and consequences in the heart. Arterioscler Thromb Vasc Biol. (2012) 32:2068–76. doi: 10.1161/ATVBAHA.111.241984
38. Petersen, MC, and Shulman, GI. Mechanisms of insulin action and insulin resistance. Physiol Rev. (2018) 98:2133–223. doi: 10.1152/physrev.00063.2017
39. Chen, L, Chen, R, Wang, H, and Liang, F. Mechanisms linking inflammation to insulin resistance. Int J Endocrinol. (2015) 2015:508409:1–9. doi: 10.1155/2015/508409
40. World Health Organization. Use of glycated haemoglobin (HbA1c) in diagnosis of diabetes mellitus: abbreviated report of a WHO consultation. Geneva: World Health Organization (2011).
41. Bersoux, S, Cook, CB, Wu, Q, Burritt, MF, Hernandez, JS, Verona, PM, et al. Hemoglobin A1c testing alone does not sufficiently identify patients with prediabetes. Am J Clin Pathol. (2011) 135:674–7. doi: 10.1309/AJCPJBG0WYRAHN0R
42. Furman, D, Campisi, J, Verdin, E, Carrera-Bastos, P, Targ, S, Franceschi, C, et al. Chronic inflammation in the etiology of disease across the life span. Nat Med. (2019) 25:1822–32. doi: 10.1038/s41591-019-0675-0
43. Sprague, AH, and Khalil, RA. Inflammatory cytokines in vascular dysfunction and vascular disease. Biochem Pharmacol. (2009) 78:539–52. doi: 10.1016/j.bcp.2009.04.029
44. Luc, K, Schramm-Luc, A, Guzik, T, and Mikolajczyk, T. Oxidative stress and inflammatory markers in prediabetes and diabetes. J Physiol Pharmacol. (2019) 70:809–24. doi: 10.26402/jpp.2019.6.01
45. Evans, JL, and Goldfine, ID. A new road for treating the vascular complications of diabetes: so let's step on the gas. Diabetes. (2016) 65:346–8. doi: 10.2337/dbi15-0029
46. Wegner, M, Araszkiewicz, A, Piorunska-Stolzmann, M, Wierusz-Wysocka, B, and Zozulinska-Ziolkiewicz, D. Association between IL-6 concentration and diabetes-related variables in DM1 patients with and without microvascular complications. Inflammation. (2013) 36:723–8. doi: 10.1007/s10753-013-9598-y
47. Çakar, M, Balta, Ş, Şarlak, H, Akhan, M, Demirkol, S, Karaman, M, et al. Arterial stiffness and endothelial inflammation in prediabetes and newly diagnosed diabetes patients. Arch Endocrinol Metab. (2015) 59:407–13. doi: 10.1590/2359-3997000000061
48. Airaksinen, K. Silent coronary artery disease in diabetes–a feature of autonomic neuropathy or accelerated atherosclerosis? Diabetologia. (2001) 44:259–66. doi: 10.1007/s001250051609
49. Ridker, PM. A test in context: high-sensitivity C-reactive protein. J Am Coll Cardiol. (2016) 67:712–23. doi: 10.1016/j.jacc.2015.11.037
50. Sarinnapakorn, V, and Wanicagool, W. Association between hs-CRP and Hba1c in overweight type 2 diabetic female patients. J Med Assoc Thai. (2013) 96:S54–8.
51. Wang, Z, Shen, X-H, Feng, W-M, Ye, G-f, Qiu, W, and Li, B. Analysis of inflammatory mediators in prediabetes and newly diagnosed type 2 diabetes patients. J Diabetes Res. (2016) 2016:1–10. doi: 10.1155/2016/7965317
52. Katzke, VA, Sookthai, D, Johnson, T, Kühn, T, and Kaaks, R. Blood lipids and lipoproteins in relation to incidence and mortality risks for CVD and cancer in the prospective EPIC–Heidelberg cohort. BMC Med. (2017) 15:218. doi: 10.1186/s12916-017-0976-4
53. Drew, BG, Rye, K-A, Duffy, SJ, Barter, P, and Kingwell, BA. The emerging role of HDL in glucose metabolism. Nat Rev Endocrinol. (2012) 8:237–45. doi: 10.1038/nrendo.2011.235
54. Diabetes Canada Clinical Practice Guidelines Expert CommitteePunthakee, Z, Goldenberg, R, and Katz, P. Definition, classification and diagnosis of diabetes, prediabetes and metabolic syndrome. Can J Diabetes. (2018) 42:S10–5. doi: 10.1016/j.jcjd.2017.10.003,
55. Li, N, Fu, J, Koonen, DP, Kuivenhoven, JA, Snieder, H, and Hofker, MH. Are hypertriglyceridemia and low HDL causal factors in the development of insulin resistance? Atherosclerosis. (2014) 233:130–8. doi: 10.1016/j.atherosclerosis.2013.12.013
56. Lee, YA, Cho, EJ, and Yokozawa, T. Effects of proanthocyanidin preparations on hyperlipidemia and other biomarkers in mouse model of type 2 diabetes. J Agric Food Chem. (2008) 56:7781–9. doi: 10.1021/jf800639m
57. Bhowmik, B, Siddiquee, T, Mujumder, A, Afsana, F, Ahmed, T, Mdala, IA, et al. Serum lipid profile and its association with diabetes and prediabetes in a rural Bangladeshi population. Int J Environ Res Public Health. (2018) 15:1944. doi: 10.3390/ijerph15091944
58. Mabuza, LP, Gamede, MW, Maikoo, S, Booysen, IN, Ngubane, PS, and Khathi, A. Cardioprotective effects of a ruthenium (II) Schiff base complex in diet-induced prediabetic rats. Diabetes Metab Syndr Obes. (2019) 12:217–23. doi: 10.2147/DMSO.S183811
59. Marin, V, Gazzin, S, Gambaro, SE, Dal Ben, M, Calligaris, S, Anese, M, et al. Effects of oral administration of silymarin in a juvenile murine model of non-alcoholic steatohepatitis. Nutrients. (2017) 9:1006. doi: 10.3390/nu9091006
60. Huang, Q, Qin, L, Dai, S, Zhang, H, Pasula, S, Zhou, H, et al. AIP1 suppresses atherosclerosis by limiting hyperlipidemia-induced inflammation and vascular endothelial dysfunction. Arterioscler Thromb Vasc Biol. (2013) 33:795–804. doi: 10.1161/ATVBAHA.113.301220
61. Hadjiphilippou, S, and Ray, KK. Lipids and lipoproteins in risk prediction. Cardiol Clin. (2018) 36:213–20. doi: 10.1016/j.ccl.2017.12.002
62. Rana, JS, Liu, JY, Moffet, HH, Solomon, MD, Go, AS, Jaffe, MG, et al. Metabolic dyslipidemia and risk of coronary heart disease in 28,318 adults with diabetes mellitus and low-density lipoprotein cholesterol< 100 mg/dl. Am J Cardiol. (2015) 116:1700–4. doi: 10.1016/j.amjcard.2015.08.039
63. Kilgore, M, Muntner, P, Woolley, JM, Sharma, P, Bittner, V, and Rosenson, RS. Discordance between high non-HDL cholesterol and high LDL-cholesterol among US adults. J Clin Lipidol. (2014) 8:86–93. doi: 10.1016/j.jacl.2013.11.001
64. Hsu, SH-J, Jang, M-H, Torng, P-L, and Su, T-C. Positive association between small dense low-density lipoprotein cholesterol concentration and biomarkers of inflammation, thrombosis, and prediabetes in non-diabetic adults. J Atheroscler Thromb. (2018) 275:e253. doi: 10.1016/j.atherosclerosis.2018.06.806
65. Prenner, SB, Mulvey, CK, Ferguson, JF, Rickels, MR, Bhatt, AB, and Reilly, MP. Very low density lipoprotein cholesterol associates with coronary artery calcification in type 2 diabetes beyond circulating levels of triglycerides. Atherosclerosis. (2014) 236:244–50. doi: 10.1016/j.atherosclerosis.2014.07.008
66. Eckel, RH. What is it about very low density lipoproteins (VLDL) and cardiovascular disease in patients with type 2 diabetes mellitus: is it the triglycerides or the cholesterol? Atherosclerosis. (2014) 237:138–9. doi: 10.1016/j.atherosclerosis.2014.08.048
67. Varbo, A, Benn, M, Tybjærg-Hansen, A, and Nordestgaard, BG. Elevated remnant cholesterol causes both low-grade inflammation and ischemic heart disease, whereas elevated low-density lipoprotein cholesterol causes ischemic heart disease without inflammation. Circulation. (2013) 128:1298–309. doi: 10.1161/CIRCULATIONAHA.113.003008
68. Verma, S, and Anderson, TJ. Fundamentals of endothelial function for the clinical cardiologist. Circulation. (2002) 105:546–9. doi: 10.1161/hc0502.104540
69. Oak, M-H, Auger, C, Belcastro, E, Park, S-H, Lee, H-H, and Schini-Kerth, VB. Potential mechanisms underlying cardiovascular protection by polyphenols: role of the endothelium. Free Radic Biol Med. (2018) 122:161–70. doi: 10.1016/j.freeradbiomed.2018.03.018
70. Giannotti, G, and Landmesser, U. Endothelial dysfunction as an early sign of atherosclerosis. Herz. (2007) 32:568–72. doi: 10.1007/s00059-007-3073-1
71. Kim, J, Lee, H, and Shin, S. Advances in the measurement of red blood cell deformability: a brief review. J Cell Biotechnol. (2015) 1:63–79. doi: 10.3233/JCB-15007
72. Wasserman, DH, Wang, TJ, and Brown, NJ. The vasculature in prediabetes. Circ Res. (2018) 122:1135–50. doi: 10.1161/CIRCRESAHA.118.311912
73. Elgebaly, MMEM, Kelly, A, Harris, AKHK, Elewa, H, Portik-Dobos, V-D, Ketsawatsomkron, P, et al. Impaired insulin-mediated vasorelaxation in a nonobese model of type 2 diabetes: role of endothelin-1This article is one of a selection of papers published in the special issue (part 1 of 2) on forefronts in endothelin. Can J Physiol Pharmacol. (2008) 86:358–64. doi: 10.1139/Y08-034
74. Picchi, A, Gao, X, Belmadani, S, Potter, BJ, Focardi, M, Chilian, WM, et al. Tumor necrosis factor-α induces endothelial dysfunction in the prediabetic metabolic syndrome. Circ Res. (2006) 99:69–77. doi: 10.1161/01.RES.0000229685.37402.80
75. Mzimela, NC, Ngubane, PS, and Khathi, A. The Haemolytic changes during progression of pre-diabetes to type 2 diabetes in a high-fat high-carbohydrate diet-induced pre-diabetic rat model. Pak J Nutr. (2021) 20:55–63. doi: 10.3923/pjn.2021.55.63
76. Sachidanandam, K, Hutchinson, JR, Elgebaly, MM, Mezzetti, EM, Wang, M-H, and Ergul, A. Differential effects of diet-induced dyslipidemia and hyperglycemia on mesenteric resistance artery structure and function in type 2 diabetes. J Pharmacol Exp Ther. (2009) 328:123–30. doi: 10.1124/jpet.108.142612
77. Sud, N, and Black, SM. Endothelin-1 impairs nitric oxide signaling in endothelial cells through a protein kinase Cδ-dependent activation of STAT3 and decreased endothelial nitric oxide synthase expression. DNA Cell Biol. (2009) 28:543–53. doi: 10.1089/dna.2009.0865
78. Eringa, EC, Serne, EH, Meijer, RI, Schalkwijk, CG, Houben, AJ, Stehouwer, CD, et al. Endothelial dysfunction in (pre) diabetes: characteristics, causative mechanisms and pathogenic role in type 2 diabetes. Rev Endocr Metab Disord. (2013) 14:39–48. doi: 10.1007/s11154-013-9239-7
79. Chester, AH, and Yacoub, MH. The role of endothelin-1 in pulmonary arterial hypertension. Glob Cardiol Sci Pract. (2014) 2014:62–78. doi: 10.5339/gcsp.2014.29
80. Campbell, JE, Brummel-Ziedins, KE, Butenas, S, and Mann, KG. Cellular regulation of blood coagulation: a model for venous stasis. Blood. (2010) 116:6082–91. doi: 10.1182/blood-2010-01-266395
81. Minors, DS. Haemostasis, blood platelets and coagulation. Anaesth Intensive Care Med. (2007) 8:214–6. doi: 10.1016/j.mpaic.2007.02.008
82. Dahlbäck, B. Blood coagulation and its regulation by anticoagulant pathways: genetic pathogenesis of bleeding and thrombotic diseases. J Intern Med. (2005) 257:209–23. doi: 10.1111/j.1365-2796.2004.01444.x
83. Yun, S-H, Sim, E-H, Goh, R-Y, Park, J-I, and Han, J-Y. Platelet activation: the mechanisms and potential biomarkers. Biomed Res Int. (2016) 2016:1–5. doi: 10.1155/2016/9060143
84. Chapin, JC, and Hajjar, KA. Fibrinolysis and the control of blood coagulation. Blood Rev. (2015) 29:17–24. doi: 10.1016/j.blre.2014.09.003
85. Thögersen, AM, Jansson, J-H, Boman, K, Nilsson, TK, Weinehall, L, Huhtasaari, F, et al. High plasminogen activator inhibitor and tissue plasminogen activator levels in plasma precede a first acute myocardial infarction in both men and women: evidence for the fibrinolytic system as an independent primary risk factor. Circulation. (1998) 98:2241–7. doi: 10.1161/01.CIR.98.21.2241
86. Binder, BR, Christ, G, Gruber, F, Grubic, N, Hufnagl, P, Krebs, M, et al. Plasminogen activator inhibitor 1: physiological and pathophysiological roles. Physiology. (2002) 17:56–61. doi: 10.1152/nips.01369.2001
87. Festa, A, D’Agostino, R, Tracy, RP, and Haffner, SM. Elevated levels of acute-phase proteins and plasminogen activator inhibitor-1 predict the development of type 2 diabetes: the insulin resistance atherosclerosis study. Diabetes. (2002) 51:1131–7. doi: 10.2337/diabetes.51.4.1131
88. Loscalzo, J. Nitric oxide insufficiency, platelet activation, and arterial thrombosis. Circ Res. (2001) 88:756–62. doi: 10.1161/hh0801.089861
89. Sundaram, S, Bukowski, MR, Lie, W-R, Picklo, MJ, and Yan, L. High-fat diets containing different amounts of n3 and n6 polyunsaturated fatty acids modulate inflammatory cytokine production in mice. Lipids. (2016) 51:571–82. doi: 10.1007/s11745-015-4093-x
90. Kaji, H. Adipose tissue-derived plasminogen activator inhibitor-1 function and regulation. Compr Physiol. (2011) 6:1873–96. doi: 10.1002/cphy.c160004
91. Shah, C, Yang, G, Lee, I, Bielawski, J, Hannun, YA, and Samad, F. Protection from high fat diet-induced increase in ceramide in mice lacking plasminogen activator inhibitor 1. J Biol Chem. (2008) 283:13538–48. doi: 10.1074/jbc.M709950200
92. Mendivil, CO, Robles-Osorio, L, Horton, ES, Hamdy, O, and Caballero, AE. Young Hispanics at risk of type 2 diabetes display endothelial activation, subclinical inflammation and alterations of coagulation and fibrinolysis. Diabetol Metab Syndr. (2013) 5:1–8. doi: 10.1186/1758-5996-5-37
93. Ma, L-J, Mao, S-L, Taylor, KL, Kanjanabuch, T, Guan, Y, Zhang, Y, et al. Prevention of obesity and insulin resistance in mice lacking plasminogen activator inhibitor 1. Diabetes. (2004) 53:336–46. doi: 10.2337/diabetes.53.2.336
94. Xu, L, Jiang, CQ, Lam, TH, Bao, B, Cheng, KK, and Thomas, GN. Plasminogen activator inhibitor-1 and HbA1c defined prediabetes: the Guangzhou biobank cohort study-CVD. Clin Endocrinol. (2011) 74:528–31. doi: 10.1111/j.1365-2265.2010.03948.x
95. Palella, E, Cimino, R, Pullano, SA, Fiorillo, AS, Gulletta, E, Brunetti, A, et al. Laboratory parameters of hemostasis, adhesion molecules, and inflammation in type 2 diabetes mellitus: correlation with glycemic control. Int J Environ Res Public Health. (2020) 17:300. doi: 10.3390/ijerph17010300
96. Nkansah, C, Addai-Mensah, O, Mensah, K, Owusu, M, Ephraim, RK, Adu, P, et al. Plasminogen activator Inhibitor-1 in poorly controlled vs well controlled Type-2 diabetes mellitus patients: a case-control study in a district hospital in Ghana. PLoS One. (2021) 16:e0250090. doi: 10.1371/journal.pone.0250090
97. Kahn, SE, Zinman, B, Haffner, SM, O’Neill, MC, Kravitz, BG, Yu, D, et al. Obesity is a major determinant of the association of C-reactive protein levels and the metabolic syndrome in type 2 diabetes. Diabetes. (2006) 55:2357–64. doi: 10.2337/db06-0116
98. Basurto, L, Sánchez, L, Díaz, A, Valle, M, Robledo, A, and Martínez-Murillo, C. Differences between metabolically healthy and unhealthy obesity in PAI-1 level: fibrinolysis, body size phenotypes and metabolism. Thromb Res. (2019) 180:110–4. doi: 10.1016/j.thromres.2019.06.013
99. Kjeldsen, SE. Hypertension and cardiovascular risk: general aspects. Pharmacol Res. (2018) 129:95–9. doi: 10.1016/j.phrs.2017.11.003
100. Venugopal, SK, Devaraj, S, Yuhanna, I, Shaul, P, and Jialal, I. Demonstration that C-reactive protein decreases eNOS expression and bioactivity in human aortic endothelial cells. Circulation. (2002) 106:1439–41. doi: 10.1161/01.CIR.0000033116.22237.F9
101. Touyz, RM. Molecular and cellular mechanisms in vascular injury in hypertension: role of angiotensin II–editorial review. Curr Opin Nephrol Hypertens. (2005) 14:125–31. doi: 10.1097/00041552-200503000-00007
102. Grassi, D, Necozione, S, Lippi, C, Croce, G, Valeri, L, Pasqualetti, P, et al. Cocoa reduces blood pressure and insulin resistance and improves endothelium-dependent vasodilation in hypertensives. Hypertension. (2005) 46:398–405. doi: 10.1161/01.HYP.0000174990.46027.70
103. Jaiswal, RK. Endothelin inhibits the atrial natriuretic factor stimulated cGMP production by activating the protein kinase C in rat aortic smooth muscle cells. Biochem Biophys Res Commun. (1992) 182:395–402. doi: 10.1016/S0006-291X(05)80158-5
104. Kohan, DE, Rossi, NF, Inscho, EW, and Pollock, DM. Regulation of blood pressure and salt homeostasis by endothelin. Physiol Rev. (2011) 91:1–77. doi: 10.1152/physrev.00060.2009
105. Luvuno, M, Khathi, A, and Mabandla, MV. Diet-induced prediabetes: effects of exercise treatment on risk factors for cardiovascular complications. Nutr Metab. (2021) 18:1–9. doi: 10.1186/s12986-021-00573-0
106. Akilen, R, Pimlott, Z, Tsiami, A, and Robinson, N. Effect of short-term administration of cinnamon on blood pressure in patients with prediabetes and type 2 diabetes. Nutrition. (2013) 29:1192–6. doi: 10.1016/j.nut.2013.03.007
Keywords: prediabetes, high-fat-high-carbohydrate diet, cardiovascular diseases, C-reactive protein, biomarker, endothelin-1, plasminogen activator inhibitor-1
Citation: Gumede N and Khathi A (2023) The role of fibrinolysis in the development of prediabetes-associated coronary heart disease: a focus on the plasminogen activator inhibitor -1 and its potential use as a predictive marker in diet-induced prediabetes. Front. Nutr. 10:1256427. doi: 10.3389/fnut.2023.1256427
Edited by:
Domenico Sergi, University of Ferrara, ItalyReviewed by:
Raminderjit Kaur, Case Western Reserve University, United StatesDrishtant Singh, Case Western Reserve University, United States
Copyright © 2023 Gumede and Khathi. This is an open-access article distributed under the terms of the Creative Commons Attribution License (CC BY). The use, distribution or reproduction in other forums is permitted, provided the original author(s) and the copyright owner(s) are credited and that the original publication in this journal is cited, in accordance with accepted academic practice. No use, distribution or reproduction is permitted which does not comply with these terms.
*Correspondence: Nompumelelo Gumede, MjE2MDM1MTgzQHN0dS51a3puLmFjLnph; bXB1bWVhLmd1bWVkZUBnbWFpbC5jb20=