 Mahya Mehri Hajmir1
 Farideh Shiraseb2
 Dorsa Hosseininasab3Yasaman Aali2Shabnam Hosseini4
 Khadijeh Mirzaei2,5*
- 1Students’ Scientific Center, Tehran University of Medical Sciences, Tehran, Iran
- 2Department of Community Nutrition, School of Nutritional Sciences and Dietetics, Tehran University of Medical Sciences, Tehran, Iran
- 3Department of Nutrition, Science and Research Branch, Islamic Azad University, Tehran, Iran
- 4School of Human Nutrition, McGill University, Quebec, QC, Canada
- 5Food Microbiology Research Center, Tehran University of Medical Sciences, Tehran, Iran
Background: Diet and inflammation both play important roles in the occurrence of obesity. We aimed to investigate the role of inflammation in the development of both metabolically healthy obese (MHO) and metabolically unhealthy obese (MUHO) individuals.
Methods: This cross-sectional study included 221 overweight and obese women aged 18–56 years. The study assessed the metabolic health phenotypes of the participants using the Karelis criterion score. Additionally, dietary intakes were evaluated using a 147-item semi-quantitative questionnaire and the NOVA classification system (comprising 37 food groups and beverages). The study also collected and analyzed the blood parameters, as well as biochemical and anthropometric indices, for all participants.
Results: Among the women included in the study, 22.9% had MHO phenotypes but 77.1% had MUHO phenotypes. A significant association between the third quartile of the NOVA classification system and the increased likelihood of having the MUHO phenotype was observed (OR = 1.40, 95% CI = 1.09–4.92, p = 0.04). Regarding the potential role of inflammatory markers, high-sensitivity C-reactive protein (hs-CRP) (p = 0.84), transforming growth factor-β (TGF-β) (p = 0.50), monocyte chemoattractant protein-1 (MCP-1) (p = 0.49), plasminogen activator inhibitor-1 (PAI-1) (p = 0.97), and homeostatic model assessment for insulin resistance (HOMA-IR) (p = 0.92) were found to be mediators.
Conclusion: We observed a significant positive association between ultra-processed food (UPF) consumption and the MUHO phenotype in overweight and obese women. This association appeared to be mediated by some inflammatory markers, such as hs-CRP, TGF-β, MCP-1, PAI-1, and HOMA-IR. Additional studies are needed to validate these findings.
1 Introduction
Obesity is associated with mild inflammation, and it is a state or condition that actively participates in regulating both physiological and pathological inflammatory processes by releasing pro-inflammatory cytokines, such as C-reactive protein (CRP) (1, 2). This inflammatory response can significantly increase the risk of morbidity and mortality (1, 3–5). The etiology of obesity is influenced by factors such as genetics, gender, lifestyle, and dietary intake (6–9). It was projected that, by 2030, the number of overweight adults will reach 2.16 billion and the number of obese adults will be approximately 1.12 billion (10). A study conducted on a population of 5,607 individuals reported an overall obesity prevalence of 57.2%, which was higher among women compared to men (11). However, not all obese individuals experience metabolic dysfunction, particularly cardiometabolic issues (12). Recent definitions classify obese individuals into metabolically healthy obese (MHO) and metabolically unhealthy obese (MUHO) groups based on their metabolic status. The MHO group (with a prevalence of 10–34%) is more prevalent in women and comprises individuals with specific metabolic profiles, such as higher insulin sensitivity, a lower incidence of hypertension, and optimal inflammation levels (13–16). Various indicators and definitions have been used to determine the metabolic health status, and in this study, the Karelis criterion was employed to categorize individuals into either the MHO or MUHO group (14, 15, 17, 18).
Dietary intake plays a crucial role in the development of overweight and obesity, and numerous studies have highlighted the significant impact of dietary patterns on obesity phenotypes (8, 19–21). Over the past few decades, there has been a notable increase in the consumption of processed foods due to the increasing availability of industrially processed products (22). Consequently, studies have reported associations between the consumption of processed foods, such as sugar (23), sugar-sweetened beverages (SSB) (24), fast food (25), and obesity, as well as unhealthy metabolic phenotypes (26–28). The energy-dense high-saturated fatty acid (SFA) diet enhances insulin resistance (IR), obesity, and metabolic syndrome (29, 30). Literature shows that ultra-processed food (UPF) intake affects inflammatory markers, such as high-sensitivity C-reactive protein (hs-CRP), tumor necrosis factor-α (TNF-α), and interleukin-6 (IL-6) (31, 32). Several studies have been conducted on the relationship between inflammatory markers and obesity and how they activate the innate immune system in the adipose tissue, especially the visceral fat (33–35). However, regarding the relationship between UPF consumption and inflammatory markers, such as CRP, there are conflicting findings. In a cross-sectional study examining this relationship in both sexes, only a significant relationship was observed in women but not in men (36).
The NOVA classification system is a novel approach to assess the dietary patterns while grouping foods into four categories: unprocessed or minimally processed foods, processed culinary ingredients, processed foods, and UPFs (37). There was a significant association between UPF intake and an increased risk of chronic disorders such as diabetes and cardiovascular disease (CVD) (38–41). A prospective study in the Brazilian population showed more weight and waist circumference (WC) gains in the highest quartile of UPF consumption (42). Limited studies have reported an association between NOVA and increased inflammatory markers (31), which may be due to the consumption of SFAs, potatoes, hydrogenated fats, snacks, sugar, soft drinks, sweets, and desserts (43–46). However, there is currently a lack of studies exploring the relationship between UPF intake and inflammatory markers using the NOVA classification system among women. We aimed to investigate the mediating role of inflammatory markers in the relationship between the NOVA classification system and obesity phenotypes among women.
2 Subjects and methods
2.1 Participants
In this cross-sectional study, 221 overweight and obese women in the age range of 18–56 years participated. Participants with body mass index (BMI) between 25 kg/m2 and 29.9 kg/m2 were classified as overweight and those with BMI ≥30 kg/m2 as obese. Participants were selected from those who attended the health clinics of Tehran University of Medical Sciences (TUMS), Tehran Province, Tehran, Iran. Participants were included in the study after signing a written informed consent. The study protocol entered the practical phase after being approved by the ethics committee of TUMS (Ethics ID: IR.TUMS.MEDICINE.REC. 1399.165). Participants having any history of disease, i.e., diabetes mellitus, CVD, hypertension, acute or chronic inflammatory disease, impaired renal and liver function, thyroid disease, autoimmune disease, malignancy, those who were pregnant and lactating, smokers, those with a regular use of drugs, including birth control pills, and those who consumed alcohol or had drug abuse, were excluded from the study. In addition, participants who had an energy intake of less than 800 kcal/day and more than 4,200 kcal/day, as well as those who had 5% weight fluctuations over the last year, were excluded from the study (47).
2.2 Assessment of dietary intakes
The dietary intakes were collected using a 147-item semi-quantitative food frequency questionnaire (FFQ) by a trained nutritionist. This validated and reliable questionnaire of Iranian adults (48, 49) includes a list of common foods consumed by the Iranian community, along with their standard portion sizes. Frequency of intake of each food item was asked and recorded as per daily, weekly, monthly, or annual consumption. After calculating the total energy intake (kcal/day), the data were analyzed using Nutritionist IV software (version 7.0; N-Squared Computing, Salem, OR, United States) (50). The standard portion size and items reported based on the household scale were collected and converted to grams using the home scale guide. Thus, the equivalent of grams consumed for each item and for each subject was calculated (51).
2.3 NOVA classification
The NOVA classification was used to assess the amount of UPF intake (52). NOVA classifies a total of 37 food items and beverages obtained from the FFQs as UPFs. These UPFs are further divided into seven distinct food groups as follows (Supplementary Figure S1):
1. Group 1: Non-dairy drinks (industrial sweet drinks, cola, nectar, and coffee). Coffee torrefaction is often industrial in nature, and food technology specialists view it as a high-impact process whose elevated temperatures give rise to higher acrylamide levels (53).
2. Group 2: Dairy drinks [ice cream (pasteurized and unpasteurized), cocoa milk, and chocolate milk].
3. Group 3: Cakes and cookies [industrial bread, cakes, pancakes, noodles, toast, pasta, cookies, biscuits, and sweets (creamy and non-creamy)].
4. Group 4: Fast food and processed meats (pizza, burger, sausage, and bologna).
5. Group 5: Salty snacks (chips, puff pastry, and crackers).
6. Group 6: Oil and sauce (mayonnaise, ketchup, and margarine).
7. Group 7: Sweets (turmeric, nougat, chocolate, candy, stone candy, sweets, and jam) (54, 55). Candy and sweet ingredients that are used in Iran as UPFs include these items.
2.4 Measurement of biochemical parameters
The participants’ blood samples after 8–12 h overnight fasting were collected with standard methods at the Nutrition and Biochemistry Laboratory of the School of Nutritional Sciences and Dietetics, TUMS (53). Triglyceride (TG), total cholesterol (T-Chol), high-density lipoprotein cholesterol (HDL-C), low-density lipoprotein cholesterol (LDL-C), and fasting blood sugar (FBS) levels were measured using glycerol-3-phosphate oxidase phenol 4-amino antipyrine peroxidase (GPO-PAP), enzymatic endpoint, direct enzymatic clearance, and glucose oxidase phenol 4-amino, respectively. Pars Azmoon laboratory kits (Pars Azmoon Inc., Tehran, Iran) were used to assess the serum levels of TG, T-Chol, HDL-C, LDL-C, glucose, and insulin. IR (mIU/ml) was calculated through the homeostatic model assessment (HOMA-IR) according to the following equation: [fasting plasma glucose (mmol/L) × fasting plasma insulin (μIU/L)]/22.5 (56). The enzyme-linked immunosorbent assay (ELISA) technique was used to evaluate the levels of inflammatory biomarkers. Levels of hs-CRP, monocyte chemoattractant protein-1 (MCP-1) (ZellBio GmbH, Ulm, Germany), transforming growth factor-β (TGF-β) (Human TGF-β1 Quantikine ELISA Kit, R&D Systems, United States), plasminogen activator inhibitor-1 (PAI-1) (Human PAI-1*96 T ELISA Kit Crystal Company), galectin-3 (Gal-3), and interleukin-1β (IL-1β) were measured using an immunoturbidimetric test.
2.5 Anthropometry assessment
The body weight of the subjects was measured using a digital scale with a precision of 100 g. They were instructed to wear minimal clothing and no shoes during the measurements. Participant’s height was recorded in a standing position with the normal position of the shoulders, without shoes. BMI was calculated by dividing the weight (kg) by the square of the height (m2). We used a multi-frequency bioelectrical impedance analyzer [InBody 770 scanner (InBody Co., Ltd., Seoul, South Korea)] to assess the body composition, including the visceral fat level (VFL), body fat percentage (BF%), fat-free mass index (FFMI) and fat mass index (FMI), WC, waist-to-hip ratio (WHR), fat-free mass (FFM), fat trunk, and fat mass (FM). To record a more accurate result, participants were asked to be present with empty stomachs and bladders, without exercising before the session, and without their shoes, jackets, and coats. The output was printed out after 20 min of measurement.
2.6 Assessment of other variables
The assessment of physical activity (PA) levels was conducted using the International Physical Activity Short Form Questionnaire (IPAQ). This questionnaire was administered through interviews, with participants providing oral responses. PA was quantified as metabolic equivalent task minutes per week (MET-minutes/week) (57). Additionally, a demographic questionnaire was utilized to gather information on age, educational background, employment status, marital status, and economic status.
2.7 Definition of metabolic health and its components
The assessment of the metabolic health status in individuals was conducted using the Karelis criterion, which considers both insulin sensitivity and inflammatory profiles. According to the Karelis criterion, individuals are considered metabolically healthy if they meet four or more of the following five components: HOMA-IR ≤ 2.7, hs-CRP ≤ 3.0 mg/L, LDL-C ≤ 2.6 mmol/L without any treatment, HDL-C ≥ 1.3 mmol/L without any treatment, and TG ≤ 1.7 mmol/L (14).
2.8 Statistical analysis
Data analysis was conducted using SPSS version 26 (SPSS Inc.). The normality of data distribution was assessed using the Kolmogorov–Smirnov test. Continuous variables were reported as mean ± standard deviation (SD), and the categorical variables were reported as numbers and percentages. The mean and SD were reported by a one-way analysis of variance (ANOVA). Analysis of covariance (ANCOVA) was used to examine the relationship between demographic variables (age, height, weight, PA, inflammatory parameters, food groups, macronutrients, and micronutrients) and the NOVA classification system while controlling for confounding variables, including age, BMI, and PA factors. The chi-square test was utilized to analyze the frequency of categorical variables, including education, economic status, marital status, employment status, and the NOVA classification system. Binary logistic regression analysis was employed to evaluate the association between NOVA classification scores and MUHO, with odds ratios (ORs) and 95% confidence intervals (CIs) reported. The analysis was performed in three models: crude, model 1, and model 2. The crude model did not include any confounding factors, with model 1 adjusted for age, BMI, energy intake, and PA and model 2 adjusted for age, BMI, energy intake, PA, economic status, supplement use, educational background, and marital status. In addition, to evaluate the mediatory role, Barrett’s model was used, and inflammatory markers including hs-CRP, TGF-β, IL-1β, MCP-1, PAI-1, and HOMA-IR were included in the adjustment models. value of ps of <0.05 were considered to be statistically significant, and value of ps of 0.05, 0.06, and 0.07 were considered marginally statistically significant.
3 Results
3.1 Study population and general characteristics
A total of 221 women who were overweight or obese were included in the analysis. The participants had a mean (SD) age of 36.22 (8.54) years, a body weight of 79.58 (10.89) kg, and a BMI of 30.55 (3.590) kg/m2. Most participants were married (71.9%), employed (97.0%), and had a moderate economic status (42.4%). The mean (SD) values for the NOVA score, Karelis criterion score, and hs-CRP were 197.149 (136.80), 2.471 (1.11), and 4.532 (4.72) mg/L, respectively. Additionally, most participants (77.1%) were classified as MUHO.
3.2 General characteristics across quartiles of NOVA classification
Table 1 represents general characteristics and anthropometric variables across the quartiles of the NOVA classification. A significant difference was observed in mean age (p = 0.03), WHR (p = 0.02), and economic status (p = 0.01) in the crude model. However, after adjusting for confounding factors such as age, BMI, PA, and energy intake, no significant associations were found for these variables (p > 0.05). Other variables did not show any significant relationships among the NOVA quartiles (p > 0.05). Furthermore, after adjusting for confounders, a significant difference was observed in variables such as MCP-1 (p = 0.06), Gal-3 (p = 0.03), PAI-1 (p = 0.024), and supplement use (p = 0.03).
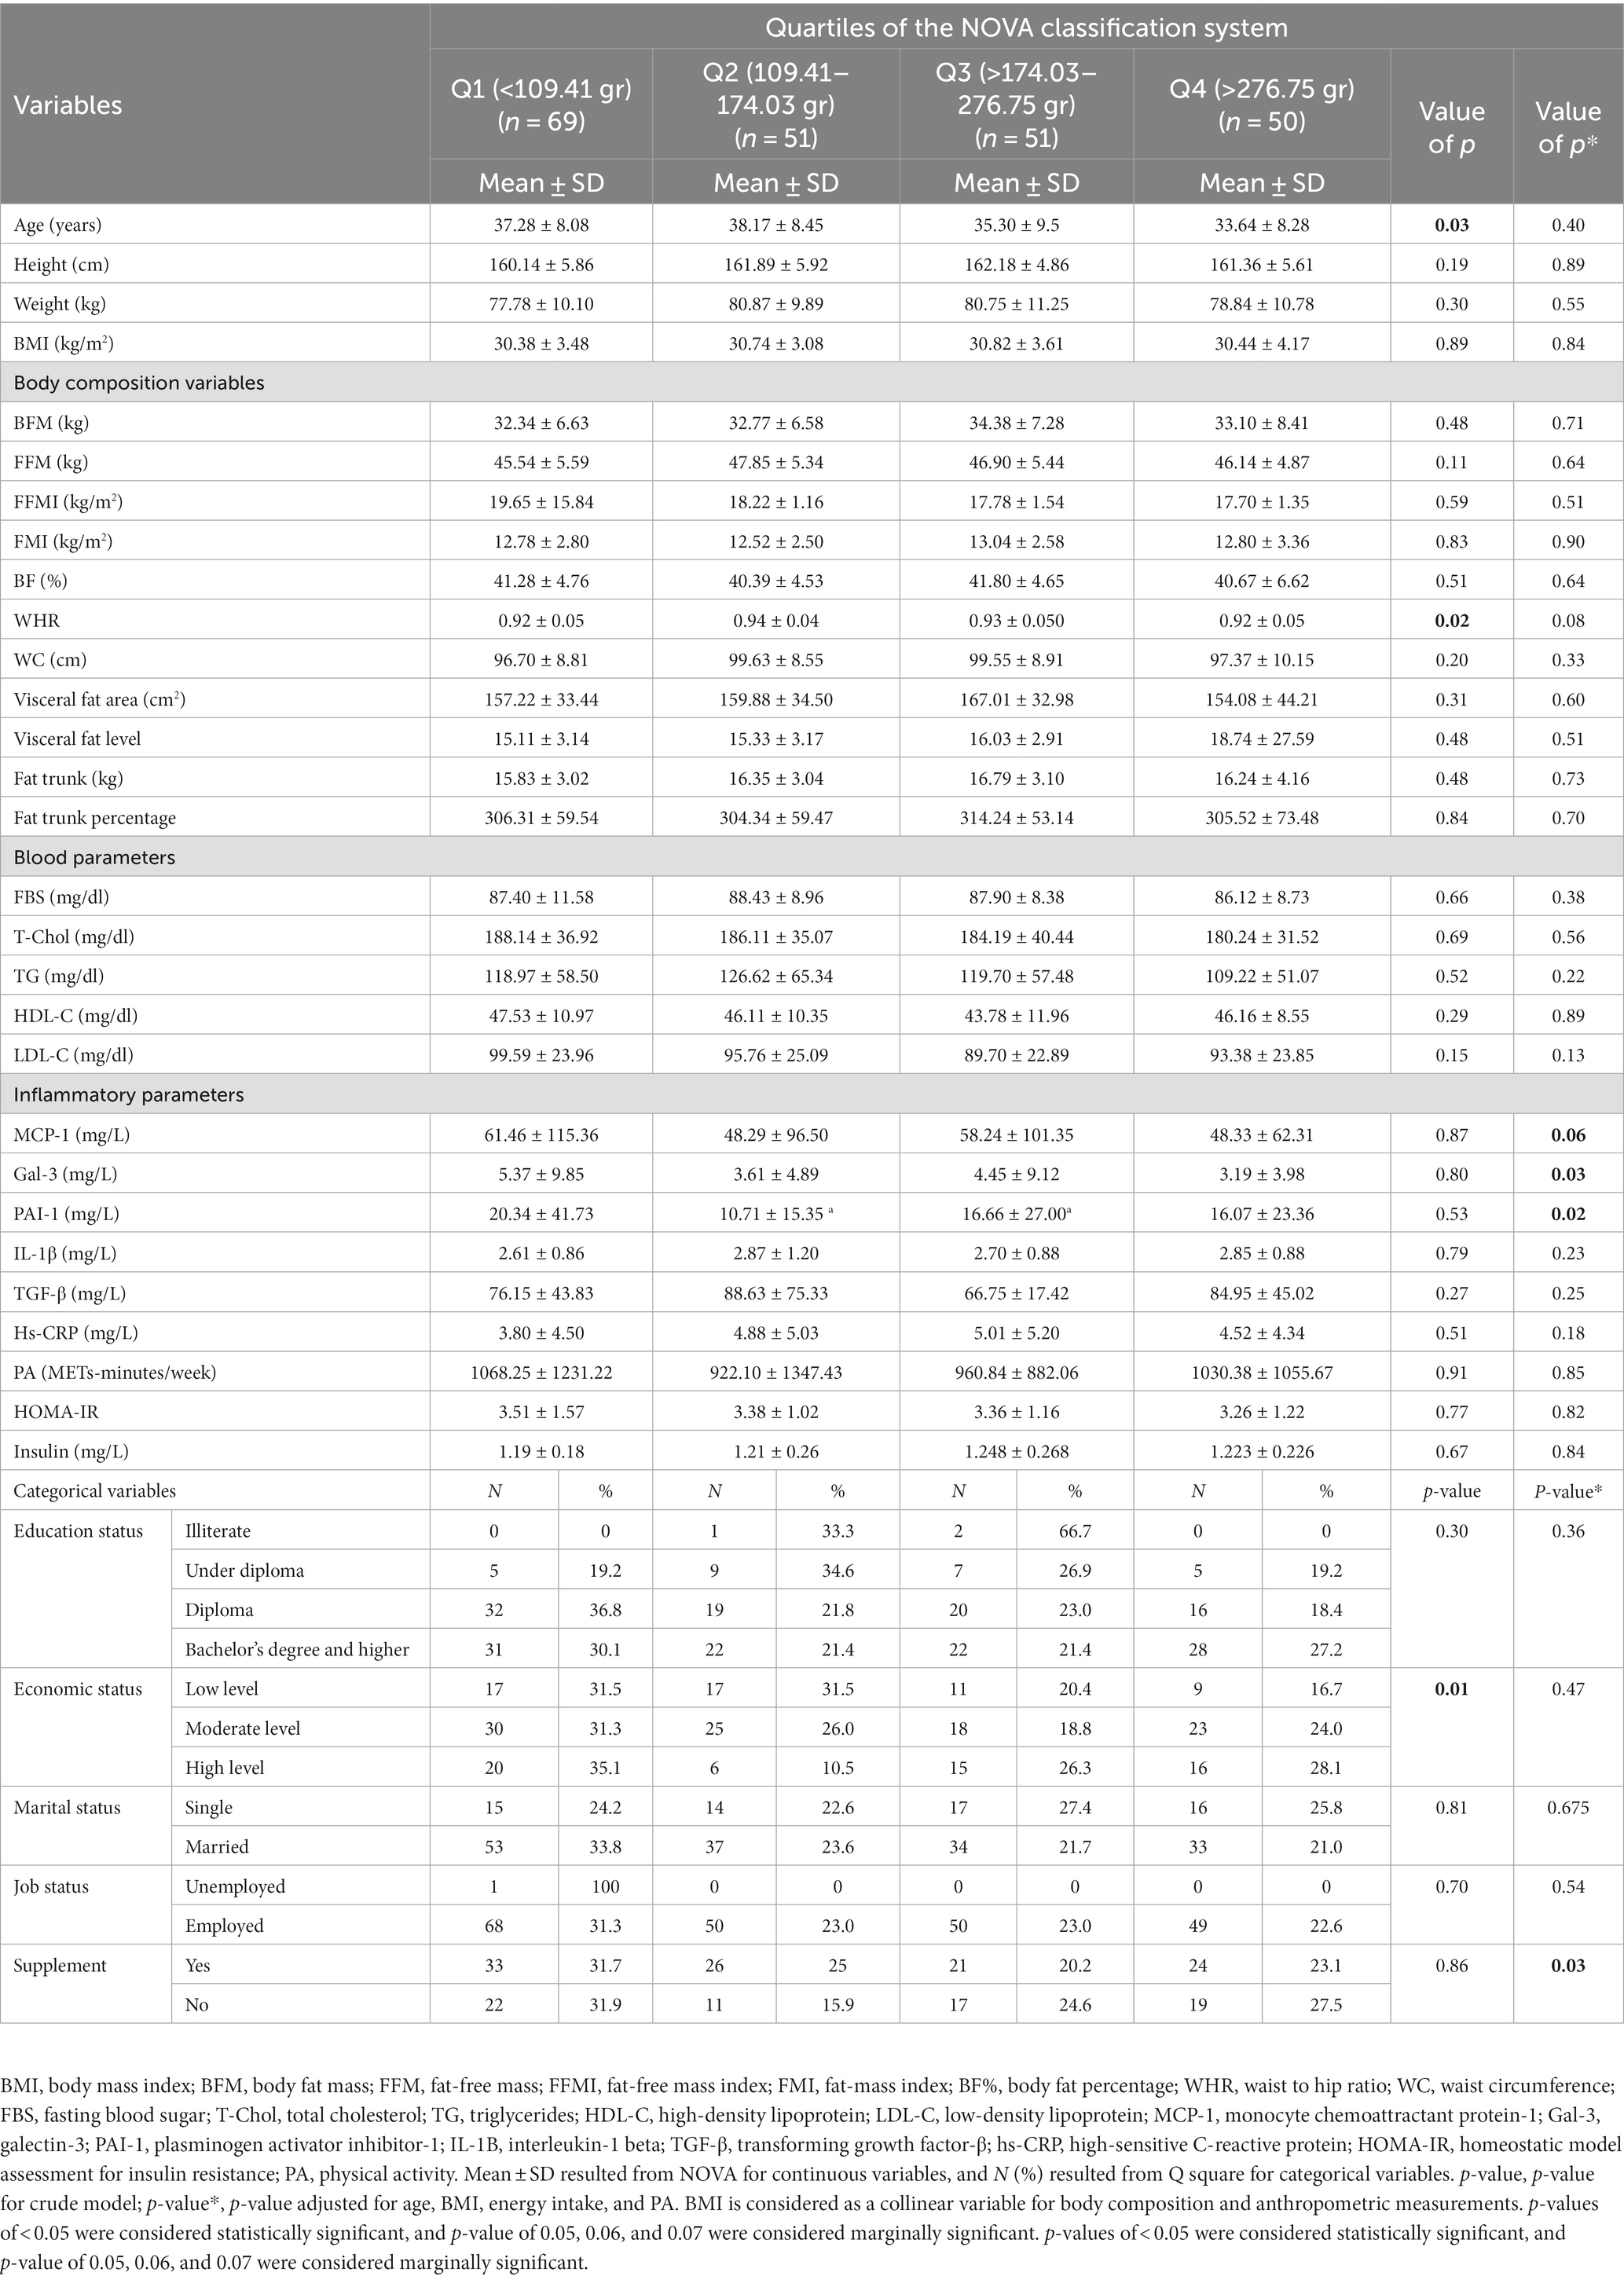
Table 1. General characteristics of the participants in the study among quartiles of the NOVA classification system in overweight and obese women (N = 221).
3.3 Dietary intake according to the NOVA quartiles
Table 2 displays the dietary intakes of the subjects categorized into NOVA classification system quartiles. The mean differences in protein, carbohydrate, SFA, monounsaturated fatty acid (MUFA), polyunsaturated fatty acid (PUFA), linoleic acid, linolenic acid, vitamin A, vitamin C, vitamin E, vitamin B1, vitamin B2, vitamin B3, vitamin B5, vitamin B9, vitamin B12, biotin, calcium, iron, zinc, copper, manganese, selenium, chromium, fruit consumption, refined grain consumption, dairy consumption, and red meat intake were found to be significant among the NOVA quartiles in the crude model (p < 0.05). In the adjusted model, significant mean differences were observed for vitamin B6, total fiber intake, SSB consumption, processed food consumption, and vegetable consumption (p < 0.05).
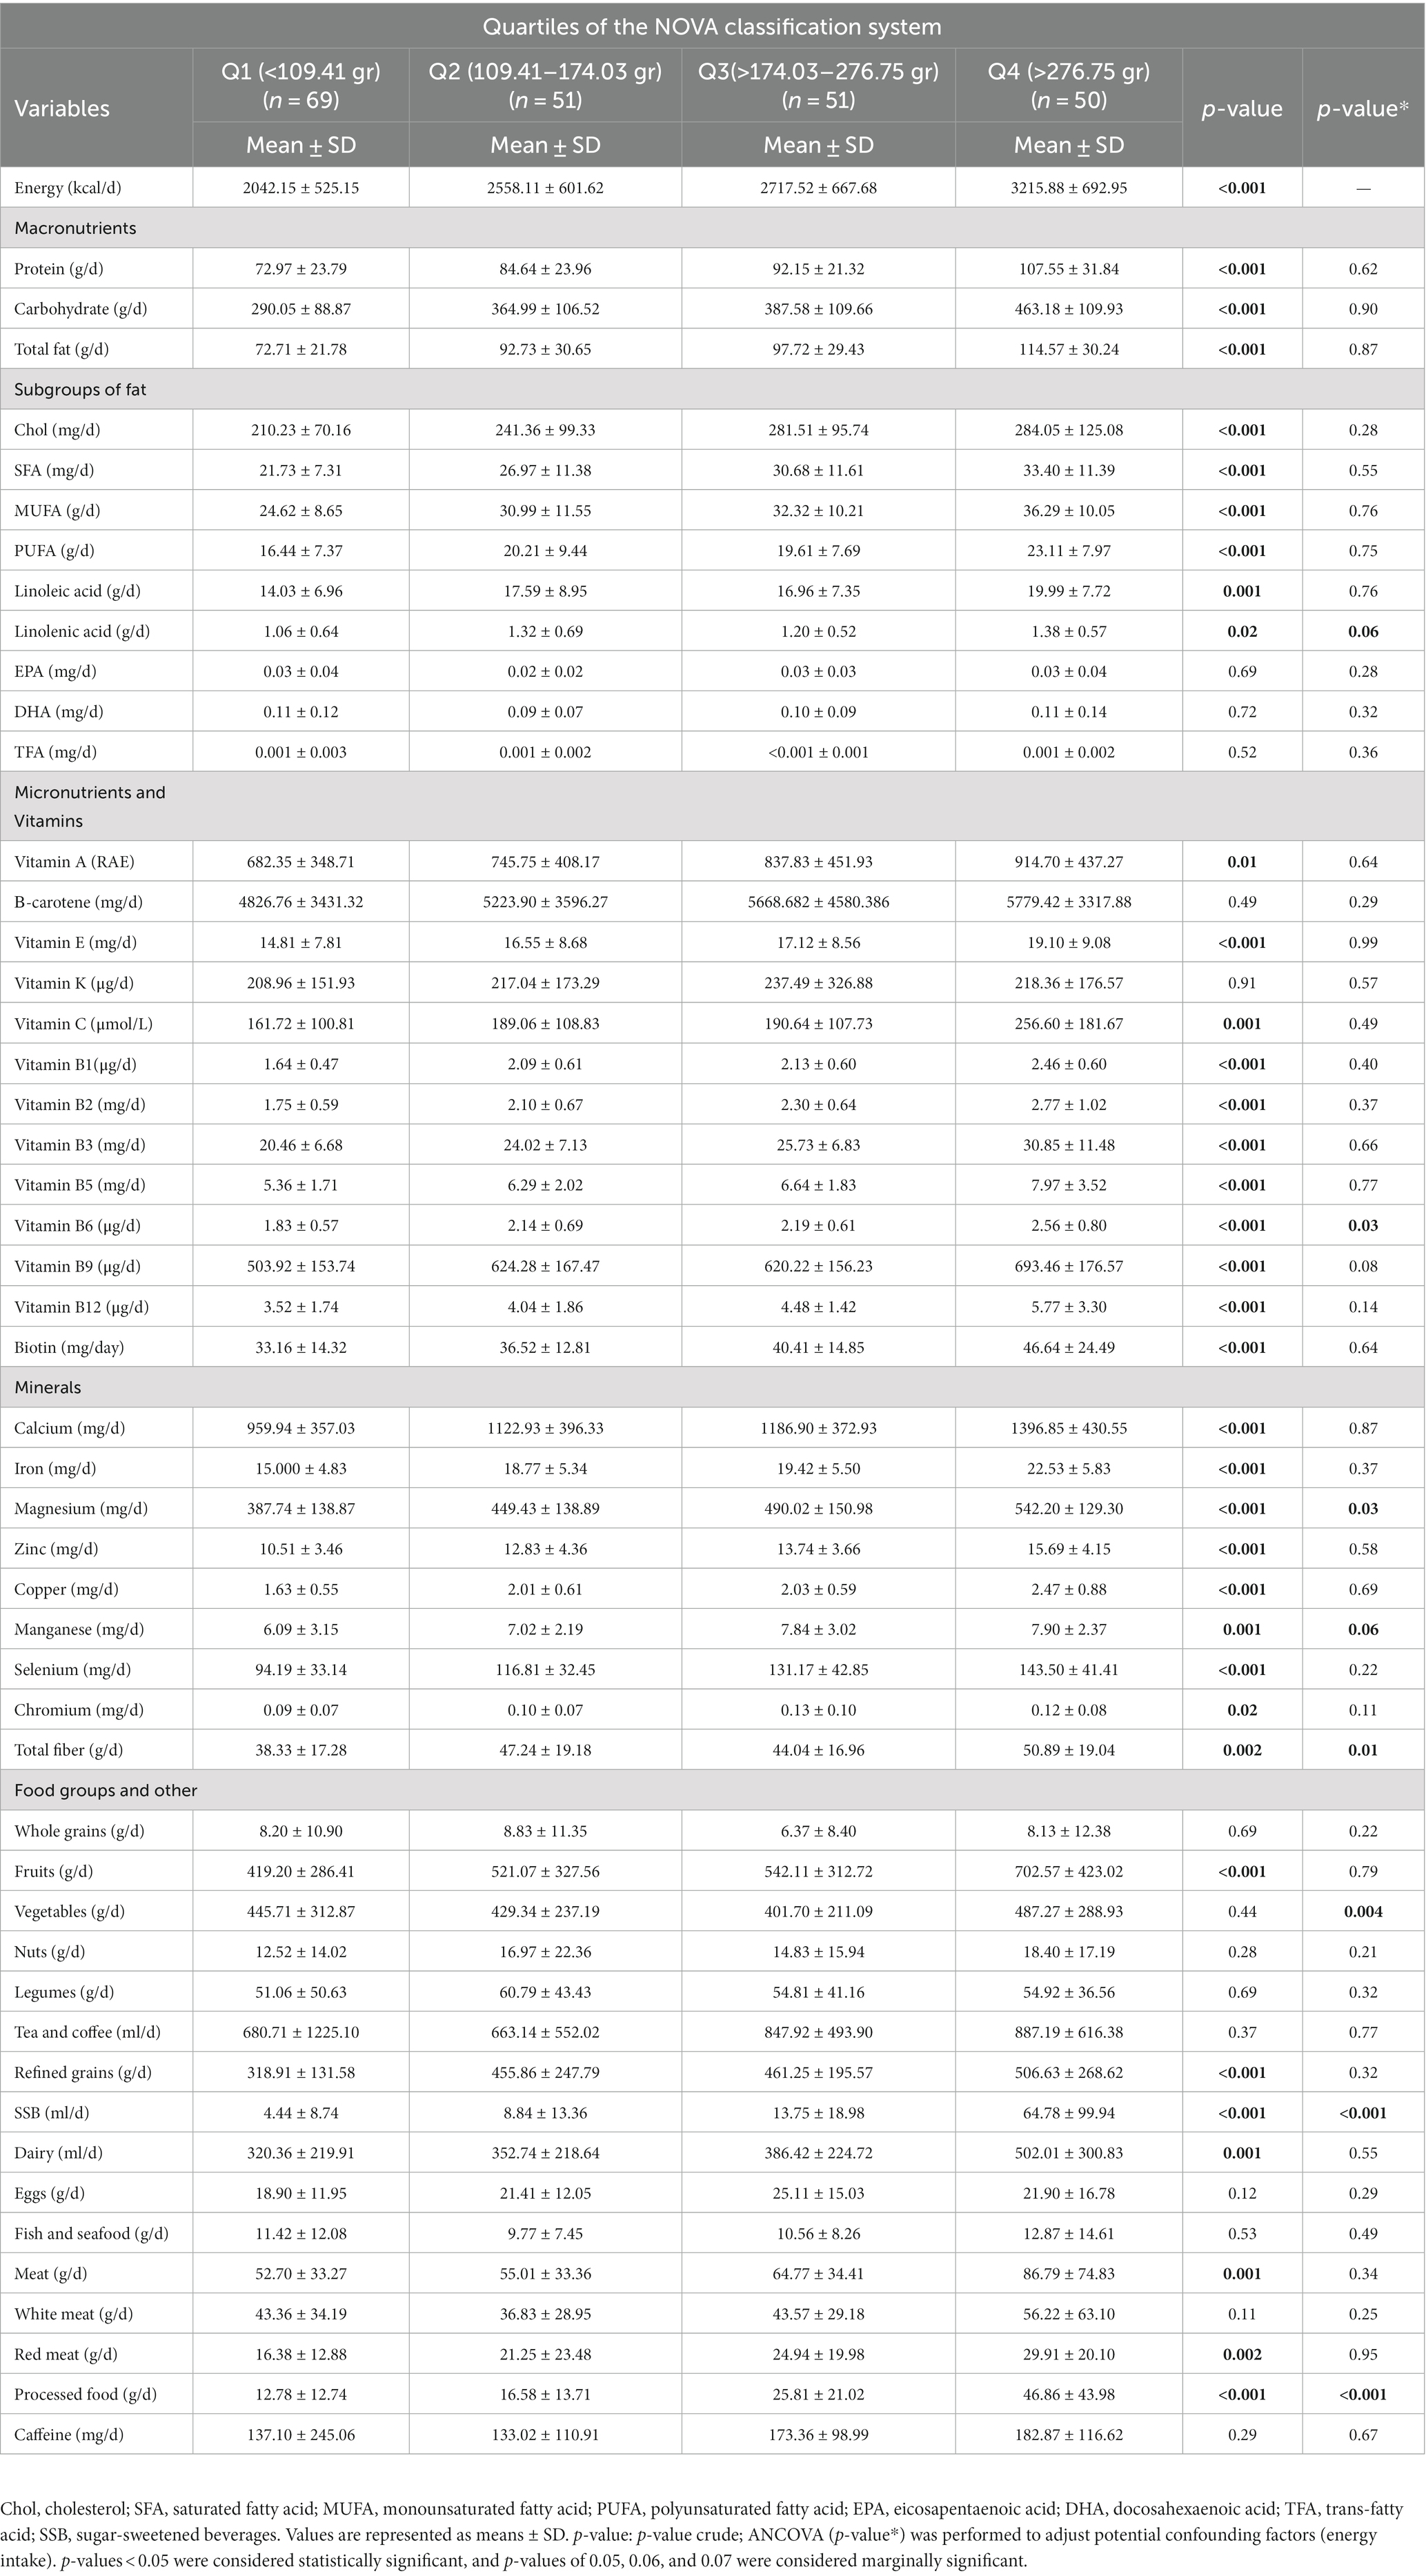
Table 2. Dietary intakes according to NOVA classification system quartiles in study participants (N = 221).
3.4 Association between quartiles of NOVA classification and MUHO among overweight and obese women
The association between NOVA quartiles and MUHO in both the crude and adjusted models (model 1 and model 2) is represented in Table 3. The results of our study demonstrate a 77% increase in the odds of MUHO in the third quartile compared to the first quartile in the crude model (OR = 1.77, 95% CIs = 1.02, 4.33, p = 0.01). This association remained significant after adjustment in model 1 (controlling for age, BMI, energy intake, and PA) (OR = 1.95, 95% CIs = 1.65, 5.79, p = 0.04) and model 2 (controlling for age, BMI, energy intake, PA, economic status, supplement use, educational background, and marital status) (OR = 1.40, 95% CIs = 1.09, 4.92, p = 0.04).
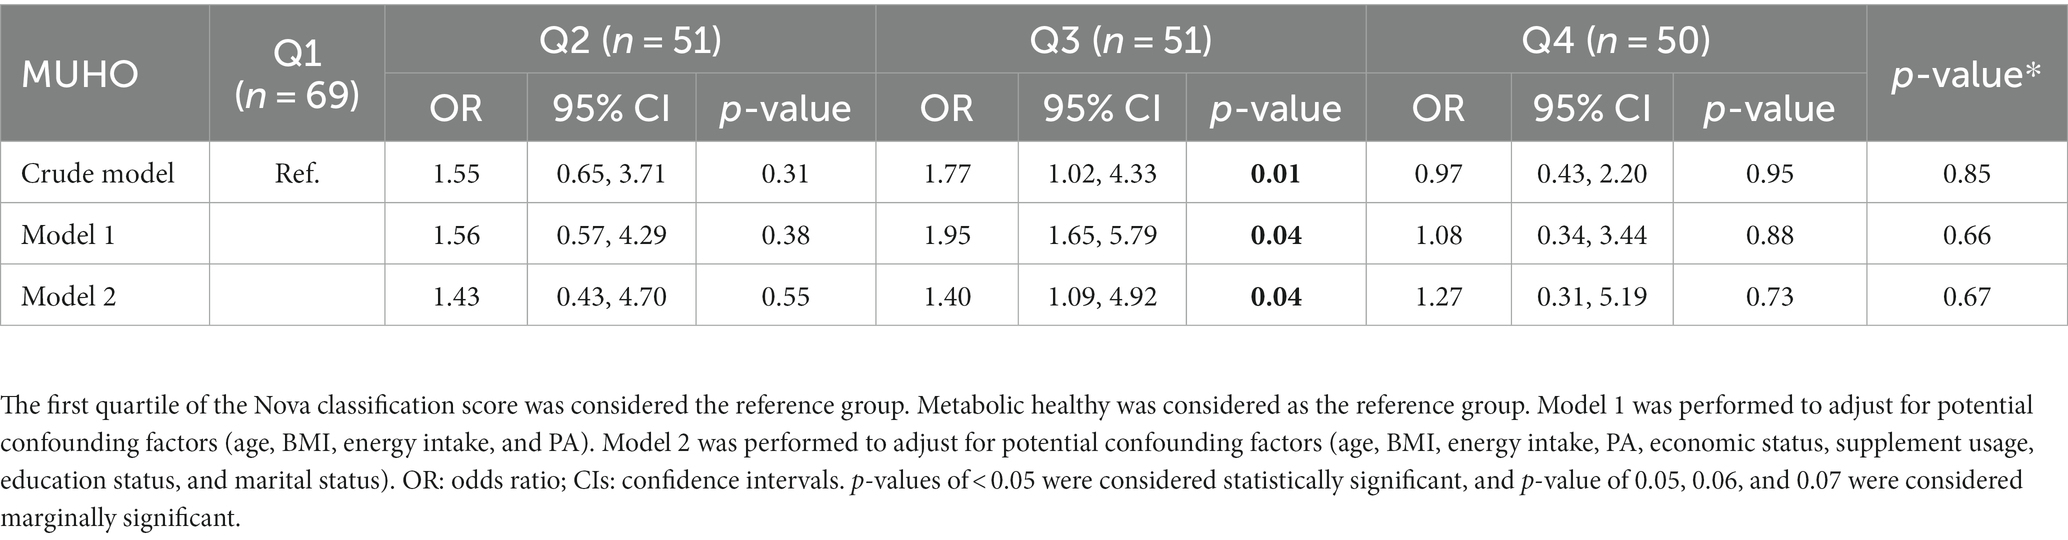
Table 3. Association between NOVA classification score and MUHO among overweight and obese women (N = 221).
3.5 Association of MUHO across the quartiles of NOVA, mediated by inflammatory markers
The relationship between MUHO and the NOVA quartiles, mediated by inflammatory markers, in overweight and obese women is shown in Table 4. The potential role of inflammatory markers, such as hs-CRP (p = 0.84), TGF-β (p = 0.50), MCP-1 (p = 0.49), PAI-1 (p = 0.97), and HOMA-IR (p = 0.92), was found to be that of mediators.
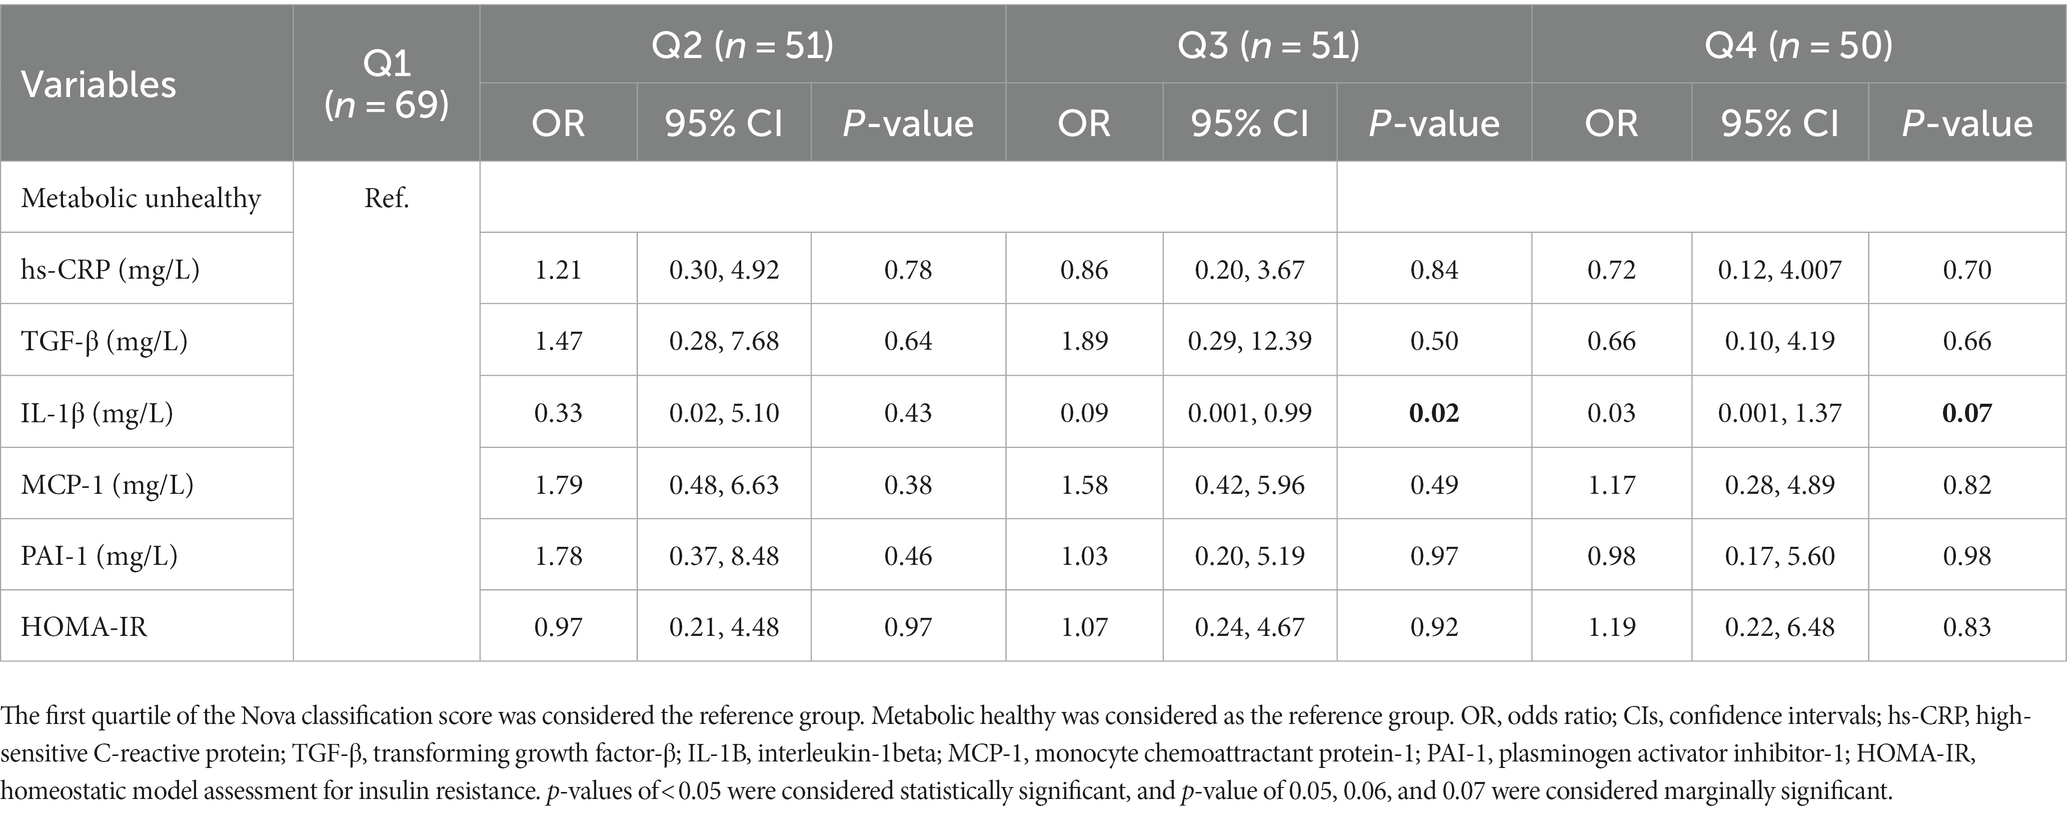
Table 4. Association of MUHO across the quartiles of NOVA, mediated by inflammatory markers.
4 Discussion
The current study investigated the associations between the mediating role of inflammatory markers and the relationship between the NOVA classification system and obesity phenotypes in obese and overweight adult women.
There was a positive association observed between the third quartile of the NOVA classification system and an increased likelihood of having the MUHO phenotype in women. Inflammatory markers such as hs-CRP, TGF-β, MCP-1, PAI-1, and HOMA-IR showed their mediatory role in Q3. This finding is consistent with a study by Yu et al., which found that the visceral adipose tissue (VAT) is independently associated with various inflammatory markers. Specifically, markers such as white blood cell (WBC) count and hs-CRP showed stronger correlations with VAT compared to other markers such as the neutrophil–lymphocyte ratio (NLR) and platelet–lymphocyte ratio (PLR) (58). Furthermore, another study reported a significant negative association between adherence to a healthy plant-based diet index (hPDI) and the MUHO phenotype among overweight and obese Iranian women. This association was found to be mediated by factors such as TGF-β, IL-1β, and MCP-1 (59). Hosseininasab et al. indicated that there is a significant association between UPF consumption and TGF-β, atherogenic coefficient (AC), VFL, and the quantitative insulin sensitivity check index (QUICKI) (60). In a systematic review and meta-analysis of 43 observational studies, there was an association between intake of UPF and an increased risk of obesity, overweight, abdominal obesity, and metabolic syndrome (61). The higher consumption of dairy products, tea, and coffee compared to fast foods decreased the risk of developing an unhealthy phenotype (62). In a systematic review and meta-analysis study, there was an association between increased UPF consumption and a cardiometabolic risk profile (63). Exposure to bisphenol, an industrial chemical used in the plastic packaging of some UPFs, is related to an increased risk of cardiometabolic disease (64).
UPF intake must be cautiously adopted given the high proportion of artificial ingredients in their formulations (37), which are potentially harmful to human health, especially when consumed in excess. Excessive consumption of these foods is related to an increase in the occurrence of NCDs (37, 65). Emerging evidence indicates that the consumption of UPF products contributes to an unhealthy dietary pattern (26). Furthermore, additives present in foods such as emulsifiers and non-caloric artificial sweeteners have been linked to various chronic disorders such as systemic inflammation, endothelial dysfunction, and disrupted immune response (66, 67). A study conducted in the United States revealed that UPF consumption was associated with increased exposure to phthalates (68), which have been suggested to be linked to obesity (69). Evidence suggests that abdominal obesity’s origin can be associated with UPF intake, which delays satiety signals (37). UPF can also increase ad libitum energy intake by approximately 500 kcal/day, leading to higher weight gain compared to a minimally processed diet (70). Carrageenan, one of the commonly used additives, has been implicated in promoting IR and inhibiting insulin signaling in mice (71, 72), which may contribute to weight gain (73). On the other hand, a minimally processed diet has been shown to result in higher levels of peptide YY (an appetite suppressant hormone) compared to the UPF diet (70). Certain emulsifiers (such as carboxymethyl cellulose and polysorbate-80) have induced metabolic disturbances, alterations in the gut microbiota, and low-grade inflammation in mice (74).
The present study has its strengths. First, it is the first study to investigate the mediatory role of various inflammatory markers on the relationship between the NOVA classification system and obesity phenotypes among obese and overweight adult women. Second, the assessment of dietary intake was conducted using a validated and reliable questionnaire. Third, confounding factors were adjusted in the statistical models.
However, there are several limitations to be discussed. The observational design of the study restricts the ability to establish causality of associations. Nevertheless, an observational design is the most suitable approach to investigate these types of associations, as conducting longitudinal studies involving interventions targeting UPF intake could pose health risks and ethical concerns. Furthermore, the results cannot be extrapolated to the general population as the participants included in the study were overweight/obese Iranian women. In addition, the assessment of food intake using a FFQ is susceptible to measurement bias. Nevertheless, FFQs have been widely used as a tool in epidemiological studies since the 1990s (75). Finally, despite considering potential confounders, the possibility of residual confounding factors influencing the results cannot be entirely ruled out.
5 Conclusion
In conclusion, our findings indicate a significant positive association between the consumption of UPFs and the MUHO phenotype in overweight and obese women residing in Iran. This association appears to be mediated by inflammatory markers such as MCP-1, PAI-1, hs-CRP, TGF-β, and HOMA-IR. The results of this study suggest that UPF consumption may have detrimental effects on obesity-related characteristics and, consequently, on NCDs. The role of diet and nutritional status is crucial for improving human health. Identifying unhealthy dietary patterns and their association with obesity is essential for preventing chronic diseases and enhancing public health strategies. Further research is warranted to confirm and expand upon our findings.
Data availability statement
The raw data supporting the conclusions of this article will be made available by the authors, without undue reservation.
Ethics statement
Ethics approval for the study protocol was confirmed by The Human Ethics Committee of TUMS (Ethics Number: ID: IR. TUMS.MEDICINE. REC. 1399.165). All participants signed a written informed consent approved by the Ethics committee. The studies were conducted in accordance with the local legislation and institutional requirements. The participants provided their written informed consent to participate in this study.
Author contributions
MH and DH wrote the manuscript. FS performed the statistical analyzes. DH, YA, and SH revised the manuscript and improved its language. KM had full access to all the data in the study and took responsibility for the integrity and accuracy of the data. All authors have read and approved the final manuscript.
Funding
This study is funded by grants from the TUMS, Tehran, Iran (Grant ID: 98–3–212-46718).
Acknowledgments
We are grateful to all participants for their contribution to this research.
Conflict of interest
The authors declare that the research was conducted in the absence of any commercial or financial relationships that could be construed as a potential conflict of interest.
Publisher’s note
All claims expressed in this article are solely those of the authors and do not necessarily represent those of their affiliated organizations, or those of the publisher, the editors and the reviewers. Any product that may be evaluated in this article, or claim that may be made by its manufacturer, is not guaranteed or endorsed by the publisher.
Supplementary material
The Supplementary material for this article can be found online at: https://www.frontiersin.org/articles/10.3389/fnut.2023.1226162/full#supplementary-material
References
1. Feve, B, Bastard, J-P, and Vidal, H. Relationship between obesity, inflammation and insulin resistance: new concepts. C R Biol. (2006) 329:587–97. doi: 10.1016/j.crvi.2006.03.020
2. Schrager, MA, Metter, EJ, Simonsick, E, Ble, A, Bandinelli, S, Lauretani, F, et al. Sarcopenic obesity and inflammation in the InCHIANTI study. J Appl Physiol. (2007) 102:919–25. doi: 10.1152/japplphysiol.00627.2006
3. Krakauer, NY, and Krakauer, JC. A new body shape index predicts mortality hazard independently of body mass index. PLoS One. (2012) 7:e39504. doi: 10.1371/journal.pone.0039504
4. Pi-Sunyer, X. The medical risks of obesity. Postgrad Med. (2009) 121:21–33. doi: 10.3810/pgm.2009.11.2074
5. Zhang, Y, Liu, J, Yao, J, Ji, G, Qian, L, Wang, J, et al. Obesity: pathophysiology and intervention. Nutrients. (2014) 6:5153–83. doi: 10.3390/nu6115153
6. Cameron, AJ, Zimmet, PZ, Dunstan, DW, Dalton, M, Shaw, JE, Welborn, TA, et al. Overweight and obesity in Australia: the 1999–2000 Australian diabetes, obesity and lifestyle study (AusDiab). Med J Aust. (2003) 178:427–32. doi: 10.5694/j.1326-5377.2003.tb05283.x
7. Cecil, JE, Tavendale, R, Watt, P, Hetherington, MM, and Palmer, CNA. An obesity-associated FTO gene variant and increased energy intake in children. N Engl J Med. (2008) 359:2558–66. doi: 10.1056/NEJMoa0803839
8. Habibi, N, Leemaqz, SY-L, and Grieger, JA. Modelling the impact of reducing ultra-processed foods based on the NOVA classification in Australian women of reproductive age. Nutrients. (2022) 14:1518. doi: 10.3390/nu14071518
9. Seidell, JC. Epidemiology of obesity. in Seminars in vascular medicine. Stuttgart: Thieme Medical Publishers, Inc. (2005).
10. Kelly, T, Yang, W, Chen, CS, Reynolds, K, and He, J. Global burden of obesity in 2005 and projections to 2030. Int J Obes. (2008) 32:1431–7. doi: 10.1038/ijo.2008.102
11. Pourfarzi, F, Sadjadi, A, Poustchi, H, and Amani, F. Prevalence of overweight and obesity in Iranian population: a population-based study in northwestern of Iran. J Public Health Res. (2022) 11:2475. doi: 10.4081/jphr.2021.2475
12. Pajunen, P, Kotronen, A, Korpi-Hyövälti, E, Keinänen-Kiukaanniemi, S, Oksa, H, Niskanen, L, et al. Metabolically healthy and unhealthy obesity phenotypes in the general population: the FIN-D2D survey. BMC Public Health. (2011) 11:1–8. doi: 10.1186/1471-2458-11-754
13. Bell, JA, Kivimaki, M, and Hamer, M. Metabolically healthy obesity and risk of incident type 2 diabetes: a meta-analysis of prospective cohort studies. Obes Rev. (2014) 15:504–15. doi: 10.1111/obr.12157
14. Hinnouho, G-M, Czernichow, S, Dugravot, A, Batty, GD, Kivimaki, M, and Singh-Manoux, A. Metabolically healthy obesity and risk of mortality: does the definition of metabolic health matter? Diabetes Care. (2013) 36:2294–300. doi: 10.2337/dc12-1654
15. Muñoz-Garach, A, Cornejo-Pareja, I, and Tinahones, FJ. Does metabolically healthy obesity exist? Nutrients. (2016) 8:320. doi: 10.3390/nu8060320
16. Van Vliet-Ostaptchouk, JV, Nuotio, ML, Slagter, SN, Doiron, D, Fischer, K, Foco, L, et al. The prevalence of metabolic syndrome and metabolically healthy obesity in Europe: a collaborative analysis of ten large cohort studies. BMC Endocr Disord. (2014) 14:1–13. doi: 10.1186/1472-6823-14-9
17. Alam, I, Ng, TP, and Larbi, A. Does inflammation determine whether obesity is metabolically healthy or unhealthy? The aging perspective. Mediat Inflamm. (2012) 2012:1–14. doi: 10.1155/2012/456456
18. Hwang, LC, Bai, CH, Sun, CA, and Chen, CJ. Prevalence of metabolically healthy obesity and its impacts on incidences of hypertension, diabetes and the metabolic syndrome in Taiwan. Asia Pac J Clin Nutr. (2012) 21:227–33.
19. Da Silva Scaranni, PO, De Oliveira Cardoso, L, Griep, RH, Lotufo, PA, Barreto, SM, and Da Fonseca, MJ. Consumption of ultra-processed foods and incidence of dyslipidaemias: the Brazilian longitudinal study of adult health (ELSA-Brasil). Br J Nutr. (2023) 129:336–44. doi: 10.1017/S0007114522001131
20. Sung, H, Park, JM, Oh, SU, Ha, K, and Joung, H. Consumption of ultra-processed foods increases the likelihood of having obesity in Korean women. Nutrients. (2021) 13:698. doi: 10.3390/nu13020698
21. Vilela, DL, Fonseca, PG, Pinto, SL, and Bressan, J. Influence of dietary patterns on the metabolically healthy obesity phenotype: a systematic review. Nutr Metab Cardiovasc Dis. (2021) 31:2779–91. doi: 10.1016/j.numecd.2021.05.007
22. Lawrence, MA, and Baker, PI. Ultra-processed food and adverse health outcomes. BMJ. (2019) 2019:l2289. doi: 10.1136/bmj.l2289
23. Basu, S, Yoffe, P, Hills, N, and Lustig, RH. The relationship of sugar to population-level diabetes prevalence: an econometric analysis of repeated cross-sectional data. PLoS One. (2013) 8:e57873. doi: 10.1371/journal.pone.0057873
24. Malik, VS, and Hu, FB. The role of sugar-sweetened beverages in the global epidemics of obesity and chronic diseases. Nat Rev Endocrinol. (2022) 18:205–18. doi: 10.1038/s41574-021-00627-6
25. Bahadoran, Z, Mirmiran, P, and Azizi, F. Fast food pattern and cardiometabolic disorders: a review of current studies. Health Promot Perspect. (2015) 5:231–40. doi: 10.15171/hpp.2015.028
26. Matos, RA, Adams, M, and Sabaté, J. The consumption of ultra-processed foods and non-communicable diseases in Latin America. Front Nutr. (2021) 8:622714. doi: 10.3389/fnut.2021.622714
27. Moradi, S, Entezari, MH, Mohammadi, H, Jayedi, A, Lazaridi, AV, Kermani, MH, et al. Ultra-processed food consumption and adult obesity risk: a systematic review and dose-response meta-analysis. Crit Rev Food Sci Nutr. (2022) 63:249–60. doi: 10.1080/10408398.2021.1946005
28. Neri, D, Martínez-Steele, E, Khandpur, N, and Levy, R. Associations between ultra-processed foods consumption and indicators of adiposity in US adolescents: cross-sectional analysis of the 2011-2016 National Health and nutrition examination survey. J Acad Nutr Diet. (2022) 122:1474–1487.e2. doi: 10.1016/j.jand.2022.01.005
29. Feskens, EJ, Virtanen, SM, Räsänen, L, Tuomilehto, J, Stengård, J, Pekkanen, J, et al. Dietary factors determining diabetes and impaired glucose tolerance: a 20-year follow-up of the Finnish and Dutch cohorts of the seven countries study. Diabetes Care. (1995) 18:1104–12. doi: 10.2337/diacare.18.8.1104
30. Storlien, L, Baur, LA, Kriketos, AD, Pan, DA, Cooney, GJ, Jenkins, AB, et al. Dietary fats and insulin action. Diabetologia. (1996) 39:621–31. doi: 10.1007/BF00418533
31. Dos Santos Martins, GM, França, AK, Viola, PC, Carvalho, CA, Marques, KD, Santos, AM, et al. Intake of ultra-processed foods is associated with inflammatory markers in Brazilian adolescents. Public Health Nutr. (2022) 25:591–9. doi: 10.1017/S1368980021004523
32. Stanimirovic, J, Radovanovic, J, Banjac, K, Obradovic, M, Essack, M, Zafirovic, S, et al. Role of C-reactive protein in diabetic inflammation. Mediat Inflamm. (2022) 2022:1–15. doi: 10.1155/2022/3706508
33. Fontana, L, Eagon, JC, Trujillo, ME, Scherer, PE, and Klein, S. Visceral fat adipokine secretion is associated with systemic inflammation in obese humans. Diabetes. (2007) 56:1010–3. doi: 10.2337/db06-1656
34. Konieczna, J, Morey, M, Abete, I, Bes-Rastrollo, M, Ruiz-Canela, M, Vioque, J, et al. Contribution of ultra-processed foods in visceral fat deposition and other adiposity indicators: prospective analysis nested in the PREDIMED-plus trial. Clin Nutr. (2021) 40:4290–300. doi: 10.1016/j.clnu.2021.01.019
35. Poti, JM, Braga, B, and Qin, B. Ultra-processed food intake and obesity: what really matters for health–processing or nutrient content? Curr Obes Rep. (2017) 6:420–31. doi: 10.1007/s13679-017-0285-4
36. Lopes, AE, Araújo, LF, Levy, RB, Barreto, SM, and Giatti, L. Association between consumption of ultra-processed foods and serum C-reactive protein levels: cross-sectional results from the ELSA-Brasil study. Sao Paulo Med J. (2019) 137:169–76. doi: 10.1590/1516-3180.2018.0363070219
37. Monteiro, CA, Cannon, G, Moubarac, JC, Levy, RB, Louzada, MLC, and Jaime, PC. The UN decade of nutrition, the NOVA food classification and the trouble with ultra-processing. Public Health Nutr. (2018) 21:5–17. doi: 10.1017/S1368980017000234
38. Llavero-Valero, M, Escalada-San Martín, J, Martínez-González, MA, Basterra-Gortari, FJ, de la Fuente-Arrillaga, C, and Bes-Rastrollo, M. Ultra-processed foods and type-2 diabetes risk in the SUN project: a prospective cohort study. Clin Nutr. (2021) 40:2817–24. doi: 10.1016/j.clnu.2021.03.039
39. Martinez-Perez, C, San-Cristobal, R, Guallar-Castillon, P, Martínez-González, MÁ, Salas-Salvadó, J, Corella, D, et al. Use of different food classification systems to assess the association between ultra-processed food consumption and cardiometabolic health in an elderly population with metabolic syndrome (PREDIMED-plus cohort). Nutrients. (2021) 13:2471. doi: 10.3390/nu13072471
40. Srour, B, Fezeu, LK, Kesse-Guyot, E, Allès, B, Méjean, C, Andrianasolo, RM, et al. Ultra-processed food intake and risk of cardiovascular disease: prospective cohort study (NutriNet-Santé). BMJ. (2019) 365:l1451. doi: 10.1136/bmj.l1451
41. Srour, B, Fezeu, LK, Kesse-Guyot, E, Allès, B, Debras, C, Druesne-Pecollo, N, et al. Ultraprocessed food consumption and risk of type 2 diabetes among participants of the NutriNet-Santé prospective cohort. JAMA Intern Med. (2020) 180:283–91. doi: 10.1001/jamainternmed.2019.5942
42. Canhada, SL, Luft, VC, Giatti, L, Duncan, BB, Chor, D, Fonseca, MJM, et al. Ultra-processed foods, incident overweight and obesity, and longitudinal changes in weight and waist circumference: the Brazilian longitudinal study of adult health (ELSA-Brasil). Public Health Nutr. (2020) 23:1076–86. doi: 10.1017/S1368980019002854
43. Arya, S, Isharwal, S, Misra, A, Pandey, RM, Rastogi, K, Vikram, NK, et al. C-reactive protein and dietary nutrients in urban Asian Indian adolescents and young adults. Nutrition. (2006) 22:865–71. doi: 10.1016/j.nut.2006.05.002
44. Esmaillzadeh, A, Kimiagar, M, Mehrabi, Y, Azadbakht, L, Hu, FB, and Willett, WC. Dietary patterns and markers of systemic inflammation among Iranian women. J Nutr. (2007) 137:992–8. doi: 10.1093/jn/137.4.992
45. Khayyatzadeh, SS, Bagherniya, M, Fazeli, M, Khorasanchi, Z, Bidokhti, MS, Ahmadinejad, M, et al. A Western dietary pattern is associated with elevated level of high sensitive C-reactive protein among adolescent girls. Eur J Clin Investig. (2018) 48:e12897. doi: 10.1111/eci.12897
46. Schulze, MB, Hoffmann, K, Manson, JAE, Willett, WC, Meigs, JB, Weikert, C, et al. Dietary pattern, inflammation, and incidence of type 2 diabetes in women. Am J Clin Nutr. (2005) 82:675–84. doi: 10.1093/ajcn/82.3.675
47. Mirzababaei, A, Sajjadi, SF, Ghodoosi, N, Pooyan, S, Arghavani, H, Yekaninejad, MS, et al. Relations of major dietary patterns and metabolically unhealthy overweight/obesity phenotypes among Iranian women. Diabetes Metab Syndr Clin Res Rev. (2019) 13:322–31. doi: 10.1016/j.dsx.2018.09.012
48. Mirmiran, P, Hosseini-Esfahanil, F, Jessri, M, Mahan, LK, Shiva, N, and Azizis, F. Does dietary intake by Tehranian adults align with the 2005 dietary guidelines for Americans? Observations from the Tehran lipid and glucose study. J Health Popul Nutr. (2011) 29:39–52. doi: 10.3329/jhpn.v29i1.7564
49. Rezazadeh, A, and Rashidkhani, B. The association of general and central obesity with major dietary patterns of adult women living in Tehran, Iran. J Nutr Sci Vitaminol. (2010) 56:132–8. doi: 10.3177/jnsv.56.132
51. Ghaffarpour, M., Houshiar-Rad, A., and Kianfar, H., The manual for household measures, cooking yields factors and edible portion of foods. 7. Tehran: Nashre Olume Keshavarzy 42–58. (1999).
52. Moubarac, J-C, Parra, DC, Cannon, G, and Monteiro, CA. Food classification systems based on food processing: significance and implications for policies and actions: a systematic literature review and assessment. Curr Obes Rep. (2014) 3:256–72. doi: 10.1007/s13679-014-0092-0
53. Rattanarat, P, Chindapan, N, and Devahastin, S. Comparative evaluation of acrylamide and polycyclic aromatic hydrocarbons contents in Robusta coffee beans roasted by hot air and superheated steam. Food Chem. (2021) 341:128266. doi: 10.1016/j.foodchem.2020.128266
54. Edalati, S, Bagherzadeh, F, Asghari Jafarabadi, M, and Ebrahimi-Mamaghani, M. Higher ultra-processed food intake is associated with higher DNA damage in healthy adolescents. Br J Nutr. (2021) 125:568–76. doi: 10.1017/S0007114520001981
55. Bahrampour, N, Shiraseb, F, Noori, S, Clark, CCT, and Mirzaei, K. Is there any putative mediatory role of inflammatory markers on the association between ultra-processed foods and resting metabolic rate? Front Nutr. (2022) 9:9. doi: 10.3389/fnut.2022.932225
56. Tanabe, N, Saito, K, Yamada, Y, Takasawa, T, Seki, N, and Suzuki, H. Risk assessment by post-challenge plasma glucose, insulin response ratio, and other indices of insulin resistance and/or secretion for predicting the development of type 2 diabetes. Intern Med. (2009) 48:401–9. doi: 10.2169/internalmedicine.48.1325
57. Craig, CL, Marshall, AL, Sjöström, M, Bauman, AE, Booth, ML, Ainsworth, BE, et al. International physical activity questionnaire: 12-country reliability and validity. Med Sci Sports Exerc. (2003) 35:1381–95. doi: 10.1249/01.MSS.0000078924.61453.FB
58. Yu, J-Y, Choi, WJ, Lee, HS, and Lee, JW. Relationship between inflammatory markers and visceral obesity in obese and overweight Korean adults: an observational study. Medicine. (2019) 98:e14740. doi: 10.1097/MD.0000000000014740
59. Mohamadi, A, Shiraseb, F, Mirzababaei, A, Hosseininasab, D, Rasaei, N, Clark, CCT, et al. Circulating inflammatory markers may mediate the relationship between healthy plant-based diet and metabolic phenotype obesity in women: a cross-sectional study. Int J Clin Pract. (2022) 2022:1–12. doi: 10.1155/2022/8099382
60. Hosseininasab, D, Shiraseb, F, Noori, S, Jamili, S, Mazaheri-Eftekhar, F, Dehghan, M, et al. The relationship between ultra-processed food intake and cardiometabolic risk factors in overweight and obese women: a cross-sectional study. Front Nutr. (2022) 9:945591. doi: 10.3389/fnut.2022.945591
61. Lane, MM, Davis, JA, Beattie, S, Gómez-Donoso, C, Loughman, A, O'Neil, A, et al. Ultraprocessed food and chronic noncommunicable diseases: a systematic review and meta-analysis of 43 observational studies. Obes Rev. (2021) 22:e13146. doi: 10.1111/obr.13146
62. Mirmiran, P, Moslehi, N, Hosseinpanah, F, Sarbazi, N, and Azizi, F. Dietary determinants of unhealthy metabolic phenotype in normal weight and overweight/obese adults: results of a prospective study. Int J Food Sci Nutr. (2020) 71:891–901. doi: 10.1080/09637486.2020.1746955
63. Pagliai, G, Dinu, M, Madarena, MP, Bonaccio, M, Iacoviello, L, and Sofi, F. Consumption of ultra-processed foods and health status: a systematic review and meta-analysis. Br J Nutr. (2021) 125:308–18. doi: 10.1017/S0007114520002688
64. Rancière, F, Lyons, JG, Loh, VHY, Botton, J, Galloway, T, Wang, T, et al. Bisphenol a and the risk of cardiometabolic disorders: a systematic review with meta-analysis of the epidemiological evidence. Environ Health. (2015) 14:1–23. doi: 10.1186/s12940-015-0036-5
65. Steele, EM, Juul, F, Neri, D, Rauber, F, and Monteiro, CA. Dietary share of ultra-processed foods and metabolic syndrome in the US adult population. Prev Med. (2019) 125:40–8. doi: 10.1016/j.ypmed.2019.05.004
66. Chassaing, B, Koren, O, Goodrich, JK, Poole, AC, Srinivasan, S, Ley, RE, et al. Dietary emulsifiers impact the mouse gut microbiota promoting colitis and metabolic syndrome. Nature. (2015) 519:92–6. doi: 10.1038/nature14232
67. Martino, JV, Van Limbergen, J, and Cahill, LE. The role of carrageenan and carboxymethylcellulose in the development of intestinal inflammation. Front Pediatr. (2017) 5:96. doi: 10.3389/fped.2017.00096
68. Buckley, JP, Kim, H, Wong, E, and Rebholz, CM. Ultra-processed food consumption and exposure to phthalates and bisphenols in the US National Health and nutrition examination survey, 2013–2014. Environ Int. (2019) 131:105057. doi: 10.1016/j.envint.2019.105057
69. Vafeiadi, M, Myridakis, A, Roumeliotaki, T, Margetaki, K, Chalkiadaki, G, Dermitzaki, E, et al. Association of early life exposure to phthalates with obesity and cardiometabolic traits in childhood: sex specific associations. Front Public Health. (2018) 6:327. doi: 10.3389/fpubh.2018.00327
70. Hall, KD, Ayuketah, A, Brychta, R, Cai, H, Cassimatis, T, Chen, KY, et al. Ultra-processed diets cause excess calorie intake and weight gain: an inpatient randomized controlled trial of ad libitum food intake. Cell Metab. (2019) 30:67–77.e3. e3. doi: 10.1016/j.cmet.2019.05.008
71. Bhattacharyya, S, Feferman, L, and Tobacman, JK. Carrageenan inhibits insulin signaling through GRB10-mediated decrease in Tyr (P)-IRS1 and through inflammation-induced increase in Ser (P) 307-IRS1. J Biol Chem. (2015) 290:10764–74. doi: 10.1074/jbc.M114.630053
72. Bhattacharyya, S, O-Sullivan, I, Katyal, S, Unterman, T, and Tobacman, JK. Exposure to the common food additive carrageenan leads to glucose intolerance, insulin resistance and inhibition of insulin signalling in HepG2 cells and C57BL/6J mice. Diabetologia. (2012) 55:194–203. doi: 10.1007/s00125-011-2333-z
73. Kahn, SE, Hull, RL, and Utzschneider, KM. Mechanisms linking obesity to insulin resistance and type 2 diabetes. Nature. (2006) 444:840–6. doi: 10.1038/nature05482
74. Roca-Saavedra, P, Mendez-Vilabrille, V, Miranda, JM, Nebot, C, Cardelle-Cobas, A, Franco, CM, et al. Food additives, contaminants and other minor components: effects on human gut microbiota—a review. J Physiol Biochem. (2018) 74:69–83. doi: 10.1007/s13105-017-0564-2
75. Shim, J-S, Oh, K, and Kim, HC. Dietary assessment methods in epidemiologic studies. Epidemiol Health. (2014) 36:36. doi: 10.4178/epih/e2014009
Glossary
Keywords: inflammatory markers, metabolic healthy and unhealthy women, NOVA classification system, phenotypes, ultra-processed foods
Citation: Hajmir MM, Shiraseb F, Hosseininasab D, Aali Y, Hosseini S and Mirzaei K (2023) The mediatory role of inflammatory markers on the relationship between the NOVA classification system and obesity phenotypes among obese and overweight adult women: a cross-sectional study. Front. Nutr. 10:1226162. doi: 10.3389/fnut.2023.1226162
Edited by:
Costanza Maria Cristiani, University of Magna Graecia, ItalyReviewed by:
Mohammad Ali Mohsenpour, Shiraz University of Medical Sciences, IranLaura Della Torre, University of Campania Luigi Vanvitelli, Italy
Copyright © 2023 Hajmir, Shiraseb, Hosseininasab, Aali, Hosseini and Mirzaei. This is an open-access article distributed under the terms of the Creative Commons Attribution License (CC BY). The use, distribution or reproduction in other forums is permitted, provided the original author(s) and the copyright owner(s) are credited and that the original publication in this journal is cited, in accordance with accepted academic practice. No use, distribution or reproduction is permitted which does not comply with these terms.
*Correspondence: Khadijeh Mirzaei, bWlyemFlaV9raEBzaW5hLnR1bXMuYWMuaXI=