 Meiqing Chen1,2Fengen Wang3Xufang Wu1,2Boxue Si1,2Junyu Pan1,2
 Nan Zheng1,2
 Yangdong Zhang1,2*
 Jiaqi Wang1,2*
- 1Key Laboratory of Quality and Safety Control for Milk and Dairy Products of Ministry of Agriculture and Rural Affairs, Institute of Animal Sciences, Chinese Academy of Agricultural Sciences, Beijing, China
- 2Milk and Milk Products Inspection Center of Ministry of Agriculture and Rural Affairs, Institute of Animal Sciences, Chinese Academy of Agricultural Sciences, Beijing, China
- 3Institute of Quality Standard and Testing Technology for Agro-Products, Shandong Academy of Agricultural Sciences, Jinan, China
The importance of food components to potential benefits and risks to human health is gradually being consumer awareness. Milk is an important part of the lipid content of the human diet, and there are few detailed reports on the fatty acid (FA) profiles of retail milk. In the study, we developed a gas chromatography–mass spectrometry (GC-MS) method to simultaneously determine 82 FAs, including 11 even-chain saturated FAs, 10 odd-chain saturated FAs, 9 branched-chain saturated FAs, 30 monounsaturated FAs, and 22 polyunsaturated FAs; this was applied to analyze samples (186 samples) of commercially available milk from 22 provinces throughout China and to evaluate the nutritional value of these samples based on FA-related indices. The results showed that the overall composition of milk FAs among the different regions was numerically similar, and minor FAs showed few differences. When considering the retail milk FA composition and dairy fat intake in China, regional variations have a limited impact on FA consumption. Moreover, milk accounts for approximately one-third and <10% of the maximum recommended intake of saturated FAs and trans-FAs in consumer diets, respectively. This study provides an updated report on the composition of FAs and the nutritional value of retail milk across China, which can serve as a reference for producers for future research on regulating milk FAs, for consumers to select milk, and for nutrition departments to formulate relevant nutritional guidance recommendations.
1. Introduction
Milk, which is rich in several essential nutrients such as fat, protein, and minerals, is an important source of bioactive natural ingredients (1). Milk has gradually become an indispensable food in the daily diet of humans, with annual per capita consumption of dairy products increasing by 36.3% in the past decade in China, from 31.1 to 42.3 kg (2). Fatty acids (FAs) are important components of milk fat and are linked to various potential benefits and risks to human health. Previous studies have shown that unsaturated fatty acids (UFAs) reduce hypercholesterolemia and the risk of cardiovascular diseases (CVD), whereas saturated fatty acids (SFAs) and trans-FAs (TFAs) have opposite effects (3–5). Milk typically contains a high proportion of SFAs. However, not all SFAs are equal, and they can negatively affect human health. Recent scientific studies have reported that odd- and branched-chain fatty acids (OBCFA) have positive effects on CVD, cancer, obesity, and inflammation, although they are a category of SFA (6). Ruminant TFA-like vaccenic acid was not associated with an increased risk of CVD. Milk is the only source of unique rumen microorganism-synthesized FAs such as OBCFA and vaccenic acid (VA, C18:1 t11). Moreover, milk contains UFAs, such as conjugated linoleic acid (LA), omega-3 (n-3) UFA, omega-6 (n-6) UFA, and omega-7 (n-7) UFA, which have been shown to provide potential benefits, including CVD prevention and anti-cancer, anti-inflammatory, and anti-oxidative effects (7–9). Since FAs with structural differences present distinct effects on biological functions, it may be more important to pay attention to the health benefits of individual FAs compared to FA groups. Therefore, it is imperative to comprehensively characterize the FA composition of milk to evaluate its nutritional health effects.
Over 400 FAs are thought to be present in bovine milk (10); however, most FAs, especially those in low abundance, have not been quantified in the previous report (11). For example, in the face of the prevalent co-elution of complex geometric and positional isomers of UFA in milk, we were unable to determine whether C18:1 UFA isomer or C18:2 UFA isomer co-eluted with other FAs in milk (12). Owing to the high complexity of FAs in species and their abundance, the simultaneous determination of multiple components is a challenge (13). For FA determination, it is a common practice to convert FAs to methyl ester (FAME) using methanol, which is then analyzed using a gas chromatograph (GC) equipped with a flame ionization detector (FID) or mass spectrometry (MS). With an FID, the identification and quantification of low-abundance and co-eluted FAs from chromatogram peaks are challenging. In contrast, MS has better selectivity and sensitivity for monitoring specific ions, as well as good accuracy for FA determination. Several reports have discussed the significant improvements in the development of a high-throughput method for the determination of milk FAs by MS (14–16); ~70 FAs except the co-eluted octadecenoic acid were accurately quantified by Wang et al. (17). Focusing on the challenge of effective identification of FAs, appropriate chromatographic procedures must be selected to achieve effective chromatographic separation of as many analytes as possible according to their properties (18). For the accurate quantification of FAs, appropriate derivatization treatments must be selected to improve the response of the analytes. Hence, it is necessary to improve the resolution and sensitivity of detection to establish a high-throughput FA analysis method, which is conducive to the comprehensive characterization of milk FA composition.
Our current study showed that it is challenging for consumers to comprehend the relevance of milk FA composition to human health because they know little about how milk is produced and do not understand the significance of milk FA profile. For FA profiles to be easier to understand, researchers have proposed FA indices such as the atherogenic index (AI) and thrombogenic index (TI), which assess the effects of food on cardiovascular health (CVH) and quantify the relevance of FA composition to human health (19, 20). Moreover, the assessment of dietary intake, including FA intake, is an important tool for monitoring the nutritional status of a population. Current nutritional recommendations suggest limiting the SFA and TFA consumption to <10 and 1% of energy intake, respectively, and increasing the dietary UFA consumption as much as possible (21). The composition of milk in retail markets across the United States (18), United Kingdom (22), and Korea (23) has been systematically researched, whereas few studies have been conducted in China. Previous studies have shown that milk FA profiles may vary greatly among countries and regions. Therefore, it is necessary to set the appropriate dietary intake of people in one's own country or region according to the assessment of milk FA composition.
Limited information is available on the relevance of FA profile to nutritional value in retail milk surveys across China, which may affect consumer decisions and human health. Therefore, the aims of this study were to (i) comprehensively characterize the FA composition of retail milk across China using an improved high-throughput FA determination method and (ii) evaluate the potential nutritional implications of FA indices of retail milk and FA intake.
2. Materials and methods
2.1. Milk samples
Milk samples (n = 186) were collected from supermarkets in four regions (Northeast China and Inner Mongolia, North China, Northwest China, and South China) throughout China in 2021, which included 44 brands and 22 provinces (Supplementary Table S1). The samples were whole and pasteurized bovine milk and were stored at −20°C after collection until analysis. In addition, skim milk powder from local markets was used in the recovery experiments for method validation.
2.2. Chemicals and reagents
High-performance liquid chromatography-grade n-hexane, methanol, and isopropanol were obtained from Fisher Scientific (Fair Lawn, NJ, USA). NaOH (purity ≥95%), anhydrous sodium sulfate (purity ≥99%), and acetyl chloride (purity >99.5%) were from Macklin (Shanghai, China). Ultrapure water was obtained using a Milli-Q purification system (Millipore, Bedford, MA, USA).
The following standards were used: FA solution GLC 617 (Anpel, Shanghai, China) and FAME solution GLC 674 (Nu-Chek Prep, Inc., Elysian, MN, USA); 6 iso-FAME and 3 anteiso-FAME individual standards were obtained from Larodan (Malmo, Sweden). The C22:3 c13c16c19 FAME individual standard and C17:0 ethyl ester (C17:0 EE) used as internal standards (IS) were obtained from AccuStandard (New Haven, Connecticut, USA). The individual standards of C18:1 c12, C18:4 c6c9c12c15, C19:1 c10, and C20:1 c8 FAMEs, as well as C18:2 c9c11 and C18:2 t9t11 FA individual standards, were obtained from Cayman (Ann Arbor, Michigan, USA). The C5:0, C7:0, C9:0, and C19:0 FAME individual standards were obtained from Dr. Ehrenstorfer (Augsburg, Germany). The C10:1 c3, C10:1 c4, C10:1 c9, C12:1 c5, C12:1 c11, and C16:1 c7 FA individual standards were obtained from Macklin (Shanghai, China). Linoleic acid methyl ester mix Certified Reference Material 47791 and C18:2 c9t11 and C18:2 t10t12 FA individual standards were purchased from Sigma-Aldrich (St. Louis, MO, USA). The triacylglycerol (TAG) individual standard of C11:0 was obtained from Nu-Check Prep (Elysian, MN, USA).
2.3. Sample pretreatment
Based on our previous study, a sample pretreatment procedure was developed, including the extraction of lipids from milk and the conversion of FA into FAME (17, 24). Frozen milk samples were first pre-warmed at 40°C in a water bath and then shaken carefully to homogenize them. To extract milk lipids, 2 ml milk samples were mixed with 4 ml of a solution of n-hexane/isopropanol (v/v, 3/2), vortexed, and centrifuged. The upper n-hexane was collected, followed by another extraction with n-hexane, and all of the extracted upper n-hexane were collected and mixed together. Combined n-hexane was mixed with 2 ml solution of methanolic NaOH (2%) with heating at 50°C for 20 min, followed by 2 ml solution of acetyl chlorocarbinol (10%) with heating at 90°C for 150 min for methylation. After cooling to room temperature, 5 ml of ultrapure water was added to the mixture. The upper n-hexane phase was then extracted and diluted. Anhydrous sodium sulfate (0.5 g) was then added, and the mixture was vortexed for 30 s for further dewatering. The supernatant was mixed with an internal standard, diluted with n-hexane, and subsequently analyzed using gas chromatography–mass spectrometry (GC-MS).
2.4. GC-MS analysis
Analyses of FAMEs were performed using an Agilent 7890A GC equipped with a 7000 B MS detector system (Agilent Technologies, Santa Clara, California, USA). FAMEs were separated using an Agilent capillary column CP-Sil 88 (100 m × 0.25 mm × 0.20 μm). The proposed method was improved using an applicable GC oven program (Table 1) and by performing in the selected ion monitoring (SIM) mode with 19-time windows (Table 2). Four characteristic ions were selected for the qualification and quantification of each analyte and IS, and the lowest signal-to-noise ratio (S/N) was designated as the quantitative ion. Qualitative analysis of individual FAME in milk samples was performed by comparing their retention times and characteristic ions with those of the corresponding FAME standards. Quantitative analysis of individual FAME was carried out by external standard calculation and IS calibration, that is, using IS calibration, the value of the curve regression equation for each FAME standard was calculated. The FA values were calculated using the stoichiometric factors for the conversion of FAME into FA. The FA composition results are expressed as g/100 g FA.
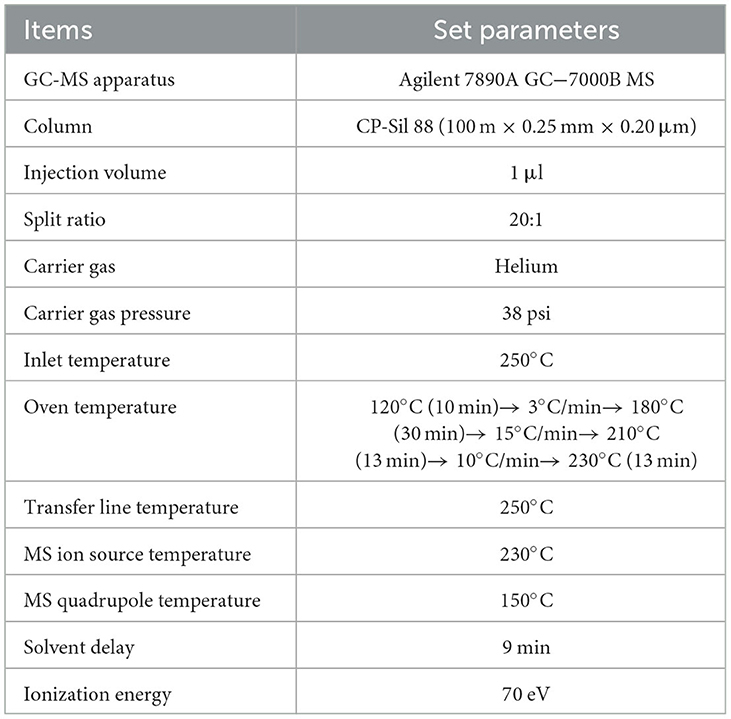
Table 1. GC-MS parameters of the proposed method for determination of 82 fatty acid methyl ester.
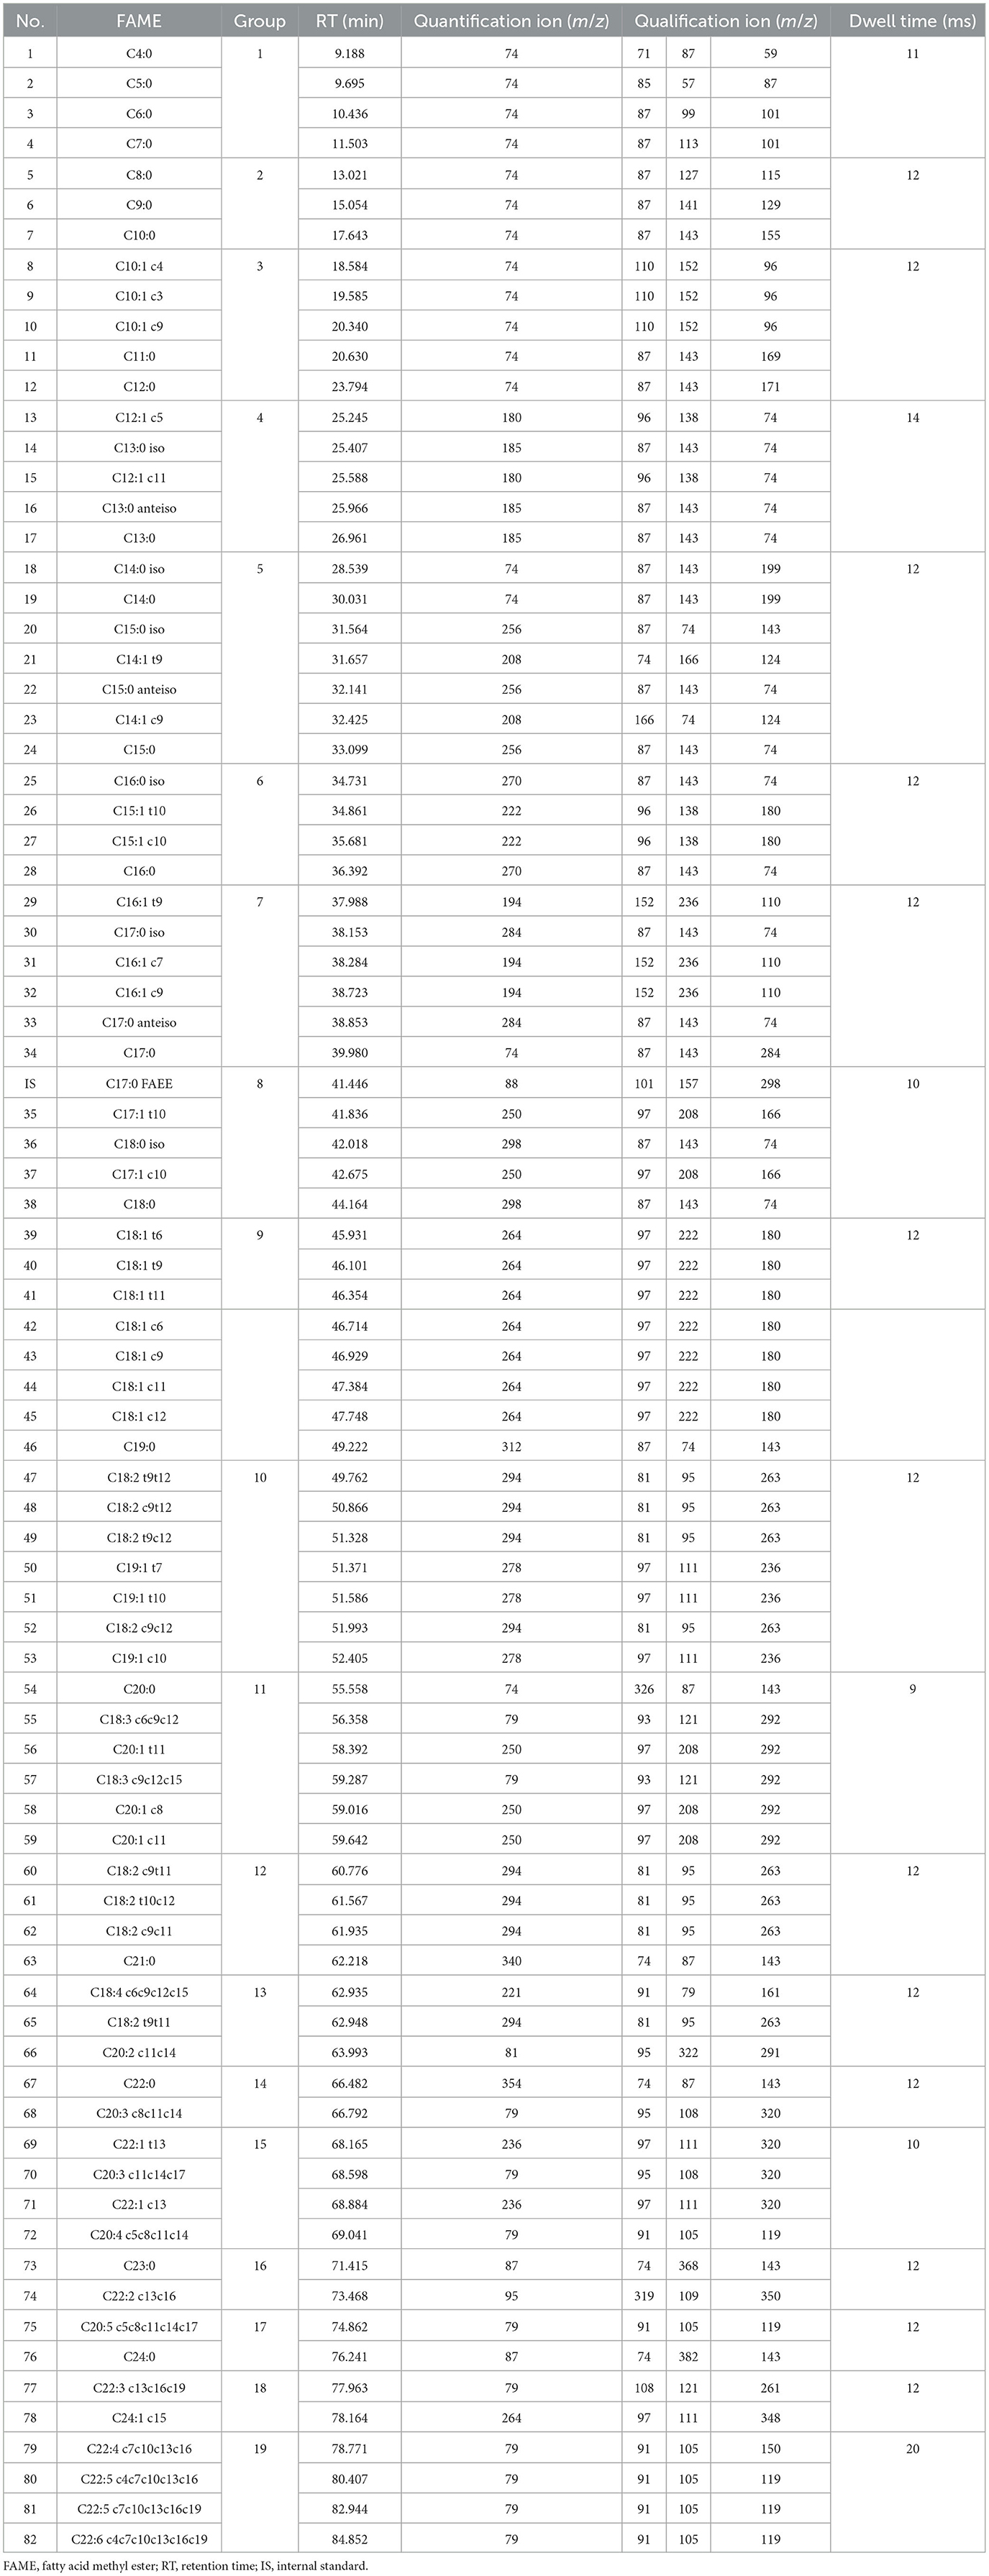
Table 2. MS SIM parameters of the proposed method for determination of 82 fatty acid methyl ester.
2.5. Method validation
Sensitivity, linearity, accuracy, and precision were involved in validating the method (25). Sensitivity was calculated from the concentration with an S/N ratio of 10 and expressed as the limit of quantitation (LOQ) (15). Linearity was assessed using the coefficient of determination (R2) of the standard curves of each FAME at five different concentration levels (concentration ratio between FAME and IS vs. the peak area ratio). Recovery experiments were spiked with three different concentrations of FA solution (GLC 617) and triacylglycerol (C11:0) in a solution of skim milk powder, and the results were used to demonstrate the accuracy. The intra- and inter-day precisions were determined by testing six parallel samples three times within a day and once a day for three consecutive days, respectively.
2.6. Statistical analysis
The peak areas were obtained using the Agilent MassHunter Workstation (Agilent Technologies, Santa Clara, California, USA). The results were preliminarily sorted using Microsoft Excel 2019. Before significance analysis, the Kolmogorov–Smirnov test was applied to determine whether the results coincided with the normal distribution obtained using the univariate procedure in SAS 9.4. The Kruskal–Wallis test was performed on the FA data that did not comply with the normal distribution using the NPAR1WAY procedure in SAS 9.4. Multiple comparisons were performed on the transformed RANK of the original data with Duncan's method using the generalized linear model (GLM) procedure in SAS 9.4. A P-value of < 0.05 was considered statistically significant.
Some FA indices, such as n-6/n-3 polyunsaturated fatty acid (PUFA), PUFA/SFA ratio (P/S), AI, TI, health-promoting index (HPI), and hypo/hypercholesterolemic ratio (h/H), were calculated as described previously (20), as follows:
To calculate the FA intake from retail milk, we assumed that the FA composition of all dairy products produced in China was consistent with that of the milk samples analyzed in this study. The FA intake via retail milk consumption was estimated (26, 27) as follows:
FA intake (mg/d) = 300 (milk intake, g/d) × 1, 000 × 3.8 (contribution of fat from whole milk, %) ÷100 × 93.3 (the proportion of FA in milk fat, %) ÷100 × milk FA concentration (the proportion of FA in total FA, %) ÷100.
3. Results and discussion
3.1. Method optimization
Using the proposed method, 82 FAs were detected simultaneously by chromatographic and spectrographic optimization, including 11 ECSFAs, 10 OCSFAs, nine BCSFAs, 30 MUFAs, and 22 PUFAs (Figure 1).
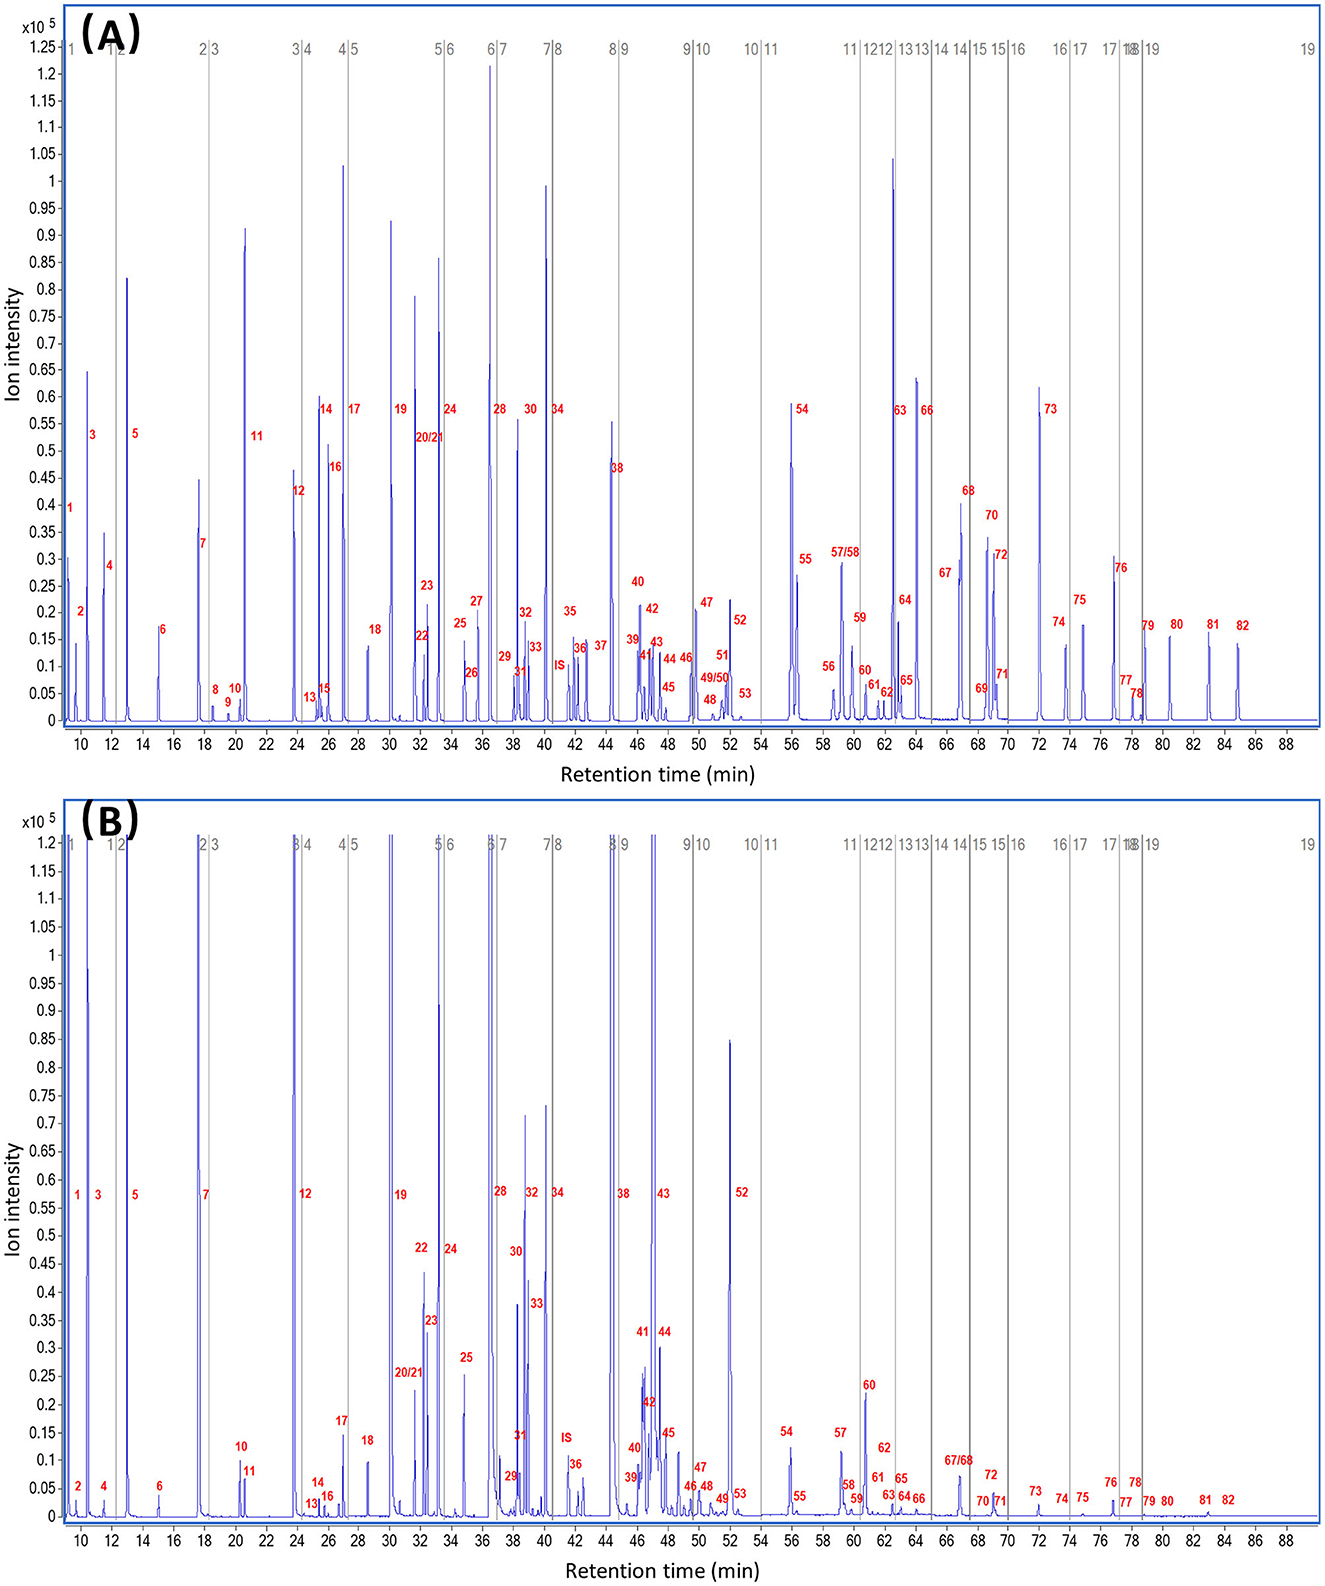
Figure 1. Total ion chromatogram of fatty acid methyl ester by GC-MS. (A) 82 fatty acid methyl ester standards. (B) Fatty acid methyl ester from raw cow milk. The number of fatty acid methyl ester in Table 2 is labeled on the peaks.
Regarding chromatographic separation, the capillary column and oven temperature program were optimized by virtue of the differences in boiling point and polarity among the abovementioned FAs. Several capillary columns, including DB-WAX and CP-Sil 88, were attempted, and most of the FAME peaks presented less co-elution, excellent peak symmetry, and rational retention times on the CP-Sil 88 column; therefore, we selected it for further study. It was noticed that an oven temperature of ~180°C gave better resolution among FAMEs with <C18, and an oven temperature of ~210°C gave better resolution among FAMEs with >C18. Separation behaviors of cis- and trans-isomers of C18:1 are greatly affected by column and oven temperatures (28, 29). Thus, the column temperature was divided into three temperature change stages by setting an appropriate rate of increase in the oven temperature to achieve baseline separation of most FAMEs in the total ion chromatogram (TIC; Figure 1). Three types of co-elution problems were observed in the TIC which made the quantification of co-eluted FA almost impossible without the SIM mode. (i) the co-elution of methyl BCFA and MUFA, as shown in Figures 2A, B; (ii) the co-elution of methyl MUFA and PUFA, as shown in Figures 2C–F; (iii) the co-elution of methyl PUFA and SFA, as shown in Figure 2E. In previous reports, the problem of co-elution is common in the analysis of fatty acids by gas chromatography, including the interference of methyl BCFA and MUFA and the co-elutions of cis- and trans-isomers of both C16:1 and C18:1 (12, 30). To eliminate interference between the peaks of partial and complete co-elution, we analyzed the characteristics of the unique fragment ions of these co-elutions using SIM (14). Identification and quantification were based on the SIM mode shown in Table 2. For example, C15:0 iso methyl and C14:1 t9 methyl co-eluted in the TIC and were distinguished by specific fragment ions at 256 and 208 m/z, respectively, in the extracted ion chromatogram, which provided good resolution (Figure 2A). Similarly, the SIM parameters for the analysis of other co-eluted FAMEs in the TIC were also optimized (Figures 2A–F).
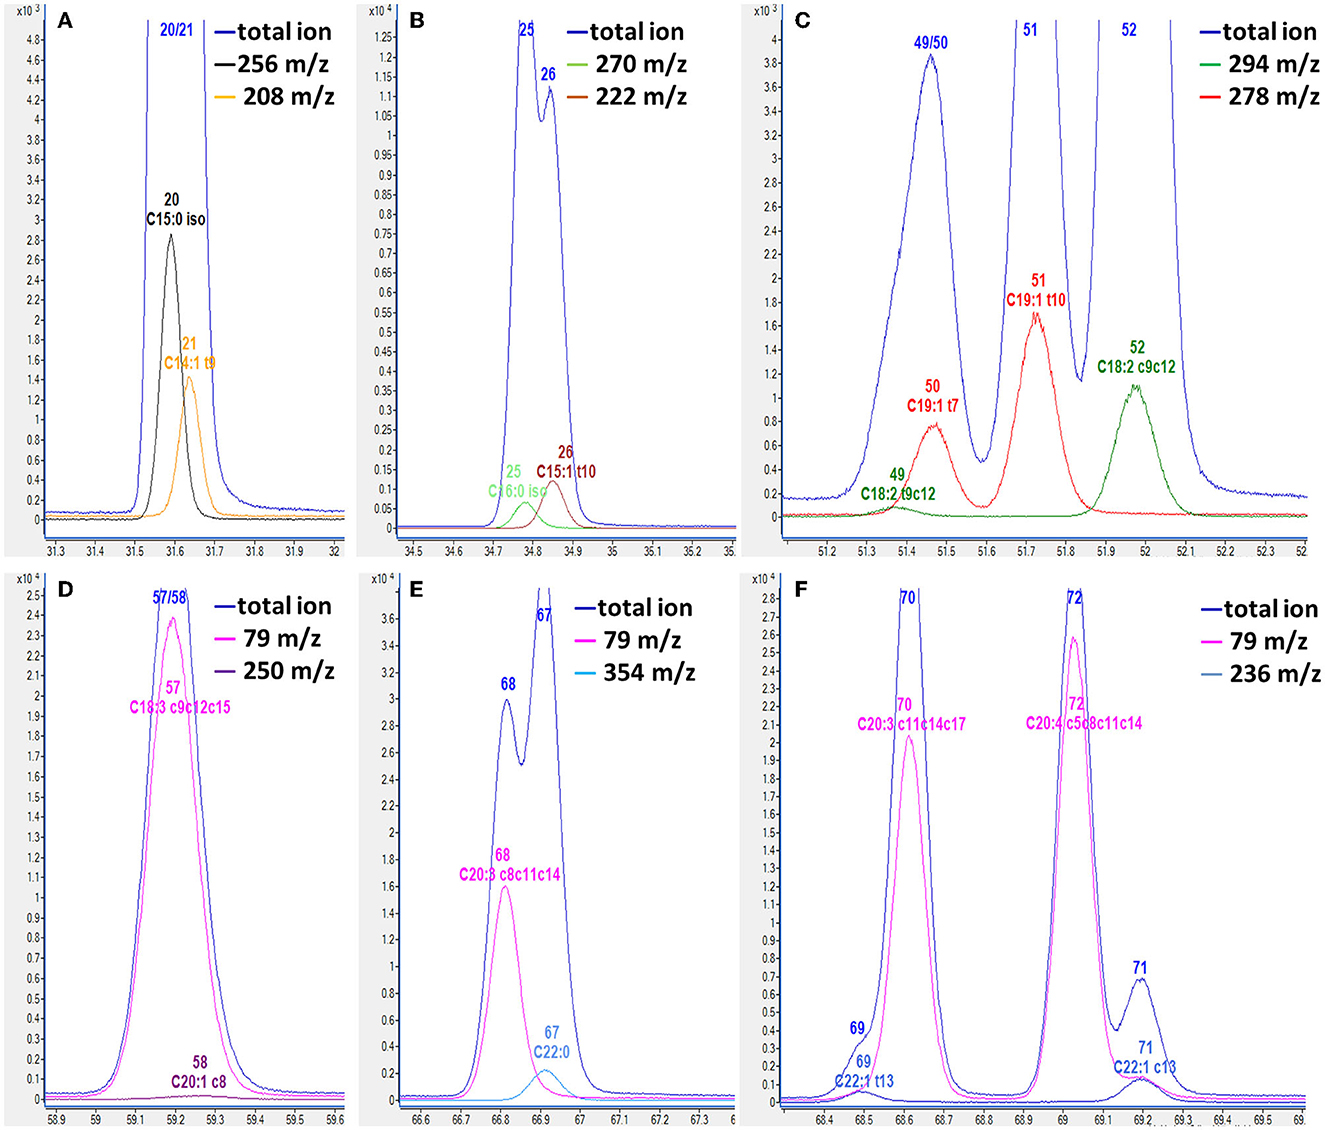
Figure 2. Overlapped chromatogram of total selected ion and individual selected ion of fatty acid methyl ester by GC-MS. (A) C15:0 iso and C14:1 t9; (B) C16:0 iso and C15:1 t10; (C) C18:2 t9c12 and C19:1 t7; (D) C18:3 c9c12c15 and C20:1 c8; (E) C22:0 and C20:3 c8c11c14; (F) C22:1 t13 and C20:3 c11c14c17, C22:1 c13 and C20:4 c5c8c11c14. The number of fatty acid methyl ester in Table 2 is labeled on the peaks.
The results of the method validation are shown in Supplementary Tables S2, S3. The limit of quantitation (LOQ) of FAMEs ranged from 1.9 to 990.1 μg/L corresponding to 0.0439 μg/ml to 23.6832 μg/ml of FAs from milk samples. The regression equations of all the FAME standard curves covered a sufficiently wide linear quantitative range, with determination coefficients >0.9991. Recoveries of FAs ranged from 81.4 to 108.3%, while those of TAGs were 101.9 to 106.3%. Intra-day and inter-day relative standard deviations (RSDs) were <5.0% based on the determined FAs in the milk samples.
In general, method optimization involves the choice of polar column, column temperature program, and characteristic ions that influence separation efficiency along with the accurate determination of all FAs from bovine milk samples, particularly UFAs that have received little or no attention in the FA analyses, including n-1, n-3, n-5, n-6, n-7, n-9, and n-12 UFAs. Method validation showed that the proposed method presented competitive sensitivity, suitable linearity, acceptable accuracy, and precision for the determination of milk FAs. Thus, a high-throughput GC-MS method was applied to determine milk FAs, with good separation in the chromatogram and good resolution in the SIM mode, which is the basis of a comprehensive understanding of milk FA composition.
3.2. Milk FA profiles
The FA profiles of bovine retail milk from China are shown in Figure 3. The ratio of SFA to UFA in retail milk in China is ~7:3 (Figure 3A). Previous studies have reported that the ratio of SFA and UFA in bovine retail milk in the United Kingdom ranged from 73:27 to 68:32 (22, 31), while the ratio in the United States ranged from 70:30 to 68:32 (18). This is inconsistent with our findings because FA composition is affected by many factors, including diet and season (32, 33). In addition, some studies did not consider as many FAs as possible and only included the high content ones in the analysis; therefore, the results of these studies were biased compared to our results. In addition to the major ECSFAs, OCSFA, and BCSFA are important components of milk SFAs. C14:0, C16:0, and C18:0 were the most abundant ECSFAs, whereas C15 and C17 FAs with straight and branched chains were the most abundant OCSFAs (Figure 3B). This observation is consistent with that of other studies and is mainly determined by the synthesis of milk FAs in dairy cows, primarily from the de novo synthesis of FAs with carbon chain length <C16 and the intake of FAs with carbon chain length >C16 from the blood in the mammary glands (34, 35). n-9, n-6, and n-7 UFAs were the main components of milk UFAs, whereas other UFAs were relatively minor, accounting for <1% of the total FAs (Figure 3A). In our study, oleic acid (OA, C18:1 c9) was the most dominant n-9 UFA in milk, accounting for 96% of the total n-9 UFAs. LA and C18:2 c12 were the main n-6 UFAs in milk, accounting for ~60 and 13% of the total n-6 UFAs, respectively. Alpha-linolenic acid (ALA, C18:3 c9c12c15), docosapentaenoic acid n-3 (DPA n-3, C22:5 c7c10c13c16c19), eicosapentaenoic acid (EPA, C20:5 c5c8c11c14c17), and eicosatrienoic acid (ETA, C20:3 c11c14c17) were the main n-3 UFAs in milk, accounting for 49%, 18%, 16%, and 10% of the total n-3 UFA, respectively. This is because LA (C18:2 c9c12) and ALA are the precursors of n-6 UFA and n-3 UFA synthesis, respectively, in dairy cows, and these precursors synthesize the corresponding UFAs through carbon chain elongation and desaturation (36). In addition, we found that C10:1 c9 was the only n-1 UFA in milk, and C14:1 c9, C16:1 c9, and C18:1 c6 were the main n-5, n-7, and n-12 UFAs in milk, respectively. Previous studies have reported the functions of n-9, n-6, and n-3 UFAs; therefore, the content of these UFAs in milk has been widely studied. The results of our study provide information on the content of other minor UFAs in milk, which could provide reference data for subsequent research on the function of milk FAs.
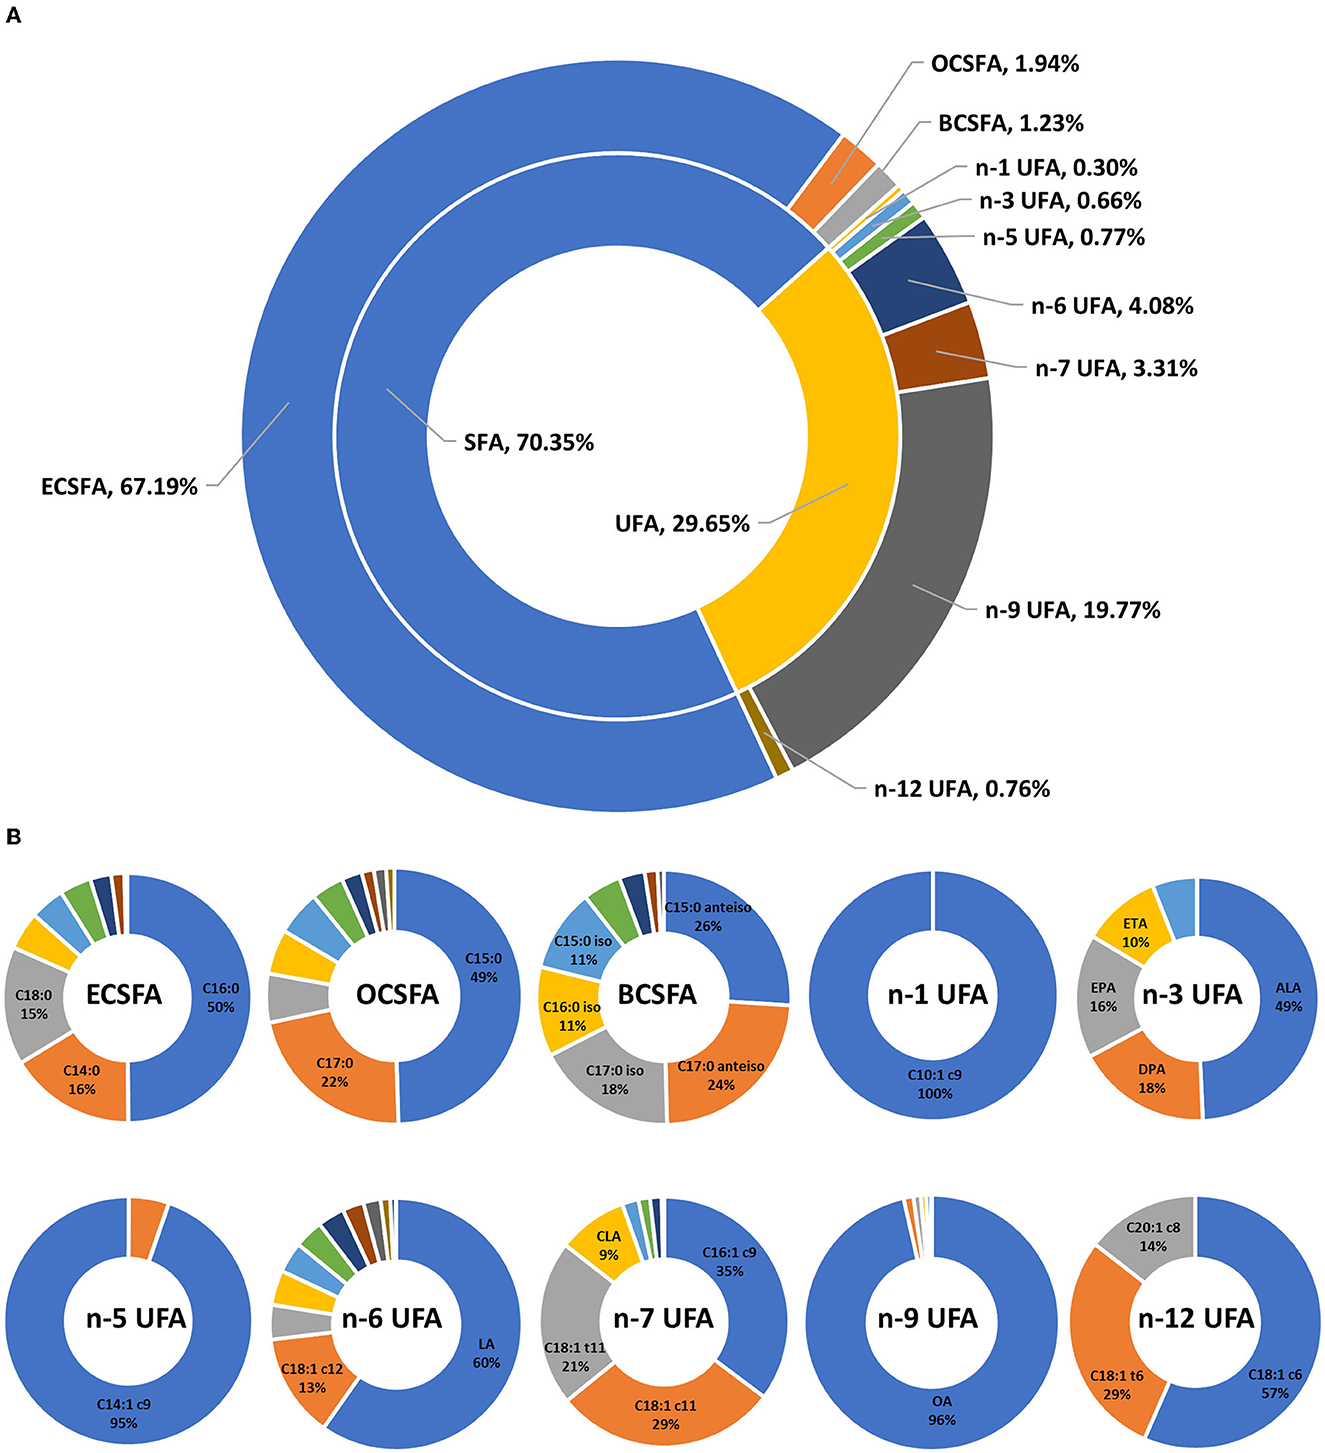
Figure 3. Fatty acid profiles of bovine retail milk in China. (A) Contribution (%) of each fatty acid group to total fatty acid of milk. (B) Contribution (%) of individual fatty acid to total corresponding fatty acid group of milk. SFA, saturated fatty acid, C4:0–C24:0 (including iso and anteiso). ECSFA, even-chain saturated fatty acid, C4:0–C24:0. OCSFA, odd-chain saturated fatty acid, C5:0–C23:0. BCSFA, branched-chain saturated fatty acid, C13:0–C18:0 iso and anteiso. UFA, unsaturated fatty acid, C10:1–C22:6. n-1 UFA, omega-1 unsaturated fatty acid, contains one or more than one carbon-to-carbon double bond with the first double bond placed on the first carbon atoms counting from the methyl end. n-3 UFA, omega-3 unsaturated fatty acid. n-5 UFA, omega-5 unsaturated fatty acid. n-6 UFA, omega-6 unsaturated fatty acid. n-7 UFA, omega-7 unsaturated fatty acid. n-9 UFA, omega-9 unsaturated fatty acid. n-12 UFA, omega-12 unsaturated fatty acid. OA, C18:1 c9. LA, linoleic acid, C18:2 c9c12. CLA, conjugated linoleic acid, C18:2 c9t11. ALA, α-linolenic acid, C18:3 c9c12c15. ETA, eicosatrienoic acid, C20:3 c11c14c17. EPA, eicosapentaenoic acid, C20:5 c5c8c11c14c17. DPA, docosapentaenoic acid, C22:5 c7c10c13c16c19. DHA, docosahexaenoic acid, C22:6 c4c7c10c13c16c19.
The FA composition of retail milk across four regions of China is presented in Table 3. Statistical differences were observed in the concentrations of some individual FAs for different geographic regions, including C4:0, C15:0, C15:0 anteiso, VA, LA, conjugated linoleic acid n-7 (CLA n-7, C18:2 c9t11), ALA, arachidonic acid (ARA, C20:4 c5c8c11c14), and FAs (including OCSFA, BCSFA, n-6 PUFA, n-1 UFA, n-5 UFA, n-6 UFA, n-7 UFA, and n-12 UFA). There were no significant differences in the concentrations of individual FAs, including C16:0, C18:1 c9, n-3 UFA, EPA, DPA, DPA n-6, and FA, including SFA, MUFA, and PUFA. Differences in rumen fermentation due to the diet and management of dairy cows may partly explain the inconsistent content of the abovementioned OBCFA and UFA among the regions (37, 38). In this study, where milk was collected at the retail level, it was not possible to collect detailed information at the farm level, and, therefore, we cannot provide a more detailed explanation of the subtle variations in some FAs. In general, although the minor FAs showed numerically smaller significant differences among the regions, the major FAs mostly showed no significant differences. Thus, the overall composition of milk FAs among different regions was numerically similar, and the minor FAs showed little difference.
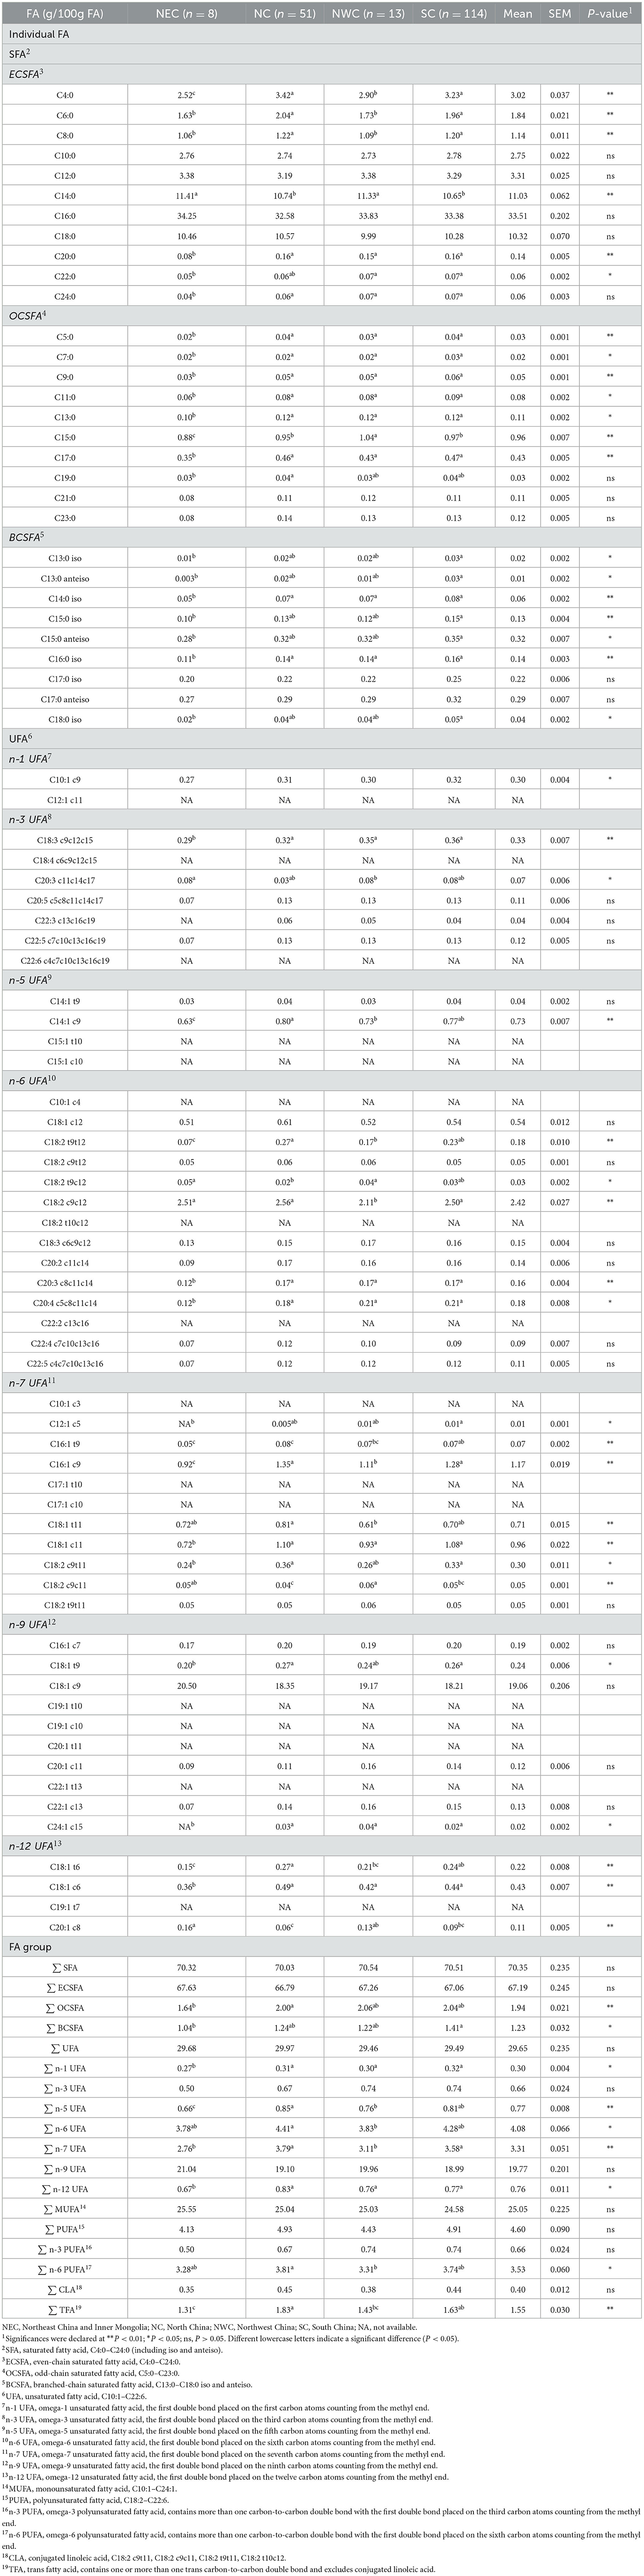
Table 3. Regional variation in the fatty acid composition of retail milk samples.
3.3. Milk fatty acid nutritional quality indexes
Some FA indexes have been used to evaluate the nutritional quality of milk and are listed in Table 4.
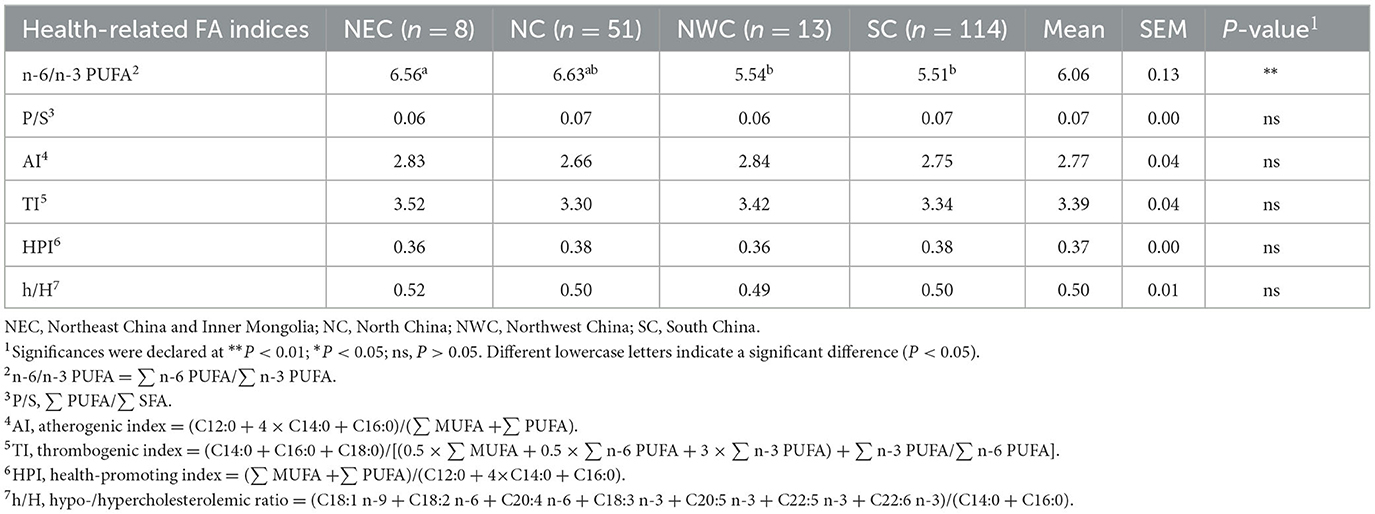
Table 4. Nutritional indices for assessing fatty acids quality of retail milk samples.
n-6 and n-3 PUFAs induce proinflammatory and anti-inflammatory responses, respectively, and their ratios are related to a balanced diet (39–41). A balanced n-6/n-3 PUFA ratio allows for progressive brain, eyes, and heart development while reducing the risk of coronary heart disease and neurodegenerative disorders (42, 43). In the study, the n-6/n-3 PUFA content of milk in Northwest and South China was lower than that of milk from other regions. The decreased ratio indicated a desirable alteration between regional milk and benefited adults. To enable proper neuronal development and prevent most chronic disorders, a 1 or 2 n-6/n-3 PUFA ratio should be maintained (44, 45). In this study, the n-6/n-3 PUFA ratio of milk in different regions is 5.51–6.63, which is still a certain distance from the recommended balanced n-6/n-3 PUFA ratio, thus, further regulation of this composition is needed.
The P/S ratio is commonly used to assess the effect of dietary FA on CVH. The index is based on the research that dietary PUFAs are associated with decreased serum cholesterol and low-density lipoprotein content, while dietary SFAs are associated with increased serum cholesterol content (46). Therefore, the higher the P/S ratio, the more significant the inhibitory effect on the increase of blood cholesterol, and the more beneficial to cardiovascular health. In this study, there was no significant difference in the P/S ratio of milk from different regions, indicating that milk intake from different regions had no significant effect on CVH. The P/S ratio of milk ranged from 0.02 to 0.07 previously reported in the literature (22, 47). Our results were within the expected range of P/S index values, ranging from 0.06 to 0.07.
AI index characterized the atherogenic potential of dietary FA. The index shows the correlation between the pro-atherogenic FA (C12:0, C14:0, and C16:0) and the anti-atherogenic FA (UFA) (48). Thus, the lower the values of AI, the greater the proportion of anti-atherogenic fatty acids present in milk, and the more conducive to the maintenance of CVH. In this study, there was no significant difference in the values of AI of milk from different regions, indicating that intake of milk from different regions had no significant effect on the anti-atherosclerosis effect. The values of the AI index ranged from 1.37 to 5.13 reported in the previous literature (47, 49). Our results were within the expected range of AI index values, ranging from 2.66 to 2.84.
TI index was used to evaluate the tendency of dietary FA to thrombosis in blood vessels. This index is defined as the relationship between the pro-thrombotic FA (C12:0, C14:0, and C16:0) and the anti-thrombotic FA (MUFA, n-3 PUFA, and n-6 PUFA) (48). Specifically, the lower the values of the TI index, the greater the anti-thrombotic effect, and the better for CVH. In this study, there was no significant difference in the TI of milk from different regions, indicating that intake of milk from different regions had no significant effect on the anti-thrombosis effect. The values of the TI index ranged from 2.23 to 4.03 reported in the previous literature (50). Our results were within the expected range of AI index values, ranging from 3.30 to 3.52.
h/H ratio was commonly used to assess the cholesterolemic effect of dietary FA. The index is based on the research that dietary C18:1 and PUFA are associated with decreased serum cholesterol content, while dietary C12:0, C14:0, and C16:0 are associated with increased serum cholesterol content (51). Therefore, nutritionally speaking, the higher the h/H ratio, the more obvious the effect of inhibiting the increase of serum cholesterol content, and the more beneficial to CVH. In this study, there was no significant difference in the h/H ratio among the different regional milk samples, indicating that milk intake from different regions had no significant effect on human cholesterol metabolism. The h/H ratio range of milk reported in the literature is 0.32–0.74 (50). Our milk results were within the expected range of h/H ratio, ranging from 0.49 to 0.52.
HPI is the reciprocal of AI, which is mainly used to evaluate the impact of the fatty acid composition of dairy products on cardiovascular health (52). Therefore, the higher the HPI index, the more beneficial to CVH. In this study, there was no significant difference in the HPI among the different regional milk samples, indicating that the nutritional implications for CVH were similar among retail milk from different regions. Previous literature reported that the values of the HPI index ranged from 0.16 to 0.68 (20, 52). Our results were within the expected range of HPI index values, ranging from 0.36 to 0.38.
3.4. Potential implications on fatty acid intake via retail milk in China consumers
To determine whether the differences in milk FA composition from different geographic regions caused nutritionally meaningful differences, FA intake from retail milk was assessed in different regions (Table 5). Overall, FA intake was within similar ranges regardless of the region. The World Health Organization (WHO) has recommended SFA intake of <10% of energy intake, and the Chinese Nutrition Society has set an acceptable macronutrient distribution range (AMDR) for SFA intake as <8% of energy intake in children 4–17 years and <10% in adults over 18 years of age (21, 53). SFA from retail milk would provide either 33% of total SFA intake (based on recommended values by the WHO) or 33%−41% of total SFA intake (based on recommended values by the Chinese Nutrition Society). Stergiadis (22) reported that dairy fat contributed to approximately one-third of the maximum recommended intake of SFA in adult consumer diets across the UK dairy production systems, which is consistent with our findings. Although the Chinese Nutrition Society has not set a maximum intake of TFA, the WHO has recommended a TFA intake of <1% of energy intake (21, 53). Estimated TFA intake from retail milk throughout China is 6%−9% of the maximum recommended TFA daily intake, which would be well below the maximum values recommended by the WHO.
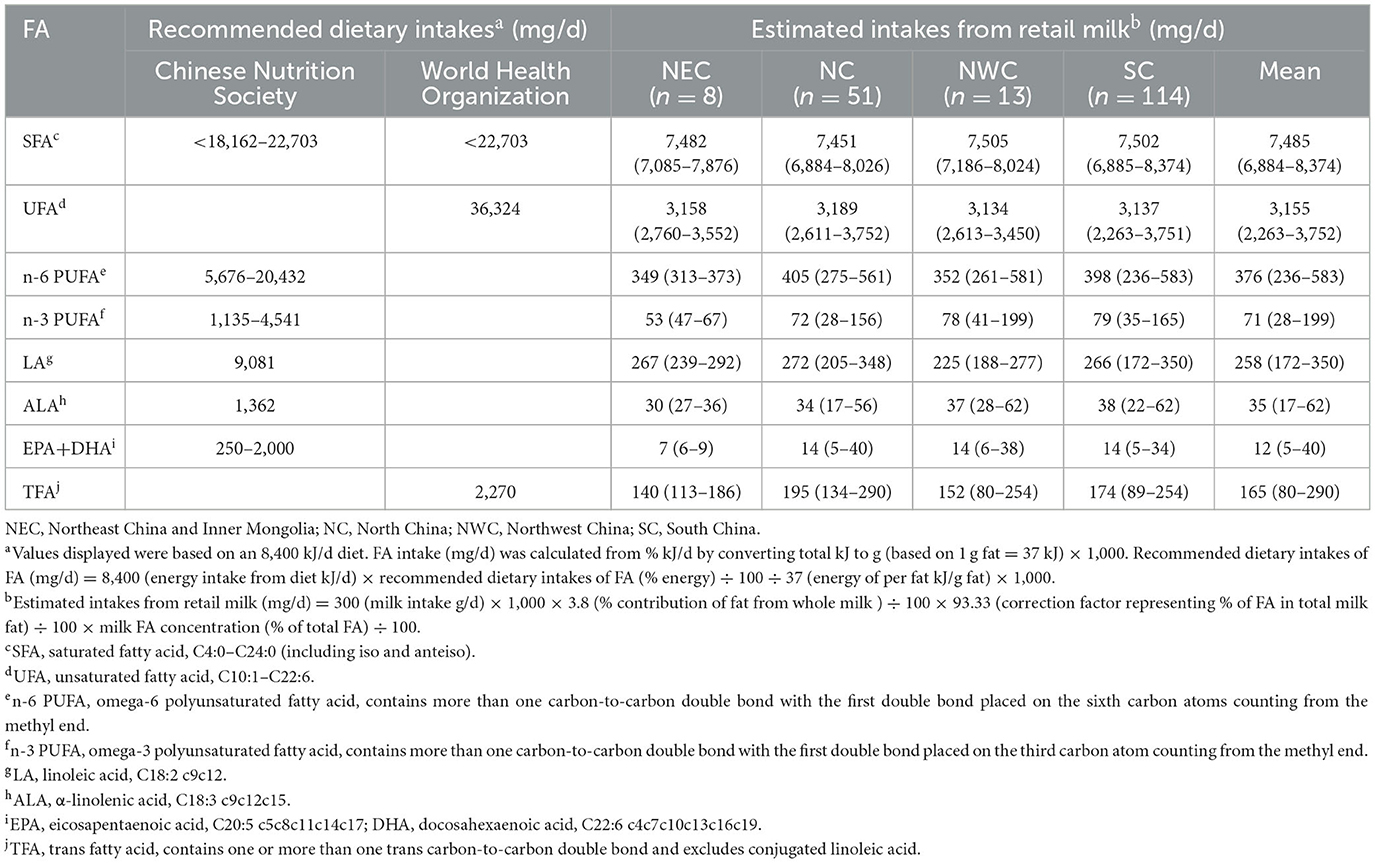
Table 5. Recommended dietary intakes of fatty acid with comparison to estimated intakes from retail milk.
Based on recommended UFA intake by the WHO, UFAs from retail milk in China would provide ~7% of the total UFA intake for consumers (21, 53). Furthermore, the Chinese Nutrition Society has suggested an AMDR of n-6 and n-3 PUFAs, expressed as % of energy intake, from 2.5 to 9% and from 0.5 to 2%, respectively. According to the results of the present study and current milk intake in China, retail milk throughout China would provide an intake of n-6 PUFA and n-3 PUFA from 2 to 7% and 2 to 6 % of AMDR, respectively. Additionally, the Chinese Nutrition Society has advised that the adequate intake (AI) of LA and ALA is 4 and 0.6% of energy intake, respectively. The consumption of retail milk would contribute ~3% of AI. The Chinese Nutrition Society has set the AMDR for EPA + docosahexaenoic acid (DHA) between 250 mg/d and 2,000 mg/d. Our study showed that the consumption of retail milk would provide an intake of EPA + DHA from 0.6 to 4.9% of AMDR. Due to the low content of EPA and DHA in retail milk and the low conversion efficiency of dietary ALA in humans (54), the supply of EPA and DHA from milk is extremely low; therefore, an additional supply of EPA and DHA from other foods is essential. Nutritional recommendations refer to the total diet rather than individual foods (21, 26). Although the current study estimated potential changes in FA intake from dairy products, any potential effects on human health are influenced by FA intake from other foods. Future research should investigate the nutritional roles of the individual components of milk.
4. Conclusion
We improved the GC-MS method for the simultaneous analysis of 82 FAs in milk samples with competitive sensitivity, suitable linearity, acceptable accuracy, and good precision. Analyses of regional effects indicated that the overall composition of milk FAs among different regions across China was numerically similar, and minor FAs showed little difference. When considering the retail milk FA composition and dairy fat intake in China, regional variations have a limited impact on FA consumption. Moreover, estimated intake of SFA and TFA via milk consumption accounted for approximately one-third and <10% of the maximum recommended values, respectively. The FA indices showed that the potential health effects of milk in different regions were inconsistent, which was indicated by the results of other FA indices, in addition to n-6/n-3 PUFA, which showed that regional differences in commercially available milk did not have much impact on cardiovascular health. After a reasonable assessment using indices with different emphases on health benefits, further systematic clinical trials should be conducted to determine the nutritional effects of milk.
Data availability statement
The original contributions presented in the study are included in the article/Supplementary material, further inquiries can be directed to the corresponding authors.
Author contributions
MC: conceptualization, methodology, formal analysis, investigation, writing—original draft, writing—reviewing and editing, and visualization. FW: conceptualization and writing—reviewing and editing. XW: formal analysis and writing—reviewing and editing. BS: methodology. JP: validation and writing—reviewing and editing. NZ: investigation and resources. YZ: supervision and resources. JW: writing—reviewing and editing, supervision, and conceptualization. All authors contributed to the article and approved the submitted version.
Funding
This study was supported by the National Key R&D Program of China (2022YFD1301004), the Agricultural Science and Technology Innovation Program (ASTIP-IAS12), and the earmarked fund for the China Agriculture Research System (CARS-36).
Acknowledgments
We would like to thank Editage (www.editage.com) for English language editing.
Conflict of interest
The authors declare that the research was conducted in the absence of any commercial or financial relationships that could be construed as a potential conflict of interest.
Publisher's note
All claims expressed in this article are solely those of the authors and do not necessarily represent those of their affiliated organizations, or those of the publisher, the editors and the reviewers. Any product that may be evaluated in this article, or claim that may be made by its manufacturer, is not guaranteed or endorsed by the publisher.
Supplementary material
The Supplementary Material for this article can be found online at: https://www.frontiersin.org/articles/10.3389/fnut.2023.1204005/full#supplementary-material
References
1. Thorning TK, Bertram HC, Bonjour JP, de Groot L, Dupont D, Feeney E, et al. Whole dairy matrix or single nutrients in assessment of health effects: current evidence and knowledge gaps. Am J Clin Nutr. (2017) 105:1033–45. doi: 10.3945/ajcn.116.151548
2. China Food Safety News. (2022). Available online at: http://paper.cfsn.cn/content/1/2022-10/20/B5/20221020B5_pdf.pdf (accessed October 20, 2022).
3. Guo Q, Li T, Qu Y, Liang M, Ha Y, Zhang Y, et al. New research development on trans fatty acids in food: biological effects, analytical methods, formation mechanism, and mitigating measures. Prog Lipid Res. (2023) 89:101199. doi: 10.1016/j.plipres.2022.101199
4. Huth PJ, Park KM. Influence of dairy product and milk fat consumption on cardiovascular disease risk: a review of the evidence. Adv Nutr. (2012) 3:266–85. doi: 10.3945/an.112.002030
5. Valenzuela CA, Baker EJ, Miles EA, Calder PC. Eighteen-carbon trans fatty acids and inflammation in the context of atherosclerosis. Prog Lipid Res. (2019) 76:101009. doi: 10.1016/j.plipres.2019.101009
6. Gomez-Cortes P, de la Fuente MA. Metabolic origin and bioactive properties of odd and branched-chain fatty acids in ruminants' milk. Rev Mex Cienc Pecu. (2020) 11:1174–91. doi: 10.22319/rmcp.v11i4.5171
7. Gómez-Cortés P, Juárez M, de la Fuente MA. Milk fatty acids and potential health benefits: an updated vision. Trends Food Sci Technol. (2018) 81:1–9. doi: 10.1016/j.tifs.2018.08.014
8. Calder PC. Functional roles of fatty acids and their effects on human health. J Parenter Enteral Nutr. (2015) 39:18S–32S. doi: 10.1177/0148607115595980
9. Lawrence GD. Perspective: The saturated fat–unsaturated oil dilemma: relations of dietary fatty acids and serum cholesterol, atherosclerosis, inflammation, cancer, and all-cause mortality. Adv Nutr. (2021) 12:647–56. doi: 10.1093/advances/nmab013
10. Jensen RG. The composition of bovine milk lipids: January 1995 to December 2000. J Dairy Sci. (2002) 85:295–350. doi: 10.3168/jds.S0022-0302(02)74079-4
11. Liu Z, Rochfort S, Cocks B. Milk lipidomics: what we know and what we don't. Prog Lipid Res. (2018) 71:70–85. doi: 10.1016/j.plipres.2018.06.002
12. Kramer JKG, Hernandez M, Cruz-Hernandez C, Kraft J, Dugan MER. Combining results of two Gc separations partly achieves determination of all cis and trans 16:1, 18:1, 18:2 and 18:3 except Cla isomers of milk fat as demonstrated using Ag-Ion Spe fractionation. Lipids. (2008) 43:259–73. doi: 10.1007/s11745-007-3143-4
13. Mohan MS, O'Callaghan TF, Kelly P, Hogan SA. Milk fat: opportunities, challenges and innovation. Crit Rev Food Sci Nutr. (2021) 61:2411–43. doi: 10.1080/10408398.2020.1778631
14. Dreiucker J, Vetter W. Fatty acids patterns in camel, moose, cow and human milk as determined with GC/MS after silver ion solid phase extraction. Food Chem. (2011) 126:762–71. doi: 10.1016/j.foodchem.2010.11.061
15. Firl N, Kienberger H, Rychlik M. Validation of the sensitive and accurate quantitation of the fatty acid distribution in bovine milk. Int Dairy J. (2014) 35:139–44. doi: 10.1016/j.idairyj.2013.11.007
16. Teng F, Wang P, Yang L, Ma Y, Day L. Quantification of fatty acids in human, cow, buffalo, goat, yak, and camel milk using an improved one-step GC-FID method. Food Anal Methods. (2017) 10:2881–91. doi: 10.1007/s12161-017-0852-z
17. Wang F, Chen M, Luo R, Huang G, Wu X, Zheng N, et al. Fatty acid profiles of milk from holstein cows, jersey cows, buffalos, yaks, humans, goats, camels, and donkeys based on gas chromatography-mass spectrometry. J Dairy Sci. (2021) 105:1687–700. doi: 10.3168/jds.2021-20750
18. Unger AL, Bourne DE, Walsh H, Kraft J. Fatty acid content of retail cow's milk in the Northeastern United States-what's in it for the consumer? J Agric Food Chem. (2020) 68:4268–76. doi: 10.1021/acs.jafc.9b07390
19. Coppa M, Revello-Chion A, Giaccone D, Tabacco E, Borreani G. Could predicting fatty acid profile by mid-infrared reflectance spectroscopy be used as a method to increase the value added by milk production chains? J Dairy Sci. (2017) 100:8705–21. doi: 10.3168/jds.2016-12382
20. Chen J, Liu H. Nutritional indices for assessing fatty acids: a mini-review. Int J Mol Sci. (2020) 21:5695. doi: 10.3390/ijms21165695
21. WHO. Interim Summary of Conclusions & Dietary Recommendations on Total Fat & Fatty Acids. (2008). Available online at: https://www.foodpolitics.com/wp-content/uploads/FFA_summary_rec_conclusion.pdf (accessed November 14, 2008).
22. Stergiadis S, Berlitz CB, Hunt B, Garg S, Ian Givens D, Kliem KE. An update to the fatty acid profiles of bovine retail milk in the United Kingdom: implications for nutrition in different age and gender groups. Food Chem. (2019) 276:218–30. doi: 10.1016/j.foodchem.2018.09.165
23. Chung IM, Kim JK, Park I, Oh JY, Kim SH. Effects of milk type, production month, and brand on fatty acid composition: a case study in Korea. Food Chem. (2016) 196:138–47. doi: 10.1016/j.foodchem.2015.09.024
24. Chen M, Zhang Y, Wang F, Zheng N, Wang J. Simultaneous determination of C18 fatty acids in milk by GC-MS. Separations. (2021) 8:118. doi: 10.3390/separations8080118
25. ICH (International Conference on Harmonisation). Validation of Analytical Procedures: Text and Methodology. Silver Spring, MD: US Food and Drug Administration (2005), p. 1–13.
26. Chinese Nutrition Society. (2021). Available online at: http://dg.cnsoc.org/upload/affix/20210304130138798.pdf (accessed January, 2021).
27. Glasser F, Doreau M, Ferlay A, Chilliard Y. Technical note: estimation of milk fatty acid yield from milk fat data. J Dairy Sci. (2007) 90:2302–4. doi: 10.3168/jds.2006-870
28. Yoshinaga K, Asanuma M, Xu C, Mizobe H, Kojima K, Nagai T, et al. Resolution behavior of cis- and trans-octadecenoic acid isomers by AOCS official method using Sp-2560 column. J Oleo Sci. (2013) 62:781–8. doi: 10.5650/jos.62.781
29. Yoshinaga K, Asanuma M, Mizobe H, Kojima K, Nagai T, Beppu F, et al. Characterization of cis- and trans-octadecenoic acid positional isomers in edible fat and oil using gas chromatography–flame ionisation detector equipped with highly polar ionic liquid capillary column. Food Chem. (2014) 160:39–45. doi: 10.1016/j.foodchem.2014.03.069
30. Gomez-Cortes P, Rodriguez-Pino V, Juarez M, de la Fuente MA. Optimization of milk odd and branched-chain fatty acids analysis by gas chromatography using an extremely polar stationary phase. Food Chem. (2017) 231:11–8. doi: 10.1016/j.foodchem.2017.03.052
31. Butler G, Stergiadis S, Seal C, Eyre M, Leifert C. Fat composition of organic and conventional retail milk in Northeast England. J Dairy Sci. (2011) 94:24–36. doi: 10.3168/jds.2010-3331
32. Liu NJ, Pustjens AM, Erasmus SW, Yang YZ, Hettinga K, van Ruth SM. Dairy farming system markers: the correlation of forage and milk fatty acid profiles from organic, pasture and conventional systems in the Netherlands. Food Chem. (2020) 314:126153. doi: 10.1016/j.foodchem.2019.126153
33. Heck JML, van Valenberg HJF, Dijkstra J, van Hooijdonk ACM. Seasonal variation in the dutch bovine raw milk composition. J Dairy Sci. (2009) 92:4745–55. doi: 10.3168/jds.2009-2146
34. Lanier JS, Corl BA. Challenges in enriching milk fat with polyunsaturated fatty acids. J Anim Sci Biotechnol. (2015) 6:26. doi: 10.1186/s40104-015-0025-0
35. Xin HS, Xu Y, Chen YH, Chen GQ, Steele MA, Guan LL. Short communication: odd-chain and branched-chain fatty acid concentrations in bovine colostrum and transition milk and their stability under heating and freezing treatments. J Dairy Sci. (2020) 103:11483–9. doi: 10.3168/jds.2020-18994
36. van Valenberg HJF, Hettinga KA, Dijkstra J, Bovenhuis H, Feskens EJM. Concentrations of n-3 and n-6 Fatty acids in Dutch bovine milk fat and their contribution to human dietary intake. J Dairy Sci. (2013) 96:4173–81. doi: 10.3168/jds.2012-6300
37. Vlaeminck B, Gervais R, Rahman MM, Gadeyne F, Gorniak M, Doreau M, et al. Postruminal synthesis modifies the odd- and branched-chain fatty acid profile from the duodenum to milk. J Dairy Sci. (2015) 98:4829–40. doi: 10.3168/jds.2014-9207
38. Toral PG, Hervás G, Della Badia A, Gervais R, Frutos P. Effect of dietary lipids and other nutrients on milk odd- and branched-chain fatty acid composition in dairy ewes. J Dairy Sci. (2020) 103:11413–23. doi: 10.3168/jds.2020-18580
39. Layé S, Nadjar A, Joffre C, Bazinet RP. Anti-inflammatory effects of omega-3 fatty acids in the brain: physiological mechanisms and relevance to pharmacology. Pharmacol Rev. (2018) 70:12–38. doi: 10.1124/pr.117.014092
40. Schmitz G, Ecker J. The opposing effects of N−3 and N−6 fatty acids. Prog Lipid Res. (2008) 47:147–55. doi: 10.1016/j.plipres.2007.12.004
41. Patel A, Desai SS, Mane VK, Enman J, Rova U, Christakopoulos P, et al. Futuristic food fortification with a balanced ratio of dietary Ω-3/Ω-6 omega fatty acids for the prevention of lifestyle diseases. Trends Food Sci Technol. (2022) 120:140–53. doi: 10.1016/j.tifs.2022.01.006
42. Shetty SS, Kumari NS, Shetty PK. Ω-6/Ω-3 fatty acid ratio as an essential predictive biomarker in the management of type 2 diabetes mellitus. Nutrition. (2020) 79–80:110968. doi: 10.1016/j.nut.2020.110968
43. Trebatická J, Hradečná Z, Surovcová A, Katrenčíková B, Gushina I, Waczulíková I, et al. Omega-3 fatty-acids modulate symptoms of depressive disorder, serum levels of omega-3 fatty acids and omega-6/omega-3 ratio in children. A randomized, double-blind and controlled trial. Psychiatry Res. (2020) 287:112911. doi: 10.1016/j.psychres.2020.112911
44. Song C, Shieh CH, Wu YS, Kalueff A, Gailcvvad S, Su KP. The role of omega-3 polyunsaturated fatty acids eicosapentaenoic and docosahexaenoic acids in the treatment of major depression and Alzheimer's disease: acting separately or synergistically? Prog Lipid Res. (2016) 62:41–54. doi: 10.1016/j.plipres.2015.12.003
45. Simopoulos AP. An increase in the omega-6/omega-3 fatty acid ratio increases the risk for obesity. Nutrients. (2016) 8:128. doi: 10.3390/nu8030128
46. Dietschy JM. Dietary fatty acids and the regulation of plasma low density lipoprotein cholesterol concentrations. J Nutr. (1998) 128:444s–8s. doi: 10.1093/jn/128.2.444S
47. Nantapo CTW, Muchenje V, Hugo A. Atherogenicity index and health-related fatty acids in different stages of lactation from Friesian, Jersey and Friesian × Jersey Cross Cow Milk under a pasture-based dairy system. Food Chem. (2014) 146:127–33. doi: 10.1016/j.foodchem.2013.09.009
48. Ulbricht T, Southgate D. Coronary heart disease: seven dietary factors. Lancet. (1991) 338:985–92. doi: 10.1016/0140-6736(91)91846-M
49. Sharma R, Ahlawat S, Aggarwal RAK, Dua A, Sharma V, Tantia MS. Comparative milk metabolite profiling for exploring superiority of indigenous Indian cow milk over exotic and crossbred counterparts. J Food Sci Technol. (2018) 55:4232–43. doi: 10.1007/s13197-018-3360-2
50. Ivanova S. Assessment of the content of dietary trans fatty acids and biologically active substances in cow's milk and curd. Modern Chem. (2017) 5:86–92. doi: 10.11648/j.mc.20170506.11
51. Santos-Silva J, Bessa RJB, Santos-Silva F. Effect of genotype, feeding system and slaughter weight on the quality of light lambs: Ii. Fatty acid composition of meat. Livest Prod Sci. (2002) 77:187–94. doi: 10.1016/S0301-6226(02)00059-3
52. Chen S, Bobe G, Zimmerman S, Hammond EG, Luhman CM, Boylston TD, et al. Physical and sensory properties of dairy products from cows with various milk fatty acid compositions. J Agric Food Chem. (2004) 52:3422–8. doi: 10.1021/jf035193z
53. Chinese Nutrition Society. Chinese Dietary Reference Intakes-Part 1: Macronutrient. (2017). Available online at: http://www.nhc.gov.cn/wjw/yingyang/201710/fdade20feb8144ba921b412944ffb779/files/0fa10dfb812a48b483d931972df1ccb8.pdf (accessed September 14, 2017).
Keywords: gas chromatography-mass spectrometry, fatty acid profile, retail milk survey, dietary intakes, human health
Citation: Chen M, Wang F, Wu X, Si B, Pan J, Zheng N, Zhang Y and Wang J (2023) Updating the fatty acid profiles of retail bovine milk in China based on an improved GC-MS method: implications for nutrition. Front. Nutr. 10:1204005. doi: 10.3389/fnut.2023.1204005
Received: 11 April 2023; Accepted: 03 May 2023;
Published: 25 May 2023.
Edited by:
Gang Chen, Beijing Technology and Business University, ChinaReviewed by:
Dan Zhu, Isotrace NZ Limited, New ZealandBei Wang, Beijing Technology and Business University, China
Mutamed Ayyash, United Arab Emirates University, United Arab Emirates
Copyright © 2023 Chen, Wang, Wu, Si, Pan, Zheng, Zhang and Wang. This is an open-access article distributed under the terms of the Creative Commons Attribution License (CC BY). The use, distribution or reproduction in other forums is permitted, provided the original author(s) and the copyright owner(s) are credited and that the original publication in this journal is cited, in accordance with accepted academic practice. No use, distribution or reproduction is permitted which does not comply with these terms.
*Correspondence: Yangdong Zhang, emhhbmd5YW5nZG9uZ0BjYWFzLmNu; Jiaqi Wang, d2FuZ2ppYXFpQGNhYXMuY24=