
94% of researchers rate our articles as excellent or good
Learn more about the work of our research integrity team to safeguard the quality of each article we publish.
Find out more
ORIGINAL RESEARCH article
Front. Nutr. , 15 May 2023
Sec. Nutrition and Metabolism
Volume 10 - 2023 | https://doi.org/10.3389/fnut.2023.1136284
 Feng-Ching Shen1,2
 Hugo You-Hsien Lin1,3,4
 Wei-Chung Tsai4,5,6
 I-Ching Kuo1,3,4
 Yi-Kong Chen1,2Yu-Lin Chao1,2
 Sheng-Wen Niu1,3,4*
 Chi-Chih Hung1,4*
 Jer-Ming Chang1,4
Non-insulin-based insulin resistance (IR) indices serve as the indicators of metabolic syndrome (MetS) but have limited value for predicting clinical outcomes. Whether the obesity paradox affects the predictive value of these indicators in patients with chronic kidney disease (CKD) remains unknown. We investigated whether MetS and non-insulin-based IR indices can predict all-cause mortality and renal outcomes in a prospective observational study with stage 1–4 CKD Asians (N = 2,457). These IR indices were associated with MetS. A Cox regression model including body mass index (BMI) revealed an association between MetS and renal outcomes. Among the IR indices, only high triglyceride–glucose (TyG) index was associated with adverse renal outcomes: the hazard ratio of Q4 quartile of the TyG index was 1.38 (1.12–1.70). All-cause mortality was marginally associated with MetS but not high IR indices. Low TyG and TyG–BMI indices as well as low BMI and triglyceride were paradoxically associated with increased risks of clinical outcomes. The triglyceride-to-high-density lipoprotein cholesterol ratio and metabolic score for IR indices were not associated with clinical outcomes. In conclusion, MetS and TyG index predict renal outcome and obesity paradox affects the prediction of IR indices in patients with stage 1–4 CKD.
A continual increase has been noted in the prevalence of metabolic syndrome (MetS); MetS was estimated to affect approximately one-quarter of the world’s population in 2018 (1). MetS is defined as elevated blood pressure, dyslipidemia, increased fasting blood glucose levels, and central obesity (2). MetS is independently associated with the risks of chronic kidney disease (CKD) (3, 4) and microalbuminuria (4). In patients with CKD, the prevalence of MetS has been reported to be approximately 65% (5). Furthermore, MetS is strongly associated with all-cause mortality (6) and adverse renal outcomes (7). However, a study involving 25,868 patients with stage 3 or 4 CKD (proportion of Caucasian patients, 86.9%) revealed an association of MetS with progression to end-stage renal disease (ESRD) but not with all-cause mortality (8). A Taiwanese study suggested that the effects of MetS on CKD progression are prominent only in patients with early-stage CKD without diabetes (9). We previously reported a U-shaped association between waist-to-hip ratio and all-cause mortality in patients with CKD (10). Further studies are required to identify the associations between MetS, CKD progression, and all-cause mortality in patients with CKD.
Insulin resistance (IR) is a key indicator of MetS (11, 12). IR is common in patients with CKD, which contributes to renal function deterioration and increased cardiovascular disease risk (13). The mechanism of IR involves the common pathways of metabolite-driven gluconeogenesis and ectopic lipid accumulation (14). In their study involving a Swedish cohort (n = 8,980), Wagner et al. revealed that individuals with IR had a high risk of diabetic nephropathy than general population (15). The gold standard for measuring IR is the hyperglycemic clamp technique, which helps quantify the sensitivity of beta cells to glucose and that of tissues to insulin (16). Alternative methods of IR measurement include insulin-based approaches, such as homeostasis model assessment of IR (HOMA-IR) (17) and the quantitative insulin sensitivity check index (18), and non-insulin-based approaches, such as the triglyceride (TG)–glucose (TyG) index (19), TyG–body mass index (BMI) (20), TG-to-high-density lipoprotein cholesterol (HDL-c) ratio (21), and metabolic score for IR (METS-IR) (22). Non-insulin-based approaches predict IR by substituting insulin assessments with assessments of fasting TG level, glucose level, lipoprotein level, or BMI; these surrogate indices are easily accessible in clinical practice.
Non-insulin-based IR indices are strongly associated with MetS. The TyG index has been widely used as an indicator of IR (23); its efficacy may be higher than that of HOMA-IR (24). Furthermore, the TyG–BMI index (20), TG/HDL-c ratio (25), and METS-IR (22) help predict MetS (26, 27). However, few studies have focused on the value of these indices for predicting clinical outcomes in patients with CKD. A high TyG index is strongly associated with renal function progression (28, 29) and diabetic nephropathy in patients with type 2 diabetes mellitus (DM) (30, 31). This index is also associated with all-cause mortality and cardiovascular death (32–34). We previously revealed reverse associations between BMI, all-cause mortality (10), and renal outcomes (35)—termed the obesity paradox—in patients with CKD. Whether clinical outcomes predicted using non-insulin-based IR indices are also affected by the obesity paradox remains unknown.
Considering the obesity paradox, we investigated whether MetS and non-insulin-based IR indices can predict all-cause mortality and renal outcome in patients with stage 1–4 CKD.
This prospective observational study, the Integrated CKD Care Program in Kaohsiung for Delaying Dialysis, involved two affiliated hospitals of Kaohsiung Medical University, southern Taiwan, and was conducted between November 11, 2002, and May 31, 2009 (36). We extended the follow-up period to 31 December 2014. The present study included patients with stage 1–4 CKD who did not receive renal replacement therapy. Patients with acute kidney injury, defined as a >50% decrease in estimated glomerular filtration rate (eGFR; calculated using the modification of diet in renal disease equation) within 3 months; patients who were lost to follow-up within 3 months; and patients with CKD were excluded from this study. Finally, this study included 2,457 patients with stage 1–4 CKD and a BMI of 15.0–35.0 kg/m2. To investigate the association of non-insulin-based IR indices with renal outcomes and all-cause mortality, the included patients were stratified based on four quartiles of the TyG index. Informed consent for participation was obtained from all patients. This study was approved by the Institutional Review Board of Kaohsiung Medical University Hospital (approval number: KMUH-IRB-990198).
The baseline variables included the patients’ demographic characteristics, such as age, BMI, waist circumference (WC), and sex; medical history, such as cardiovascular disease, diabetes, hypertension, mean blood pressure (BP), antihypertensive drug use, Charlson comorbidity index, MetS, and malnutrition–inflammation–cachexia syndrome (MICS); and laboratory findings, such as eGFR, urine protein-to-creatinine ratio (Upcr), hemoglobin level, albumin level, C-reactive protein (CRP) level, total cholesterol level, and TG level. The demographic characteristics served as baseline variables. Data regarding patients’ medical history were obtained by reviewing their medical charts and interviewing them. The definitions of indicators were listed below. Biochemistry measurements were performed during screening and baseline visits and then every 3 months, as per the protocol. Laboratory data obtained from 3 months before the baseline to 3 months after it were averaged and analyzed (Table 1).
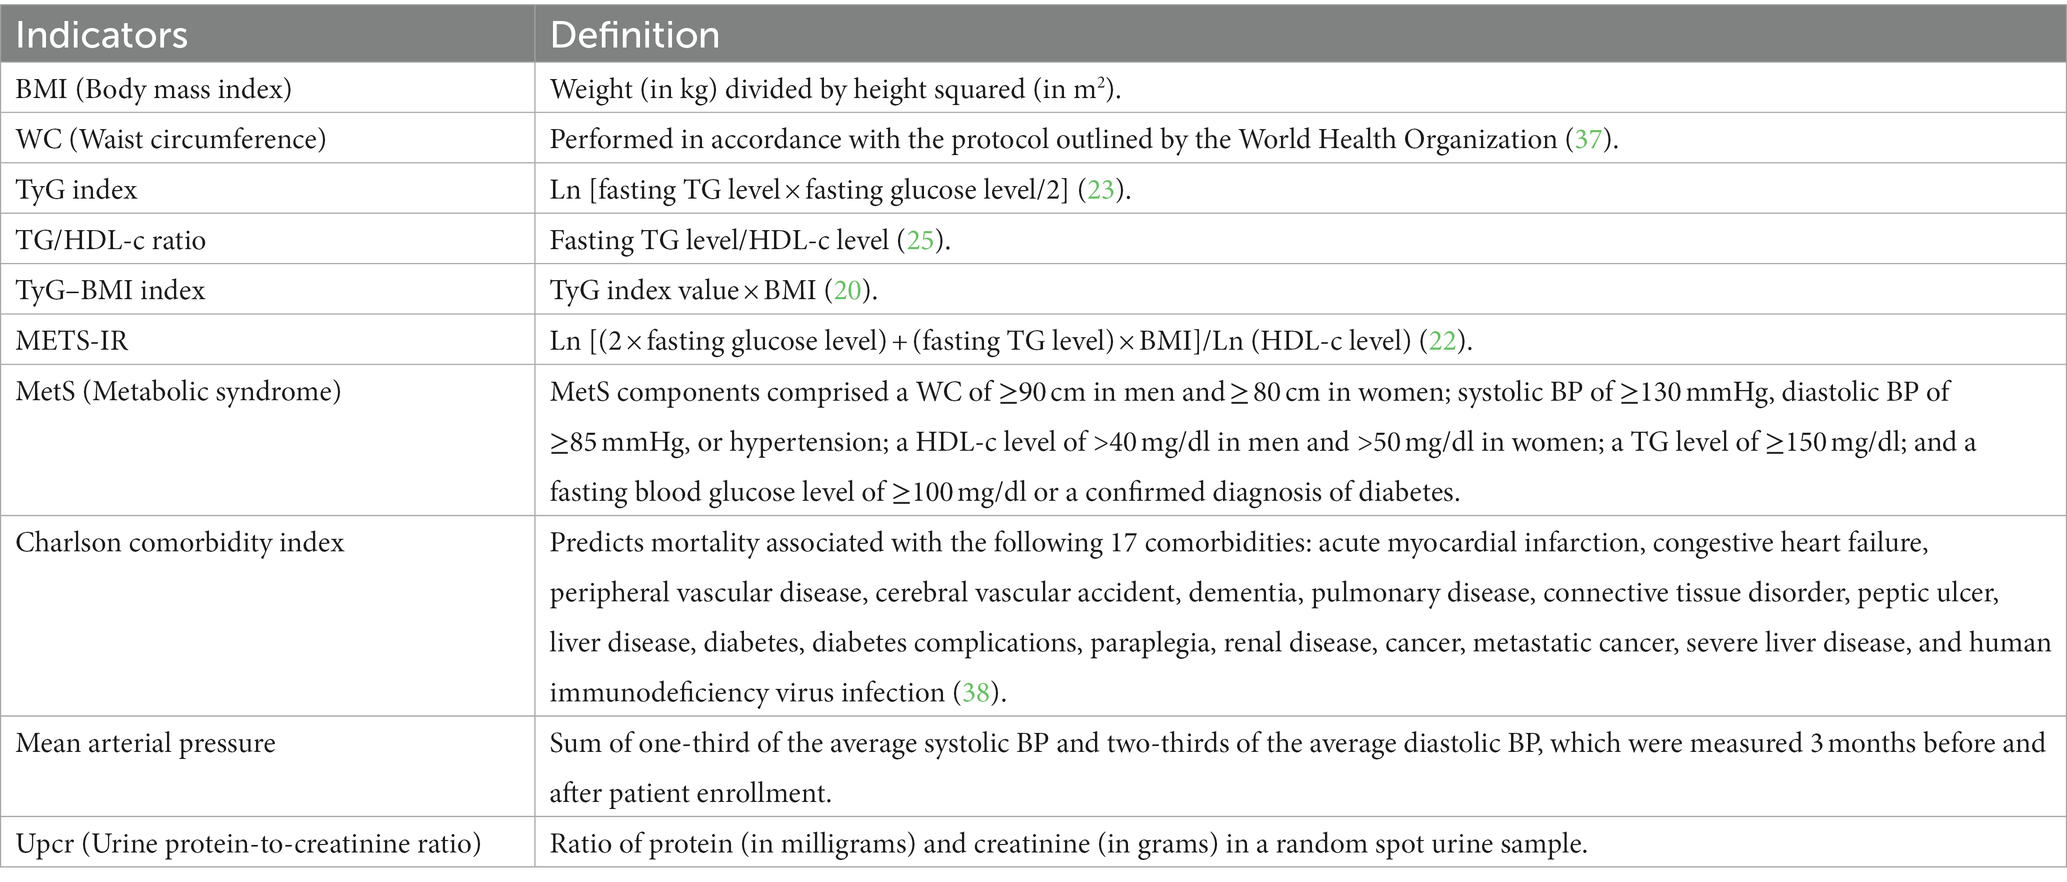
Table 1. Definitions of indicators.
Renal outcomes of interest were renal replacement therapy and a 50% decrease in eGFR. All-cause mortality was ascertained by reviewing death certificates, patient charts, or the National Death Index. The models constructed to assess all-cause mortality included patients who had undergone renal replacement therapy; patients were censored only at death or the end of follow-up.
The baseline characteristics of all the patients were stratified using the TyG index. Categorical data were presented in terms of numbers and percentages. Continuous data with a normal distribution were presented in terms of mean ± standard deviation values, whereas those with a skewed distribution were presented as median and interquartile range values. Between-group differences were evaluated using a chi-squared test for categorical variables and a one-way analysis of variance for continuous variables. Cox proportional hazards regression analysis was performed to investigate the association of non-insulin-based IR indices with renal outcomes and all-cause mortality. Continuous variables with a skewed distribution were log-transformed to ensure a normal distribution. Covariates were selected after their clinical relevance was considered; this approach is consistent with that of our previous study (39). We adjusted for the effects of the following covariates: age, sex, eGFR, Upcr (log value), cardiovascular disease, smoking, cancer, severe liver disease, hypertension, hemoglobin level, BMI, cholesterol level (log value), glycosylated hemoglobin level, albumin level, CRP (ln value), and phosphorus level. All analyses were performed using SPSS for Windows (version 20.0; IBM, Chicago, IL, USA).
The patients (N = 2,457) were stratified by TyG index quartiles (Table 2). Of the patients, 35.8% were women, 22.0% had cardiovascular disease, 60.5% had hypertension, 49.3% had diabetes, and 66.5% had MetS. Their mean age was 62.6 ± 14.4 years, their mean eGFR was 40.5 ± 23.1 ml/min/1.73 m2, their mean BMI was 24.93 ± 3.61 kg/m2, and their median Upcr was 685 (246–1,804) mg/g. In patients with stage 1–4 CKD, BMI, WC, sex, diabetes, mean BP, antihypertensive drug use, MetS, Upcr, hemoglobin level, total cholesterol level, TG level, and all-cause mortality increased with an increase in TyG index. However, age, MICS, albumin level, and progression to ESRD decreased with an increase in TyG index.
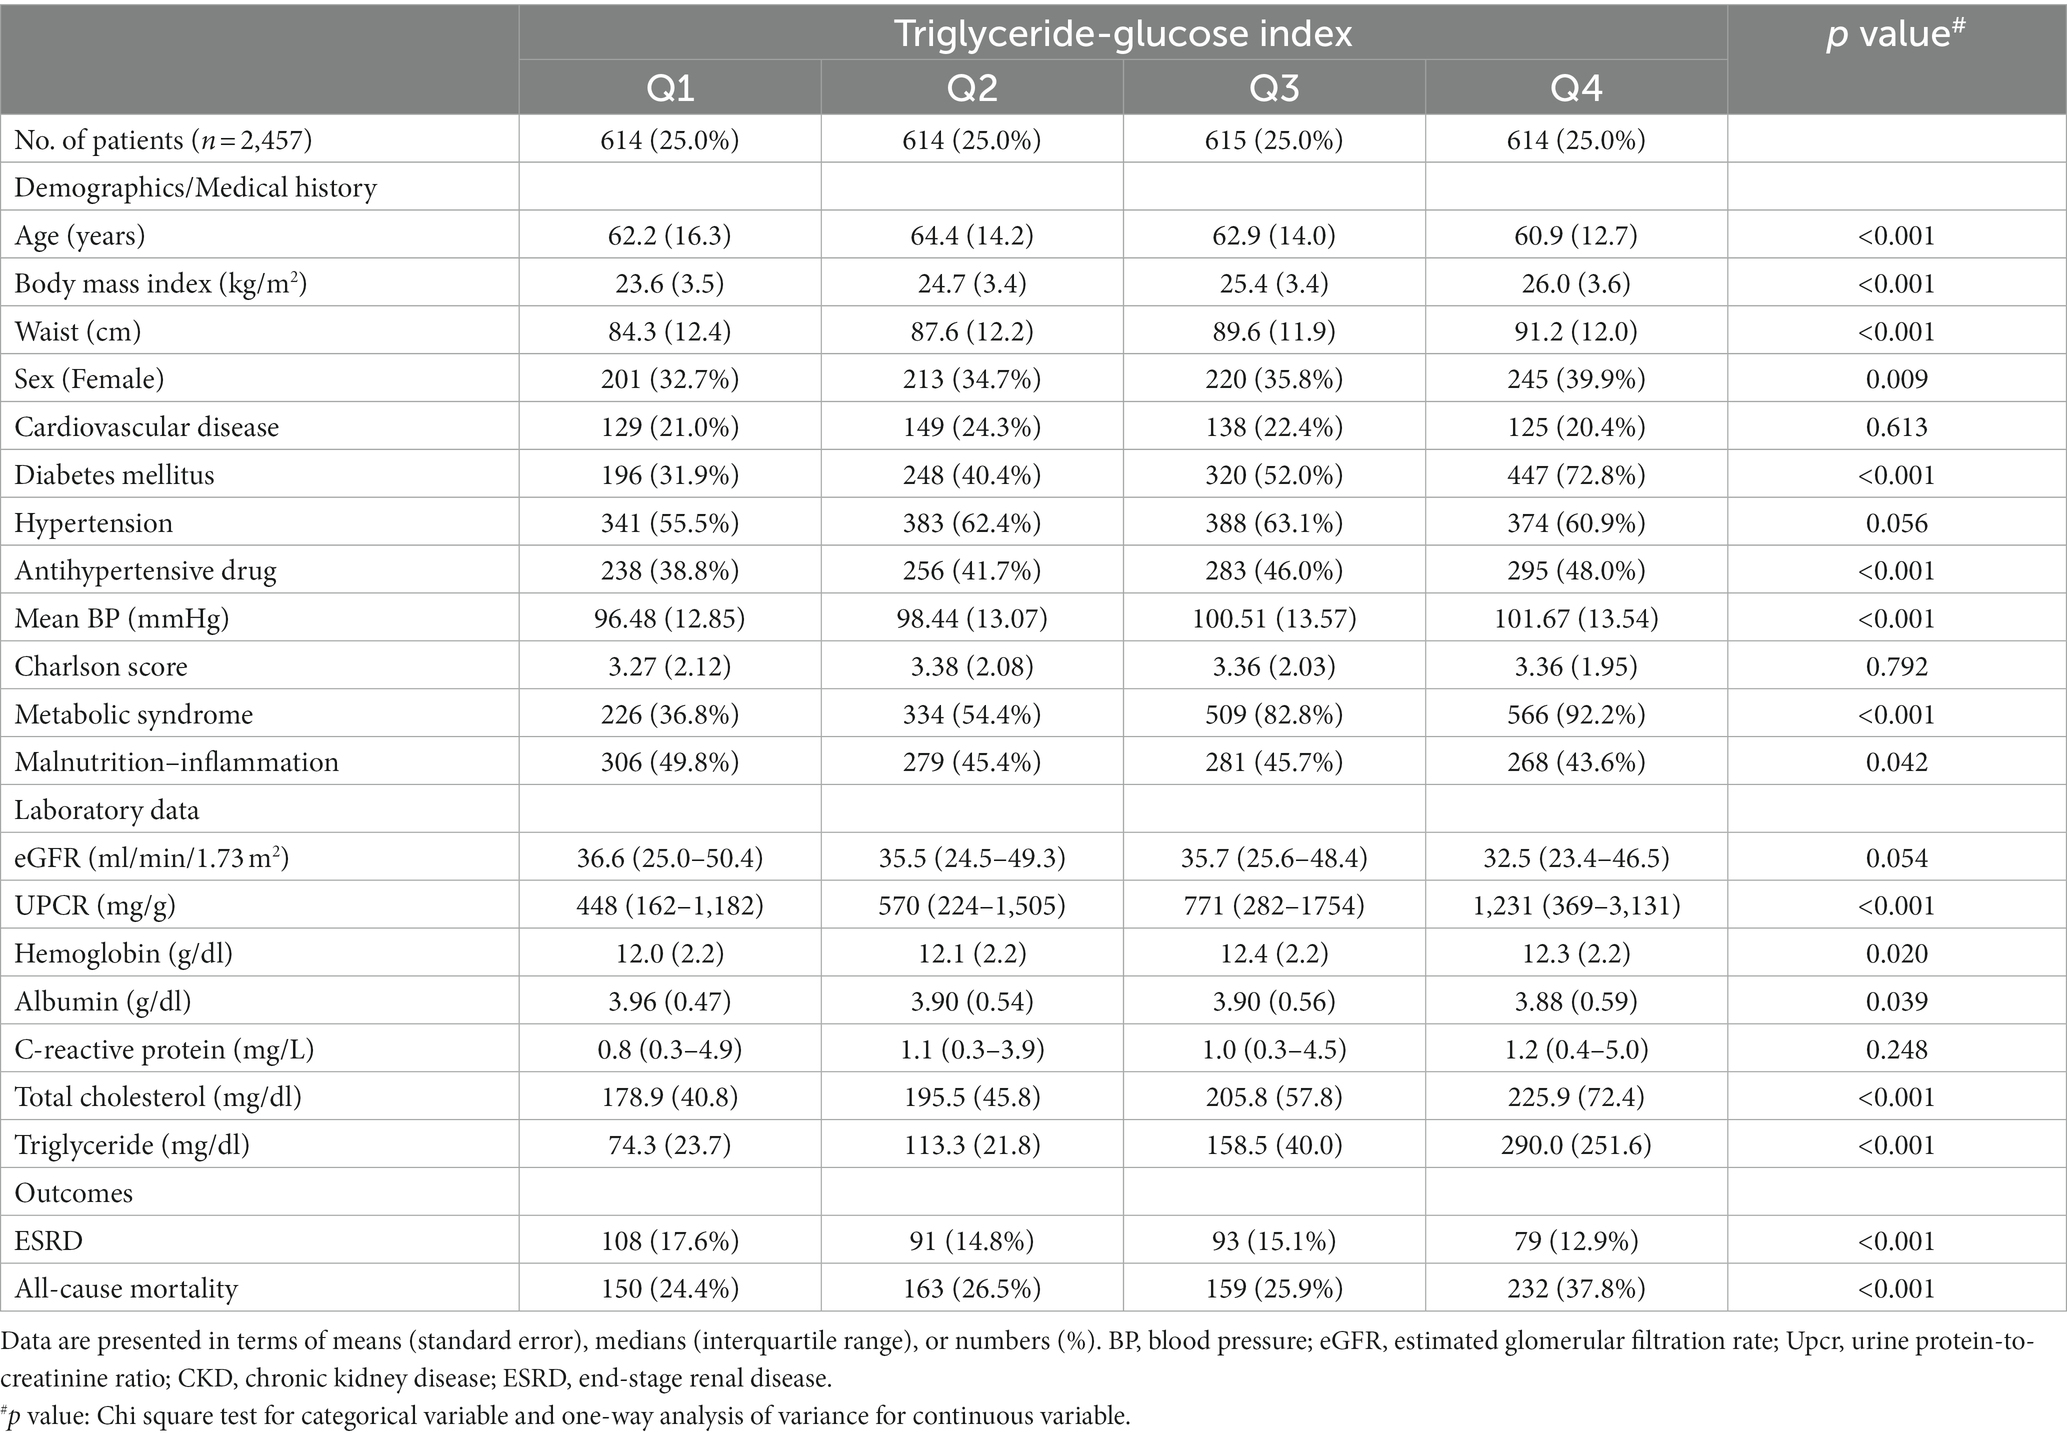
Table 2. Baseline characteristics of patients with stage 1–4 chronic kidney disease stratified by triglyceride–glucose index.
A multivariate linear regression model was constructed for the TyG index (Supplementary Table 1); the regression analysis results revealed significant (p < 0.05) increases in Upcr (log value), diabetes, WC, BMI, hemoglobin level, TG level, and albumin level with an increasing value in TyG index. By contrast, a significant (p < 0.05) decrease was noted in eGFR with an increase in TyG index.
We determined the association between MetS prevalence and four IR indices by using a fully adjusted logistic regression model (Table 3). MetS prevalence significantly increased with an increase in TyG index. The odds ratio (OR) with 95% confidence interval (CI) values corresponding to TyG index quartiles Q2, Q3, and Q4 were 2.00 (1.50–2.67), 11.12 (7.91–15.65), and 28.19 (18.18–43.70), respectively, compared with the values corresponding to TyG index quartile Q1. Similar results with higher ORs were obtained for the other indices. MetS prevalence increased considerably with an increase in the values of these indices. The OR values corresponding to Q4 quartiles of the TG/HDL-c ratio, TyG–BMI index, and METS-IR were 48.22 (30.32–76.67), 29.77 (19.11–46.37), and 72.66 (43.67–120.90), respectively, compared with those corresponding to Q1. The p values for the aforementioned comparisons were <0.001.
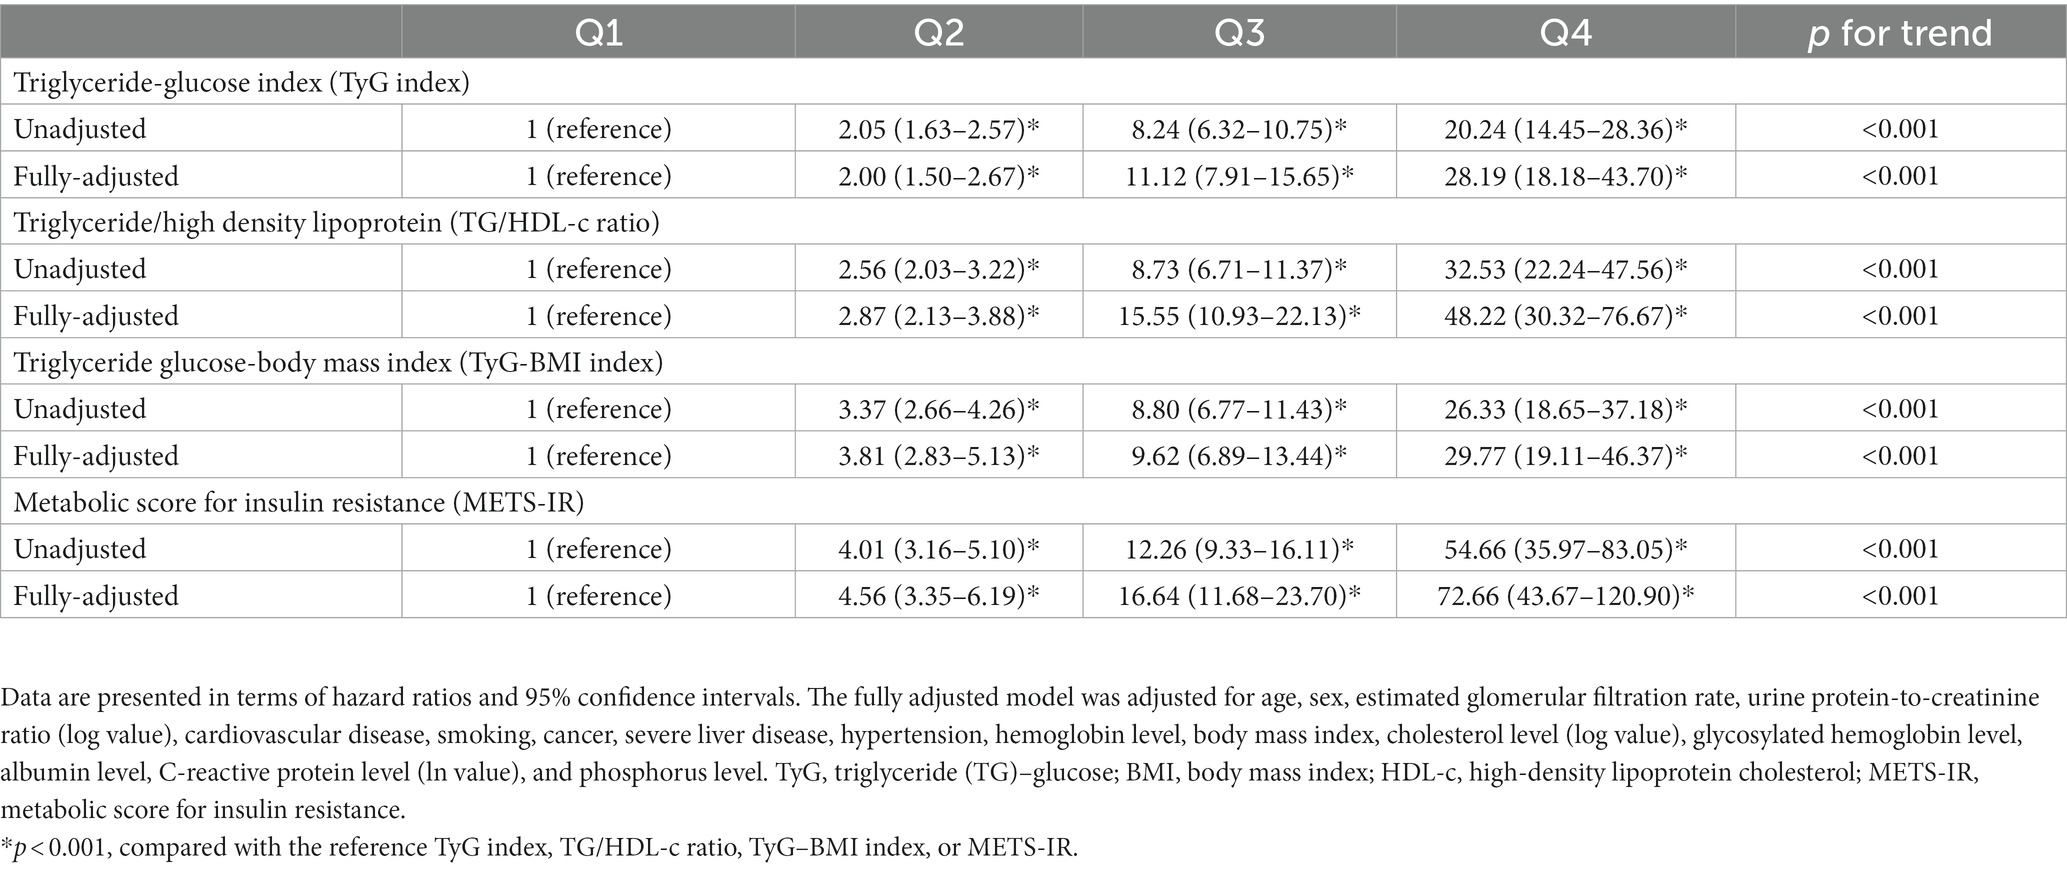
Table 3. Hazard ratios corresponding to metabolic syndrome stratified by the quartiles of various insulin resistance indices.
Table 4 presents the hazard ratios (HRs) corresponding to renal outcomes and all-cause mortality stratified by MetS. In the fully adjusted Cox regression model adjusted for BMI and traditional confounding factors, patients with MetS had substantially high risks of adverse renal outcomes (HR: 1.56; 95% CI: 1.27–1.19). However, patients with MetS exhibited only marginal increases in the risk of all-cause mortality (HR: 1.17; 95% CI: 0.91–1.49; p = 0.216).
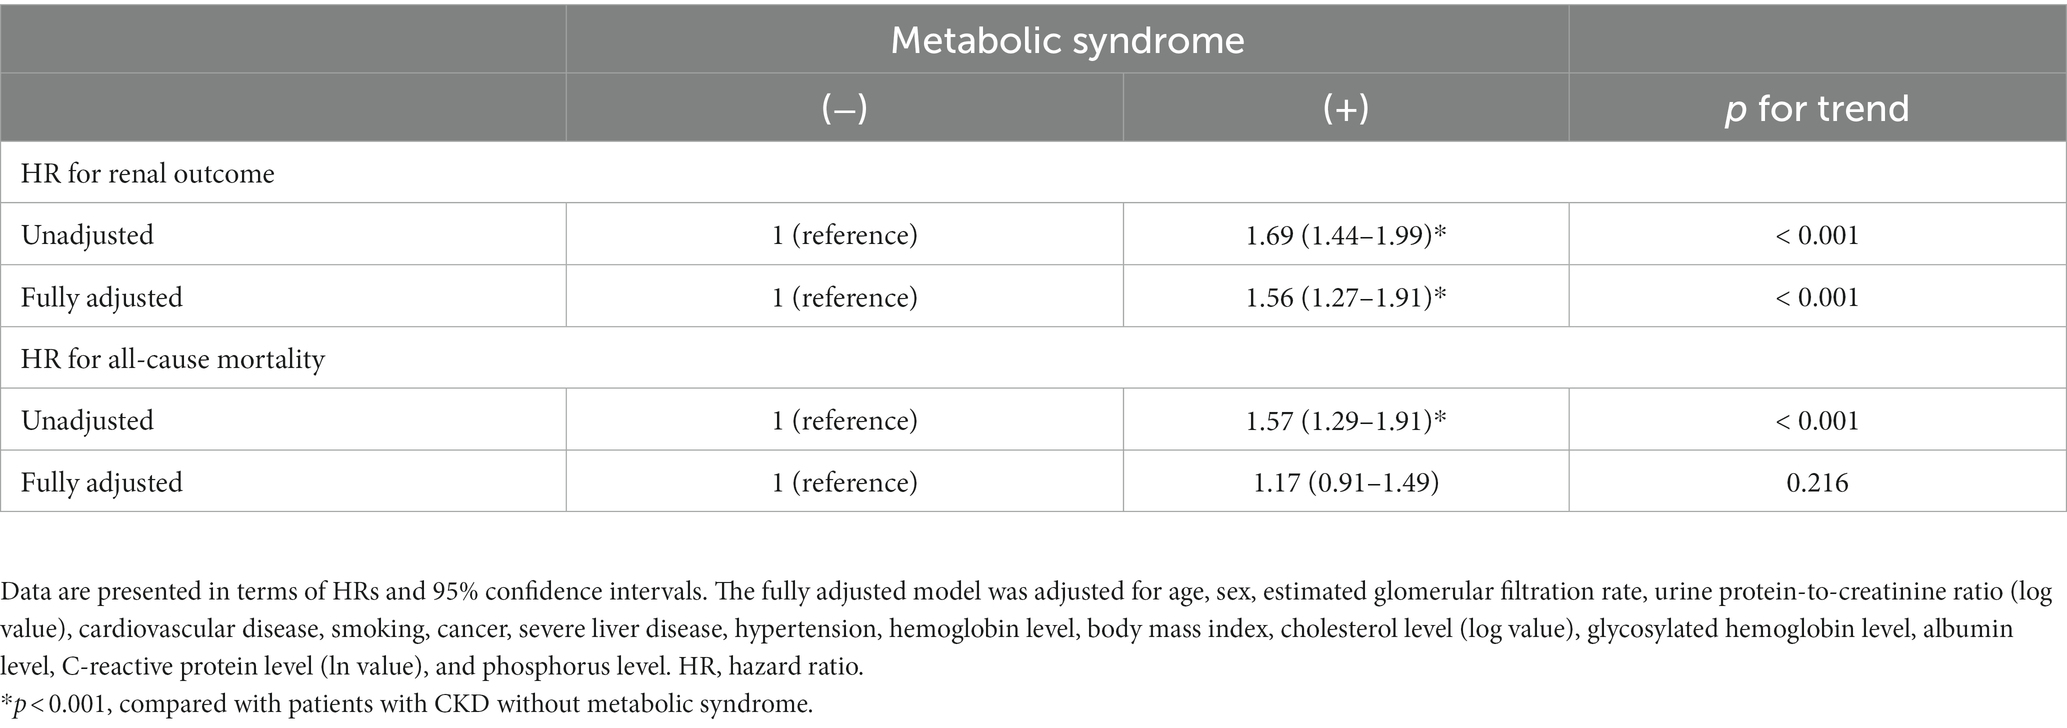
Table 4. Hazard ratios corresponding to renal outcomes and all-cause mortality stratified by metabolic syndrome.
We investigated the association between adverse renal outcomes and non-insulin-based IR indices by using a fully adjusted Cox regression model (Table 5). A U-shaped association was identified between the TyG index and adverse renal outcomes. The risk of adverse renal outcomes markedly increased in Q1 (HR: 1.44; 95% CI: 1.13–1.84), Q2 (HR: 1.57; 95% CI: 1.26–1.95), and Q4 (HR: 1.38; 95% CI: 1.12–1.70) of the TyG index compared with that in the reference group (TyG index Q3). A reverse association was found between the TyG–BMI index and adverse renal outcomes. The risk of adverse renal outcomes was significantly higher in Q1 (HR: 1.86; 95% CI: 1.19–2.91) and Q2 (HR: 1.57; 95% CI: 1.10–2.23) of the TyG–BMI index compared with that in the reference group (TyG–BMI index Q4). No prominent associations were observed between TG/HDL-c ratio, METS-IR, and adverse renal outcomes.

Table 5. Hazard ratios corresponding to renal outcome stratified by the quartiles of various insulin resistance indices.
We also investigated the association between all-cause mortality and non-insulin-based IR indices by using a fully adjusted Cox regression model (Table 6). The TyG and TyG–BMI indices were reversely associated with all-cause mortality. The risk of all-cause mortality was significantly higher in Q1 of the TyG index (HR: 1.38; 95% CI: 1.08–1.76) compared with that in the reference group (TyG index Q2). Furthermore, this risk was significantly higher in the Q1 quartile of the TyG–BMI index (HR: 1.87; 95% CI: 1.11–3.14) compared with that in the reference group (TyG–BMI index Q4). No strong associations were found between all-cause mortality and TG/HDL-c ratio or METS-IR.
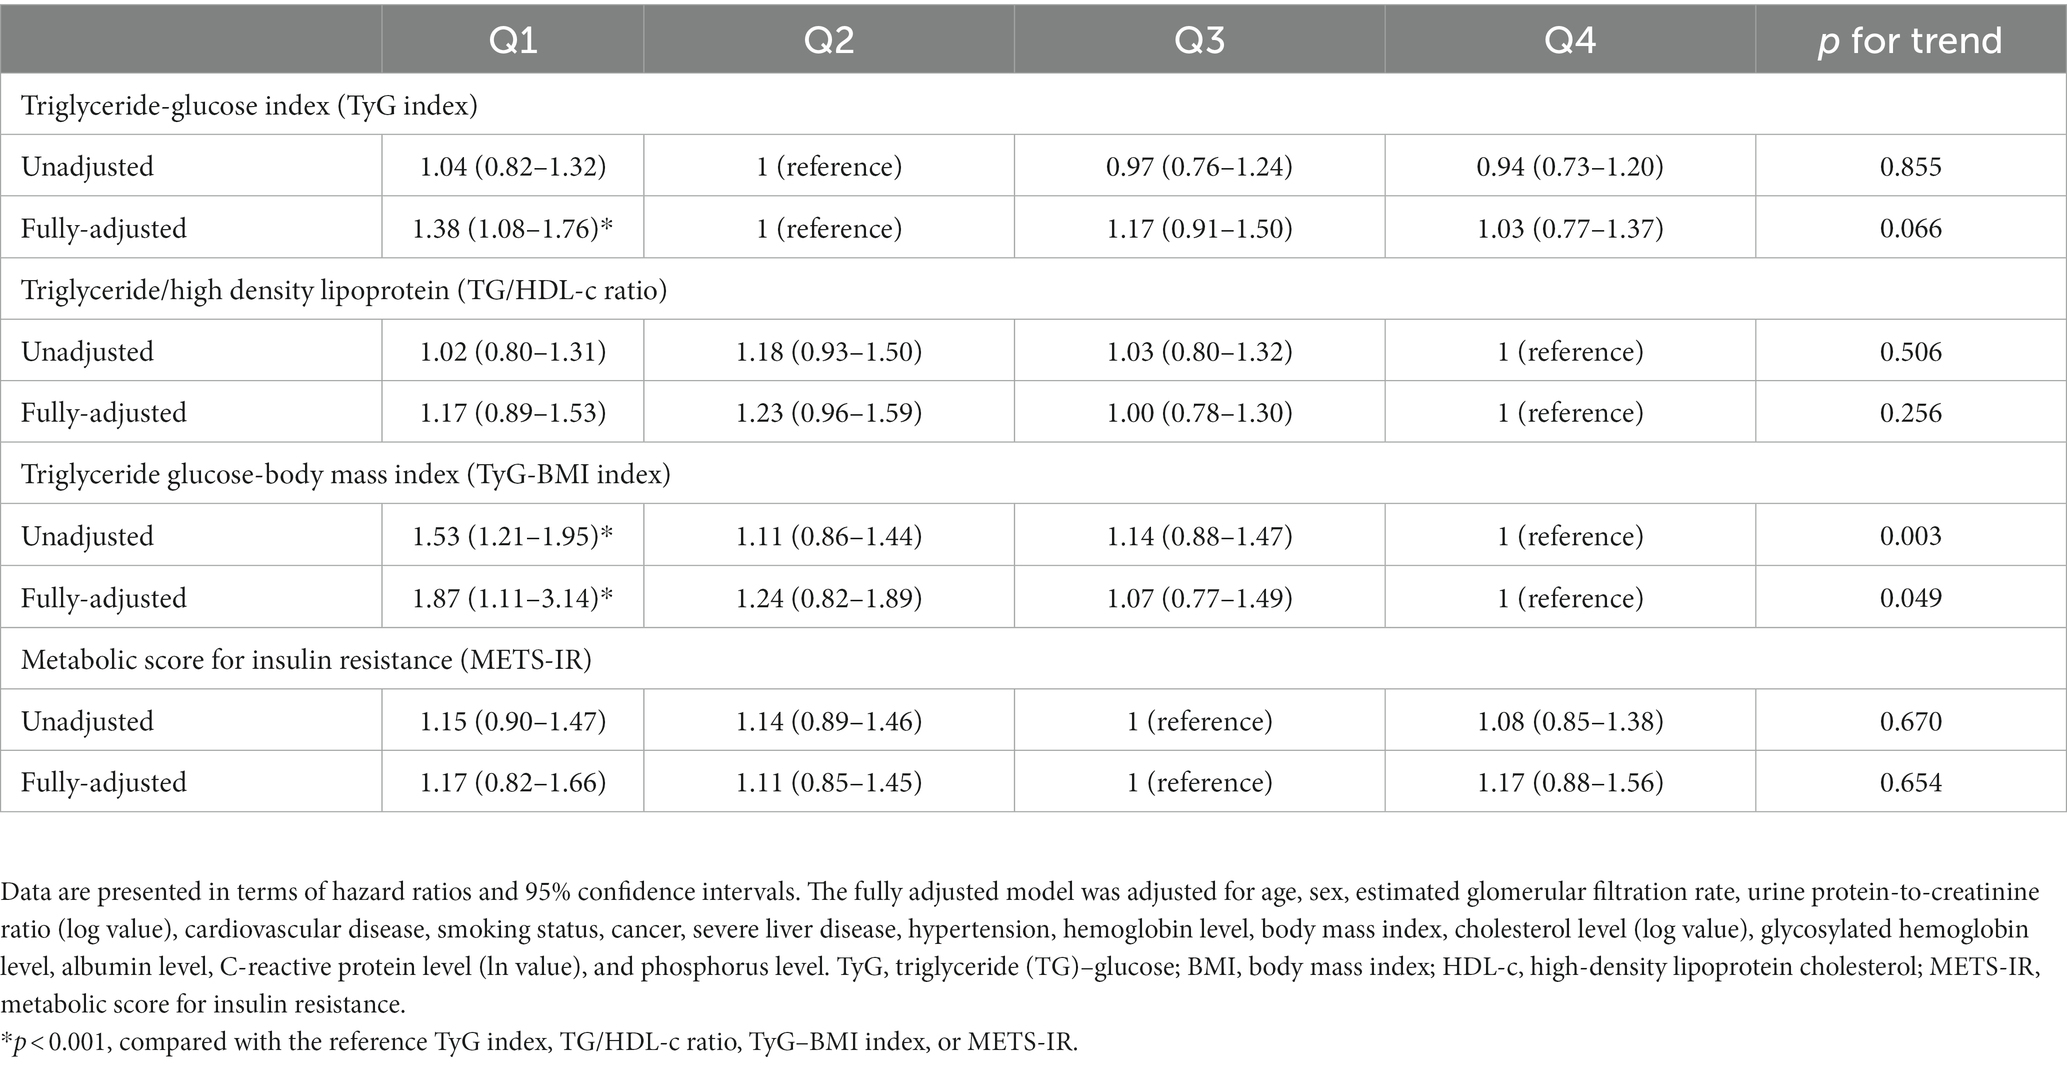
Table 6. Hazard ratios corresponding to all-cause mortality stratified by the quartiles of various insulin resistance indices.
We stratified the HRs corresponding to renal outcomes and all-cause mortality by BMI (Supplementary Table 2). A high BMI was associated with adverse renal outcomes, whereas a low BMI was associated with a higher risk of all-cause mortality. Compared with patients with a BMI of 25.1–27.5 kg/m2 (reference group), the risk of adverse renal outcomes was significantly higher in those with a BMI of 27.6–30.0 kg/m2 (HR: 1.31; 95% CI: 1.02–1.69) and those with a BMI of 30.1–35.0 kg/m2 (HR: 1.48; 95% CI: 1.12–1.94). Compared with patients with a BMI of 27.6–30.0 kg/m2 (reference group), the risk of all-cause mortality was significantly higher in those with a BMI of 15.1–20.0 kg/m2 (HR: 1.71; 95%: 1.15–2.54) and marginally higher in those with a BMI of 20.1–22.5 kg/m2 (HR: 1.39; 95% CI: 0.99–1.96).
We analyzed the association of fasting TG and glucose levels with renal outcomes and all-cause mortality by using a Cox regression model (Supplementary Table 3). Low, but not high, fasting TG levels were associated with adverse renal outcomes and a heightened risk of all-cause mortality. A higher risk of all-cause mortality was observed in patients with fasting TG levels of <50 mg/dl (HR: 1.41; 95% CI: 0.83–2.38) and 50–100 mg/dl (HR: 1.34; 95% CI: 1.01–1.78) compared with that in patients with a fasting TG level of 150–200 mg/dl (reference group). Patients with a fasting TG level of <50 mg/dl had a marginally higher risk of all-cause mortality (HR: 1.35; 95% CI: 0.84–2.17).
High fasting glucose levels were associated with adverse renal outcomes and a heightened risk of all-cause mortality. Patients with a fasting glucose level of >150 mg/dl had elevated risks of adverse renal outcomes (HR: 1.32; 95% CI: 1.05–1.65) and all-cause mortality (HR: 1.43; 95% CI: 1.09–1.88). Low fasting glucose levels were not associated with these adverse clinical outcomes.
In the present study, four non-insulin-based IR indices (TyG index, TyG–BMI index, TG/HDL-c ratio, and METS-IR) were found to be associated with MetS. Compared with patients without MetS, patients with MetS exhibited a significantly higher risk of adverse renal outcomes and a marginally higher risk of all-cause mortality. The current evidence between insulin-based IR indices and clinical outcomes were debatable and few studies have explored the association between non-insulin-based IR indices with mortality and renal outcomes. Notably, low values of the TyG and TyG–BMI indices were paradoxically associated with higher risks of adverse renal outcomes and all-cause mortality (Tables 5, 6). Furthermore, among the IR indices, only high TyG index was associated with adverse renal outcomes. This paradox may be explained on the basis of the associations of low BMI and low fasting TG level with poor clinical outcomes, considering the effects of their components. Early screening by MetS or TyG index could help to predict clinical outcomes in patients with stage 1–4 CKD.
Our results support the value of non-insulin-based IR indices for predicting MetS in patients with CKD. The TyG index appears to be a better biomarker of MetS than HOMA-IR (40) and IR indices have distinct power for MetS detection (27, 41). In the present study, four non-insulin-based IR indices (TyG index, TyG–BMI index, TG/HDL-c ratio, and METS-IR) effectively predicted MetS in patients with CKD. The Q4 quartile of the METS-IR index had the highest OR (72.66; 95% CI: 43.67–120.90). Although we considered the obesity paradox in our study, MetS was found to be associated with a significantly higher risk of adverse renal outcomes and a marginally higher risk of all-cause mortality. These findings corroborate the effects of BMI observed in our cohort (mean BMI: 24.93 ± 3.61 kg/m2). A high BMI was identified as a risk factor for adverse renal outcomes but not all-cause mortality. These findings are consistent with those of Navaneethan et al., who conducted a relevant study involving 25,868 patients with stage 3 or 4 CKD (8). The African American Study of Kidney Disease and Hypertension reported no association of MetS with CKD progression or mortality in patients (N = 842) with CKD and hypertension (mean BMI: 31.4 ± 7.0 kg/m2; eGFR: 25–65 ml/min/1.73 m2) (7). However, Pammer et al. revealed significant increases in the risks of all-cause mortality and cardiovascular events with an increased prevalence of MetS in a large cohort comprising German patients (N = 5,110) with stage 1–3 CKD (mean BMI: 29.8 ± 6.0 kg/m2) (42). These differences may be explained on the basis of the distribution of patients with a low BMI or malnutrition. Nonetheless, MetS remains a major risk factor for CKD progression.
The effects of MetS on renal outcomes may be explained on the basis of IR. IR is associated with metabolite-driven gluconeogenesis and ectopic lipid accumulation (14), which is associated with the glucose–fatty acid cycle (43). In patients with IR, the pathway-specific impairment of phosphatidylinositol 3-kinase–dependent signaling may result in an imbalance between the production of nitric oxide and the secretion of endothelin-1, which leads to endothelial dysfunction (44). IR also promotes the development of cardiovascular diseases by inducing oxidative stress and eliciting inflammatory responses (45), further leading to endothelial dysfunction and atherosclerotic plaque formation (46). Obesity causes a glomerular disease called obesity-related glomerulopathy (47), which increases the incidence of CKD (48) and ESRD (49). The mechanisms underlying obesity-related renal injury involve hemodynamic changes, inflammation, oxidative stress, apoptosis, and renal scarring (50). IR and impaired glucose tolerance result in obesity (51) and proteinuria (52). MetS leads to increased incidences of CKD (4). The ability of non-insulin-based IR indices to predict renal outcomes in patients with CKD remains to be confirmed. A large-scale Austrian study revealed a strong association between the TyG index and ESRD risk (29). Shang et al. demonstrated a U-shaped association between the TyG index and diabetic nephropathy (31). In the present study, adverse renal outcomes exhibited a U-shaped association with the TyG index and a reverse association with the TyG–BMI index. This U-shaped association may be explained on the basis of fasting TG level and BMI.
The association between insulin-based IR indices and clinical outcomes remains debatable. The findings of the studies on the association between HOMA-IR and clinical outcomes have been inconsistent. A study involving 1,883 patients with mild to moderate CKD without diabetics revealed no associations of HOMA-IR with renal outcomes, cardiovascular events, or all-cause mortality (53). Furthermore, a study involving patients with stage 2–4 CKD reported no apparent differences between patients with IR and those without IR (assessed using HOMA-IR) in terms of eGFR (54). CKD progression was slower in patients with lower HOMA-IR; however, this insulin-based index failed to predict cardiovascular events or all-cause mortality (55). Nevertheless, HOMA-IR was reported to be an independent predictor of cardiovascular mortality in patients with ESRD (56). A positive association was identified between this insulin-based index and CKD progression in Korean adults without diabetes (57). Data regarding IR indices in patients with CKD remain limited; hence, further studies are required on insulin-based and non-insulin-based IR (particularly TyG index) indices to reveal their diagnostic value for patients with CKD.
Among the non-insulin-based IR indices, low values of TyG and TyG–BMI indices were associated with risk of adverse clinical outcomes; meanwhile, only high TyG index was associated with adverse renal outcomes. Few studies have explored the associations between non-insulin-based IR indices and all-cause mortality. A U-shaped association was observed between the TyG index and all-cause mortality in the general population (32). This index is also associated with major cardiovascular events in patients with CKD with (58) and without (59) diabetes. Our findings revealed reverse associations between the TyG and TyG–BMI indices and all-cause mortality in patients with CKD. This paradox may be explained on the basis of the associations of low fasting TG level and low BMI with the risk of all-cause mortality in these patients. Thus, another obesity paradox is evident from the fact that low TyG and TyG–BMI indices are indicators of poor clinical outcomes.
BMI is strongly associated with mortality in the general population; the association had a J-shaped curve in a study of 1.46 million White adults (60) and a U-shaped curve in a study of 0.85 million East Asian adults (61). Vascular diseases, such as ischemic heart disease and stroke, contribute to mortality in patients with obesity (62). The obesity paradox (63), which is characterized by a high BMI and a low mortality risk, is observed in patients with CKD in whom protein-energy wasting (PEW) and inflammation serve as effective predictors of an early death (64). In these patients, malnutrition–inflammation–cachexia syndrome (MICS) was common and was identified to be the main cause of cardiovascular disease (65) and mortality (66). CKD and ESRD have been reported to be associated with PEW (67) and MICS (66). A low BMI ensures an increased risk of mortality (68). We previously reported a U-shaped association of waist-to-hip ratio with all-cause mortality and a reverse association of BMI with adverse renal outcomes and all-cause mortality in patients with CKD (10, 35). Therefore, MICS, PEW, and inflammation may strongly affect the reverse association between IR indices and adverse clinical outcomes.
Non-insulin-based IR indices are affected by their components. We investigated the associations of the two components of TyG index, namely fasting TG and glucose levels, with clinical outcomes. The results suggested that low fasting TG level and high fasting glucose level were associated with poor clinical outcomes. In patients with CKD presenting with MICS, a lower TG level has been associated with a higher risk of all-cause mortality (69). An elevated glucose level is a risk factor for adverse macrovascular and microvascular outcomes (70), which in turn increase the risks of all-cause mortality and adverse renal outcomes. The predictive value of the TyG index for adverse renal outcomes may be explained on the basis of the strong effects of fasting glucose level over fasting TG level.
The primary strength of the present study lies in its large sample size (N = 2,457) and inclusion of patients with stage 1–4 CKD and a BMI of 15.0–35.0 kg/m2. To our knowledge, this is the first study to explore the associations of various non-insulin-based IR indices with adverse renal outcomes and all-cause mortality in patients with CKD. The present study had some limitations. First, the cohort comprised East Asian patients; therefore, the effects of ethnicity on body composition and clinical outcomes could not be investigated in this study. Second, baseline anthropometric measurements were used in the regression analysis without considering the possible time-dependent changes in the variables. Third, dietary and medication factors were not included in the Cox regression models; these factors influence obesity and CKD. Fourth, we included patients with only stage 1–4 CKD and not those with stage 5 CKD; therefore, our findings may not be applicable to all patients with CKD. Future studies are warranted to clarify the nature of the IR index paradox and explore the efficacies of various IR indices for predicting adverse renal outcomes and all-cause mortality.
In the present study, which involved patients with stage 1–4 CKD, high non-insulin-based IR indices were associated with MetS. Patients with MetS exhibited elevated risks of adverse renal outcomes and all-cause mortality. Among the four non-insulin-based indices assessed in this study, only a high TyG index was associated with adverse renal outcomes, whereas low TyG and TyG–BMI indices were associated with all adverse clinical outcomes. The obesity paradox may alter the predictive value of these indices. Early screening by MetS or TyG index could help to predict clinical outcomes in patients with stage 1–4 CKD. In the future, large-scale studies should focus on comparing insulin-based and non-insulin-based IR indices to determine their relative predictive values. Our findings may facilitate the early screening of renal outcomes and other clinical outcomes in patients with stage 1–4 CKD. This study may serve as a reference for relevant future studies.
The raw data supporting the conclusions of this article will be made available by the authors, without undue reservation.
The studies involving human participants were reviewed and approved by Institutional Review Board of Kaohsiung Medical University Hospital. The patients/participants provided their written informed consent to participate in this study.
F-CS, S-WN, and C-CH: conceptualization, formal analysis, methodology, and writing—original draft. J-MC: supervision. HY-HL, W-CT, I-CK, Y-KC, and Y-LC: writing—review and editing. All authors have read and agreed to the published version of the manuscript. All authors contributed to the article and approved the submitted version.
We thank the Integrated CKD Care Program in Kaohsiung for Delaying Dialysis participants and staff for their contributions of the data and data collection.
The authors declare that the research was conducted in the absence of any commercial or financial relationships that could be construed as a potential conflict of interest.
All claims expressed in this article are solely those of the authors and do not necessarily represent those of their affiliated organizations, or those of the publisher, the editors and the reviewers. Any product that may be evaluated in this article, or claim that may be made by its manufacturer, is not guaranteed or endorsed by the publisher.
The Supplementary material for this article can be found online at: https://www.frontiersin.org/articles/10.3389/fnut.2023.1136284/full#supplementary-material
1. Saklayen, MG. The global epidemic of the metabolic syndrome. Curr Hypertens Rep. (2018) 20:12. doi: 10.1007/s11906-018-0812-z
2. Alberti, KGMM, Eckel, RH, Grundy, SM, Zimmet, PZ, Cleeman, JI, Donato, KA, et al. Harmonizing the metabolic syndrome. Circulation. (2009) 120:1640–5. doi: 10.1161/CIRCULATIONAHA.109.192644
3. Kurella, M, Lo, JC, and Chertow, GM. Metabolic syndrome and the risk for chronic kidney disease among nondiabetic adults. J Am Soc Nephrol. (2005) 16:2134–40. doi: 10.1681/asn.2005010106
4. Chen, J, Muntner, P, Hamm, LL, Jones, DW, Batuman, V, Fonseca, V, et al. The Metabolic Syndrome and Chronic Kidney Disease in U.S. Adults. Ann Intern Med. (2004) 140:167–74. doi: 10.7326/0003-4819-140-3-200402030-00007
5. Townsend, RR, Anderson, AH, Chen, J, Gadebegku, CA, Feldman, HI, Fink, JC, et al. Metabolic syndrome, components, and cardiovascular disease prevalence in chronic kidney disease: findings from the chronic renal insufficiency cohort (Cric) study. Am J Nephrol. (2011) 33:477–84. doi: 10.1159/000327618
6. Sanguankeo, A, and Upala, S. Metabolic syndrome increases mortality risk in dialysis patients: a systematic review and meta-analysis. Int J Endocrinol Metab. (2018) 16:e61201. doi: 10.5812/ijem.61201
7. Lea, J, Cheek, D, Thornley-Brown, D, Appel, L, Agodoa, L, Contreras, G, et al. Metabolic syndrome, proteinuria, and the risk of progressive Ckd in hypertensive African Americans. Am J Kidney Dis. (2008) 51:732–40. doi: 10.1053/j.ajkd.2008.01.013
8. Navaneethan, SD, Schold, JD, Kirwan, JP, Arrigain, S, Jolly, SE, Poggio, ED, et al. Metabolic syndrome, Esrd, and death in Ckd. Clin J Am Soc Nephrol. (2013) 8:945–52. doi: 10.2215/CJN.09870912
9. Lee, CC, Sun, CY, Wu, IW, Wang, SY, and Wu, MS. Metabolic syndrome loses its predictive power in late-stage chronic kidney disease progression--a paradoxical phenomenon. Clin Nephrol. (2011) 75:141–9. doi: 10.5414/cnp75141
10. Shen, FC, Chiu, YW, Kuo, MC, Lin, MY, Lee, JJ, Hwang, SJ, et al. U-shaped association between waist-to-hip ratio and all-cause mortality in stage 3-5 chronic kidney disease patients with body mass index paradox. J Pers Med. (2021) 11:1355. doi: 10.3390/jpm11121355
11. Haffner, SM, Valdez, RA, Hazuda, HP, Mitchell, BD, Morales, PA, and Stern, MP. Prospective analysis of the insulin-resistance syndrome (syndrome X). Diabetes. (1992) 41:715–22. doi: 10.2337/diab.41.6.715
12. Grundy, SM. Metabolic syndrome update. Trends Cardiovasc Med. (2016) 26:364–73. doi: 10.1016/j.tcm.2015.10.004
13. Spoto, B, Pisano, A, and Zoccali, C. Insulin resistance in chronic kidney disease: a systematic review. Am J Physiol Renal Physiol. (2016) 311:F1087–108. doi: 10.1152/ajprenal.00340.2016
14. Petersen, MC, and Shulman, GI. Mechanisms of insulin action and insulin resistance. Physiol Rev. (2018) 98:2133–223. doi: 10.1152/physrev.00063.2017
15. Wagner, R, Heni, M, Tabák, AG, Machann, J, Schick, F, Randrianarisoa, E, et al. Pathophysiology-based subphenotyping of individuals at elevated risk for type 2 diabetes. Nat Med. (2021) 27:49–57. doi: 10.1038/s41591-020-1116-9
16. DeFronzo, RA, Tobin, JD, and Andres, R. Glucose clamp technique: a method for quantifying insulin secretion and resistance. Am J Phys. (1979) 237:E214–23. doi: 10.1152/ajpendo.1979.237.3.E214
17. Tam, CS, Xie, W, Johnson, WD, Cefalu, WT, Redman, LM, and Ravussin, E. Defining insulin resistance from Hyperinsulinemic-Euglycemic clamps. Diabetes Care. (2012) 35:1605–10. doi: 10.2337/dc11-2339
18. Katz, A, Nambi, SS, Mather, K, Baron, AD, Follmann, DA, Sullivan, G, et al. Quantitative insulin sensitivity check index: a simple, accurate method for assessing insulin sensitivity in humans. J Clin Endocrinol Metab. (2000) 85:2402–10. doi: 10.1210/jcem.85.7.6661
19. Simental-Mendía, LE, Rodríguez-Morán, M, and Guerrero-Romero, F. The product of fasting glucose and triglycerides as surrogate for identifying insulin resistance in apparently healthy subjects. Metab Syndr Relat Disord. (2008) 6:299–304. doi: 10.1089/met.2008.0034
20. Er, LK, Wu, S, Chou, HH, Hsu, LA, Teng, MS, Sun, YC, et al. Triglyceride glucose-body mass index is a simple and clinically useful surrogate marker for insulin resistance in nondiabetic individuals. PLoS One. (2016) 11:e0149731. doi: 10.1371/journal.pone.0149731
21. McLaughlin, T, Abbasi, F, Cheal, K, Chu, J, Lamendola, C, and Reaven, G. Use of metabolic markers to identify overweight individuals who are insulin resistant. Ann Intern Med. (2003) 139:802–9. doi: 10.7326/0003-4819-139-10-200311180-00007
22. Bello-Chavolla, OY, Almeda-Valdes, P, Gomez-Velasco, D, Viveros-Ruiz, T, Cruz-Bautista, I, Romo-Romo, A, et al. Mets-Ir, a novel score to evaluate insulin sensitivity, is predictive of visceral adiposity and incident type 2 diabetes. Eur J Endocrinol. (2018) 178:533–44. doi: 10.1530/eje-17-0883
23. Guerrero-Romero, F, Simental-Mendía, LE, González-Ortiz, M, Martínez-Abundis, E, Ramos-Zavala, MG, Hernández-González, SO, et al. The product of triglycerides and glucose, a simple measure of insulin sensitivity. Comparison with the Euglycemic-Hyperinsulinemic clamp. J Clin Endocrinol Metab. (2010) 95:3347–51. doi: 10.1210/jc.2010-0288
24. Son, D-H, Lee, HS, Lee, Y-J, Lee, J-H, and Han, J-H. Comparison of triglyceride-glucose index and Homa-Ir for predicting prevalence and incidence of metabolic syndrome. Nutr Metab Cardiovasc Dis. (2022) 32:596–604. doi: 10.1016/j.numecd.2021.11.017
25. McLaughlin, T, Reaven, G, Abbasi, F, Lamendola, C, Saad, M, Waters, D, et al. Is there a simple way to identify insulin-resistant individuals at increased risk of cardiovascular disease? Am J Cardiol. (2005) 96:399–404. doi: 10.1016/j.amjcard.2005.03.085
26. Yu, X, Wang, L, Zhang, W, Ming, J, Jia, A, Xu, S, et al. Fasting triglycerides and glucose index is more suitable for the identification of metabolically unhealthy individuals in the Chinese adult population: a Nationwide study. J Diabetes Investig. (2019) 10:1050–8. doi: 10.1111/jdi.12975
27. Raimi, TH, Dele-Ojo, BF, Dada, SA, Fadare, JO, Ajayi, DD, Ajayi, EA, et al. Triglyceride-glucose index and related parameters predicted metabolic syndrome in Nigerians. Metab Syndr Relat Disord. (2021) 19:76–82. doi: 10.1089/met.2020.0092
28. Okamura, T, Hashimoto, Y, Hamaguchi, M, Obora, A, Kojima, T, and Fukui, M. Triglyceride–glucose index is a predictor of incident chronic kidney disease: a population-based longitudinal study. Clin Exp Nephrol. (2019) 23:948–55. doi: 10.1007/s10157-019-01729-2
29. Fritz, J, Brozek, W, Concin, H, Nagel, G, Kerschbaum, J, Lhotta, K, et al. The triglyceride-glucose index and obesity-related risk of end-stage kidney disease in Austrian adults. JAMA Netw Open. (2021) 4:e212612. doi: 10.1001/jamanetworkopen.2021.2612
30. Lv, L, Zhou, Y, Chen, X, Gong, L, Wu, J, Luo, W, et al. Relationship between the Tyg index and diabetic kidney disease in patients with Type-2 diabetes mellitus. Diabetes Metab Syndr Obes. (2021) 14:3299–306. doi: 10.2147/dmso.S318255
31. Shang, J, Yu, D, Cai, Y, Wang, Z, Zhao, B, Zhao, Z, et al. The triglyceride glucose index can predict newly diagnosed biopsy-proven diabetic nephropathy in type 2 diabetes: a nested case control study. Medicine. (2019) 98:e17995. doi: 10.1097/md.0000000000017995
32. Liu, XC, He, GD, Lo, K, Huang, YQ, and Feng, YQ. The triglyceride-glucose index, an insulin resistance marker, was non-linear associated with all-cause and cardiovascular mortality in the general population. Front Cardiovasc Med. (2020) 7:628109. doi: 10.3389/fcvm.2020.628109
33. Zhang, Y, Ding, X, Hua, B, Liu, Q, Gao, H, Chen, H, et al. Predictive effect of triglyceride-glucose index on clinical events in patients with type 2 diabetes mellitus and acute myocardial infarction: results from an observational cohort study in China. Cardiovasc Diabetol. (2021) 20:43. doi: 10.1186/s12933-021-01236-3
34. Yan, Z, Yu, D, Cai, Y, Shang, J, Qin, R, Xiao, J, et al. Triglyceride glucose index predicting cardiovascular mortality in Chinese initiating peritoneal Dialysis: a cohort study. Kidney Blood Press Res. (2019) 44:669–78. doi: 10.1159/000500979
35. Hung, CC, Yu, PH, Niu, SW, Kuo, IC, Lee, JJ, Shen, FC, et al. Association between body mass index and renal outcomes modified by chronic kidney disease and anemia: the obesity paradox for renal outcomes. J Clin Med. (2022) 11:2787. doi: 10.3390/jcm11102787
36. Huang, JC, Lin, HY, Lim, LM, Chen, SC, Chang, JM, Hwang, SJ, et al. Body mass index, mortality, and gender difference in advanced chronic kidney disease. PLoS One. (2015) 10:e0126668. doi: 10.1371/journal.pone.0126668
37. World Health Organization. Waist circumference and waist-hip ratio: Report of a who expert consultation, Geneva, 8–11 December 2008. Geneva: World Health Organization (2011).
38. Sundararajan, V, Henderson, T, Perry, C, Muggivan, A, Quan, H, and Ghali, WA. New Icd-10 version of the Charlson comorbidity index predicted in-hospital mortality. J Clin Epidemiol. (2004) 57:1288–94. doi: 10.1016/j.jclinepi.2004.03.012
39. Chiang, HP, Chiu, YW, Lee, JJ, Hung, CC, Hwang, SJ, and Chen, HC. Blood pressure modifies outcomes in patients with stage 3 to 5 chronic kidney disease. Kidney Int. (2020) 97:402–13. doi: 10.1016/j.kint.2019.10.021
40. Khan, SH, Sobia, F, Niazi, NK, Manzoor, SM, Fazal, N, and Ahmad, F. Metabolic clustering of risk factors: evaluation of triglyceride-glucose index (Tyg index) for evaluation of insulin resistance. Diabetol Metab Syndr. (2018) 10:74. doi: 10.1186/s13098-018-0376-8
41. Lim, J, Kim, J, Koo, SH, and Kwon, GC. Comparison of triglyceride glucose index, and related parameters to predict insulin resistance in Korean adults: an analysis of the 2007-2010 Korean National Health and nutrition examination survey. PLoS One. (2019) 14:e0212963. doi: 10.1371/journal.pone.0212963
42. Pammer, LM, Lamina, C, Schultheiss, UT, Kotsis, F, Kollerits, B, Stockmann, H, et al. Association of the metabolic syndrome with mortality and major adverse cardiac events: a large chronic kidney disease cohort. J Intern Med. (2021) 290:1219–32. doi: 10.1111/joim.13355
43. Randle, PJ, Garland, PB, Hales, CN, and Newsholme, EA. The glucose fatty-acid cycle its role in insulin sensitivity and the metabolic disturbances of diabetes mellitus. Lancet. (1963) 281:785–9. doi: 10.1016/S0140-6736(63)91500-9
44. Muniyappa, R, and Sowers, JR. Role of insulin resistance in endothelial dysfunction. Rev Endocr Metab Disord. (2013) 14:5–12. doi: 10.1007/s11154-012-9229-1
45. Ormazabal, V, Nair, S, Elfeky, O, Aguayo, C, Salomon, C, and Zuñiga, FA. Association between insulin resistance and the development of cardiovascular disease. Cardiovasc Diabetol. (2018) 17:122. doi: 10.1186/s12933-018-0762-4
46. Bornfeldt, KE, and Tabas, I. Insulin resistance, hyperglycemia, and atherosclerosis. Cell Metab. (2011) 14:575–85. doi: 10.1016/j.cmet.2011.07.015
47. Kambham, N, Markowitz, GS, Valeri, AM, Lin, J, and D'Agati, VD. Obesity-related Glomerulopathy: an emerging epidemic. Kidney Int. (2001) 59:1498–509. doi: 10.1046/j.1523-1755.2001.0590041498.x
48. Fox, CS, Larson, MG, Leip, EP, Culleton, B, Wilson, PW, and Levy, D. Predictors of new-onset kidney disease in a community-based population. JAMA. (2004) 291:844–50. doi: 10.1001/jama.291.7.844
49. Hsu, CY, McCulloch, CE, Iribarren, C, Darbinian, J, and Go, AS. Body mass index and risk for end-stage renal disease. Ann Intern Med. (2006) 144:21–8. doi: 10.7326/0003-4819-144-1-200601030-00006
50. Redon, J, and Lurbe, E. The kidney in obesity. Curr Hypertens Rep. (2015) 17:43. doi: 10.1007/s11906-015-0555-z
51. Reaven, GM, Banting Lecture. Role of insulin resistance in human disease. Diabetes. (1988) 37:1595–607. doi: 10.2337/diab.37.12.1595
52. Mykkänen, L, Zaccaro, DJ, Wagenknecht, LE, Robbins, DC, Gabriel, M, and Haffner, SM. Microalbuminuria is associated with insulin resistance in nondiabetic subjects: the insulin resistance atherosclerosis study. Diabetes. (1998) 47:793–800. doi: 10.2337/diabetes.47.5.793
53. Schrauben, SJ, Jepson, C, Hsu, JY, Wilson, FP, Zhang, X, Lash, JP, et al. Insulin resistance and chronic kidney disease progression, cardiovascular events, and death: findings from the chronic renal insufficiency cohort study. BMC Nephrol. (2019) 20:60. doi: 10.1186/s12882-019-1220-6
54. Bastürk, T, and Unsal, A. Is insulin resistance a risk factor for the progression of chronic kidney disease? Kidney Blood Press Res. (2011) 34:111–5. doi: 10.1159/000323904
55. Caravaca, F, Cerezo, I, Macías, R, García de Vinuesa, E, Martínez del Viejo, C, Villa, J, et al. Insulin resistance in chronic kidney disease: its clinical characteristics and prognosis significance. Nefrologia. (2010) 30:661–8. doi: 10.3265/Nefrologia.pre2010.Aug.10491
56. Shinohara, K, Shoji, T, Emoto, M, Tahara, H, Koyama, H, Ishimura, E, et al. Insulin resistance as an independent predictor of cardiovascular mortality in patients with end-stage renal disease. J Am Soc Nephrol. (2002) 13:1894–900. doi: 10.1097/01.asn.0000019900.87535.43
57. Kim, HR. The relationship between the progression of chronic kidney disease and Beta cell function in non-diabetic Korean adults. Korean J Clin Lab Sci. (2020) 52:165–71. doi: 10.15324/kjcls.2020.52.3.165
58. Low, S, Pek, S, Moh, A, Ang, K, Khoo, J, Shao, YM, et al. Triglyceride-glucose index is prospectively associated with chronic kidney disease progression in type 2 diabetes-mediation by pigment epithelium-derived factor. Diab Vasc Dis Res. (2022) 19:14791641221113784. doi: 10.1177/14791641221113784
59. Quiroga, B, Muñoz Ramos, P, Sánchez Horrillo, A, Ortiz, A, Valdivieso, JM, and Carrero, JJ. Triglycerides-glucose index and the risk of cardiovascular events in persons with non-diabetic chronic kidney disease. Clin Kidney J. (2022) 15:1705–12. doi: 10.1093/ckj/sfac073
60. Berrington de Gonzalez, A, Hartge, P, Cerhan, JR, Flint, AJ, Hannan, L, Mac Innis, RJ, et al. Body-mass index and mortality among 1.46 million white adults. N Engl J Med. (2010) 363:2211–9. doi: 10.1056/NEJMoa1000367
61. Zheng, W, McLerran, DF, Rolland, B, Zhang, X, Inoue, M, Matsuo, K, et al. Association between body-mass index and risk of death in more than 1 million Asians. N Engl J Med. (2011) 364:719–29. doi: 10.1056/NEJMoa1010679
62. Whitlock, G, Lewington, S, Sherliker, P, Clarke, R, Emberson, J, Halsey, J, et al. Body-mass index and cause-specific mortality in 900 000 adults: collaborative analyses of 57 prospective studies. Lancet. (2009) 373:1083–96. doi: 10.1016/s0140-6736(09)60318-4
63. Kalantar-Zadeh, K, Abbott, KC, Salahudeen, AK, Kilpatrick, RD, and Horwich, TB. Survival advantages of obesity in dialysis patients. Am J Clin Nutr. (2005) 81:543–54. doi: 10.1093/ajcn/81.3.543
64. Kalantar-Zadeh, K, Rhee, CM, Chou, J, Ahmadi, SF, Park, J, Chen, JL, et al. The obesity paradox in kidney disease: how to reconcile it with obesity management. Kidney Int Rep. (2017) 2:271–81. doi: 10.1016/j.ekir.2017.01.009
65. Kalantar-Zadeh, K. Recent advances in understanding the malnutrition-inflammation-cachexia syndrome in chronic kidney disease patients: what is next? Semin Dial. (2005) 18:365–9. doi: 10.1111/j.1525-139X.2005.00074.x
66. Kalantar-Zadeh, K, Kopple, JD, Block, G, and Humphreys, MH. A malnutrition-inflammation score is correlated with morbidity and mortality in maintenance hemodialysis patients. Am J Kidney Dis. (2001) 38:1251–63. doi: 10.1053/ajkd.2001.29222
67. Obi, Y, Qader, H, Kovesdy, CP, and Kalantar-Zadeh, K. Latest consensus and update on protein-energy wasting in chronic kidney disease. Curr Opin Clin Nutr Metab Care. (2015) 18:254–62. doi: 10.1097/mco.0000000000000171
68. Kovesdy, CP, Anderson, JE, and Kalantar-Zadeh, K. Paradoxical association between body mass index and mortality in men with Ckd not yet on dialysis. Am J Kidney Dis. (2007) 49:581–91. doi: 10.1053/j.ajkd.2007.02.277
69. Kovesdy, CP, Anderson, JE, and Kalantar-Zadeh, K. Inverse association between lipid levels and mortality in men with chronic kidney disease who are not yet on dialysis: effects of case mix and the malnutrition-inflammation-Cachexia syndrome. J Am Soc Nephrol. (2007) 18:304–11. doi: 10.1681/asn.2006060674
70. Gujral, UP, Jagannathan, R, He, S, Huang, M, Staimez, LR, Wei, J, et al. Association between varying cut-points of intermediate hyperglycemia and risk of mortality, cardiovascular events and chronic kidney disease: a systematic review and meta-analysis. BMJ Open Diabetes Res Care. (2021) 9:e001776. doi: 10.1136/bmjdrc-2020-001776
Keywords: non-insulin-based insulin resistance indices, TyG index, stage 1–4 chronic kidney disease, obesity paradox, all-cause mortality, renal outcome
Citation: Shen F-C, Lin HY-H, Tsai W-C, Kuo I-C, Chen Y-K, Chao Y-L, Niu S-W, Hung C-C and Chang J-M (2023) Non-insulin-based insulin resistance indices for predicting all-cause mortality and renal outcomes in patients with stage 1–4 chronic kidney disease: another paradox. Front. Nutr. 10:1136284. doi: 10.3389/fnut.2023.1136284
Edited by:
Montserrat Esteve Ràfols, University of Barcelona, SpainReviewed by:
Wei-Hung Lin, National Cheng Kung University Hospital, TaiwanCopyright © 2023 Shen, Lin, Tsai, Kuo, Chen, Chao, Niu, Hung and Chang. This is an open-access article distributed under the terms of the Creative Commons Attribution License (CC BY). The use, distribution or reproduction in other forums is permitted, provided the original author(s) and the copyright owner(s) are credited and that the original publication in this journal is cited, in accordance with accepted academic practice. No use, distribution or reproduction is permitted which does not comply with these terms.
*Correspondence: Chi-Chih Hung, Y2hpY2hpQGttdS5lZHUudHc=; Sheng-Wen Niu, OTUwMTM4a211aEBnbWFpbC5jb20=
Disclaimer: All claims expressed in this article are solely those of the authors and do not necessarily represent those of their affiliated organizations, or those of the publisher, the editors and the reviewers. Any product that may be evaluated in this article or claim that may be made by its manufacturer is not guaranteed or endorsed by the publisher.
Research integrity at Frontiers
Learn more about the work of our research integrity team to safeguard the quality of each article we publish.