 Lu Zhang
 Chun-yan Peng
 Pei-xin Wang
 Linju Xu1
 Jia-hui Liu
 Xing Xie
 Zong-cai Tu
- 1National R&D Center of Freshwater Fish Processing, College of Life Science, Jiangxi Normal University, Nanchang, Jiangxi, China
- 2Jiangxi Deshang Pharmaceutical Co., Ltd., Yichun, Jiangxi, China
- 3State Key Laboratory of Food Science and Technology, Nanchang University, Nanchang, Jiangxi, China
Radix Paeonia Alba (RPA) is often used as food and medicine. This study aimed to enrich and identify the antioxidant and hypoglycemic bioactive compounds from RPA. The results indicated that the ethyl acetate fraction (EAF) showed the highest total phenolic content, DPPH, ABTS+ scavenging ability, and α-glucosidase inhibition ability (IC50 = 7.27 μg/ml). The EAF could alleviate H2O2-induced oxidative stress in HepG2 cells by decreasing the MDA and ROS levels, improving cell apoptosis, increasing the enzyme activity of GPX-Px, CAT, SOD, Na+/K+-ATP, and Ca2+/Mg2+-ATP, and stimulating T-AOC expression, which also enhanced the glucose uptake of insulin-resistant HepG2 cells. In addition, the EAF significantly reduced the fasting blood glucose level and improved glucose tolerance in diabetic mice. An HPLC-QTOF-MS/MS analysis displayed that procyanidin, digallic acid isomer, methyl gallate, tetragalloylglucose isomer, dimethyl gallic acid, and paeoniflorin were the major compounds in the EAF. These findings are meaningful for the application of the EAF in the medicinal or food industry to prevent and treat oxidative stress and diabetes mellitus.
1. Introduction
Diabetes mellitus (DM) is a worldwide-prevalent chronic disease inherited from natural or acquired insufficiencies and ineffectiveness of insulin secretion. It can be further divided into type I diabetes, type II diabetes (T2D), gestational diabetes mellitus, and others. Over 90% of the cases of type I diabetes are T2D (1). The International Diabetes Federation estimated that 537 million adults are living with diabetes in 2021 and that the amount will increase by 74 million compared with 2019, indicating an increment of 16%, and it is expected to reach 783 million by 2045 (https://diabetesatlas.org/data/en/country/42/cn.html). T2D is a complex metabolic abnormality characterized by chronic hyperglycemia and impaired pancreatic β-cell function and may negatively influence the structure and function of many organ systems by increasing the risk of cardiovascular disease, heart failure, diabetic kidney disease, diabetic retinopathy, etc. (2–4). Currently, mitigating glucose absorption, promoting insulin secretion, alleviating insulin resistance, inhibiting glucagon-like peptide-1 (GLP-1) receptor, sodium-glucose cotransporter-2, and diet control are the predominant modalities of T2D management (5). Meanwhile, oxidative stress is an important piece for understanding the complex mechanism involved in the development of diabetes and its complications (6, 7).
Reactive oxygen species (ROS), including singlet oxygen (O2), superoxide anion radicals (O2), hydrogen peroxide (H2O2), and hydroxyl radicals (OH), are formed during the respiration process and play an important role in biological functions, such as cell proliferation, apoptosis, and signal transduction in organisms (8). While excessive ROS will cause impaired glycometabolism in the liver, enhance insulin resistance in the liver and skeletal muscle cells, and reduce the function of pancreatic β-cells, it also promotes the development of diabetes (7). Antioxidants can alleviate oxidative stress, prevent or delay ROS-triggered apoptosis, and might be a reasonable way to treat diabetes and other metabolic syndromes. Antioxidant enzymes, antioxidants, and proteins that separate transition metals are the main ROS defense systems in an organism. In the antioxidant enzyme protection system, superoxide dismutase (SOD), glutathione peroxidase (GSH-Px), and catalase (CAT) can help to scour free radicals and reduce or eliminate oxidative damage (9, 10). Antioxidants, natural substances obtained from natural plants and synthetic chemicals that show strong radical scavenging ability, can prevent oxidative injury by removing excessive ROS, decreasing malondialdehyde (MDA), and enhancing the activity of antioxidant enzymes (11). For example, N-acetylcysteine could improve insulin secretion and insulin signaling by mitigating oxidative stress (6). However, the application of synthetic antioxidants was limited due to their potential teratogenicity, carcinogenicity, and mutagenicity (12). Thus, compounds derived from foods or herbs that exhibit low toxicity and high antioxidant ability may reduce oxidative damage by balancing the ROS level in the body.
Radix Paeonia Alba (RPA) is the dry root of herbaceous peony and is widely used in Chinese food due to its rich nutrition and health care function, especially in various stews and soups, such as stewed RPA with pig's feet, stewed RPA with pigeon, paeonia–glycyrrhiza soup, oyster–RPA soup, and papaya–RPA soup. Modern pharmacological studies have shown that RPA can regulate the immune, digestive, and cardiovascular systems (13). Di et al. (14) found that paeoniflorin pretreatment drastically attenuates the ROS level in H2O2-induced Schwann cell injury. The total glucosides of paeonia clearly improved the kidney-related symptoms in diabetic rats (15). Meanwhile, several bodies of literature have reported that the crude extract or pure compounds of RPA scavenged radicals (DPPH, ABTS+, etc.), inhibited nitric oxide (NO) production, and prevented diabetes-associated renal damage (16). However, the in vitro and in vivo antioxidant and hypoglycemic abilities of an RPA extract and its main active compounds still need to be researched further.
In this study, RPA was extracted and fractionated with different solvents, and the total phenolic content (TPC), radical scavenging, and α-glucosidase inhibition activities were evaluated to screen the fraction with the strongest hypoglycemic and antioxidant activities. Then, HepG2 cell models with oxidative injury induced by H2O2 and insulin resistance were applied to investigate the effect of RPA and its fractions on oxidative stress and glucose absorption, respectively. The in vivo hypoglycemic and oral glucose tolerance test (OGTT) abilities were evaluated with db/db mice. Finally, the main chemical composition of the RPA fraction with the strongest activity was identified by high-performance liquid chromatography-tandem quadrupole time-of-flight mass spectrometry (HPLC-ESI-QTOF-MS/MS).
2. Materials and methods
2.1. Materials and chemicals
Dried Radix Alba Paeoniae was purchased from Anqing Chunyuan pharmacy in Anqing city, Anhui province, China on June 2021. Analytic-grade chloroform, ethyl acetate, and n-butanol and chromatographic-grade acetonitrile and formic acid were from Aladdin Reagent Int. (Shanghai, China). Metformin, acarbose, 1,1-diphenyl-2-picrylhydrazyl (DPPH), 2,2-azinobis-(3-ethylbenzothiazoline-6-sulfonic acid) (ABTS), α-glucosidase, and p-nitrophenyl-α-D-galactopyranoside (pNPG) were purchased from Sigma-Aldrich (St. Louis, MO, USA). Human hepatocellular carcinoma cells (HepG2) and culture media were purchased from the BeNa Culture Collection (Beijing, China). All other chemicals were of analytical grade and from Sinopharm Chemical Reagent Co., Ltd. (Shanghai, China).
2.2. Preparation of samples
Dried RPA was pulverized into powder by a disintegrator and soaked for 24 h in 70% ethanol solution (m/v, 1:20) at room temperature. After 7 days, the mixtures were filtered and the residues were extracted for two times under the same extraction conditions. The supernatants obtained through three times of extraction were combined and concentrated to yield the crude extract. Finally, the extracts were dissolved in distilled water and fractionated by chloroform, ethyl acetate, and n-butanol sequentially to yield the chloroform fraction (DCF), the ethyl acetate fraction (EAF), and the n-butanol fraction (nBuF) for further analyses.
2.3. Determination of the total phenolic content
The TPC was quantified by the Folin-Ciocalteau method (17) with some modifications. Briefly, 200 μl of properly diluted samples or standard were mixed with 100 μl of Folin-Ciocalteau reagent. After 5 min, 300 μl of Na2CO3 (7.5%, w/v) and 1.0 ml of water were added. After 30 min, the absorbance at 765 nm was measured using a microplate reader (Biotek, Vermont, USA). The TPC was calculated based on the calibration curve plotted using gallic acid (0–200 μg/ml) and the results were expressed as μg of gallic acid equivalents per gram of extract [(μg GAE)/g E].
2.4. Determination of DPPH·and ABTS+ scavenging ability
The DPPH·and ABTS+ scavenging activity were determined according to the methods reported in our previous study (2). Freshly prepared DPPH·or ABTS+ working solution (150 μl) was mixed with 50 μl of the sample at various concentrations in 96-well microplates. After 30 or 6 min of incubation at room temperature, the absorbance was measured at 517 or 734 nm. Ethanol and quercetin were used as the negative control and positive control, respectively. The DPPH·and ABTS+ scavenging activity were expressed as the IC50 value, which was calculated by a nonlinear curve fitting of percentage inhibition ratio vs. sample concentration (μg/ml) using Origin 2019 (OriginLab Co., US).
2.5. Evaluation of oxidative damage protection at the cellular level
2.5.1. Cell cultivation and cell viability assay
HepG2 cells were cultured in Dulbecco's Modified Eagle's Medium (DMEM) supplemented with 10% fetal bovine serum (FBS), 100 U/ml penicillin, and 100 μg/ml streptomycin. The cells were grown at 37°C under a humidified 5% CO2 atmosphere. The CCK-8 method was used to determine cell viability (18). The HepG2 cells were seeded in 96-well plates at a density of 1.0 × 10⁴ cells/well and incubated for 24 h. Then, the cells were exposed to 10–300 μg/ml of the EAF or PBS for 24 h, and the cell viability was measured by a CCK-8 kit.
For oxidative damage protection analysis, the blank group, the control group, and the EAF group were set after 24 h of adherent incubation. The EAF and control groups were treated with 10–300 μg/ml of EAF and serum-free DMEM for 24 h, followed by the exposure of H2O2 for another 4 h. The blank group was treated with serum-free DMEM for 28 h. Finally, the cell viability was measured by a CCK-8 kit.
2.5.2. Intracellular ROS level assay
The intracellular ROS level was determined using 2′7′-dichlorofluorescein diacetate (DCFH-DA) staining and flow cytometry (14). The HepG2 cells were seeded in 6-well plates (1 × 10⁵ cells/well), cultured in a humidified incubator with 5% CO2 at 37°C for 24 h, and treated with different concentrations of EAF and 300 μM of H2O2 in sequence. The cells were then stained with 10 μM of DCFH-DA in serum-free DMEM at 37°C for 30 min in darkness and washed two times with PBS and followed by digestion with trypsin and centrifugation at 1,000 rpm for 5 min. The fluorescent intensity was measured by an Accuri C6 flow cytometry (Becton, Dickinson and Company, USA) at an excitation wavelength of 488 nm, and the intracellular redox status was calculated based on the ratio of green vs. yellow.
2.5.3. Measurement of MDA level and enzyme activity
HepG2 cells at the log phase were prepared as single-cell suspensions and seeded into 6-well plates (1 × 10⁶ cells/well) at 37°C for 24 h. After treatment with the EAF for 24 h, the cells were incubated with H2O2 for 4 h, washed two times with a PBS solution and lysed in lysis buffer (Biyuntian Biotechnology Co., Ltd, Shanghai, China). A BCA protein assay kit (Jiancheng Bioengineering Institute, Nanjing, China) was used to measure the intracellular protein content. The malondialdehyde (MDA) content, total antioxidant ability (T-AOC), catalase (CAT), glutathione peroxidase (GSH-Px), superoxide dismutase (SOD), Na+/K+-adenosine triphosphate (Na+/K+-ATP) and Ca2+/Mg2+-adenosine triphosphate (Ca2+/Mg2+-ATP) enzyme activity were determined with the corresponding assay kits according to the manufacturer's instructions (Jiancheng Bioengineering Institute, Nanjing, China).
2.5.4. Detection of HepG2 apoptosis
Cell apoptosis was measured by AnnexinV FITC/PI staining and flow cytometry (14). HepG2 cells were cultured as described in Section 2.5.1. After digestion with trypsin containing EDTA (Solarbio, China), the cells were centrifuged at 1,000 g for 5 min at 4°C and washed two times with precooled PBS solution. Then, 1.0 × 10⁶ cells were collected and centrifuged at 1,000 g for 5 min and allowed to react with 5.0 μl of Annexin V-FITC at 4°C for 15 min in darkness, followed by incubation with 10 μl of PI staining solution. After incubation at 4°C for 5 min, the early, viable, late, and apoptotic cells were collected, and the percentage ratio was analyzed with an Accuri C6 flow cytometry. The x and y coordinates refer to the fluorescence intensities of annexin V and PI, respectively.
2.6. α-glucosidase inhibition assay
The inhibition activity of α-glucosidase was assessed by the previous method (18). Properly diluted samples (50 μl) were incubated with 50 μl of the α-glucosidase solution (0.2 U/ml) at 37°C for 10 min prior to the addition of 50 μl pNPG. After 50 min, 100 μl of the 0.2 M Na2CO3 solution was added to stop the reaction, absorbance was measured at 405 nm against a blank without α-glucosidase, and the system without sample was run in parallel as the control group. Acarbose was used as the positive control, and the IC50 value was used to evaluate the inhibition ability.
2.7. Determination of glucose consumption by IR-HepG2 cells
An insulin resistance (IR) model was induced as indicated in a previous study (3). HepG2 cells were seeded in 96-well plates at 2 × 10⁵ cells/well (100 μl/well) and cultured for 24 h. The cells were washed with PBS three times, treated with serum-free high-glucose DMEM (4.5 g/L) containing 1.0 mM insulin, and incubated at 37°C under 5% CO2 atmosphere for 36 h to induce the IR group. The cells cultured in high-glucose DMEM supplemented with 10% FBS and 1% antibiotic antimycotic solution were taken as the negative control group (Con). Then, the EAF solutions were added to the IR model cells for 24 h. The glucose content in the culture was detected using a glucose assay kit according to the manufacturer's instructions (Jiancheng Bioengineering Institute, Nanjing, China). The glucose consumption was calculated as follows: Glucose consumption = Cm–Cs, where Cm and Cs (mmol/L) refer to the glucose content in cells before and after 24 h of incubation, respectively.
2.8. In vivo hypoglycemic ability evaluation
2.8.1. Animal experiments
A total of 508-week-old male C57BL6/J mice, including 40 db/db and 10 db/m mice, were purchased from Changzhou Cavens Laboratory Animal Co., Ltd [license key: SCXK (Su) 2016-0010, Jiangsu, China]. All experimental protocols in this research were approved by the Committee on the Ethics of Animal Experiments of the Jiangxi Normal University (Permission Number: JNU20210311-001). The breeding environment of mice was strictly controlled (25 ± 2°C, relative humidity 50 ± 5%, and 12/12 h diurnal cycle). After 1 week of adaptive feed, the 40 db/db mice were randomly divided into 5 groups: the diabetes group (Mod), the metformin group (250 mg/kg body weight per day, Met250), the low-dose group (100 mg/kg body weight per day, EAF100), the middle-dose group (250 mg/kg body weight per day, EAF250), and the high-dose group (400 mg/kg body weight per day, EAF400) and fed with D12451 during the period of drug administration. The non-diabetic mice (db/m) fed with D12450B only were used as the control group (Con). The drugs were dissolved in 5% Macrogol 400 solution; the Con and Mod groups were gavaged with a corresponding dose of 5% Macrogol 400 solution per day. The body weight and fast blood glucose (FBG) of all mice were measured weekly during the continuous administration for 8 weeks.
2.8.2. Oral glucose tolerance test
The OGTT was conducted as described in a previous study (19). Briefly, the mice fasted for 8 h after 8 weeks of intervention, and all mice were orally administered with 2 g/kg glucose solution. The FBG of mice was measured at 0, 30, 60, 90, 120, and 180 min by using a blood glucose monitor (ACCU-CHEK Performa, India). The OGTT values were calculated based on the curve areas.
2.9. HPLC-QTOF-MS/MS analysis
The separation and identification of compounds were performed using an HPLC-QTOF-MS/MS system (20). Briefly, the samples were separated by a YMC-Triart C18 column (4.6 × 250 mm, 5 μm, Japan) at a flow rate of 0.8 ml/min. Formic acid water (A) and acetonitrile (B) were used as the mobile phase. The elution program was set as follows: 0 min, 5% B; 6 min, 9% B; 7 min, 18% B; 38 min, and 40% B. The elutes were interfered with a Hybrid Quadrupole-TOF Mass Spectrometer Triple TOF 5600+ system (SCIEX, USA) directly for mass identification. The MS and MS/MS data were acquired under the negative ion mode with an electrospray ionization resource. The full-scan mass spectrum was detected at a mass range of m/z 100–1,500 and 50–1,500 in the MS and MS/MS models.
2.10. Statistical analysis
Statistical analyses were carried out using the SPSS 22.0 software (IBM, Armonk, NY, USA). The plots were drawn with Origin 2019 (OriginLab, Northampton, MA, USA), and all data were expressed as mean ± SD (standard deviation). Significant difference among data was calculated by Tukey's-b and one-way analysis of variance (ANOVA). A P-value of < 0.05 was considered significant.
3. Results
3.1. Total phenolic content
The TPC of the crude extract and its fractions from RPA are listed in Table 1. The EAF showed the highest TPC, followed by the nBuF and DCF; the contents were 844.83, 210.11, and 106.22 mg GAE/g E, respectively, and the lowest TPC was found in the crude extract (26.70 mg GAE/g E). The results indicated that ethyl acetate had the best-enriching efficiency for the phenolics in RPA extract. Our previous research also found that ethyl acetate possessed better enriching efficiency for the polyphenols in Acer palmatum “Atropurpureum,” Acer palmatum Thunb (2), and Ipomoea batatas leaves (17) than n-butanol and chloroform. In addition, the TPC was much higher than that reported by Wang et al. (13) with a value of 58.60 μg/mg E, which could be explained by the difference in extraction solvents. Water is not a proper solvent to recover polyphenols due to their high polarity.
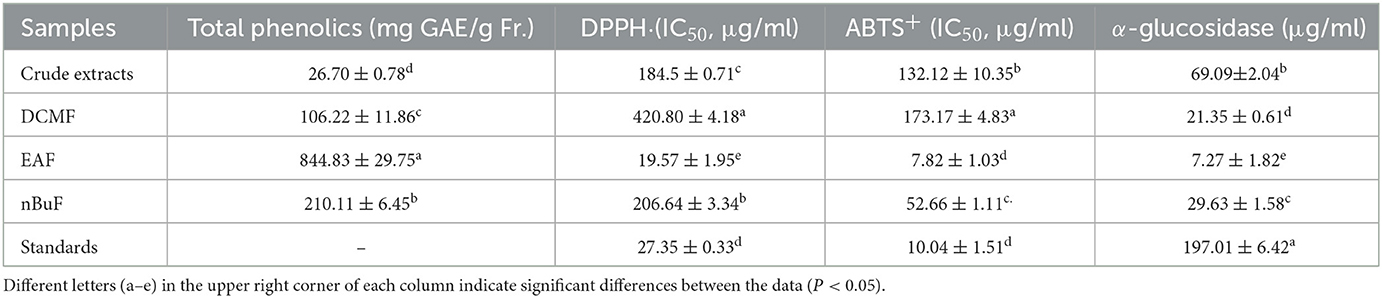
Table 1. Total phenolic content and the IC50 values for DPPH and ABTS+ scavenging ability and α-glucosidase inhibition of RPA extract and fractions.
3.2. In vitro free radical scavenging abilities
In in vitro antioxidant models, DPPH and ABTS+ scavenging abilities were used to assess the antioxidant activity of RPA fractions. As shown in Table 1, all fractions were able to scavenge DPPH and ABTS+. However, the EAF exhibited the strongest DPPH and ABTS+ scavenging abilities with IC50 values of 19.57 and 7.82 μg/ml, respectively. The DPPH scavenging ability was higher than that of the positive control quercetin, and the ABTS+ scavenging ability was comparable with quercetin, suggesting the excellent antioxidant potential of the EAF. The DPPH and ABTS+ scavenging abilities of nBuF and DCF were much lower than those of quercetin, especially for the DCF fraction, as the IC50 values were 420.80 and 173.17 μg/ml, respectively. Meanwhile, the DPPH scavenging abilities of DCF and nBuF were lower than that of the crude extract, while their ABTS+ scavenging ability was better than crude extracts. Considerable radical scavenging ability was also found by You et al. (21) by the 50% aqueous methanol extracts of raw and processed RPA. Therefore, the EAF was selected for further cell assays to evaluate oxidative injury protection.
3.3. Protection of EAF by H2O2-induced HepG2 cell oxidative injury
3.3.1. Cell viability
H2O2 is one of the commonly used substances for establishing oxidative damage in cells as it can penetrate cell membranes and cause cell damage and has been used in the osteoblasts, the nerve cells, the vascular endothelial cells, and the hepatocytes (9). Therefore, the H2O2-induced HepG2 cells oxidative damage model was used to further determine the oxidative protection effect of the EAF. The cytotoxicity of EAF toward natural HepG2 cells was presented in Figure 1A; with the increase in EAF incubation concentrations, the cell survival rate decreased gradually. Only 74.83% cell viability was achieved after treatment with 300 μg/ml of the EAF, and the viability at 200 μg/ml was 87.51%. Thus, 25–250 μg/ml was used for further experiments. The H2O2 damage degree described as cell viability is listed in Figure 1B, and dose-dependent cytotoxicity was observed. The cell viability was reduced from 97.99 to 59.71% after incubating with 50–300 μM of H2O2 for 4 h. Therefore, 300 μM of H2O2 was selected to damage HepG2 cells. To investigate the oxidative injury protection of the EAF, HepG2 cells were exposed to 25–250 μg/ml of the EAF before being stimulated with 300 μM of H2O2. It was clear that the EAF could significantly increase the cell viability (P > 0.05) and exhibit a dose-dependent relationship (Figure 1B). The cell viability reached up to 85.63% when 250 μg/ml of the EAF was added. The above results suggested that the EAF can protect HepG2 cells from the damage induced by H2O2.
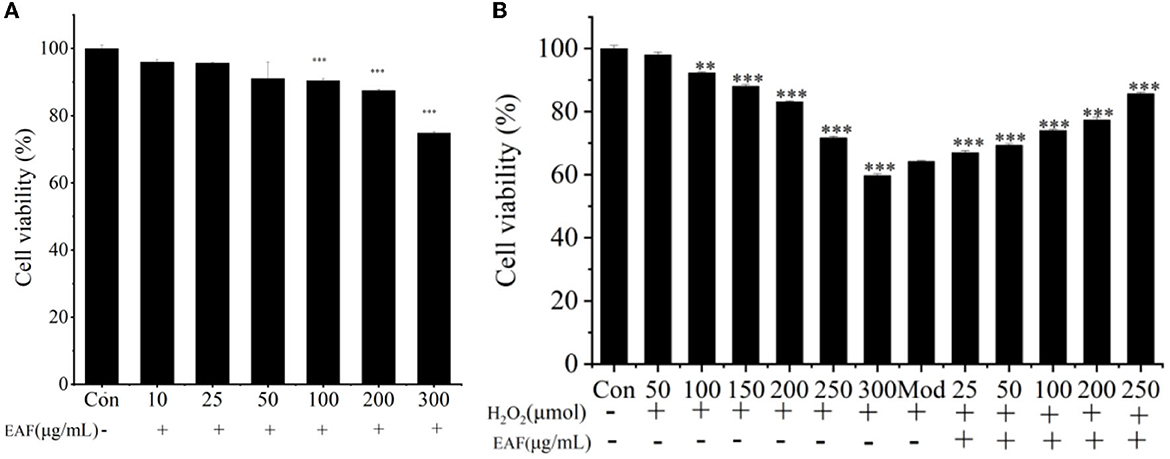
Figure 1. The cell viability of HepG2 cells in the presence or absence of the EAF (A). The cell viabilzity of H2O2-induced HepG2 cells with or without the EAF (B). The annotation ** and *** indicate the P-value of 0.05 and 0.01 compared to the Con group or the Mod group, respectively.
3.3.2. Effects on the levels of MDA, ROS, and antioxidant enzymes
The MDA and ROS levels in liver cells are generally considered to be essential indicators of peroxidation and antioxidative defenses (14). Therefore, the effect of the EAF on the production of MDA and ROS in HepG2 cells was measured. As shown in Figures 2A, B, compared with the Con group, the H2O2 treatment significantly increased the ROS and MDA levels in HepG2 cells (P > 0.05), and they were clearly decreased when the cells were pretreated with the EAF. The ROS level was reduced from 11.37 to 2.72% when 100 μg/ml of the EAF was added. Meanwhile, the MDA level decreased from 53.03 to 29.44 nmol/ml when the concentration of the EAF was increased from 0 to 250 μg/ml. However, no obvious difference was observed between the lower dose (25 μg/ml) and the Mod dose EAF groups (P > 0.05). Therefore, the EAF could reduce the MDA and ROS levels and possess benefits for HepG2 cells against oxidative stress.
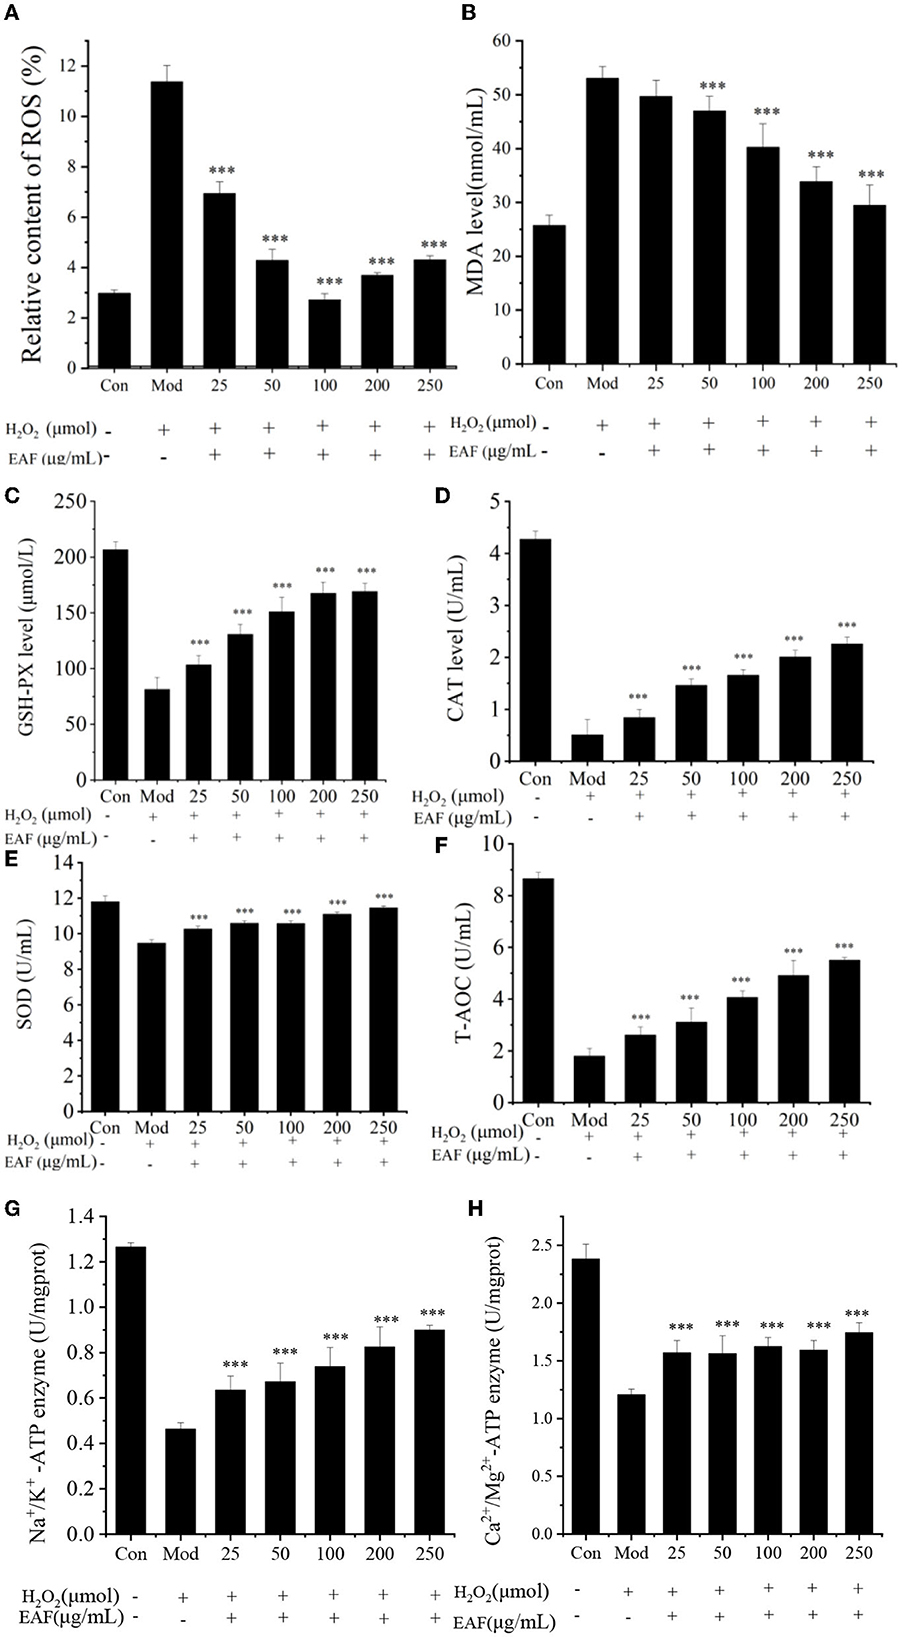
Figure 2. The MDA, ROS, CAT, SOD, GSH-Px, T-AOC, Na+/K+-ATP, and Ca2+/Mg2+-ATP levels in H2O2-induced HepG2 cells treated with different concentrations of the EAF (A–H). Con: free of H2O2 treatment; Mod: induced by 300 μM H2O2; and EAF: induced by 300 μM H2O2 and different doses of the EAF. The annotation *** indicates a P-value of <0.01 vs. the Mod group.
The GPX-Px, CAT, and SOD enzymes play a pivotal role in protecting cells from free radical damage, and the activation of the enzymes may help to scavenge active radicals and protect cells from high oxidative stress. The T-AOC reflects the total antioxidant levels of the enzymatic and non-enzymatic systems in the body, which are responsible for maintaining health (12). The effects of the EAF on the activities of GPX-Px, CAT, and SOD on H2O2-induced HepG2 cells are given in Figures 2C–E, and the activities of the antioxidant enzymes were remarkably reduced in the Mod group compared with the Con group. As expected, the EAF significantly increased the activities of GSH-Px, CAT, and SOD (P < 0.05). In particular, when the concentration of the EAF was 250 μg/ml, the expression levels of GPX-Px, CAT, and SOD were enhanced 2.07, 4.01, and 1.21 times, respectively (P < 0.05). The T-AOC was enhanced from 1.80 to 5.50 U/ml (illustrated in Figure 2F). Therefore, the EAF could regulate H2O2-induced oxidative stress by stimulating the activities of CAT, SOD, and GSH-Px and upregulating the T-AOC level. Ming and Dong (22) also found that intragastric administration of the RPA powder at doses of ~2–8 g/kg body weight/day could significantly reduce the serum MDA content and enhance SOD activity in Wistar rats.
3.3.3. Effect on the activities of the energy metabolism enzymes
The ATPases of Na+/K+-ATP and Ca2+/Mg2+-ATP participate in the growth and reproduction of organisms, play an important role in signal transmission and energy metabolism, and even provide the necessary nutrients for cells (23). To further investigate the effect of the EAF on cell energy metabolism, the protective effects of the EAF on the Na+/K+-ATP and Ca2+/Mg2+-ATP enzymes were analyzed, and the results are shown in Figures 2G, H. The highest Na+/K+-ATP and Ca2+/Mg2+-ATP enzyme activities were found in the Con group with the values of 1.26 and 2.38 U/mg/protein, respectively. Induction with 300 μM of H2O2 could significantly reduce the activity of these two ATPases. Howver, the enzyme activity was individually increased by 1.44 and 1.94 times in the HepG2 cells pretreated with 250 μg/ml of the EAF prior to H2O2 damage. The enhanced Na+/K+-ATP and Ca2+/Mg2+-ATP enzyme activities were observed in oxidation-damaged HepG2 cells treated with Capparis spinosa L. (23). The results suggested that improved Na+/K+-ATP and Ca2+/Mg2+-ATP enzyme activity might contribute to the protection of EAF against H2O2 induced HepG2 cell oxidative stress.
3.3.4. Inhibition rate of H2O2-induced HepG2 cell apoptosis
Oxidative stress and cell apoptosis were known to have a close relationship, and the apoptosis of cells was seen as the end result of oxidative damage (14). From Figure 3, the apoptosis percentage detected in HepG2 cells cultured with H2O2 was 29.7%, which was much higher than that of natural HepG2 cells (Con group) (P < 0.05). Pretreatment with 50, 100, and 250 μg/ml of the EAF significantly attenuated the apoptosis percentage, and the values reduced to 24.8, 19.5, and 9.1%, respectively. The data indicated that the EAF could improve the apoptosis of H2O2-induced oxidative damage HepG2 cells and alleviate the oxidative stress of HepG2 cells.
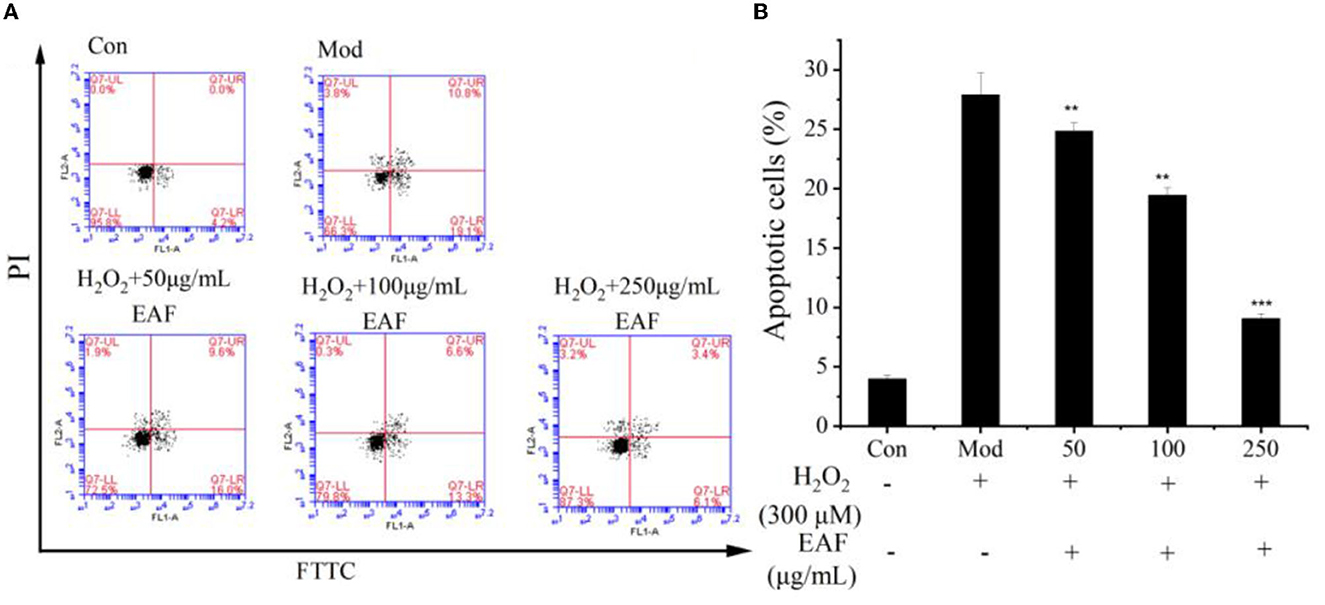
Figure 3. Annexin V-FITC/PI staining by flow cytometry. Representative image of fluorescence-activated cell sorting analysis (A). Quantitative analysis of apoptotic HepG2 cells (B). The annotation ** and *** indicate the P-value of 0.05 and 0.01 compared with the Con group or the Mod group, respectively.
3.4. α-glucosidase inhibition ability
α-glucosidase is an important carbohydrate hydrolase, and its inhibition activity can effectively retard the hydrolysis of carbohydrates and reduce the intestinal absorption of glucose. The α-glucosidase inhibitors are usually considered a promising approach to decrease fasting and postprandial blood glucose, and this approach was considered to prevent and treat diabetes (17). To investigate the potential capability of RPA extracts for diabetes treatment, the α-glucosidase inhibitory activity of RPA extracts was evaluated. As shown in Table 1, the RPA extract and its fractions (DCMF, EAF, and nBuF) were effective, and the detected IC50 values were 69.09, 21.35, 7.27, and 29.63 μg/ml, respectively. In addition, the EAF exhibited the highest α-glucosidase inhibitory when compared with other fractions and acarbose (IC50 = 197.01 μg/ml). The α-glucosidase inhibitory capabilities of DCMF, EAF, and nBuF were enhanced by 3.24, 9.50, and 2.33 times than that of crude extract, respectively. The α-glucosidase inhibition activity of RPA extracts and its fractions was highly correlated with the TPC and antioxidant activity (R2 = 0.76, 0.84), suggesting that phenolics and antioxidants in RPA contributed much to its α-glucosidase inhibition. Thus, based on these results, the EAF fraction was selected to further evaluate the effect on glucose uptake in IR-HepG2 cell models.
3.5. Promote glucose uptake in IR-HepG2 cells
HepG2 cells are widely used in biochemical and nutritional studies as they can retain the morphology and functions in culture and still are suitable cell models to investigate IR (24). In this study, an IR-HepG2 model was used to estimate the ability of the EAF to modulate glucose uptake in vitro, and the results are shown in Figure 4A. After pretreatment with the EAF, the glucose uptake by IR-HepG2 cells was remarkably increased in comparison with the model group, which enhanced 0.78 mM when 100 μg/ml of the EAF was added (P < 0.05). However, the glucose uptake values of all other IR-HepG2 cell groups were lower than the Con group. Therefore, the EAF may treat T2D by increasing the glucose uptake in liver cells and hence the hypoglycemic effect in vivo is worth further evaluation.
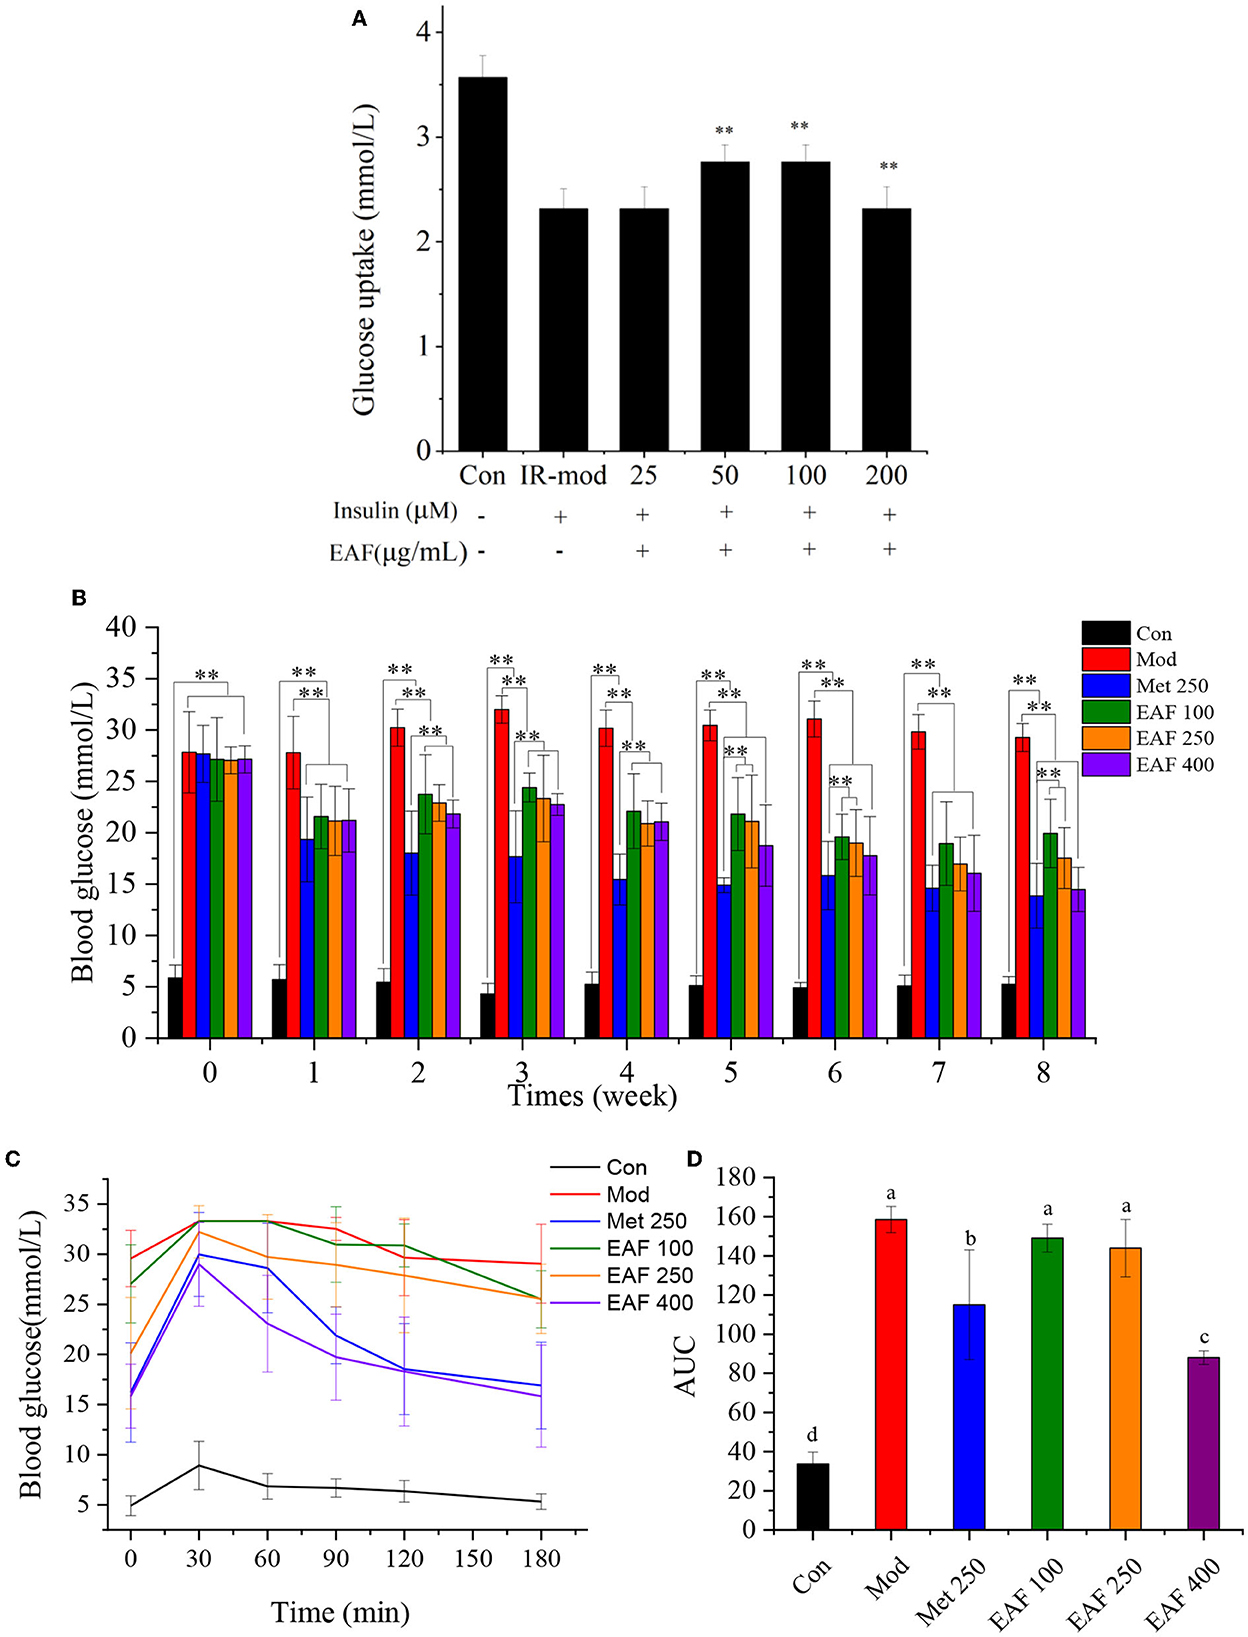
Figure 4. The effect of the EAF fraction on the glucose uptake of IR-HepG2 cells (A), FBG (B), OGTT (C), and the area of AUC (D) in T2D mice. The different letters (a–d) in each column represent the significant difference (P < 0.05). **P < 0.05.
3.6. Effects of the EAF on the FBG level and OGTT in T2D mice
As shown in Figure 4B, there were no significant differences in the initial FBG levels among the T2D mice in all groups. After oral administration for 8 weeks, the FBG level of the Mod group was significantly increased, while those of the Met and EAF groups were decreased and showed a dosage-dependent effect. In the last week, the FBG levels were reduced from 29.28 to 13.86, 19.98, 18.35, and 14.76 mmol/L in the Met 250, EAF100, 250, and 400 groups, respectively. The results suggested that the EAF pretreatment could improve the FBG levels of T2D mice.
An OGTT was often used to evaluate the abilities of the samples to regulate glucose metabolism in vivo (25). As given in Figures 4C, D, the blood glucose (BG) levels of all mice reached the peak at 30 min and then declined until 180 min, while the Mod group possessed clearly abnormal glucose tolerance. Compared with the Mod group, the AUC values of the Met 250, EAF100, EAF250, and EAF400 groups were reduced by ~27.46, 5.98, 9.18, and 44.46%, respectively. There was no significant difference between the EAF100 and EAF250 groups (P < 0.05). The results showed that supplementation of the EAF could enhance the glucose tolerance of the T2D mice, and the effect of the high dose of the EAF fraction (400 mg/kg body weight per day) was comparable with that of Met250.
3.7. Identification of phytochemical profiling
In this study, the HPLC-QTOF-MS/MS technology was performed to investigate the active compounds in the EAF. The compounds were identified by comparing the retention time, molecular formula, and MS/MS information with the references and database. The TIC spectrum of the EAF is displayed in Figure 5, and the MS/MS information is given in Table 2. A total of 23 compounds were identified in the EAF, including 5 flavonoids, 2 phenolic acids, 9 tannins, 3 terpenoids, and 4 other compounds.
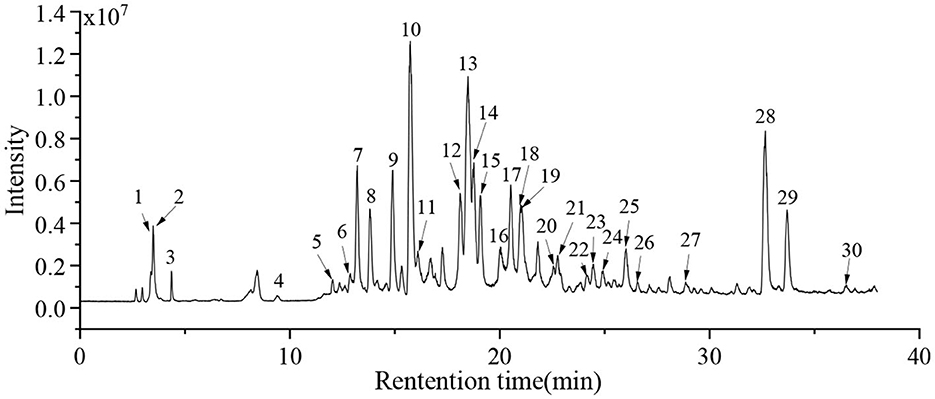
Figure 5. The total ion chromatogram (TIC) for the compounds in the EAF.
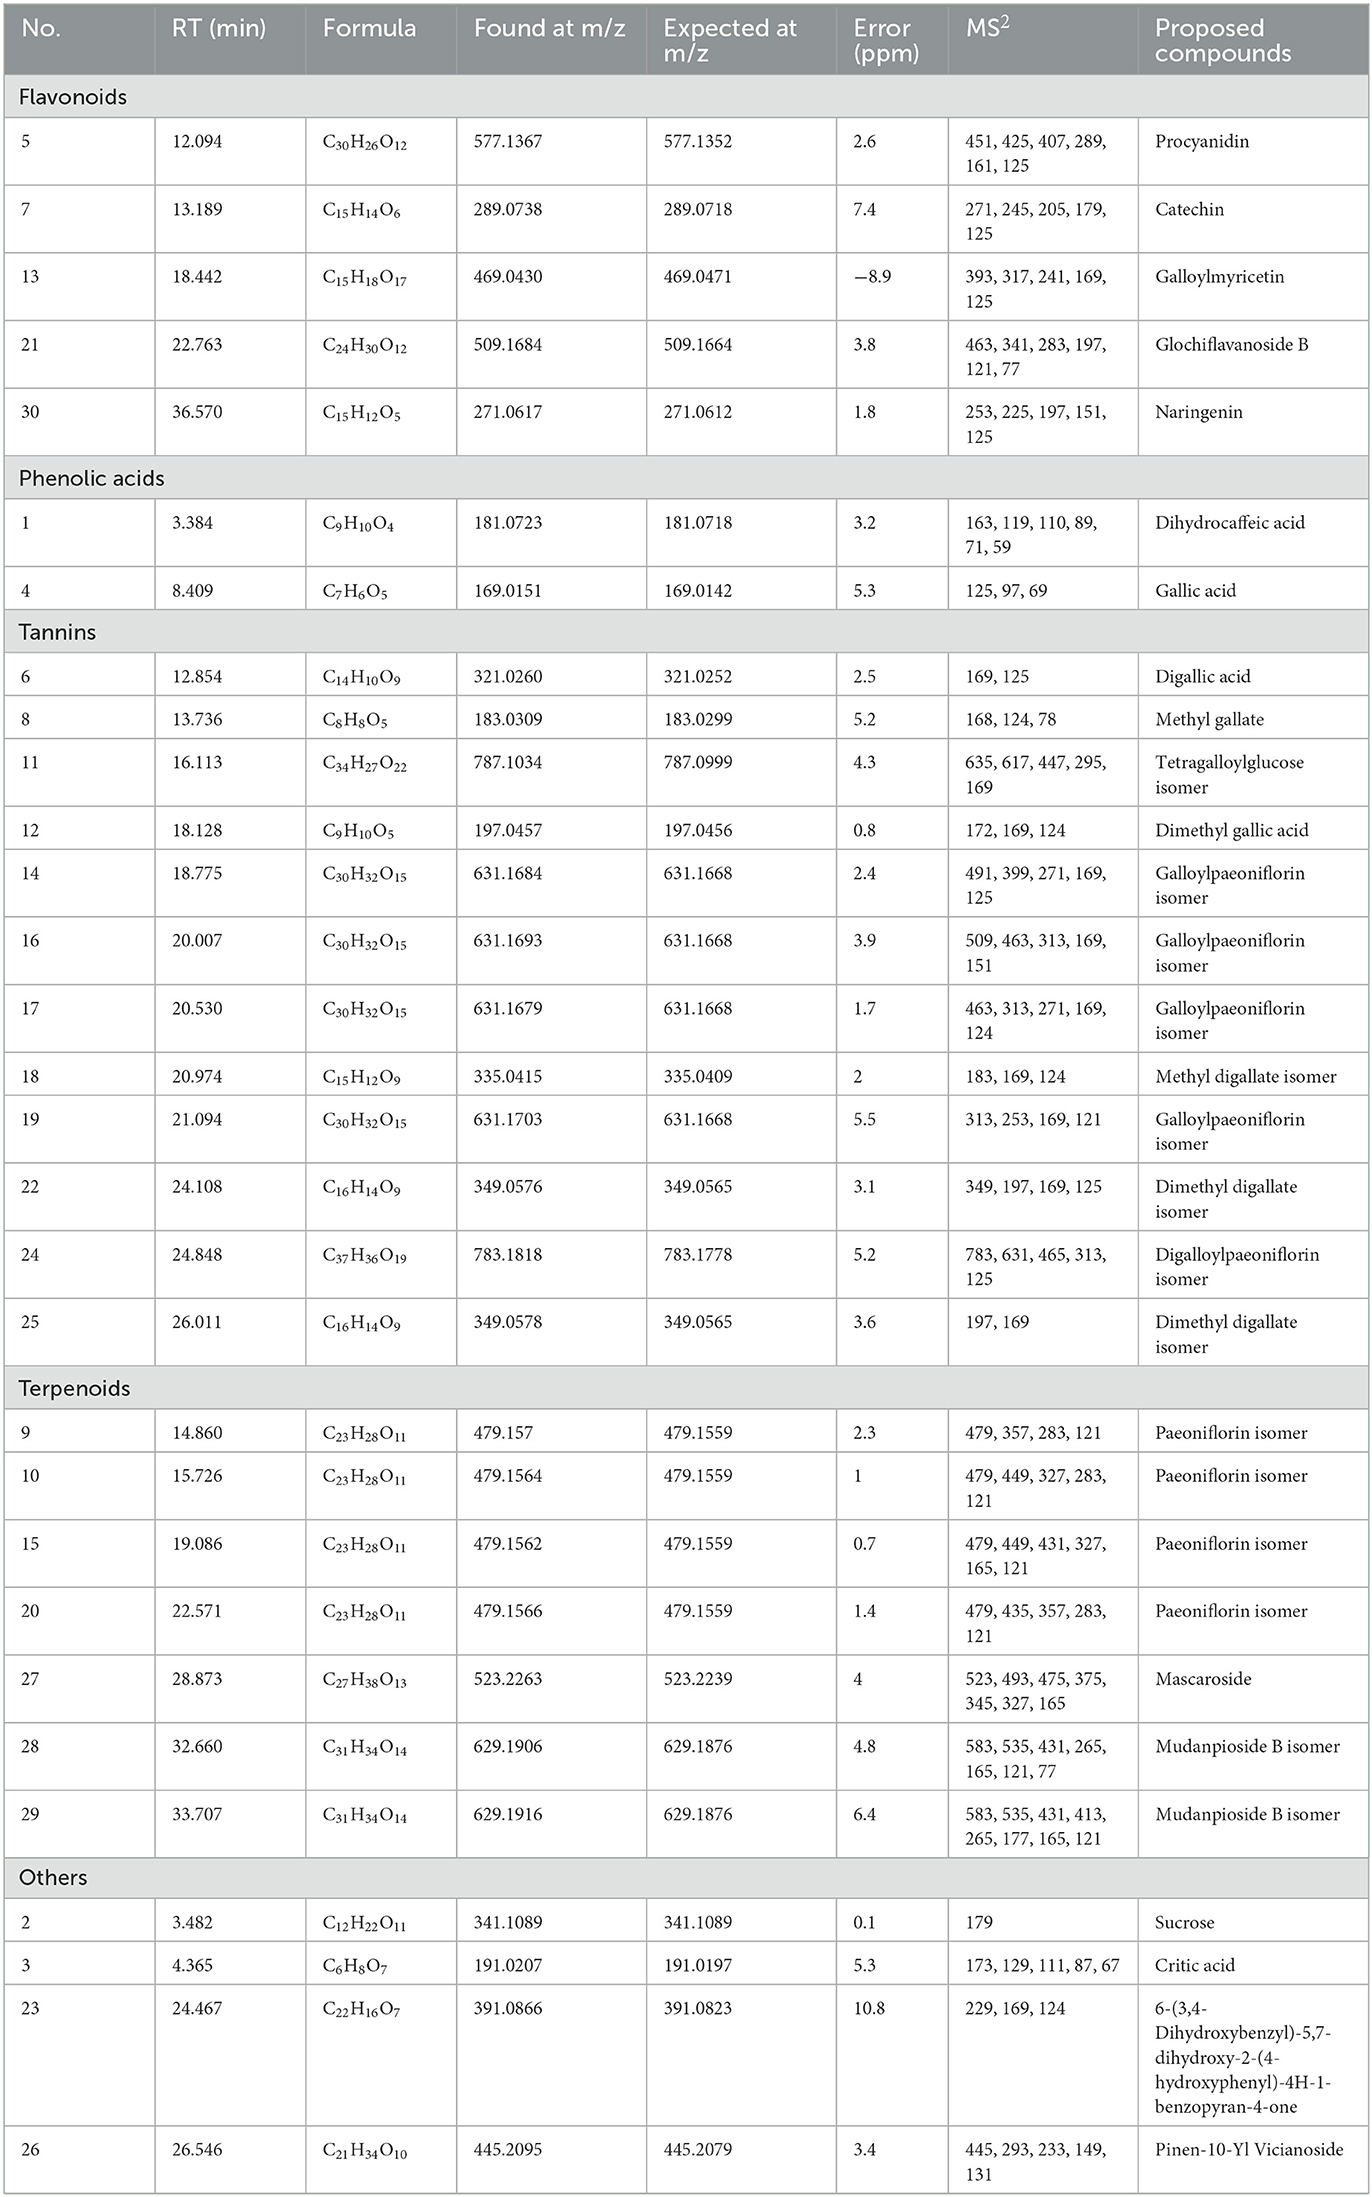
Table 2. The chromatographic and mass data of detected compounds in EAF though HPLC-QTOF-MS/MS.
3.7.1. Flavonoids
Peak 5 was assigned as the procyanidin, and the MS/MS ion at 289 implied the existence of the epicatechin residue (20). Peak 7 with MS/MS ions at 271, 245, 205, 179, and 125 accounted for the characterization of catechin (26). Peak 13 with MS/MS ions at 169, 241, and 317 displayed the loss of a galloyl moiety and myricetin, which was proposed as galloylmyricetin (26). Peak 21 was suggested as glochiflavanoside B due to the same fragment ions in the literature (27). Peak 30 was identified as naringenin based on the fragment ions at 151 ([M–C6H5O–CO]−) (28).
3.7.2. Phenolic acids
Peaks 1 and 4 were identified as dihydrocaffeic acid and gallic acid by comparing them with the standards.
3.7.3. Tannins
Gallic acid derivatives and gallotannins contain one or more galloyl moieties and showed the characteristic fragment ions at 169.0133 ([gallic acid-H]−) and 125.0232 ([gallic acid-CO2-H]−) (20). Peak 6 with the MS/MS ion at 169 was suggested as digallic acid, which was generated by the dehydration condensation of two gallic acids. Peak 8 produced the fragment ion at 168 ([M–OH]−) and 124 ([M–CO2-OH]−) and was assigned as methyl gallate. Peak 12 was suggested as dimethyl gallic acid resulting from the MS/MS ions at 169 and 172 (26). Peak 11 was identified as tetragalloylglucose, with the MS/MS ions at 617 and 169 indicating the presence of 1 and 3 galloyl moieties (29). Peaks 14, 16, 17, and 19 showed the same MS ion and molecular formula and were tentatively identified as galloylpaeoniflorin and its isomers. The MS/MS ion at 313 implied the existence of galloyl glucose, which produced an ion at 169 by losing a glucosyl residue (29). The molecular weight of peak 18 was 152 Da ([gallic acid-OH–H]−), which is higher than peak 8 and was identified as methyl digallate. Similarly, peaks 22 and 25 were considered as isomers of dimethyl digallate, which were methyl-substituted compounds of peak 18 (2). Peaks 28 and 29 with MS/MS ions at 535, 431, and 121 were proposed as mudanpioside B isomers and have been found in the genus Paeonia (30).
3.7.4. Terpenoids
Peaks 9, 10, 15, and 20 showed common MS ions at 479, which were identified as isomers of paeoniflorin (29). The MS/MS ions at 283 and 121 correspond to the loss of benzoic acid and glucose residues. Peak 27 was identified as mascaroside based on the MS/MS ions at 431, 375, 195, and 165 according to the literature (31).
3.7.5. Others
Peak 2 was identified as sucrose using the standard. Peak 3 was proposed as citric acid, and the MS/MS ion at 129 indicated the loss of the carboxyl and hydroxyl groups (31). Peak 23 with MS/MS ion at 229 indicated the presence of one phenol and three hydroxyl groups and was suggested as 6-(3,4-dihydroxybenzyl)-5,7-dihydroxy-2-(4-hydroxyphenyl)-4H-1-benzopyran-4-one (32). Peak 26 was assigned as pinen-10-Yl vicianoside by matching MS/MS ions with the report by Nöst et al. (33).
4. Discussion
Many studies found that long-term drug therapies for patients with T2D would result in various side effects and generate drug resistance, while natural plant extracts have been demonstrated as alternative therapeutic agents or supplements to treat T2D by alleviating oxidative damage and hyperglycemia (34, 35). Currently, the exploration of novel antidiabetic drugs or dietary supplements from natural products is a hotspot in the research field of T2D. RPA, as a medicinal plant and has been reported to show various biological activities like antioxidant and hypoglycemic effects, but the main active compounds are still not clear. Therefore, the aim of this study was to investigate the phytochemical composition and the antioxidant and hypoglycemic activities of RPA in vitro and in vivo.
In this study, compared with other fractions, the EAF of RPA showed the highest total phenolic content, DPPH and ABTS+ scavenging capacities, and α-glucosidase inhibition ability, which were 31.6, 9.5, 16.9, and 9.5 times higher than the crude extracts, respectively. The Pearson correlation coefficients of the TPC with α-glucosidase inhibitory and DPPH and ABTS+ scavenging activities were −0.759, −0.753, and −0.816, which indicated that phenolics may be the main antioxidants and α-glucosidase inhibitors in RPA. A previous study also found that ethyl acetate displayed a stronger enrichment effect on phenolics in two Acer palmatum cultivars than n-butanol and water, which could be explained by the similar polarities (2). You et al. (21) reported that the DPPH scavenging capacity of 50% aqueous methanol extract from RPA was lower than that of our study with an IC50 value of 310 μg/ml. Simultaneously, HPLC-QTOF-MS/MS analysis suggested that flavonoids, tannins, and terpenoids were the main compounds in RPA, which was in accordance with the report of Xiong et al. (29). Galloylmyricetin, catechin, paeoniflorin, and gallic acid and its derivatives have been demonstrated to exhibit excellent inhibition abilities on free radicals and α-glucosidase and may have contributed to the biological activities of the EAF in vitro (3, 19, 24).
Furthermore, the effect of the EAF on oxidative damage was determined by an H2O2-induced HepG2 cell oxidative damage model. After pretreatment with the EAF, the levels of MDA and ROS in HepG2 cells remarkably decreased, and the activities of SOD, CAT, GPX-Px, T-AOC, Na+/K+-ATP, and Ca2+/Mg2+-ATP obviously increased. In addition, the addition of the EAF inhibited the apoptosis of HepG2 cells induced by H2O2. The results confirmed that the EAF could alleviate oxidative stress damage in vitro. Phenolics like tannins and terpenoids have been proven to prevent oxidative damage by improving antioxidant enzymes (36), which were abundant in the EAF. Moreover, flavonoids like procyanidin could improve energy metabolism by increasing ATP synthesis (37). As studied by Yuan et al. (9), paeoniflorin suppressed oxidative stress by enhancing the SOD and CAT levels in H2O2-induced HepG2 cells, and its derivatives were found in high contents in the EAF. Hydrolyzable tannins, as dominant ingredients in the EAF, have been reported to show a modulation effect on antioxidant enzyme levels and the activities of Na+/K+- and Mg2+-ATP in erythrocyte membranes (38). It has been found that catechin could improve the antioxidant enzyme (CAT and GSH-Px) contents in vitro and in vivo and protect HepG2 cells from apoptosis caused by H2O2 (39). Crispo et al. (10) also proved that methyl gallate reduced H2O2-induced apoptosis percentage in PC12 cells. In addition, oxidative stress was highly associated with insulin resistance (IR), which may influence glucose metabolism in cells. The result indicated that the EAF significantly enhanced the glucose uptake of IR-HepG2 cells. Similarly, pretreatment with procyanidin from grape seeds significantly increased glucose consumption in HepG2 cells from 36.78 to 55.92 μmol/mg cell protein (3). Many studies have also demonstrated that catechin and gallic acid and its derivatives treatment promoted glucose consumption in IR-HepG2 cells, and paeoniflorin treatment could alleviate IR in HepG2 cells (18). Therefore, the identified bioactive compounds in the EAF greatly contributed to improving H2O2-induced HepG2 cell oxidative injury and increasing glucose uptake in IR-HepG2 cells.
Db/db mice were used as a model to further investigate the hypoglycemic effect of the EAF in vivo. After consumption of the EAF for 8 weeks, the FBG level of db/db mice declined sharply by comparison with the Mod group and showed a dosage effect. Liu et al. (40) confirmed that the ethanolic extract from peony seeds led to a decrease in the glucose level in high-fat diet-induced T2D mice and suggested the same phenomenon in our research. The OGTT results exhibited that the AUC value of the EAF400 group dropped and was 44.46% lower than that of the Mod group, which revealed that the oral administration of the EAF could regulate insulin sensitivity and glucose metabolism of T2D mice, corresponding to our result in vitro. Flavonoids, phenolic acids, tannins, and terpenoids have been proven to show excellent effects in the management of T2D in various ways (5, 36). The phenolics and terpenoids from the EAF displayed good antioxidant and α-glucosidase inhibition activities, which might effectively reduce the absorption of glucose and improve IR and lower the FBG level in diabetic mice. As reported, the catechin-enriched extract treatment reversed the FBG level in db/db mice (19). Compared with the Mod group, the FBG level and the AUC value of 30 mg/kg paeoniflorin group decreased to 3.71 mmol/L and 10.19 after treatment for 4 weeks, and 4 paeoniflorin isomers were identified in the EAF. Based on the above results, it can be concluded that the EAF had a strong hypoglycemic effect in vitro and in vivo.
5. Conclusion
The EAF, as the best bioactive fraction from RPA extracts, could effectively scavenge free radicals, protect oxidative stress injury, enhance glucose uptake, and decrease hyperglycemia, which were attributed to the higher TPC (844.83 mgGAE/g) and components like flavonoids, phenolic acids, tannins, and terpenoids. The ability of the EAF to scavenge DPPH and ABTS+ and suppress α-glucosidase was higher than that of the corresponding standard (Vc and acarbose). The EAF treatment alleviated oxidative damage in HepG2 cells caused by H2O2 by increasing the SOD and CAT enzyme levels and reducing the production of MDA and ROS. In addition, the Na+/K+-ATP and Ca2+/Mg2+-ATP enzyme levels and cell apoptosis were also improved by the EAF. When the concentration reached 50 and 100 μg/ml, the EAF effectively increased the glucose uptake of IR-HepG2 cells. Here, a strong ability to decelerate FBG levels (from 29.98 to 14.76 mmol/L) in db/db mice was found at the gavage dose of the EAF 400 mg/kg/day. Therefore, the present study reveals that EAF has a great potential for development as a natural drug or a dietary supplement for the treatment of T2D.
Data availability statement
The original contributions presented in the study are included in the article/supplementary material, further inquiries can be directed to the corresponding authors.
Ethics statement
All animal procedures were approved by the Institutional Animal Care and Use Committee at Hunter Biotechnology, Inc. [Approval number: IACUC-2020-2574-01, Use license number: SYXK (zhe) 2022-0004]. The feeding and management were accredited by the Association for Assessment and Accreditation of Laboratory Animal Care (AAALAC) International (No. 001458).
Author contributions
LZ: methodology, supervision, writing—review and editing, funding acquisition, and project administration. C-yP: investigation, validation, formal analysis, and writing. P-xW: methodology, investigation, and original draft. LX: software, investigation, and statistical analysis. J-hL: investigation and validation. XX: investigation and writing—review and editing. LL: investigation and methodology. Z-cT: conceptualization, supervision, and funding acquisition. All authors contributed to the article and approved the submitted version.
Funding
This research was supported by the Natural Science Foundation of Jiangxi Province (20212BAB205017) and National Natural Science Foundation of China (31860475).
Conflict of interest
LZ and LL were employed by Jiangxi Deshang Pharmaceutical Co., Ltd., Yichun, Jiangxi, China.
The remaining authors declare that the research was conducted in the absence of any commercial or financial relationships that could be construed as a potential conflict of interest.
Publisher's note
All claims expressed in this article are solely those of the authors and do not necessarily represent those of their affiliated organizations, or those of the publisher, the editors and the reviewers. Any product that may be evaluated in this article, or claim that may be made by its manufacturer, is not guaranteed or endorsed by the publisher.
References
1. Alam S, Hasan MK, Neaz S, Hussain N, Hossain MF, Rahman T. Diabetes mellitus: insights from epidemiology, biochemistry, risk factors, diagnosis, complications and comprehensive management. Diabetology. (2021) 2:36–50. doi: 10.3390/diabetology2020004
2. Zhang L, Tu ZC, Xie X, Lu Y, Wang ZX, Wang H, et al. Antihyperglycemic, antioxidant activities of two acer palmatum cultivars, and identification of phenolics profile by UPLC-QTOF-MS/MS: new natural sources of functional constituents. Ind Crop Prod. (2016) 89:522–32. doi: 10.1016/j.indcrop.2016.06.005
3. Zhang HJ, Ji BP, Chen G, Zhou F, Luo YC, Yu HQ, et al. A combination of grape seed-derived procyanidins and gypenosides alleviates insulin resistance in mice and HepG2 cells. J Food Sci. (2009) 74:1–7. doi: 10.1111/j.1750-3841.2008.00976.x
4. Huang ZR, Huang QZ, Chen KW, Huang ZF, Liu Y, Jia RB, et al. Sanghuangporus vaninii fruit body polysaccharide alleviates hyperglycemia and hyperlipidemia via modulating intestinal microflora in type 2 diabetic mice. Front Nutr. (2022) 9:1013466. doi: 10.3389/fnut.2022.1013466
5. Egbuna C, Awuchi CG, Kushwaha G, Rudrapal M, Patrick KC, Singh O, et al. Bioactive compounds effective against type 2 diabetes mellitus: a systematic review. Curr Top Med Chem. (2021) 21:1067–95. doi: 10.2174/18734294MTE1ENjAgx
6. Argaev FL, Rosenzweig T. Complexity of NAC action as an antidiabetic agent: opposing effects of oxidative and reductive stress on insulin secretion and insulin signaling. Int J Mol Sci. (2022) 23:2965–87. doi: 10.3390/ijms23062965
7. Carlos PA, Javier RG, Pablo P, Marcelo SM, Bastián VG, Cristián CB, et al. Exercise and oxidative stress in type 2 diabetes mellitus. Int J Mol Sci. (2018) 146:362–72. doi: 10.4067/s0034-98872018000300362
8. Habtemariam S. Modulation of reactive oxygen species in health and disease. Antioxidants. (2019) 8:513–7. doi: 10.3390/antiox8110513
9. Yuan J, Lu Y, Wang H, Feng Y, Jiang S, Gao XH, et al. Paeoniflorin resists H2O2-induced oxidative stress in melanocytes by JNK/Nrf2/HO-1 pathway. Front Pharmacol. (2020) 11:536–47. doi: 10.3389/fphar.2020.00536
10. Crispo JA, Piche M, Ansell DR, Eibl JK, Tai IT, Kumar A, et al. Protective effects of methyl gallate on H2O2-induced apoptosis in PC12 cells. Biochem Bioph Res Co. (2010) 393:773–8. doi: 10.1016/j.bbrc.2010.02.079
11. Pisoschi AM, Pop A, Iordache F, Stanca L, Predoi G, Serban AI. Oxidative stress mitigation by antioxidants an overview on their chemistry and influences on health status. Eur J Med Chem. (2021) 209:112891–943. doi: 10.1016/j.ejmech.2020.112891
12. Wang L, Xie Y, Yang W, Yang Z, Jiang S, Zhang C, et al. Alfalfa polysaccharide prevents H2O2-induced oxidative damage in MEFs by activating MAPK/Nrf2 signaling pathways and suppressing NF-kappaB signaling pathways. Sci Rep. (2019) 9:1782–93. doi: 10.1038/s41598-018-38466-7
13. Wang S, Xu J, Wang C, Li J, Wang Q, Kuang H, et al. Paeoniae radix alba polysaccharides obtained via optimized extraction treat experimental autoimmune hepatitis effectively. In J Biol Macromol. (2020) 164:1554–64. doi: 10.1016/j.ijbiomac.2020.07.214
14. Zhang D, Yang B, Chang SQ, Ma SS, Sun JX, Yi L, et al. Protective effect of paeoniflorin on H2O2 induced Schwann cells injury based on network pharmacology and experimental validation. Chin J Nat Med. (2021) 19:90–9. doi: 10.1016/S1875-5364(21)60010-9
15. Xu XX, Qi XM, Zhang W, Zhang CQ, Wu XX, Wu YG, et al. Effects of total glucosides of paeony on immune regulatory toll-like receptors TLR2 and 4 in the kidney from diabetic rats. Phytomedicine. (2014) 21:815–23. doi: 10.1016/j.phymed.2013.12.003
16. Parker S, May B, Zhang C, Zhang AL, Lu C, Xue CC, et al. pharmacological review of bioactive constituents of Paeonia lactiflora pallas and Paeonia veitchii lynch. Phytother Res. (2016) 30:1445–73. doi: 10.1002/ptr.5653
17. Zhang L, Tu ZC, Yuan T, Wang H, Xie X, Fu ZF. Antioxidants and a-glucosidase inhibitors from Ipomoea batatas leaves identified by bioassay-guided approach and structure-activity relationships. Food Chem. (2016) 208:61–88. doi: 10.1016/j.foodchem.2016.03.079
18. Ma Y, Meng A, Dai Y, Yang H, Huang Y, Liu X, et al. Hypoglycemic activity of phenols from Pleioblastus amarus (Keng) shells and its main chemical constituents identificatied using UHPLC-Q-TOF-MS. J Funct Food. (2022) 97:105261–70. doi: 10.1016/j.jff.2022.105261
19. Wein S, Schrader E, Rimbach G, Wolffram S. Oral green tea catechins transiently lower plasma glucose concentrations in female db/db mice. J Med Food. (2013) 16:312–7. doi: 10.1089/jmf.2012.0205
20. Li Z, Tu ZC, Wang H, Zhang L. Ultrasound-assisted extraction optimization of alpha-glucosidase inhibitors from Ceratophyllum demersum L. and identification of phytochemical profiling by HPLC-QTOF-MS/MS. Molecules. (2020) 25:4507–28. doi: 10.3390/molecules25194507
21. You G, Li C, Mao Y, Ren X, Liu Y, Wang M, et al. comparative analysis of raw and processed Radix Paeoniae Alba samples using HPLC, chemometrics, and antioxidant activity. Biomed Chromatogr. (2020) 34:e4901–10. doi: 10.1002/bmc.4901
22. Ming Y, Dong H. The molecular mechanism of compatibility of achyranthes bidentata and Radix Paeoniae Alba mediating antioxidant damage. Indian J Pharm Scll. (2022) 84:20–25. doi: 10.36468/pharmaceutical-sciences.spl.407
23. Yu L, Yang J, Wang X, Jiang B, Sun Y, Ji Y. Antioxidant and antitumor activities of Capparis spinosa L. and the related mechanisms. Oncol Rep. (2017) 37:357–67. doi: 10.3892/or.2016.5249
24. Nabila B, Katarzyna KG, Krzysztof M, Lynda B, Anna K. Laurus nobilis ethanolic extract attenuates hyperglycemia and hyperinsulinemia-induced insulin resistance in HepG2 cell line through the reduction of oxidative stress and improvement of mitochondrial biogenesis: possible implication in pharmacotherapy. Mitochondrion. (2021) 59:190–213. doi: 10.1016/j.mito.2021.06.003
25. Zhao W, Chen L, Zhou H, Deng C, Han Q, Chen Y, et al. Protective effect of carvacrol on liver injury in type 2 diabetic db/db mice. Mol Med Rep. (2021) 24:741–52. doi: 10.3892/mmr.2021.12381
26. Li C, Seeram NP. Ultra-fast liquid chromatography coupled with electrospray ionization time-of-flight mass spectrometry for the rapid phenolic profiling of red maple (Acer rubrum) leaves. J Sep Sci. (2018) 41:2331–46. doi: 10.1002/jssc.201800037
27. Otsuka H, Hirata E, Shinzato T, Takeda Y. Glochiflavanosides A-D: flavanol glucosides from the leaves of glochidion zeylanicum (Gaertn) A juss. Chem Pharm Bull. (2001) 49:921–3. doi: 10.1248/cpb.49.921
28. Zengin G, Mahomoodally MF, Paksoy MY, Picot-Allain C, Glamocilja J, Sokovic M, et al. Phytochemical characterization and bioactivities of five apiaceae species: natural sources for novel ingredients. Ind Crop Prod. (2019) 135:107–21. doi: 10.1016/j.indcrop.2019.04.033
29. Xiong P, Qin S, Li K, Liu M, Zhu L, Peng J, et al. Identification of the tannins in traditional chinese medicine Paeoniae Radix Alba by UHPLC-Q-Exactive Orbitrap MS. Ara J Chem. (2021) 14:103398–412. doi: 10.1016/j.arabjc.2021.103398
30. He C, Peng B, Dan Y, Peng Y, Xiao P. Chemical taxonomy of tree peony species from China based on root cortex metabolic fingerprinting. Phytochemistry. (2014) 107:69–79. doi: 10.1016/j.phytochem.2014.08.021
31. Wang X, Zhong XJ, Zhou N, Cai N, Xu JH, Wang QB, et al. Rapid characterizaiton of chemical constituents of the tubers of Gymnadenia conopsea by UPLC-Orbitrap-MS/MS analysis. Molecules. (2020) 25:898–917. doi: 10.3390/molecules25040898
32. Li MC, Yao Z, Takaishi Y, Tang SA, Duan HQ. Isolation of novel phenolic compounds with multidrug resistance (MDR) reversal properties from Onychium japonicum. Chem Bio. (2011) 8:1112–20. doi: 10.1002/cbdv.201000224
33. Nöst X, Pferschy-Wenzig EM, Nikles S, He X, Fan D, Lu A, et al. Identification of constituents affecting the secretion of pro-inflammatory cytokines in LPS-Induced U937 cells by UHPLC-HRMS-based metabolic profiling of the traditional Chinese medicine formulation Huangqi Jianzhong Tang. Molecules. (2019) 24:3116–43. doi: 10.3390/molecules24173116
34. Jugran AK, Rawat S, Devkota HP, Bhatt ID, Rawal RS. Diabetes and plant-derived natural products: from ethnopharmacological approaches to their potential for modern drug discovery and development. Phytother Res. (2021) 35:223–45. doi: 10.1002/ptr.6821
35. Jia RB, Wu J, Luo D, Lin L, Chen C, Xiao C, et al. The beneficial effects of two polysaccharide fractions from Sargassum fusiform against diabetes mellitus accompanied by dyslipidemia in rats and their underlying mechanisms. Foods. (2022) 11:1416. doi: 10.3390/foods11101416
36. Zhang H, Tsao R. Dietary polyphenols, oxidative stress and antioxidant and anti-inflammatory effects. Curr Opin Food Sci. (2016) 8:33–42. doi: 10.1016/j.cofs.2016.02.002
37. Skemiene K, Liobikas J, Borutaite V. Anthocyanins as substrates for mitochondrial complex I: protective effect against heart ischemic injury. FEBS J. (2015) 282:963–71. doi: 10.1111/febs.13195
38. Yang B, Liu P. Composition and biological activities of hydrolyzable tannins of fruits of Phyllanthus emblica. J Agr Food Chem. (2014) 62:529–41. doi: 10.1021/jf404703k
39. Singh BN, Shankar S, Srivastava RK. Green tea catechin, epigallocatechin-3-gallate (EGCG): mechanisms, perspectives and clinical applications. Biochem Pharmacol. (2011) 82:1807–21. doi: 10.1016/j.bcp.2011.07.093
Keywords: Radix Paeoniae Alba, hypoglycemic activity, polyphenols, HPLC-QTOF-MS/MS, oxidative stress
Citation: Zhang L, Peng C-y, Wang P-x, Xu L, Liu J-h, Xie X, Lu L and Tu Z-c (2023) Hypoglycemic and H2O2-induced oxidative injury protective effects and the phytochemical profiles of the ethyl acetate fraction from Radix Paeoniae Alba. Front. Nutr. 10:1126359. doi: 10.3389/fnut.2023.1126359
Received: 17 December 2022; Accepted: 31 January 2023;
Published: 24 February 2023.
Edited by:
Rui-Bo Jia, South China University of Technology, ChinaReviewed by:
Wenduo Wang, Guangdong Ocean University, ChinaChuqiao Xiao, South China University of Technology, China
Bingwu Liao, Shihezi University, China
Copyright © 2023 Zhang, Peng, Wang, Xu, Liu, Xie, Lu and Tu. This is an open-access article distributed under the terms of the Creative Commons Attribution License (CC BY). The use, distribution or reproduction in other forums is permitted, provided the original author(s) and the copyright owner(s) are credited and that the original publication in this journal is cited, in accordance with accepted academic practice. No use, distribution or reproduction is permitted which does not comply with these terms.
*Correspondence: Xing Xie,  MTM2MDkwOTI1MzdAMTYzLmNvbQ==; Zong-cai Tu, dHV6Y19tYWlsQGFsaXl1bi5jb20=