- 1State Key Laboratory of Chemical Engineering, East China University of Science and Technology, Shanghai, China
- 2Department of Molten Salt Chemistry and Engineering, Shanghai Institute of Applied Physics, Chinese Academy of Sciences, Shanghai, China
- 3Department of Tritium Science and Engineering, Shanghai Institute of Applied Physics, Chinese Academy of Sciences, Shanghai, China
Geographical traceability is crucial to the quality and safety control of gelatin. However, currently, methods for gelatin traceability have not been established anywhere in the world. This study aimed to investigate the possibility of differentiating the geographical origins of gelatin from different regions in China using stable isotope technology. To achieve this objective, 47 bovine stick bone samples from three different regions (Inner Mongolia, Shandong, and Guangxi, respectively) in China were collected, and gelatin was extracted from these bones using the enzymatic method. The fingerprint characteristics of stable isotopes of δ13C, δ15N, and δ2H of gelatin from different regions in China were studied. Moreover, isotopic changes from the bone to gelatin during the processing were examined to evaluate the effectiveness of these factors as origin indicators. The results of the one-way analysis of variance (ANOVA) showed that the δ13C, δ15N, and δ2H of gelatin from different regions display significant differences, and using the linear discriminant analysis (LDA), the correct differentiation of origin reached 97.9%. Certain differences in stable isotope ratios were observed during the processing of bone to gelatin samples. Nonetheless, the fractionation effect caused by the processing of bone to gelatin samples was not sufficient to influence the identification of gelatin from different origins, which proves that δ13C, δ15N, and δ2H are effective origin indicators of gelatin. In conclusion, the stable isotope ratio analysis combined with the chemometric analysis can be used as a reliable tool for identifying gelatin traceability.
1. Introduction
Gelatin, a natural polymer extracted from the bones, skin, or connective tissue of animals, has been widely used in food, pharmaceuticals, cosmetics, and other industries due to its distinctive physicochemical property (1, 2). In recent years, a variety of gelatin safety incidents, such as animal epidemics, mislabeling, and adulteration, have occurred frequently, and consumers have increasingly focused on the origins of gelatin. Thus, laws and regulations were promulgated in many countries to regulate the sources of gelatin (3). However, related studies on the methods differentiating the origins of gelatin from different regions are limited at present. It is difficult for the government to ensure effective supervision of the source of gelatin, which not only greatly compromises public health and life safety but also highly restricts the development of the gelatin industry. Therefore, an effective method is urgently required to trace the geographical origins of gelatin.
Recently, various methods, such as stable isotope ratio analysis (4, 5), mineral element analysis (6), fatty acid analysis (7), near-infrared spectroscopy (NIRS) (8–10), high-performance liquid chromatography (HPLC) (11), mass spectroscopy (MS) (12), and DNA-based technology (13, 14), have been applied to origin traceability and authentication of animal-derived products (15). However, these methods have a few shortcomings. For instance, the processing cost and experimental operation requirements of mineral element analysis are high. The sample pretreatment time for fatty acid analysis is prolonged, and is easily affected by feed, genetics, variety, and processing. The sensitivity of near-infrared spectroscopy is not high, and its data processing is difficult. HPLC has a limited capacity for qualitative determination and makes considerable use of hazardous solvents that are toxic to human health. The DNA-based technique requires numerous samples, and it is challenging to select effective molecular markers. At present, stable isotope ratio analysis is considered a more accurate and quicker method and has become the most commonly used technology for validating the traceability and authenticity of animal-derived foods. Geographical origins of some animal-derived products, such as meat, dairy products, seafood, and honey, were successfully traced using stable isotope ratio analysis (16–19). Meanwhile, research on the transformation law of stable isotopes from raw material to the terminal product during processing has also been carried out (20–22), which can further provide theoretical support for animal-derived product traceability.
Many studies on gelatin focused on species identification, and there are few related studies on traceability methods for gelatin are available at present. Jannat et al. successfully differentiated bovine, porcine, and fish sources of gelatin in commercially pure gelatin and gelatin-containing food and drug products using real-time polymerase chain reaction (PCR) and the analysis of mass spectrometry (MS)-based proteomic datasets (23). Sha et al. successfully identified fish gelatins in seven commercial cyprinid fishes using high-performance liquid chromatography (HPLC) and high-resolution mass spectrometry (HRMS) (24). Cai et al. presented a new strategy for the simultaneous rapid identification and quantification of gelatins from various species using ultrasound-assisted digestion-ultra-high performance liquid chromatography-tandem mass spectrometry (UPLC-MS/MS) (25). In our previous study, Jiang et al. successfully traced the origin of bone materials of gelatin in China using stable isotope analysis and mineral element analysis (26).
Based on the aforementioned studies, stable isotope ratio analysis coupled with chemometric analysis was first used to trace the geographical origin of gelatin in this study. The key aim of this study was to explore the regional differences in stable isotopes in gelatin from China and develop a reliable identification method. In addition, changes in δ13C, δ15N, and δ2H from bone raw materials to gelatin during processing were also investigated to evaluate their effectiveness as geographical origin indicators. The results of the present study will provide a new idea and strategy for the origin traceability of gelatin.
2. Materials and methods
2.1. Sample information
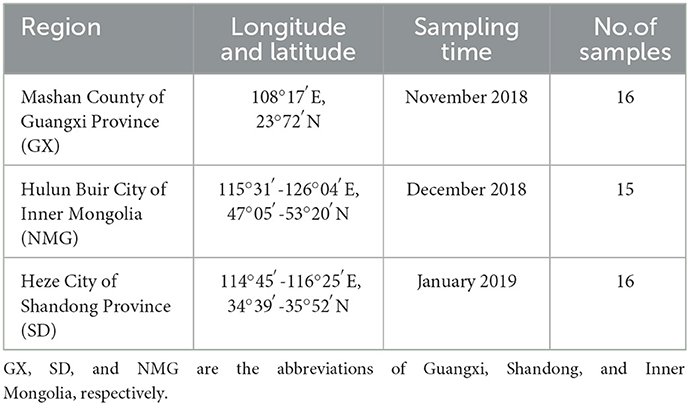
A total of 47 bovine stick bone samples were sampled from three representative regions of China, including Mashan County of Guangxi Province (GX), Heze City of Shandong Province (SD), and Hulun Buir City of Inner Mongolia (NMG) (Table 1). Defatted bovine granules (d <20 mm) were obtained using the conventional method (26) and then stored in a dryer.
2.2. Experimental methods
2.2.1. Bone gelatin extraction
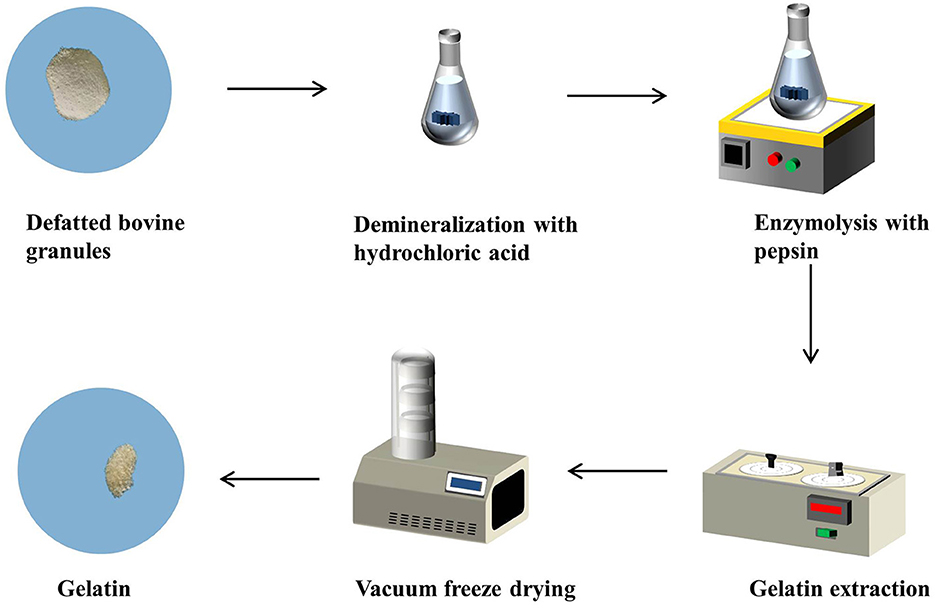
Gelatin was extracted from defatted bovine granules using the enzymatic method (27), as shown in Figure 1. Defatted bovine granules were soaked in 1 M hydrochloric acid (HCl) (Sinopharm Chemical Reagent Co., Ltd., Shanghai, China) at 25°C for 3 h with continuous shaking at the solid-to-solvent ratio of 1:9 (w/v). The mixture was washed until a neutral or faintly basic mixture was obtained and dried at 65°C for 12 h to obtain defatted demineralized bovine granules. Then, the defatted demineralized bovine granules were mixed with pepsin at 40 U/g, deionized water (Millipore Milli-Q Advantage A10 Water Purification System, Millipore, USA) was added at the ratio of 1:9 (w/v) and adjusted to pH 2, and then the mixture was stirred for 3 h at 25°C. Subsequently, the mixture was washed with deionized water and adjusted to pH 5 to ensure that no pepsin remained in the mixture. Later, the pretreated bovine granules were mixed with deionized water at a ratio of 1:2 (w/v) and adjusted to pH 5 to extract the gelatin at 60°C for 3 h with continuous stirring; the gelatin extracted solution was obtained through centrifugation. Finally, the obtained solution was dried to 5 mL at 50°C in an oven (DHG-9140 A, Shanghai Huitai Instrument Manufacturing Co., Ltd., Shanghai, China) and vacuum freeze-dried (HXLG-10-50B, Shanghai Huxi Industrial Co., Ltd., Shanghai, China) for 3 days to obtain solid gelatin samples.
2.2.2. Characterization of bovine gelatin
2.2.2.1. Ultraviolet (UV) spectrum
Ultraviolet spectra of gelatin samples were obtained using a Hitachi U-3900 spectrophotometer (Hitachi Co., Ltd., China). Gelatin samples were dissolved in 0.5 M acetic acid to form a mixed solution at room temperature. The spectra were obtained at a resolution of 4 cm−1, and the measurement range varied between 800 and 200 cm−1.
2.2.2.2. Fourier transform infrared (FTIR) spectra
The FTIR spectrum (Bruker Optics TENSOR 27 FT-IR Spectrometer, Bruker Optics Inc., Billerica, MA, USA) of gelatin samples was recorded using the tablet method. Briefly, the bovine gelatin samples were mixed and ground with potassium bromide (KBr) in the ratio of 1:100 to make a tablet; the spectra were obtained at a resolution of 4 cm−1 and the measurement range varied between 400 and 4,000 cm−1. Automatic signals were collected in 32 scans at a resolution of 4 cm−1.
2.2.3. Stable isotope ratio analysis
Stable isotope ratios were determined using an Elemental Analyzer (EA) (Flash 2000 HT, Thermo Fisher Scientific, USA) connected to an Isotope Ratio Mass Spectrometer (IRMS) (Delta V MAT 253, Thermo Fisher Scientific, USA). IAEA-600 (δ13C = −27.771 ± 0.043‰ VPDB, δ15N = 1.0 ± 0.2‰ air N2), USGS24 (δ13CVPDB = −16.05 ± 0.07‰), USGS42 (δ15Nair = 8.05 ± 0.10‰, δ2HVSMOW = −72.9 ± 2.2‰), and USGS43 (δ2HVSMOW = −44.4 ± 2.0‰) were performed to calibrate the stable isotope data.
For the δ13C and δ15N analysis, appropriate amounts of gelatin samples were weighed into tin capsules and placed into the EA using an autosampler. Carbon and nitrogen in the sample were converted into carbon dioxide (CO2) and nitrogen gas (N2) in an oxidation–reduction furnace at 980°C, and then, the gases were separated using the gas chromatography (GC) before being sent to the IRMS for analysis.
For the δ2H analysis, appropriate amounts of gelatin samples were weighed into silver capsules and introduced into the EA using the autosampler. Hydrogen in the sample was converted into molecular hydrogen gas (H2) in a pyrolysis furnace at 1,380°C, and then, the gases were separated using the GC before being sent to the IRMS for analysis.
Stable isotopic ratios (13C/12C, 15N/14N, and 2H/1H) were expressed in δ notation in parts per thousands (‰) and were calculated using the following equation:
where Rsample is the isotope ratio of the sample and Rstandard is the isotope ratio of the international reference material.
2.3. Statistical analysis
The data were analyzed using SPSS 24.0. A post-hoc Duncan's test of a one-way analysis of variance (ANOVA) was performed to determine significant differences between the mean values of gelatin samples from different regions (p < 0.05) (28). A paired sample t-test and Pearson's correlation analysis were, respectively, used to analyze the variability and correlation in δ13C, δ15N, and δ2H from bone to gelatin samples during processing to evaluate the effectiveness of these factors as geographical origin indicators (p < 0.01) (20, 29). The linear discriminant analysis (LDA) was used to establish a classification model, and its performance was assessed using cross-validation (30).
3. Results and discussion
3.1. UV spectra
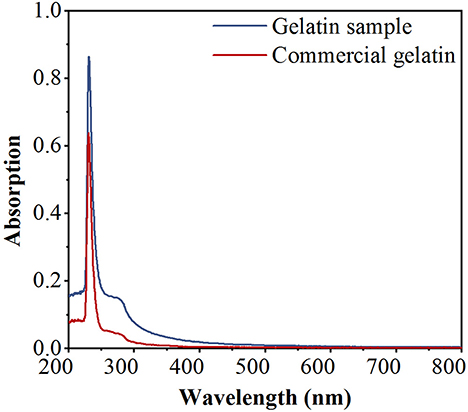
The UV spectra of the gelatin sample (GS) and commercial gelatin (CG) (Shanghai Titan Technology Co., Ltd., Shanghai, China) are depicted in Figure 2. The GS is highly similar to the CG in the spectra. The absorption peak was recorded at 220–240 nm and was mostly associated with the presence of peptide bonds in the polypeptide chains of gelatin. Compared to CG, GS has a small hump at 270–280 nm, which may have been caused by a few aromatic residues, such as phenylalanine, tyrosine, and tryptophan (31). As the two substances show similar spectra, GS is likely to be gelatin.
3.2. FTIR spectra
The FTIR spectra were used to analyze the functional groups and secondary structure of gelatin. As shown in Figure 3, both GS and CG show four infrared (IR) peaks in their spectra, representing amide-A, amide-I, amide-II, and amide-III, respectively. The amide-A band is associated with the NH stretching vibration coupled with hydrogen bonding at the wavenumbers of 3,400–3,440 cm−1 (32). The amide-I band is assigned to the C=O stretching vibration coupled to contributions from the CN stretch, CCN deformation, and in-plane NH bending modes, ranging from 1,600 to 1,700 cm−1 (33). The amide-II band is attributed to the combination of the NH in-plane bend and the CN stretching vibration in the range of 1,500–1,560 cm−1 (34). The amide-III band appears at 1,200–1,300 cm−1, due to CN stretching, NH in-plane bending, and wagging vibrations from the CH2 groups (35). Amide-A, amide-I, amide-II, and amide-III of GS and CG are found at 3,415.76, 3,415.76, 1,617.23, 1,617.23, 1,559.37, 1,558.41, 1,384.82, 1,385.79 cm−1, respectively. Amide-III of GS and CG is shifted to a higher wavenumber, indicating an increased random coil or disordered structure in gelatin (32). Similar peak locations appear for both GS and CG within the reasonable wavenumber range of these peaks, and the striking similarity of the GS and CG peak locations suggests that their secondary structures are similar. Combined with the UV spectra, it can be considered that the GS extracted from defatted bovine granules is gelatin.
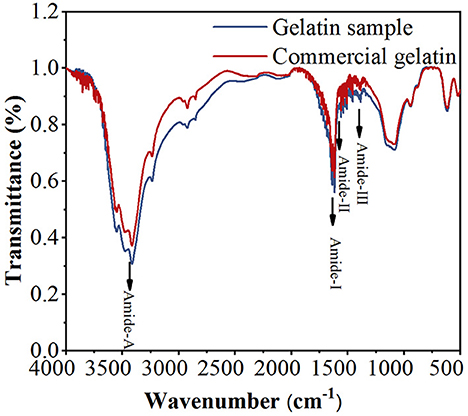
Figure 3. Fourier transform infrared (FTIR) spectra of the gelatin sample (GS) and commercial gelatin (CG).
3.3. Stable isotope ratio analysis
Three stable isotope ratios (δ13C, δ15N, and δ2H) and the distribution characteristics of gelatin samples from the three different regions in China are given in Table 2 and Figure 4. According to the results of the ANOVA and three-dimensional (3D) scatter plot of δ13C, δ15N, and δ2H in the three regions, the stable isotope ratios are significantly different (P < 0.05) in gelatin samples from the regions.

Table 2. A comparison of the mean δ13C, δ15N, and δ2H values and standard deviations of the gelatin samples from three regions.
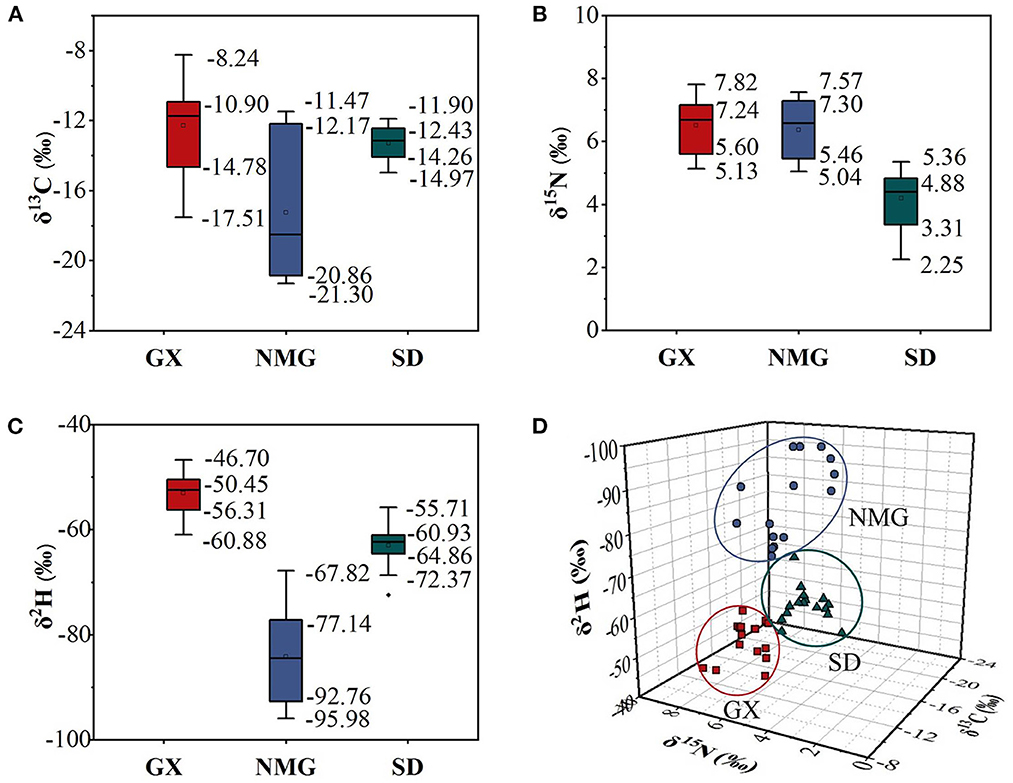
Figure 4. Boxplots of δ13C (A), δ15N (B), and δ2H (C) values in gelatin samples from different regions. (D) Three-dimensional (3D) scatter plots of δ13C, δ15N, and δ2H in three regions.
The δ13C of animal products is primarily related to animal feed, particularly the ratio of C3 or C4 plants (29). In this study, NMG has the lowest δ13C (−17.25 ± 4.04‰) value in gelatin samples compared to GX (−12.27 ± 2.63‰) and SD (−13.27 ± 0.98‰). In a previous report, the δ13C values of milk samples from Inner Mongolia were also significantly lower than those from Tianjin, Hebei, and Jiangsu (19). The two substances show a similar tendency. This may be because Inner Mongolia has large areas of C3 pasture available as the primary fodder source. Another reason for the difference in δ13C values between the two may be because of species differences. Guangxi is located in southwest China, which is suitable for C3 and C4 pasture growing. The cattle from Guangxi are mainly fed C3 and C4 pasture, but C4 pasture is the dominant type. Shandong is located in Eastern China, where wheat and maize are the main products. In the majority of feed given to the cattle, there is a mixture of wheat and maize, with a high proportion of maize. Some studies showed that animals fed C3 plants (e.g., wheat) have lower δ13C in their tissues than those fed C4 plants (e.g., maize) (36). Thus, the δ13C values in gelatin samples from NMG are significantly lower than those in the other two regions.
The δ15N in animal products is closely linked to the diet consumed by the animals and the regions of their habitat (37). In the present study, the δ15N values in gelatin samples from SD (4.20 ± 0.91‰) are significantly lower than those in NMG (6.38 ± 0.91‰) and GX (6.52 ± 0.88‰). This may be due to the cattle from SD being mainly fed maize but the cattle from NMG and GX being mainly fed pasture. During the growing process, maize uses more chemical fertilizers, while pasture uses more organic fertilizers, which are then transferred to the cattle through feed. Compared to organic fertilizers, chemical fertilizers are depleted in δ15N (38). Therefore, the δ15N values of gelatin in SD are lower than those of the other two regions.
The δ2H values of animal products are affected by drinking water and animal feed, which are related to latitude, altitude, and distance from the sea (28). In our study, the δ2H values of gelatin are −84.19 ± 8.76‰ in NMG, −62.94 ± 3.97‰ in SD, and −52.98 ± 3.90‰ in GX, indicating a significant difference. Jiang et al. also found that the δ2H values of bone samples from Inner Mongolia, Shandon, and Guangxi were in the order of NMG <SD <GX (26). Similar trends appear for both substances. This may be due to NMG having the highest altitude and GX having the lowest altitude among the three regions. The δ2H values decrease with increasing latitude, altitude, and distance from the sea, so the δ2H values are in the order of NMG <SD <GX.
A significant difference can be noticed in the δ13C, δ15N, and δ2H values in gelatin samples from different regions. Therefore, δ13C, δ15N, and δ2H can be good indicators for the traceability of gelatin.
3.4. Difference between gelatin and bone samples
All the data on bone samples are gathered from an article published by our research group (26). Table 3 shows the mean δ13C, δ15N, and δ2H values and standard deviations in the gelatin samples and bone raw materials from different regions. In this study, the δ13C values in gelatin samples are slightly higher than those in bone samples, indicating that δ13C gets enriched during processing from bone to gelatin, which may be related to the acidification effect. The δ13C values were lower when acidification eliminated the 13C-enriched carbonate. The δ15N values showed no significant variations. In a previous study, Tomaszewicz et al. found that acidification had a minimal effect on the δ13C values, reducing marine turtle bone samples by <1‰, and acidification did not affect the δ15N values of the milled bone powder, which shows trends similar to the results of our study (39). The δ2H values show significant differences, suggesting that the δ2H values are significantly affected by processing. Because of the complexity of processing, this aspect needs to be further studied.

Table 3. A comparison of the mean δ13C, δ15N, and δ2H values and standard deviations in gelatin samples and bone raw materials from different regions.
In summary, differences were found in δ13C, δ15N, and δ2H values during the processing from bone to gelatin. However, compared with the differences in δ13C, δ15N, and δ2H values of gelatin from different origins, the fractionation effect caused by processing is not sufficient to influence the identification of gelatin samples from different origins. Meanwhile, a significant correlation was observed among δ13C, δ15N, and δ2H values between the gelatin and bone samples. As shown in Figure 5, the correlation coefficients of δ13C, δ15N, and δ2H values between the gelatin samples and bone raw materials are 0.9390, 0.9624, and 0.8794, respectively (P < 0.01). Combined with Table 2, it indicates that δ13C, δ15N, and δ2H can be used as good indicators for gelatin origin traceability.
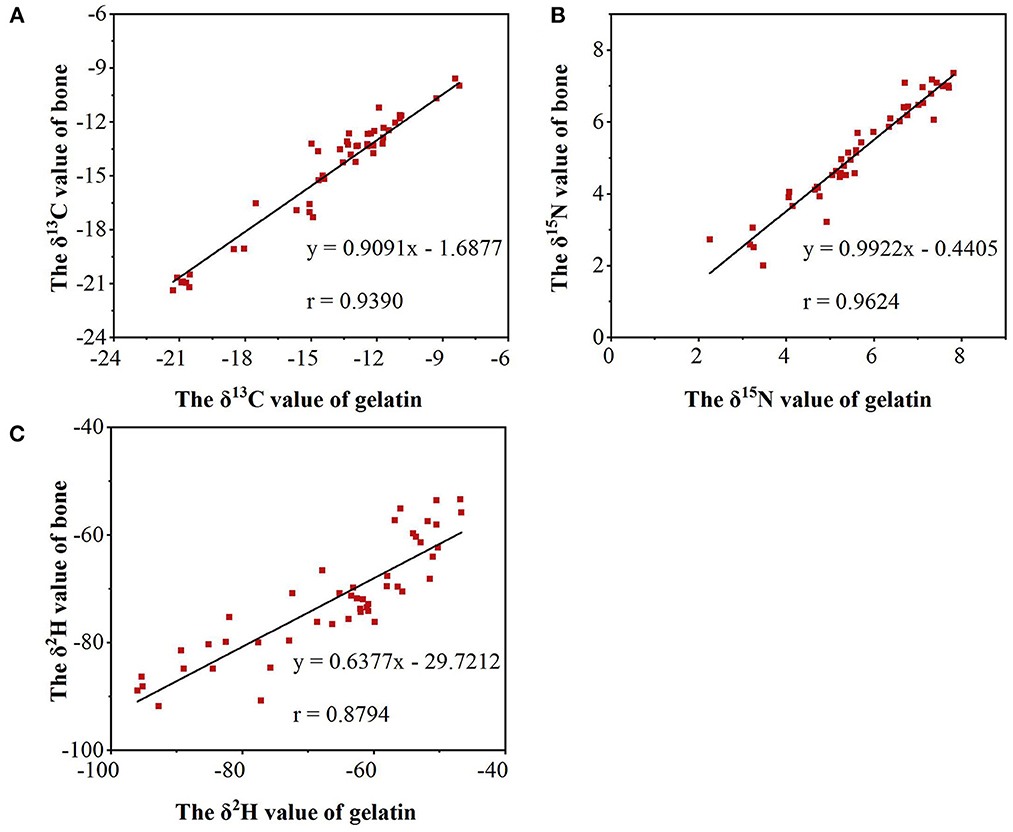
Figure 5. The correlation coefficients of δ13C (A), δ15N (B), and δ2H (C) values between the gelatin samples and bone raw materials.
3.5. Discriminant analysis
As single indicators, δ13C, δ15N, and δ2H were not sufficient to identify gelatin samples from different origins; thus, the combination of these three indicators was used to improve the rate of correct classification. As shown in Table 4, the classification model was established using the LDA. Discrimination accuracies of the original classification and cross-validation of gelatin are 97.9 and 95.7%, respectively. Only a few samples from GX and NMG that are misclassified by origin are available. This misclassification may have occurred because the cattle fed on pasture from GX and NMG have a similar feed. These results indicate that the classification model could differentiate gelatin from different regions.
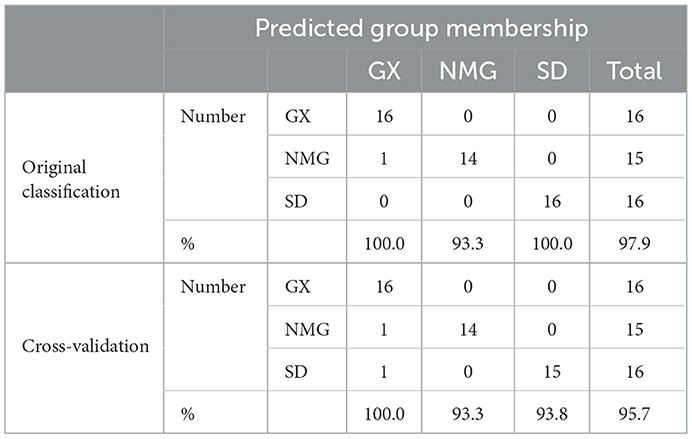
Table 4. Discriminant accuracies of the original classification and cross-validation of gelatin samples from different regions.
4. Conclusion
This study investigated the feasibility of using stable isotope ratio analysis combined with chemometric analysis to identify the origins of gelatin. The results show that stable isotopes (δ13C, δ15N, and δ2H) could be used as effective origin indicators for gelatin traceability, and the classification model also shows high discriminant ability. Therefore, stable isotope ratio analysis coupled with chemometric analysis can be used as an effective method for gelatin traceability. Furthermore, the results of this study may provide technical support for the quality and safety control of gelatin.
Data availability statement
The raw data supporting the conclusions of this article will be made available by the authors, without undue reservation.
Author contributions
SL: methodology, investigation, validation, and writing. DJ: methodology, formal analysis, reviewing, and editing. JL: software and formal analysis. YM, JY, and LD: formal analysis support. YX: supervision, reviewing, and editing. YQ: supervision, funding acquisition, review, and editing. All authors contributed to the article and approved the submitted version.
Funding
This study received funding from the Nuclear Energy Development Program Crop Varietal Improvement and Insect Pests Control by Nuclear Radiation of the State Administration of Science, Technology and Industry for National Defense (SASTIND), People's Republic of China (PRC).
Acknowledgments
The authors are grateful to Prof. Wei Liu (Shanghai Institute of Applied Physics, Chinese Academy of Sciences) for his support on the stable isotope analysis and Associate Prof. Bing Zhang (Technical Institute of Physics and Chemistry, Chinese Academy of Sciences) for her guidance on gelatin extraction.
Conflict of interest
The authors declare that the research was conducted in the absence of any commercial or financial relationships that could be construed as a potential conflict of interest.
Publisher's note
All claims expressed in this article are solely those of the authors and do not necessarily represent those of their affiliated organizations, or those of the publisher, the editors and the reviewers. Any product that may be evaluated in this article, or claim that may be made by its manufacturer, is not guaranteed or endorsed by the publisher.
References
1. Djagny KB, Wang Z, Xu S. Gelatin: a valuable protein for food and pharmaceutical industries: review. Crit Rev Food Sci Nutr. (2001) 41:481–92. doi: 10.1080/20014091091904
2. Alipal J, Mohd Pu'ad NAS, Lee TC, Nayan NHM, Sahari N, Basri H, et al. A review of gelatin: properties, sources, process, applications, and commercialization. Mater Today: Proc. (2021) 42:240–50. doi: 10.1016/j.matpr.2020.12.922
3. Regenstein JM, Zhou P. “Collagen and gelatin from marine by-products,” In:Shahidi F, , editor. Maximising the Value of Marine By-Products. Sawston: Woodhead Publishing (2007). p. 279–303. doi: 10.1533/9781845692087.2.279
4. Zhao S, Liu H, Qie M, Zhang J, Tan L, Zhao Y. Stable isotope analysis for authenticity and traceability in food of animal origin. Food Rev Int. (2021). 1–21. doi: 10.1080/87559129.2021.2005087
5. Camin F, Perini M, Bontempo L, Galeotti M, Tibaldi E, Piasentier E. Stable isotope ratios of H, C, O, N and S for the geographical traceability of Italian rainbow trout (Oncorhynchus mykiss). Food Chem. (2018) 267:288–95. doi: 10.1016/j.foodchem.2017.06.017
6. Wang Q, Liu H, Zhao S, Qie M, Bai Y, Zhang J, et al. Discrimination of mutton from different sources (regions, feeding patterns and species) by mineral elements in Inner Mongolia, China. Meat Sci. (2021) 174:108415. doi: 10.1016/j.meatsci.2020.108415
7. Horcada A, López A, Polvillo O, Pino R, Cubiles-de-la-Vega D, Tejerina D, et al. Fatty acid profile as a tool to trace the origin of beef in pasture- and grain-fed young bulls of Retinta breed. Span J Agric Res. (2018) 15:1–11. doi: 10.5424/sjar/2017154-11032
8. Sun S, Guo B, Wei Y, Fan M. Classification of geographical origins and prediction of 13C and 15N values of lamb meat by near infared reflectance spectroscopy. Food Chem. (2012) 135:508–14. doi: 10.1016/j.foodchem.2012.05.004
9. Ghidini S, Varrà MO. Dall'Asta C, Badiani A, Ianieri A, Zanardi E. Rapid authentication of European sea bass (Dicentrarchus labrax L.) according to production method, farming system, and geographical origin by near infrared spectroscopy coupled with chemometrics. Food Chem. (2019) 280:321–7. doi: 10.1016/j.foodchem.2018.12.075
10. Varrà MO, Ghidini S, Ianieri A, Zanardi E. Near infrared spectral fingerprinting: A tool against origin-related fraud in the sector of processed anchovies. Food Control. (2021) 123:107778. doi: 10.1016/j.foodcont.2020.107778
11. Esteki M, Shahsavari Z, Simal-Gandara J. Food identification by high performance liquid chromatography fingerprinting and mathematical processing. Food Res Int. (2019) 122:303–17. doi: 10.1016/j.foodres.2019.04.025
12. Valletta M, Ragucci S, Landi N, Maro AD, Pedone PV, Russo R, et al. Mass spectrometry-based protein and peptide profiling for food frauds, traceability and authenticity assessment. Food Chem. (2021) 365:130456. doi: 10.1016/j.foodchem.2021.130456
13. Hu Y, Huang SY, Hanner R, Levin J, Lu X. Study of fish products in Metro Vancouver using DNA barcoding methods reveals fraudulent labeling. Food Control. (2018) 94:38–47. doi: 10.1016/j.foodcont.2018.06.023
14. Uncu AO, Uncu AT. A barcode-DNA analysis method for the identification of plant oil adulteration in milk and dairy products. Food Chem. (2020) 326:126986. doi: 10.1016/j.foodchem.2020.126986
15. Ye H, Yang J, Xiao G, Zhao Y, Li Z, Bai W. A comprehensive overview of emerging techniques and chemometrics for authenticity and traceability of animal-derived food. Food Chem. (2023) 402:134216. doi: 10.1016/j.foodchem.2022.134216
16. Nie J, Shao S, Xia W, Liu Z, Yu C, Li R, et al. Stable isotopes verify geographical origin of yak meat from Qinghai-Tibet plateau. Meat Sci. (2020) 165:108113. doi: 10.1016/j.meatsci.2020.108113
17. Zhao S, Zhao Y, Rogers KM, Chen G, Chen A, Yang S Application of multi-element (C, N, H, O) stable isotope ratio analysis for the traceability of milk samples from China. Food Chem. (2020) 310:125826. doi: 10.1016/j.foodchem.2019.125826
18. Kang X, Zhao Y, Shang D, Zhai Y, Ning J, Ding H, et al. Identification of the geographical origins of sea cucumbers in China: the application of stable isotope ratios and compositions of C, N, O, and H. Food Control. (2020) 111:107036. doi: 10.1016/j.foodcont.2019.107036
19. Chen CT, Chen BY, Nai YS, Chang YM, Chen KH, Chen YW. Novel inspection of sugar residue and origin in honey based on the 13C/12C isotopic ratio and protein content. J Food Drug Anal. (2019) 27:175–83. doi: 10.1016/j.jfda.2018.08.004
20. Zhou J, Guo B, Wei Y, Zhang G, Wei S, Ma Y. The effect of different cooking processes on stable C, N, and H isotopic compositions of beef. Food Chem. (2015) 182:23–6. doi: 10.1016/j.foodchem.2015.02.116
21. Liu H, Wei Y, Wei S, Jiang T, Zhang S, Guo B. δ2H of wheat and soil water in different growth stages and their application potentialities as fingerprints of geographical origin. Food Chem. (2017) 226:135–40. doi: 10.1016/j.foodchem.2017.01.029
22. Li H, Wu M, She S, Lin G, Zhou J. Chen L. Study on stable carbon isotope fractionation of rape honey from rape flowers (Brassica napus L.) to its unifloral ripe honey. Food Chem. (2022) 386:132754. doi: 10.1016/j.foodchem.2022.132754
23. Jannat B, Ghorbani K, Shafieyan H, Kouchaki S, Behfar A, Sadeghi N, et al. Gelatin speciation using real-time PCR and analysis of mass spectrometry-based proteomics datasets. Food Control. (2018) 87:79–87. doi: 10.1016/j.foodcont.2017.12.006
24. Sha X, Jiang W, Hu Z, Zhang L, Xie Z, Lu L, et al. Traceability and identification of fish gelatin from seven cyprinid fishes by high performance liquid chromatography and high-resolution mass spectrometry. Food Chem. (2023) 400:133961. doi: 10.1016/j.foodchem.2022.133961
25. Cai S, Jiang M, Zhao K, Huang X, Fei F, Cao B, et al. A quantitative strategy of ultrasound-assisted digestion combined UPLC-MS/MS for rapid identifying species-specific peptide markers in the application of food gelatin authentication. Lwt-Food Sci Technol. (2021) 147:111590. doi: 10.1016/j.lwt.2021.111590
26. Jiang D, Du L, Guo Y, Ma J, Li X, Han L, et al. Potential use of stable isotope and multi-element analyses for regional geographical traceability of bone raw materials for gelatin production. Food Anal Method. (2019) 13:762–9. doi: 10.1007/s12161-019-01687-1
27. Ma Y, Zeng X, Ma X, Yang R, Zhao W. A simple and eco-friendly method of gelatin production from bone: One-step biocatalysis. J Clean Prod. (2019) 209:916–26. doi: 10.1016/j.jclepro.2018.10.313
28. Zhaxi C, Zhao S, Zhang T, Dong H, Liu H, Zhao Y. Stable isotopes verify geographical origin of Tibetan chicken. Food Chem. (2021) 358:129893. doi: 10.1016/j.foodchem.2021.129893
29. Guo B, Wei Y, Pan J, Li Y. Stable C and N isotope ratio analysis for regional geographical traceability of cattle in China. Food Chem. (2010) 118:915–20. doi: 10.1016/j.foodchem.2008.09.062
30. Zhang X, Cheng J, Han D, Zhao X, Chen X, Liu Y. Geographical origin traceability and species identification of three scallops (Patinopecten yessoensis, Chlamys farreri, and Argopecten irradians) using stable isotope analysis. Food Chem. (2019) 299:125107. doi: 10.1016/j.foodchem.2019.125107
31. Chandra MV, Shamasundar BA. Rheological properties of gelatin prepared from the swim bladders of freshwater fish Catla catla. Food Hydrocolloid. (2015) 48:47–54. doi: 10.1016/j.foodhyd.2015.01.022
32. Sow LC, Yang H. Effects of salt and sugar addition on the physicochemical properties and nanostructure of fish gelatin. Food Hydrocolloid. (2015) 45:72–82. doi: 10.1016/j.foodhyd.2014.10.021
33. Ali AMMM, Kishimura H, Benjakul S. Physicochemical and molecular properties of gelatin from skin of golden carp (Probarbus Jullieni) as influenced by acid pretreatment and prior-ultrasonication. Food Hydrocolloid. (2018) 82:164–72. doi: 10.1016/j.foodhyd.2018.03.052
34. Benjakul S, Oungbho K, Visessanguan W, Thiansilakul Y, Roytrakul S. Characteristics of gelatin from the skins of bigeye snapper, Priacanthus tayenus and Priacanthus macracanthus. Food Chem. (2009) 116:445–51. doi: 10.1016/j.foodchem.2009.02.063
35. Ahmad T, Ismail A, Ahmad SA, Khalil KA, Awad EA, Leo TK, et al. Characterization of gelatin from bovine skin extracted using ultrasound subsequent to bromelain pretreatment. Food Hydrocolloid. (2018) 80:264–73. doi: 10.1016/j.foodhyd.2018.01.036
36. Bahar B, Monahan FJ, Moloney AP, O'Kiely P, Scrimgeour CM, Schmidt O. Alteration of the carbon and nitrogen stable isotope composition of beef by substitution of grass silage with maize silage. Rapid Commun Mass Sp. (2005) 19:1937–42. doi: 10.1002/rcm.2007
37. Sun S, Guo B, Wei Y. Origin assignment by multi-element stable isotopes of lamb tissues. Food Chem. (2016) 213:675–81. doi: 10.1016/j.foodchem.2016.07.013
38. Bateman AS, Kelly SD, Jickells TD. Nitrogen isotope relationships between crops and fertilizer: Implications for using nitrogen isotope analysis as an indicator of agricultural regime. J Agric Food Chem. (2005) 53:5760–5. doi: 10.1021/jf050374h
Keywords: stable isotope ratios, gelatin, geographical traceability, bone, processing
Citation: Li S, Jiang D, Li J, Ma Y, Yao J, Du L, Xu Y and Qian Y (2023) Geographical traceability of gelatin in China using stable isotope ratio analysis. Front. Nutr. 10:1116049. doi: 10.3389/fnut.2023.1116049
Received: 05 December 2022; Accepted: 11 January 2023;
Published: 16 February 2023.
Edited by:
Yan Zhao, Chinese Academy of Agricultural Sciences, ChinaReviewed by:
Hao Dong, Zhongkai University of Agriculture and Engineering, ChinaTao Huang, Ningbo University, China
Copyright © 2023 Li, Jiang, Li, Ma, Yao, Du, Xu and Qian. This is an open-access article distributed under the terms of the Creative Commons Attribution License (CC BY). The use, distribution or reproduction in other forums is permitted, provided the original author(s) and the copyright owner(s) are credited and that the original publication in this journal is cited, in accordance with accepted academic practice. No use, distribution or reproduction is permitted which does not comply with these terms.
*Correspondence: Yisheng Xu,  eXNoeHVAZWN1c3QuZWR1LmNu; Yuan Qian,
  cWlhbnl1YW5Ac2luYXAuYWMuY24=
†These authors have contributed equally to this work and share first authorship
 Shuang Li
 Di Jiang2†