- Instituto de Investigación para el Desarrollo Sustentable de Ceja de Selva, Universidad Nacional Toribio Rodríguez de Mendoza de Amazonas, Chachapoyas, Peru
Coffee is the most consumed beverage in the world after water. Multiple benefits are attributed to it in human health due to the presence of antioxidant compounds, whose content depends, among other factors, on the processing conditions of the coffee bean. The objective of this study was to determine the kinetics of polyphenols and antioxidants during the roasting of three varieties of arabica coffee. For this, we worked with varieties of coffee, Catimor, Caturra, and Bourbon, from the province of La Convencion, Cuzco, Peru. The samples were roasted in an automatic induction roaster, and 12 samples were taken during roasting (at 0, 1, 3, 5, 7, 9, 11, 13, 15, 17, 19, and 21 min of roasting) in triplicate. For green coffee beans, titratable acidity, total soluble solids, moisture and apparent density were determined. The change in polyphenol content was determined using the Folin-Ciocalteu method, and antioxidant activity was determined using the 2,2-diphenyl-1-picrylhydrazyl (DPPH) and 2,2-azino-bis- (3-ethyl-benzothiazoline-6-sulfonic acid) (ABTS+) free radical capture technique during roasting. Polyphenol and antioxidant contents increased until minute 5 of roasting and then decreased until minute 20, and in some cases, there were slight increases in the last minute. The model that best described the changes in these bioactive compounds was the cubic model (R2 0.634 and 0.921), and the best fits were found for the Bourbon variety, whose green grain had more homogeneous characteristics. The changes in the relative abundances of nine phenolic compounds were determined using high-performance liquid chromatography (HPLC). In conclusion, roasting modifies phenolic compounds and antioxidants differently in the coffee varieties studied. The content of some phenols increases, and in other cases, it decreases as the roasting time increases. The roasting process negatively affects the bioactive compounds and increases the fracturability of Arabica coffee beans, elements that should be taken into account at the moment of developing roasting models in the industry.
1. Introduction
After water, coffee is the most widely consumed beverage in the world and probably the most economically relevant agricultural product because since it is the most important commodity after oil (1).
The consumption of coffee has been associated with controversial nutritional approaches; however, recent research has shown a relationship between the habitual consumption of coffee beverages and a reduced risk of chronic diseases, including cancer (2).
Caffeine is the main compound in coffee, both because it is the best known and because of the properties it confers on the beverage. As well as being a potent central nervous system stimulant, improving mood, its consumption is associated with a reduction in the risk of suffering from Parkinson’s disease and Alzheimer’s disease and with hepatoprotective effects (3). Additionally, coffee is a source of large amounts of minerals and bioactive compounds (4), such as chlorogenic acid, caffeic acid and other phenolic compounds (5, 6), which are responsible for its high antioxidant power.
The roasting process causes physical, chemical and biological changes in coffee beans (7, 8). Previous experiments have shown that the change in the antioxidant activity of the beverage is closely associated with changes in bioactive compounds such as chlorogenic acid (9–11).
The total phenolic and flavonoid content and antioxidant activity of coffee beverages decrease with increasing roasting degree (12, 13). Similarly, although caffeine has a high melting point, the high temperatures used in the coffee roasting process can affect its content beverages (14). Therefore, the high temperatures to which coffee beans are subjected to in order to produce volatile aromatic compounds, as in other foods, degrade compounds of high nutritional value, such as antioxidants (15, 16). By degrading these compounds, the antioxidant activity of coffee beverages is considerably reduced, and a relative increase in caffeine content can be observed due to its high thermal stability (6, 17).
Although the phenol content in robusta coffee has been shown to be higher than that in arabica coffee, both are proportionally affected by roasting processes (18). In addition, the antioxidant content in the final beverage depends on the species, variety, processing technique and preparation (19).
This research work deals in depth with the changes of phenolic compounds during coffee roasting. The kinetic models of phenolic composition and antioxidant activity in the coffee beverage are specified. In addition, the changes in coffee bean fracturability during the roasting process, a very important parameter to standardize roasting models, are exposed.
It has been shown that the roasting of coffee beans degrades compounds responsible for the antioxidant activity of coffee beverages, it unknown how their quantities change. Therefore, the aim of this study was to investigate the changes in polyphenol content and antioxidant activity during the roasting of three varieties of arabica coffee grown in Peru.
2. Materials and methods
2.1. Material
In this research, green arabica coffee beans of Bourbon, Caturra, and Catimor varieties from the province of La Convencion, Cuzco, Peru, were used. Green coffee beans with sensory scores greater than score 88 in SCA/CoE cupping (20) was acquired, and all subsequent processing was performed in the Coffee Processing and Quality Control Laboratory of Universidad Nacional Toribio Rodríguez de Mendoza de Amazonas.
2.2. Experimental procedure
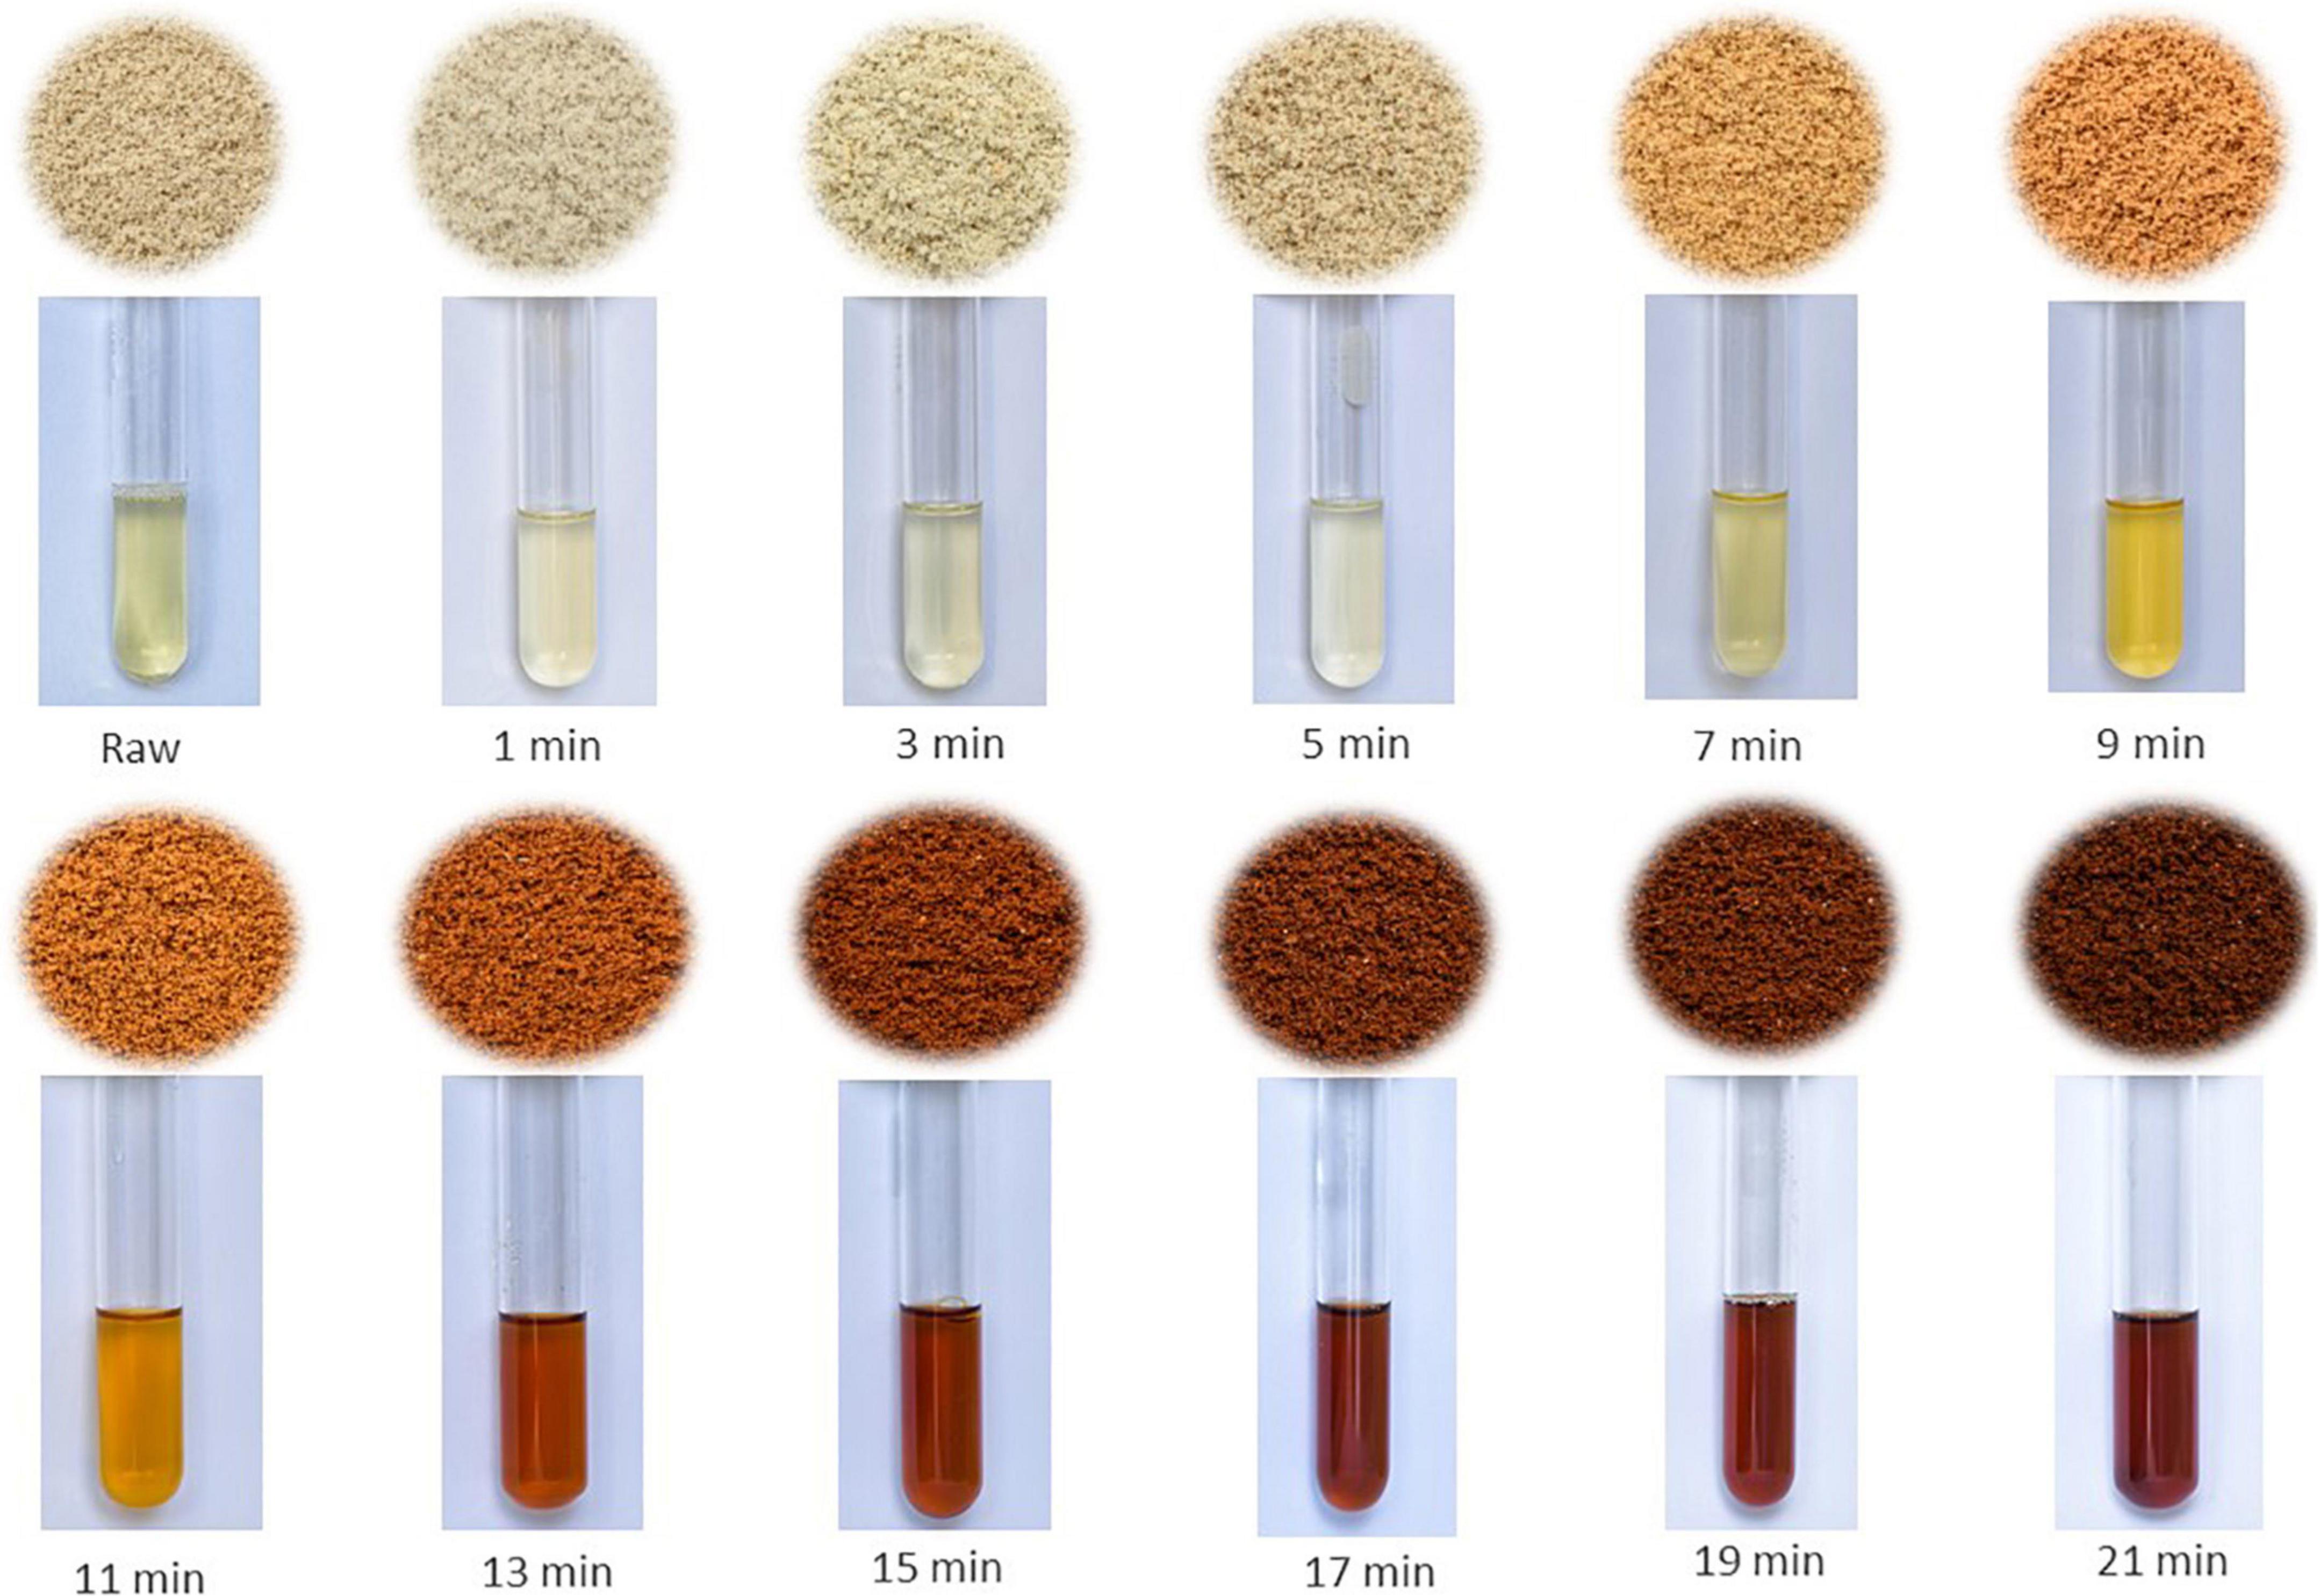
The coffee was selected using 17 mesh and then roasted for 21 min in a Probat electric sample roaster (Germany) with a starting temperature of 170°C, 60% heating power and 200 g load per batch. A sample or approximately 2 to 3 g was taken every 2 min (at 0, 1, 3, 5, 7, 9, 11, 13, 15, 17, 19, and 21 min of roasting) (Figure 1) of three arabica coffee varieties (Bourbon, Caturra, and Catimor); then 3A × 12B bifactorial experiment was run. Each treatment was performed in triplicate, and the samples were stored in polyethylene flasks with a lid under refrigeration (4–8°C) until further treatment.
2.3. Infusions
The coffee samples taken at different roasting times were ground in a bean grinder (Bosch, Germany). Then, infusions were obtained by adding hot 180 mL of water (90°C) to beakers with 10 g of ground coffee. Infusions lasted 5 min, after which the sample was filtered through filter paper (Whatman no. 40). The extracts were stored under refrigeration (4°C) until subsequent analysis.
2.4. Determination of antioxidant activity
Antioxidant activity was determined using two techniques. (1) The free radical 2,2-diphenyl-1-picrylhydrazyl (DPPH) was assessed using the technique developed by Brand-Williams et al. (21) and adapted by Çelik and Gökmen (22) for the determination of antioxidant activity in coffee. A methanolic solution of DPPH (20 mg/L) was prepared to obtain an absorbance of approximately 0.45. DPPH solution (3.9 ml) was used and placed in glass cuvettes to measure the initial absorbance of DPPH (A0) at a wavelength of 516 nm. Then, 100 μL of sample extract was pipetted and placed in the cuvette containing the DPPH solution and stirred. The cuvettes were left in the dark for 10 min, and then, final absorbance (TA) was measured.
The decrease in absorbance of the resulting solution was measured spectrophotometrically at 516 nm (UV/VIS spectrometer). All experiments were performed in triplicate, and the mean values were reported. The scavenging capacity was calculated using the following equation and expressed as the inhibition of DPPH:
where A0 is the absorbance of the DPPH solution, AS is the absorbance of methanol, and TA is the absorbance of the sample.
(2) The uptake of the 2,2-azino-bis- (3-ethyl-benzothiazoline-6-sulfonic acid (ABTS+) radical was assessed as described by Del Castillo et al. (23). The Trolox standard was used for all, and the values were expressed in mmol Trolox equivalent/liter of infusion. To generate the ABTS+ cation, 19.2 mg of 2,2′-azino-bis (3-ethylbenzothiazoline-6-sulfonic acid) was weighed and dissolved in 5 mL of distilled water to obtain a concentration of 7 mM. Then, 88 μL of 140 mM potassium persulfate was added. The resulting solution was homogenized and incubated at room temperature (25°C ± 1) in the dark for 16 h. Once the ABTS+ radical was generated, the solution was adjusted with methanol until obtaining an absorbance of 0.7 ± 0.1 at 754 nm. For the analysis of samples, 3.9 mL of ABTS+ solution was used, 100 μL of the aqueous coffee extract was added, and the mixture was stirred vigorously. The sample was immediately read in a UV/VIS spectrophotometer at 754 nm. A calibration curve was constructed with Trolox (concentration range of 0 to 1.0 mM).
2.5. Total phenol content
For each of the extracts and their respective replicates, the total polyphenol content was determined using the Folin-Ciocalteu technique, following the procedure described by Çelik and Gökmen (22). Gallic acid was used as the standard; 10 mg of gallic acid was weighed and diluted with ultrapure water to a volume of 100 mL to prepare a stock solution. This solution was used to prepare the calibration curve (concentration range of 0–16 mg/L). Extracts (50 μL) diluted in 950 μL of ultrapure water were pipetted into test tubes, and then 2.5 mL of Folin-Ciocalteu reagent diluted in distilled water (1:10 v/v) and 2 ml of Na2CO3 (20% aqueous solution) were added. The test tubes were placed in an oven at 50°C for 5 min to allow the development of a blue complex. All samples were prepared in triplicate. Absorbance was measured in a UV/VIS spectrophotometer at a wavelength of 765 nm.
2.6. Chromatographic conditions for the determination of phenolic compounds in coffee beverages
Phenolic compounds were separated using high-performance liquid chromatography (HPLC) following the method described by Brunetto et al. (24) in a Hitachi-Chromaster chromatograph (Tokyo, Japan; LC-20AD) equipped with an SIL-20A/HT autoinjector, a CBM-20A communication module and an SPD-M20A diode array detector (DAD). UV detection was recorded at 278 nm. Separation was performed on a Supelco-LiChrospher RC C-18 column (5 μm; 25 cm × 4.6 mm). A mixture of methanol/water (30/70 v/v) was used as the mobile phase in isocratic mode at a flow rate of 1.0 mL/min. Phenolic compounds were identified only by retention time because there were no standards for identification by name.
2.7. UV-vis spectral scanning
For the spectral analysis, the methodology described by Tian et al. (25) was used with some modifications. Coffee extracts were diluted 100-fold with distilled water. The diluted sample (3 mL) was added to a quartz cuvette and inserted into the reading cell of the UV-vis spectrophotometer (T 9200 PEAK, USA). Distilled water (3 mL) was used as calibration reference. The reading range was between 190 and 400 nm in triplicate.
2.8. Fracturability
A CTX texture analyzer (AMETEK Brookfield, USA) with TexturePro 1.0.19 software, equipped with a 100 kg load cell, was used. The test was performed with a cylindrical probe of 6 mm diameter and 35 mm length, a test speed of 3 mm/s and a depth of 0.25 mm. The pre-test velocity was 5 mm/s, data acquisition of one point per second and 1 N as activation load. Fracturability was calculated and values in N are reported.
2.9. Data analysis
To compare between treatments we used analysis of variance and Tukey’s test of comparisons to determine the significance between groups (sig. = 0.05), using SPSS V.26 statistical software. The results presented in tables contain mean values and standard deviations and figures were produced to demonstrate trend and kinetic models.
3. Results
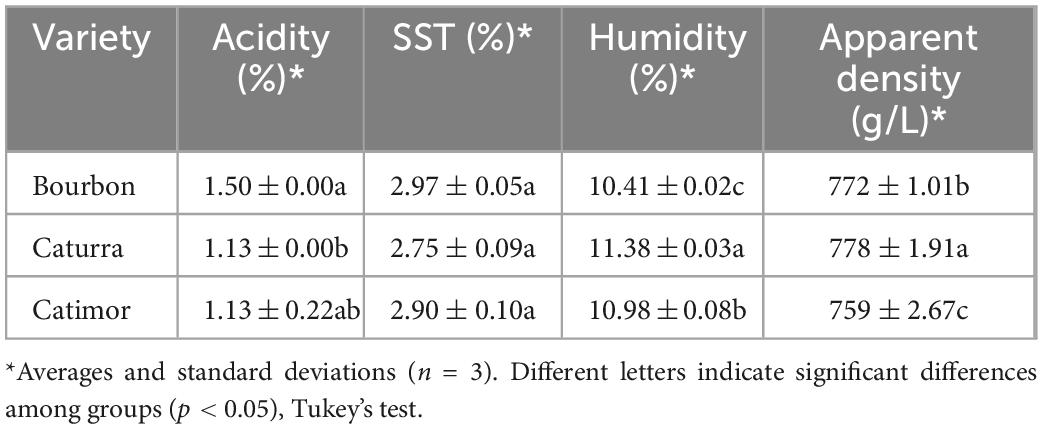
Table 1 provides the characteristics of the coffee used in the experiments. Except for the soluble solids content, the samples used were different. Green coffee of the Bourbon variety had a higher acidity content than did the other two varieties used. The green coffee variety Caturra had the highest moisture content (11.38%) and the highest apparent density (778 g/L).
Green Bourbon coffee beans had a higher phenolic content than did the beans of the Caturra and Catimor varieties (66.59 compared to 53.31 and 56.74 mg AGE/g, respectively). As seen in Table 2, when the roasting process began, the phenolic content increased, peaking at minute 3 for the Bourbon variety (80.35 mg AGE/g) and minute 9 for the Caturra and Catimor varieties (69.46 and 67.55 mg AGE/g, respectively). After that time, the phenolic content decreased proportionally below the initial phenol content.
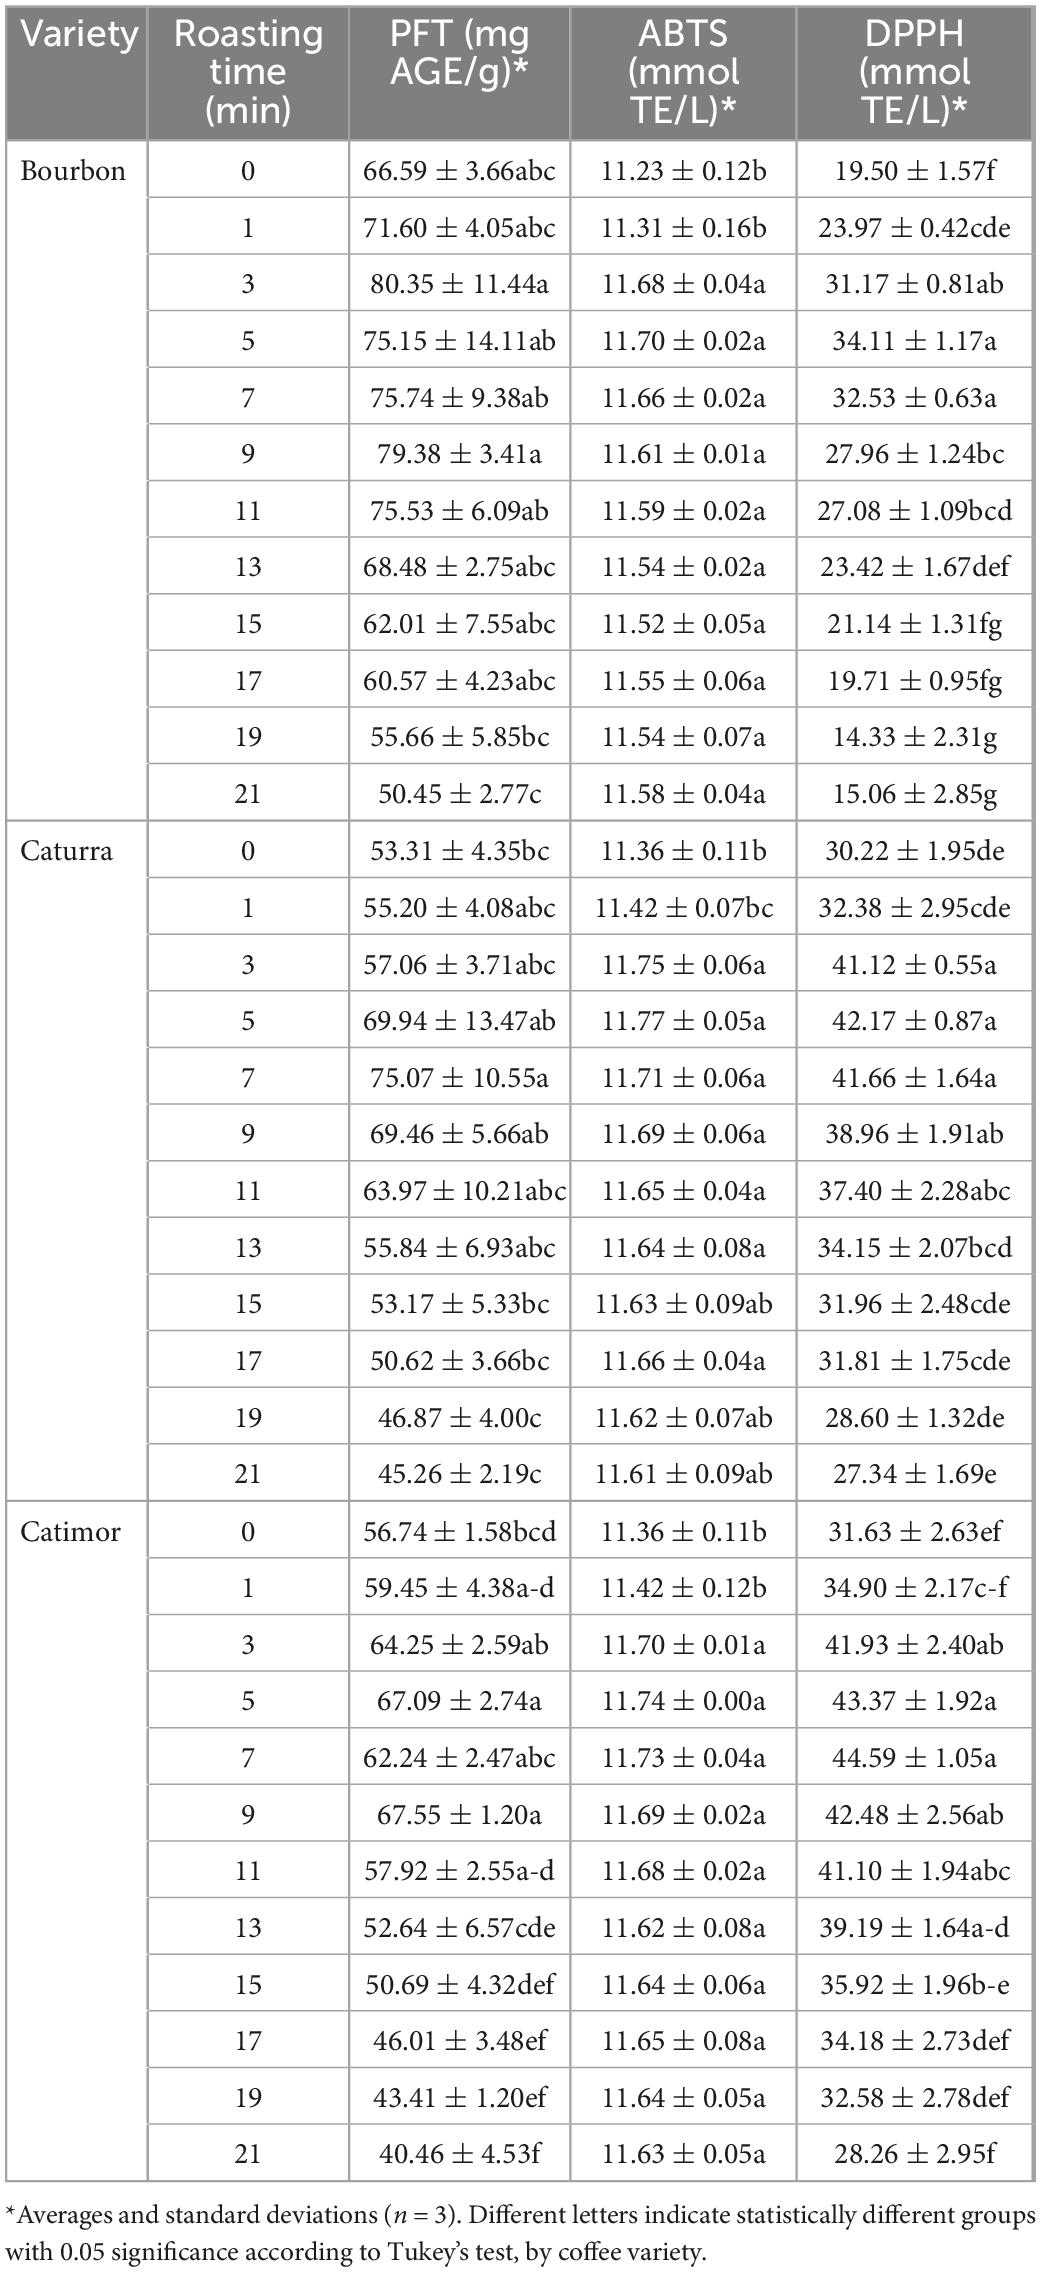
Table 2. Effect of roasting on the phenol content and antioxidant capacity of three coffee varieties (Bourbon, Caturra, and Catimor).
Regarding the antioxidant capacity of the infusions, the ABTS technique seemed to be less sensitive; however, the trend was similar to that for total phenol content (the initial values increased with time and then decreased) for the three varieties of coffee studied. The DPPH radical capture technique was apparently more sensitive than the ABTS technique for determining the antioxidant capacity of the infusions. Unlike the total phenol content, green coffee of the Bourbon variety had the lowest antioxidant capacity (19.50 vs. 30.22 and 31.66 mmol TE/L, respectively); however, the evolution over time was correlated in such a way that the maximum values were obtained in minutes 5, 9, and 7 for Bourbon, Caturra and Catimor, respectively, and then at minute 21 decreased to values lower than the initial values.
3.1. Changes in total polyphenols during coffee roasting
Figure 2 and Table 3 show the curves for the change in total polyphenol content during the roasting of the three coffee varieties. Although the three models, i.e., linear, quadratic and cubic, are significant (sig. < 0.05), the changes in phenol content during roasting better fit the cubic model (R2 > 0.63). More precise models were obtained for the Catimor variety (R2 of 0.58; 0.79 and 0.86 for the linear, quadratic, and cubic models, respectively) than for the Bourbon and Caturra varieties. In all treatments, a decrease in phenolic content is observed during roasting of the coffee bean (Figure 2).
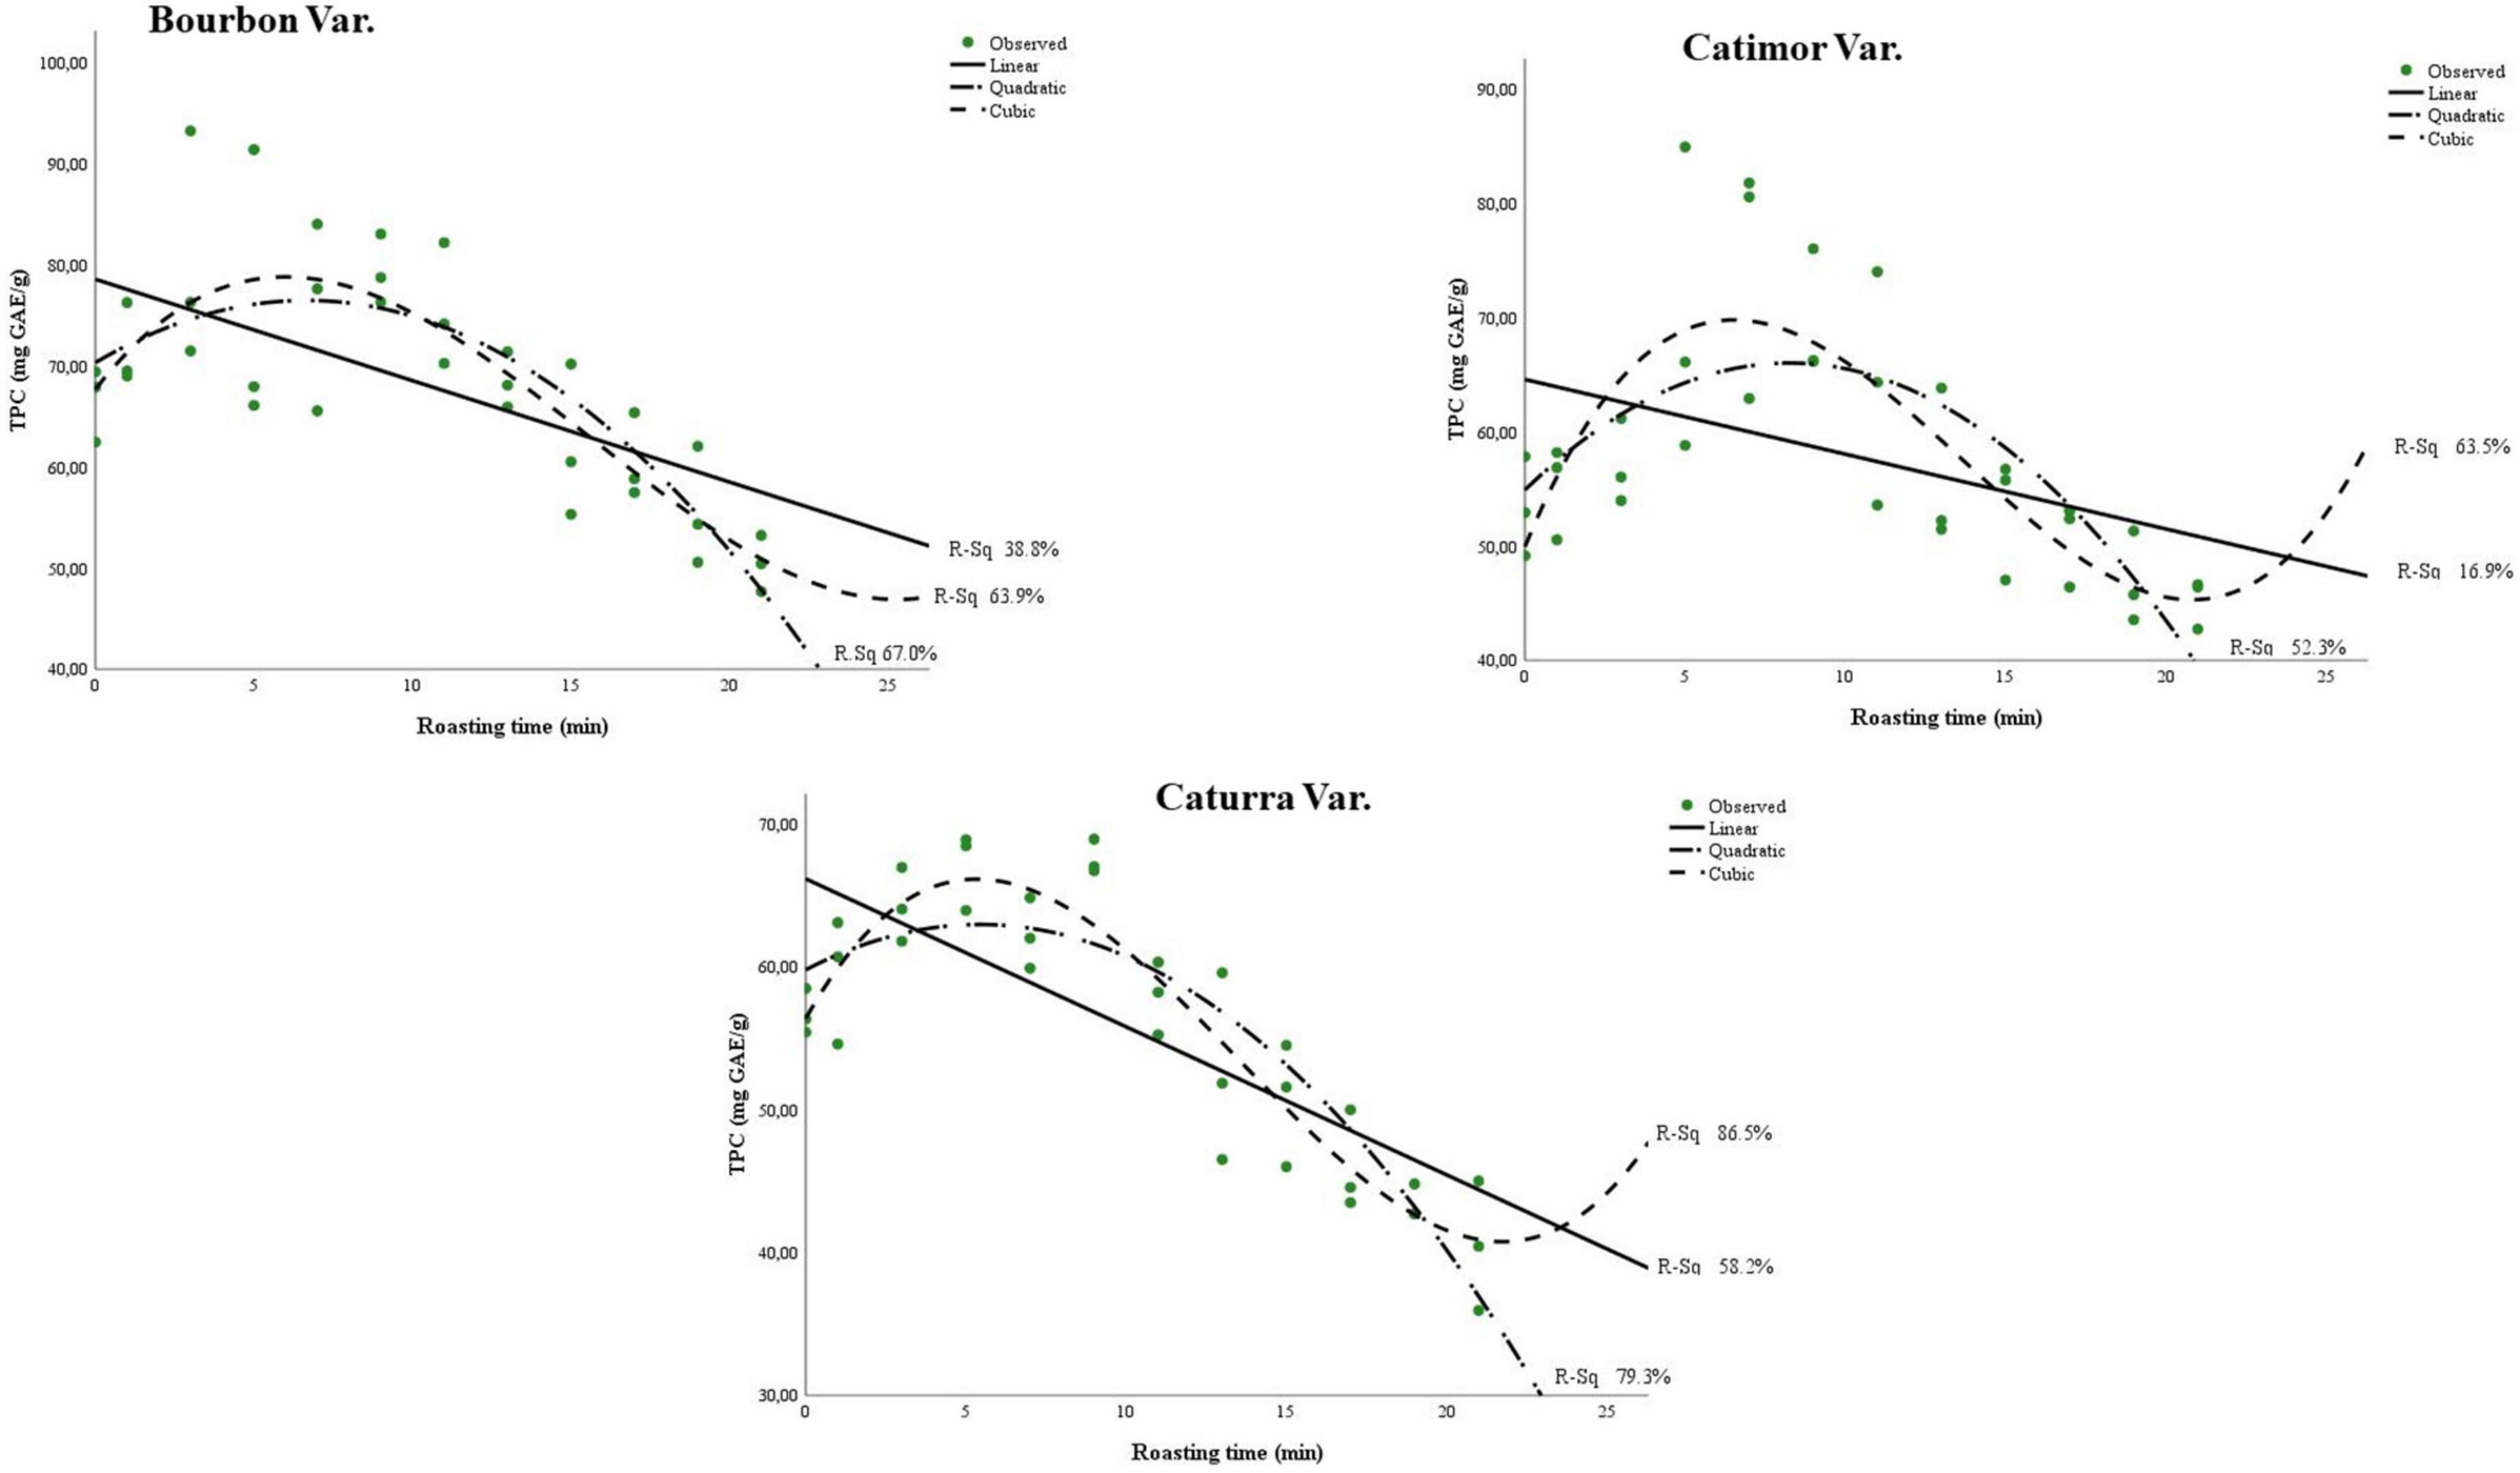
Figure 2. Models of polyphenol degradation during roasting of three coffee varieties (Bourbon, Catimor, and Caturra).
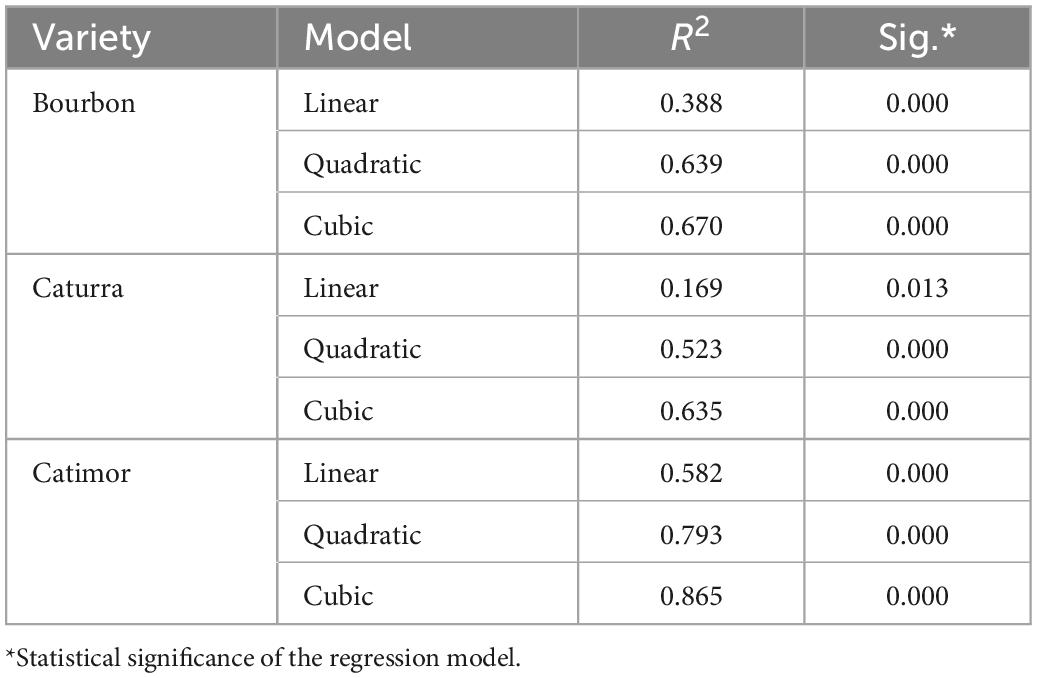
Table 3. Summary of the models and estimated parameters of polyphenol degradation during the roasting of three coffee varieties.
3.2. Change in coffee antioxidants during roasting
Figure 3 and Table 4 show the values and evolution of the antioxidant capacity of coffee during roasting.
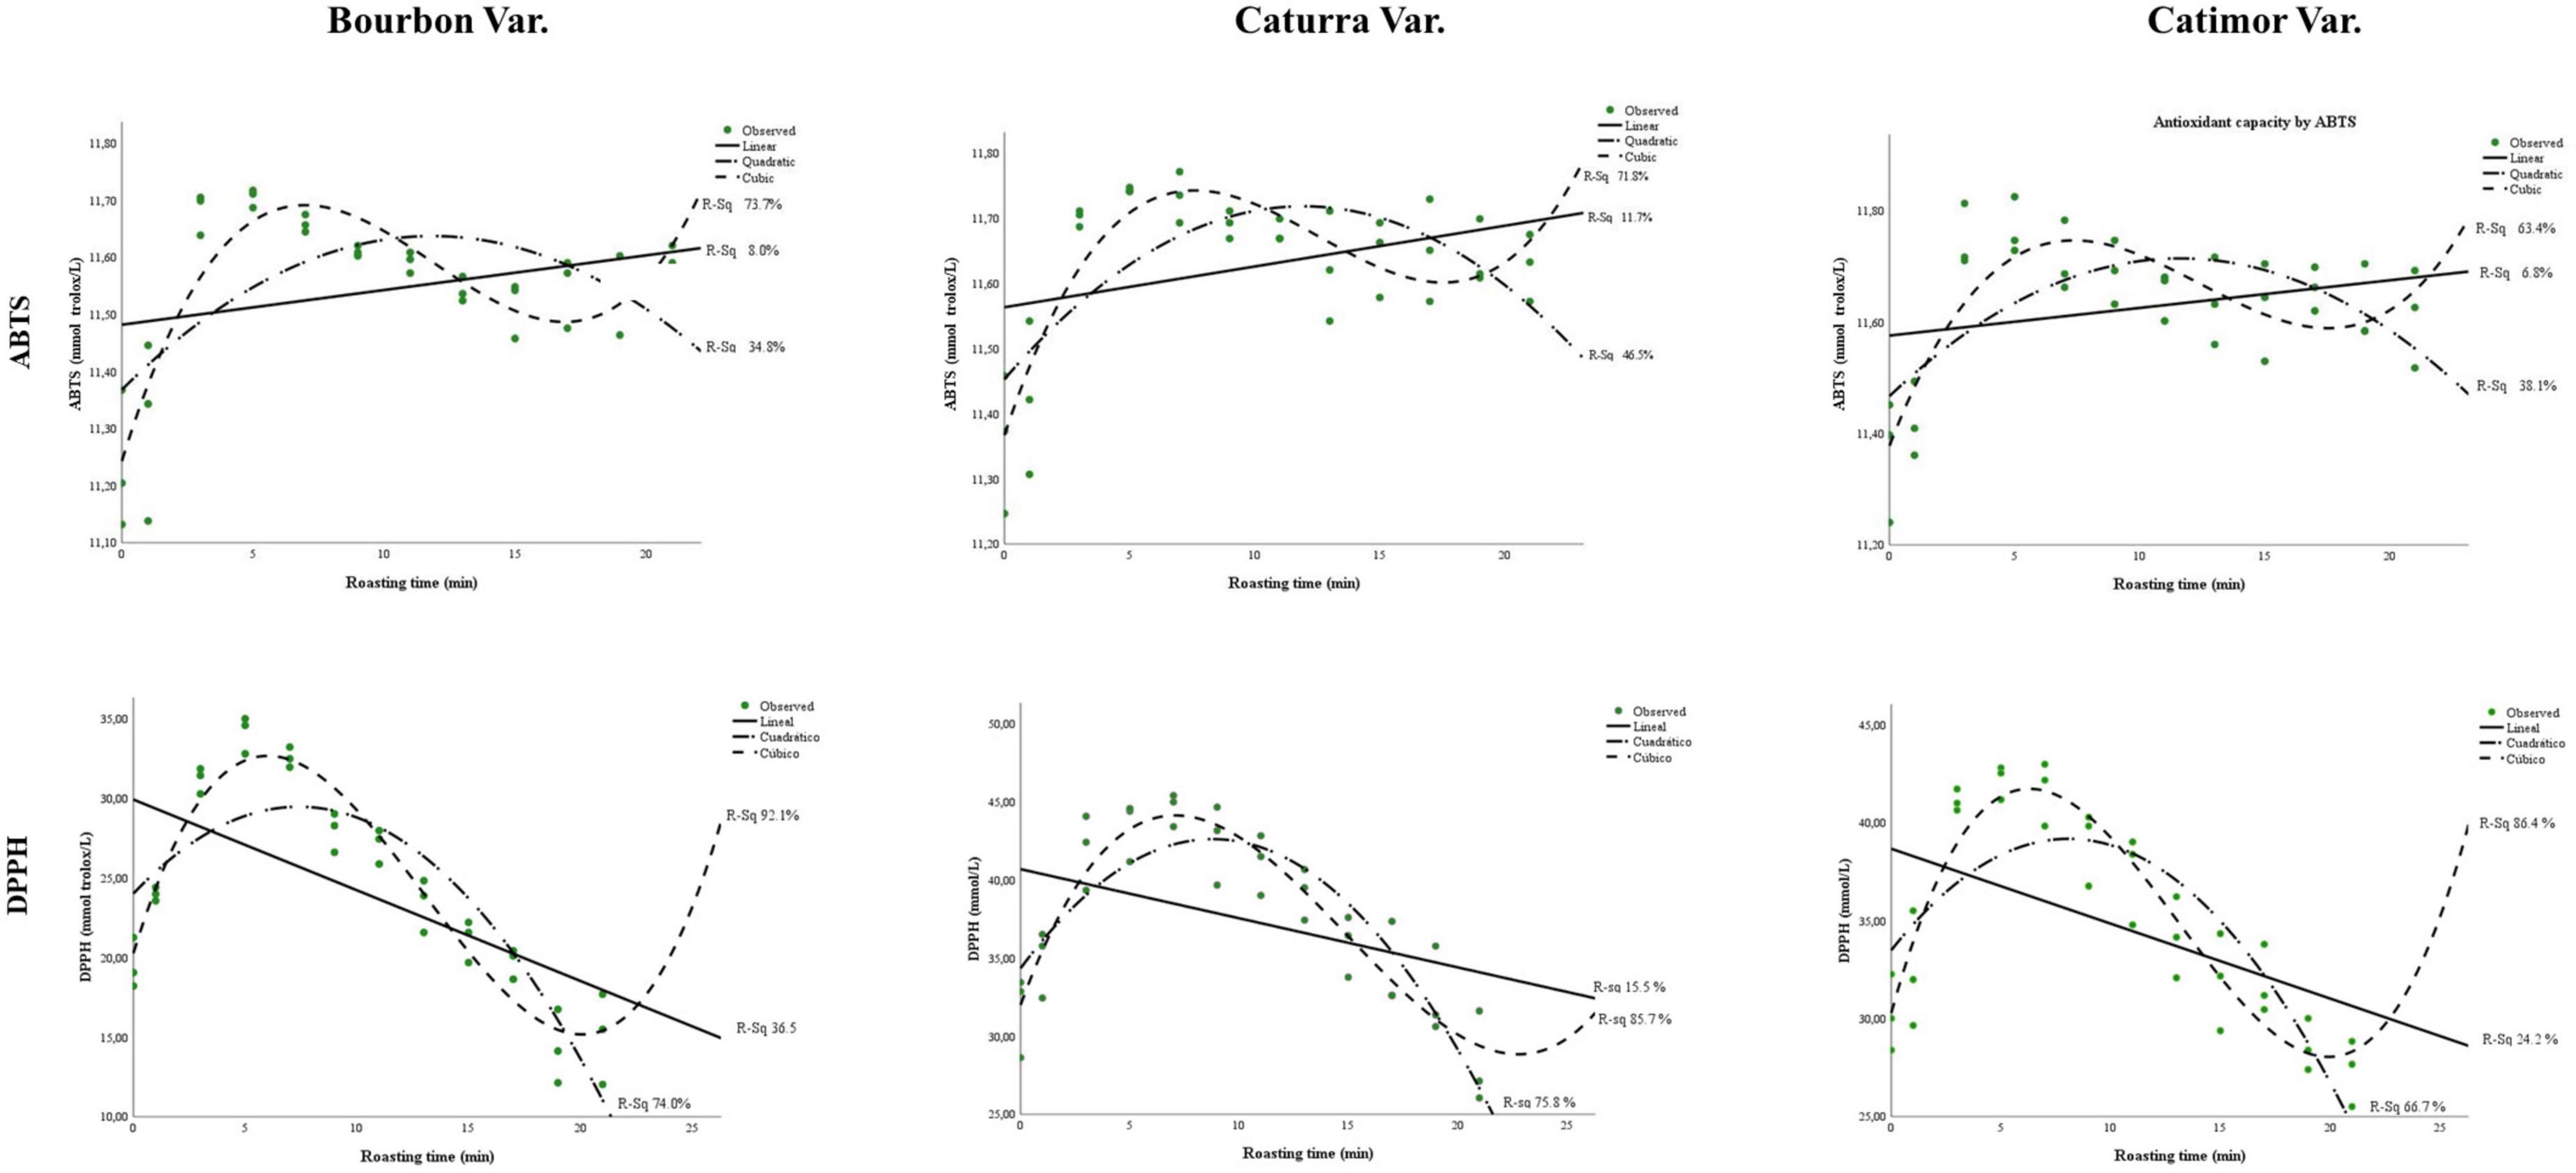
Figure 3. Changes in antioxidants in three varieties of coffee (Bourbon, Caturra, and Catimor) during roasting.
As seen in Figure 3, compared with the ABTS method, the DPPH free radical capture technique showed greater changes in the antioxidant capacity of coffee beans during roasting. Both techniques allowed us to observe that immediately after starting the roasting process, the antioxidant capacity increased up to a certain time (5 to 9 min, as seen in Table 2). Then, the capacity decreased, and at the end of roasting, a slight increase was observed (Figure 3).
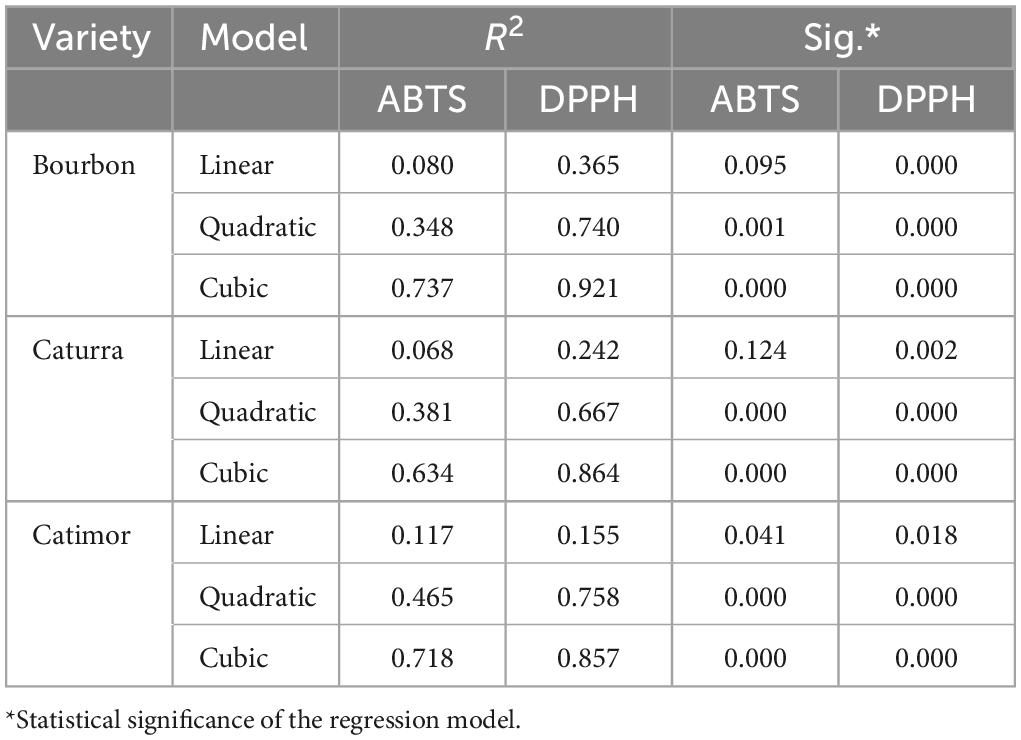
With the DPPH radical capture technique, models with greater fit were obtained than with the ABTS method, with R2 values greater than 0.85 for the three coffee varieties studied.
Figure 4 shows the changes of nine phenolic compounds in coffee during roasting. Four of them (Figures 4B, D, F, I) increased their content up to the 10th minute of roasting and then decreased, and three other compounds (Figures 4A, C, E) increased until the end of roasting. Figures 4G, H show that there are phenolic compounds that are affected from the beginning of the roasting process.
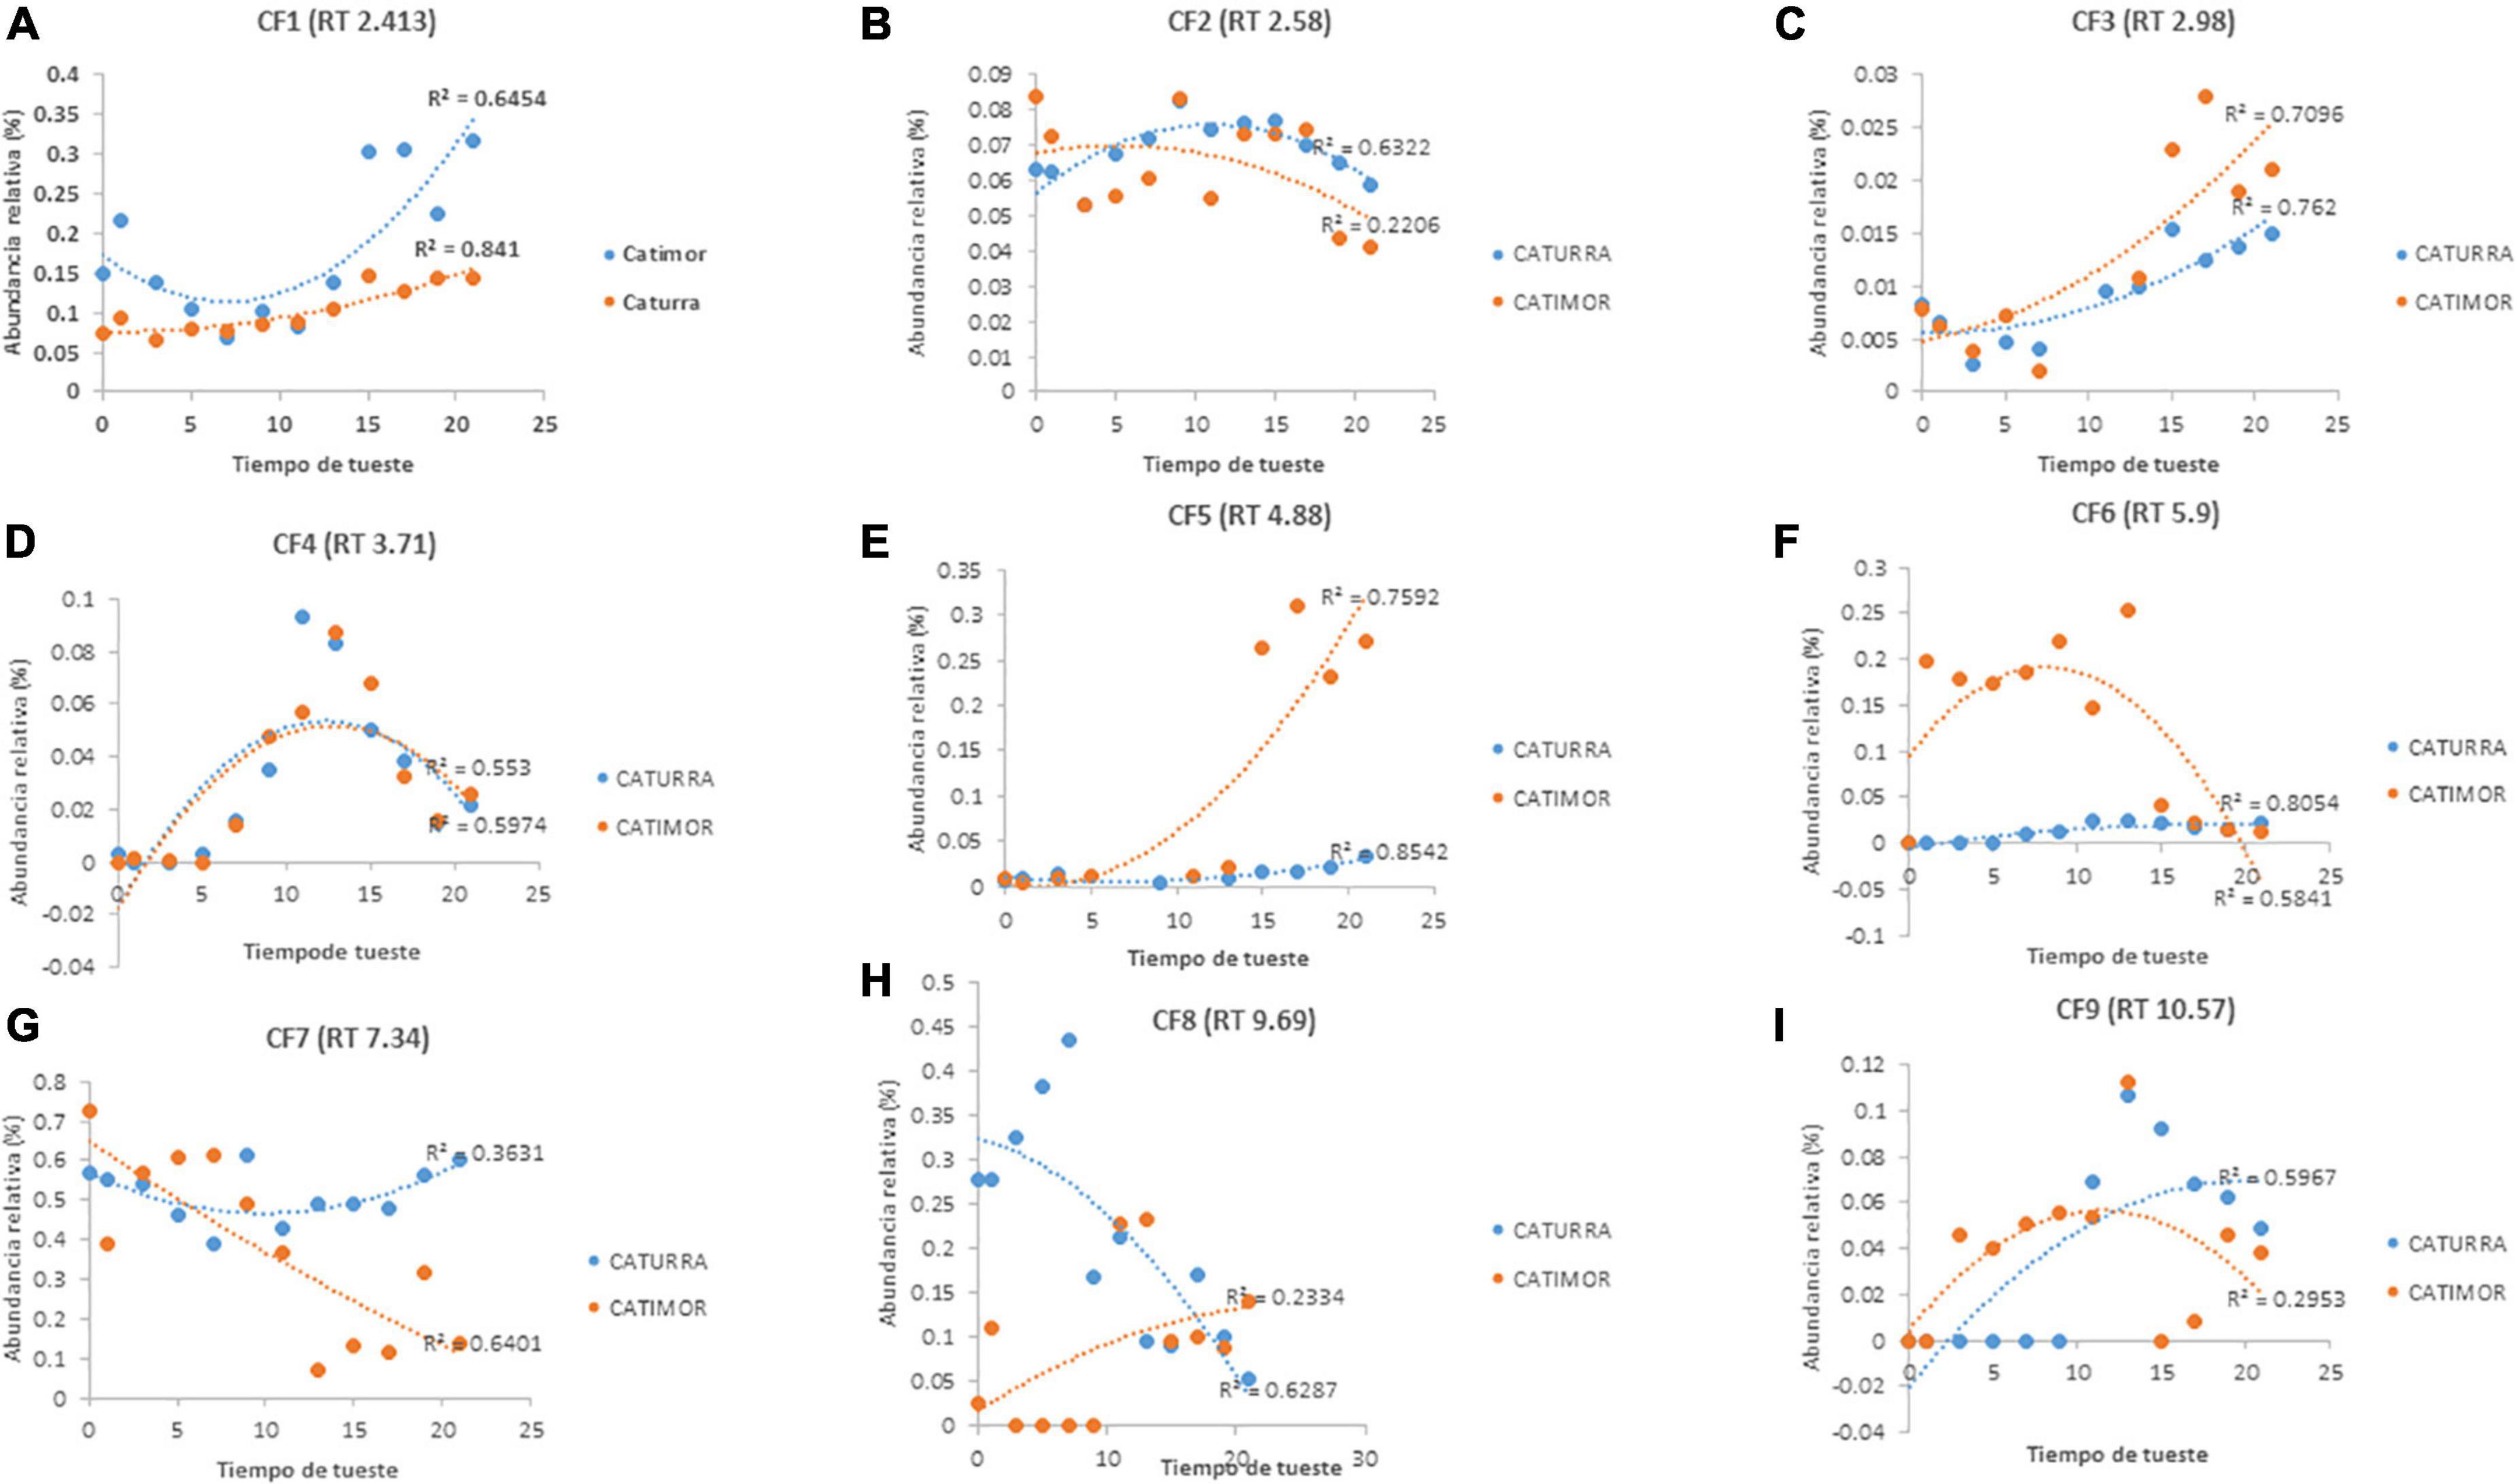
Figure 4. Evolution of phenolic compounds during the roasting of two varieties of Arabica coffee. (A–I) Phenolic compounds identified according to retention time. PC, phenolic compound; RT, retention time.
3.3. Change in phenolic composition of arabica coffee during roasting
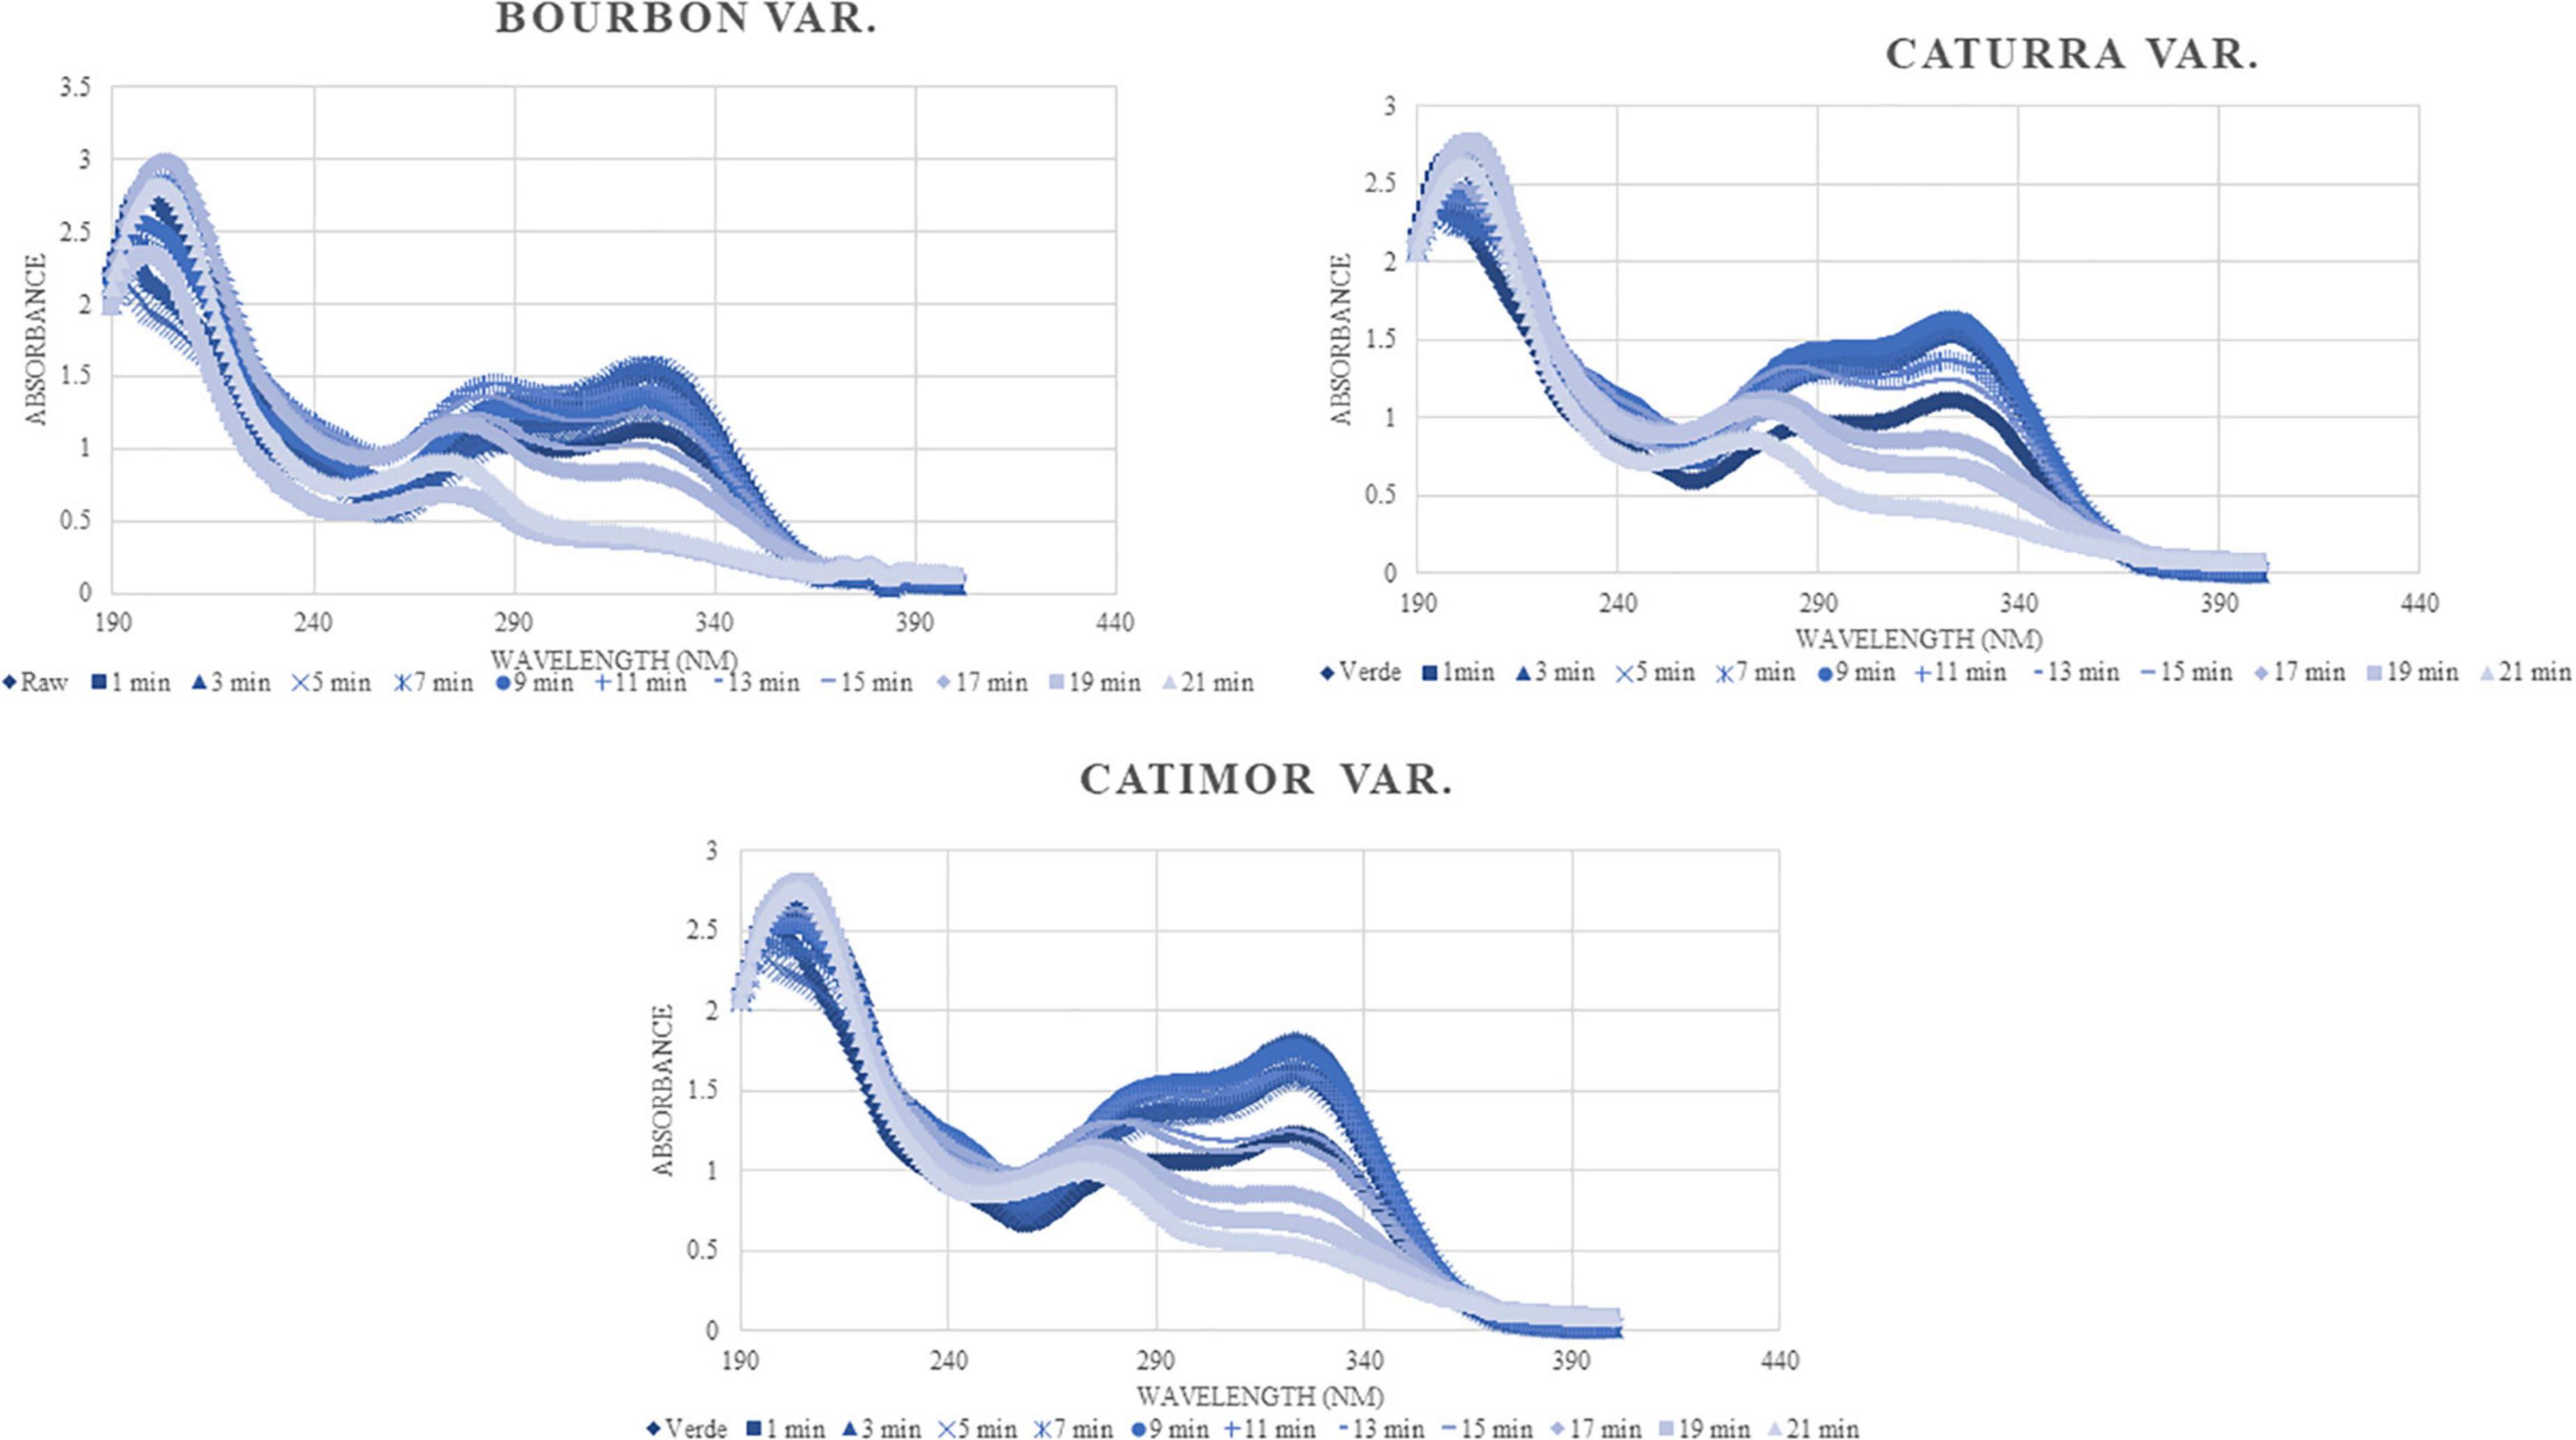
As can be seen in Figure 5, and as expected, all the spectra have the same trend; however, there are differences in the content of compounds identified, basically in the detection spectrum of phenolic compounds (240–340). The phenolic content of the raw samples increases until minute 9 of roasting and then decreases as a result of the process.
3.4. Fracturability of arabica coffee beans during roasting
Figure 6 shows that as the degree of roasting increases, the beans are easier to break. During the first 5 min of roasting, there is a reduction in hardness that is maintained, but moderately until the end of the roasting process. In addition, there are significant differences between varieties (p < 0.05). Bourbon coffee requires greater force to fracture the beans during the first minutes, but from minute three onward it presents greater bean fracturability compared to Catimor and Caturra.
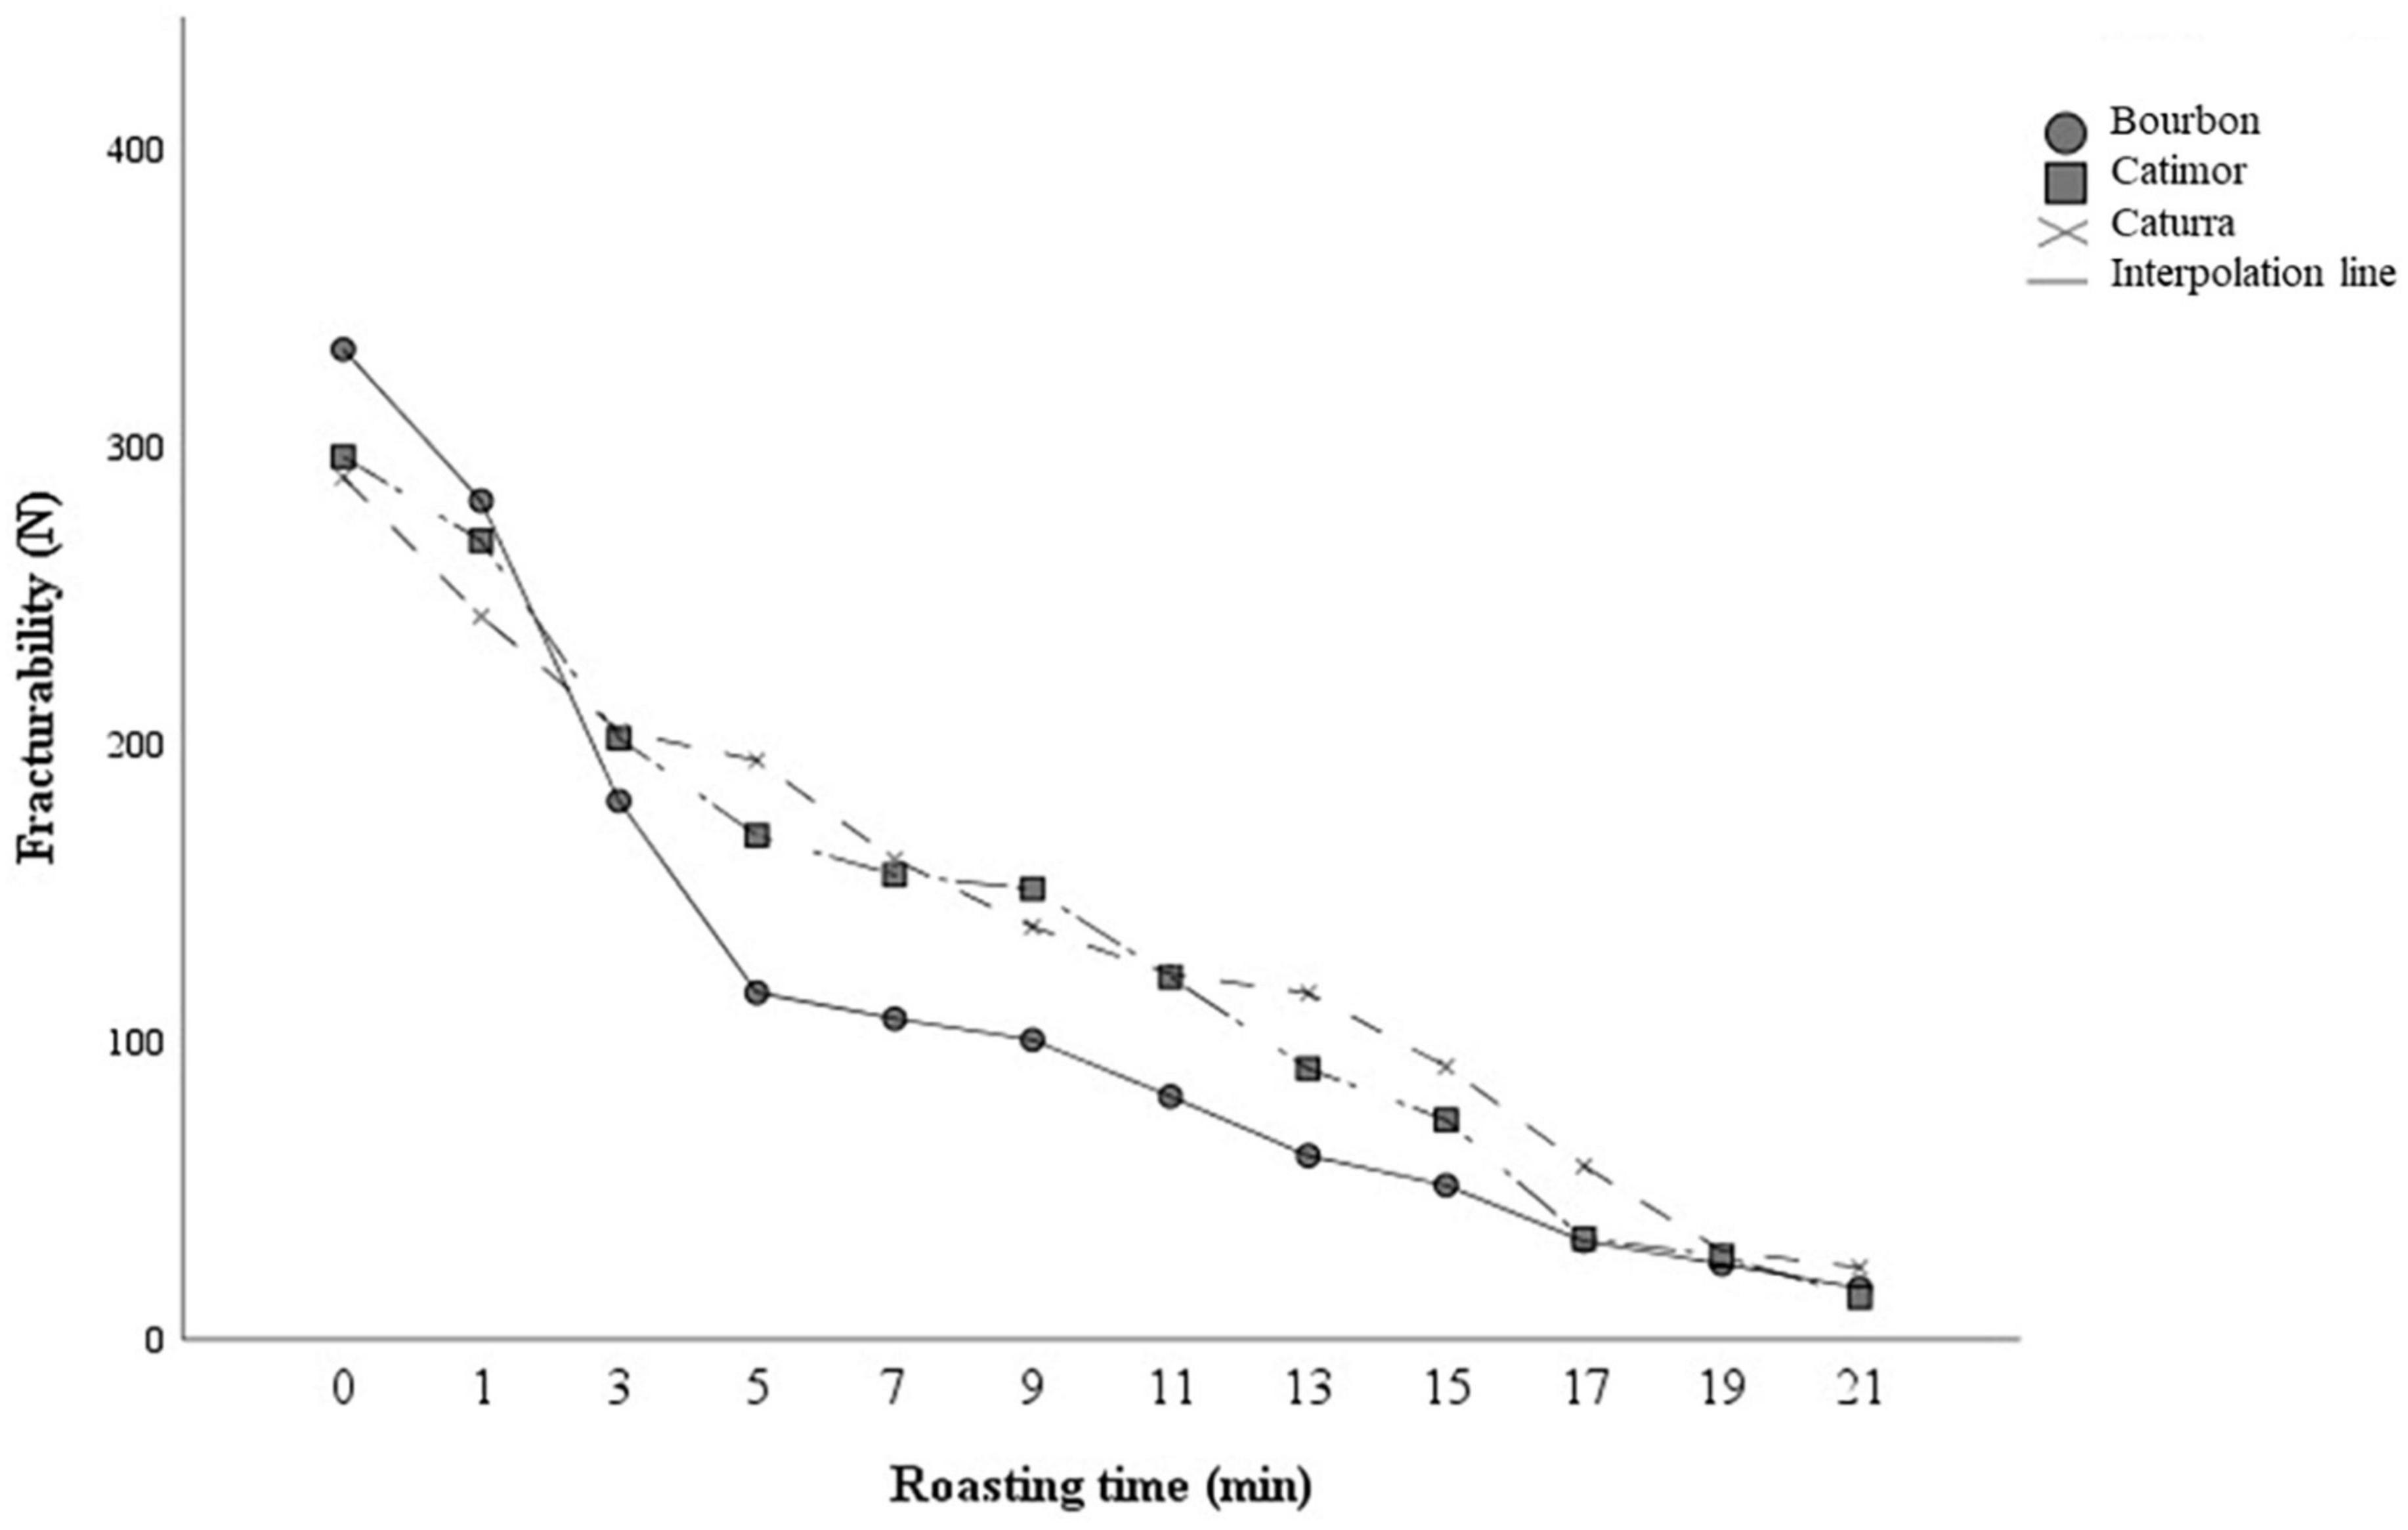
Figure 6. Changes in the fracturability of coffee beans during the roasting process. Curves represent averages (n = 3).
4. Discussion
Coffee roasting times usually range from 8 to 12 min, depending on the degree of roasting required (26, 27). In this research, the roasting time was extended to 21 min to determine changes in bioactive compounds.
Although the variety of coffee is a determining factor with regard to its chemical characteristics (28), the post-harvest process conditions should also be taken into account. The unroasted samples of the Bourbon variety had higher acidity (1.50%) and lower moisture content (10.41%) and density (772 g/L), in contrast to the two others varieties studied, which could influence the results (29). In fact, for this variety, the kinetic models of antioxidant activity had a greater fit (R2 = 0.92 for the cubic model), and in terms of total phenol content, the best fit was obtained for the Catimor variety.
As in most foods (30), phenolic compounds are mainly responsible for the antioxidant activity in coffee. Kinetic models of the phenolic content of coffee during roasting are different from models describing changes in antioxidant activity. This is because although phenolic compounds are the main antioxidants in coffee, there are other compounds such as those derived from the Maillard reaction that have the capacity to capture free radicals (31). The phenol content in the coffee samples evaluated was higher than those reported by Bobková et al. (32), who obtained values lower than 74 mg AGE/g; in this study, for the Bourbon variety, 80 mg AGE/g of sample was obtained at 5 min of roasting, which could be considered, given the relevance of phenolic compounds (33), for the production of coffee beverages with high bioactive potential.
As reported in other studies (34), roasting favors an increase in phenol content in coffee beans. However, when the time is prolonged (after 5 or 9 min depending on the variety of coffee), a decrease in these compounds is observed, which could be due to the degradation of chlorogenic acid, one of the most important phenols in coffee (11); caffeic acid, on the other hand, is not affected by temperatures below 200°C.
Previous studies have found that green coffee beans have higher antioxidant activity than roasted beans (11, 34). This study clarifies the phenomenon, revealing that in the first minutes there is an increase in antioxidant capacity; however, if the time is prolonged (more than 9 min), the antioxidant capacity decreases to values lower than the initial values.
The ABTS and DPPH radicals allow slightly different approaches to measure antioxidant activity. DPPH reacts with polyphenols but not with phenolic acids (35). Therefore, the sharp decrease in the kinetic models of antioxidant activity could be due to the degradation of phenolic compounds and the formation of phenolic acids, which are captured by ABTS, whose curves reduce less as the roasting time increases (Figure 2).
The initial increase in phenolic compounds and antioxidant capacity of coffee beans during roasting occurs because temperature facilitates the release and generation of antioxidant compounds (36). However, higher temperatures and roasting times may not only degrade bioactive compounds but also generate undesirable compounds in beverages, such as acrylamides (37). This allows us to highlight the importance of the development of roasting models that seek to obtain coffee beverages rich in bioactive compounds but low in compounds harmful to health (38).
Although unroasted green coffee with low roast degrees has a higher phenol content and greater bioactive properties (39), one of the purposes of roasting is to generate aromatic compounds that confer great sensory acceptance. Therefore, roasting modalities should seek to obtain beverages with high acceptance and with the greatest amount of bioactive compounds (34), as assessed via sensory analysis techniques with panelists or instrumentals (40).
Nine phenolic compounds were detected; for seven of these compounds, their concentration tended to increase (Figures 4A–F, I), although the concentration of four compounds (Figures 4B, D, F, I) began to decrease during the roasting process. The behavior of these compounds is similar to that reported in other studies of the phenol profile of green and roasted coffee, reporting that the concentrations of gallic acid and caffeic acid increase due to hydrolysis of chlorogenic acids (9); in this work it was shown that when the roasting time is prolonged (more than 10 min), these compounds are affected and their content is reduced. In contrast, the concentrations of two phenolic compounds (Figures 4G, H) decreased from the start of roasting, similar to what occurs with chlorogenic acid, the main phenolic compound in coffee, and other phenolic compounds with antioxidant potential (8, 9, 11, 41).
As demonstrated in previous studies, the UV-Vis spectrum at certain wavelengths, allows observing changes in the content of phenolic compounds (25, 42, 43). Most phenolic compounds are detected between 200 and 340 nm (44). Therefore, changes in caffeine and chlorogenic acid content can be observed in that range of analysis, the content of which decreases as the degree of roasting of coffee increases (45).
During the roasting process coffee beans undergo physical, chemical, structural and sensory changes (46). The hardness of coffee beans is affected by roasting conditions, in effect the beans lose strength and hardness, and become increasingly brittle (47). This effect of roasting has been observed in the three varieties of coffee studied in this research. Coffee beans of the Bourbon variety reduce their fracturability faster than the Caturra and Catimor varieties during roasting, which would influence the grinding process. The differences between varieties could be attributed to the moisture content, anatomy and density of the beans, since these factors influence the increase in volume, porosity and pyrolysis reaction during roasting (47, 48).
5. Conclusion
Both the phenolic content and the antioxidant capacity of coffee beans are affected by roasting. Both increase up to minutes 5 and 9 depending on the variety and then decrease to concentrations below the initial value when roasting lasts longer than necessary. Changes in antioxidant compounds during roasting depend on the variety and the physicochemical characteristics of the coffee bean. The cubic mathematical model is the one that best fits the changes in phenolic and antioxidant compounds. The hardness of the coffee bean also decreases with roasting. Finally, it is confirmed that the roasting process negatively affects bioactive compounds and increases the fracturability of coffee beans, elements that should be taken into account when developing roasting profiles in the industry.
Data availability statement
The original contributions presented in this study are included in the article/supplementary material, further inquiries can be directed to the corresponding author.
Author contributions
MM and SC: conceptualization. MM and PM-C: methodology. SC, MM, and PM-C: formal analysis, research and writing—preparing the original draft, and writing—revision and editing. SC: funding acquisition. All authors contributed to the article and approved the submitted version.
Funding
This research was funded by the Universidad Nacional Toribio Rodríguez de Mendoza through the Instituto de Investigación para el Desarrollo Sustentable de Ceja de Selva INDES-CES, Project “Creación de los Servicios del Centro de Investigación, Innovación y Transferencia Tecnológica de Café” SNIP N° 352439.
Conflict of interest
The authors declare that the research was conducted in the absence of any commercial or financial relationships that could be construed as a potential conflict of interest.
Publisher’s note
All claims expressed in this article are solely those of the authors and do not necessarily represent those of their affiliated organizations, or those of the publisher, the editors and the reviewers. Any product that may be evaluated in this article, or claim that may be made by its manufacturer, is not guaranteed or endorsed by the publisher.
References
1. Bosso H, Barbalho S, de Alvares Goulart R, Otoboni A. Green coffee: economic relevance and a systematic review of the effects on human health. Crit Rev Food Sci Nutr. (2021) 63:394–410. doi: 10.1080/10408398.2021.1948817
2. Nkondjock A. Coffee consumption and the risk of cancer: an overview. Cancer Lett. (2009) 277:121–5. doi: 10.1016/j.canlet.2008.08.022
3. Depaula J, Farah A. Caffeine consumption through coffee: content in the beverage, metabolism, health benefits and risks. Beverages. (2019) 5:37. doi: 10.3390/beverages5020037
4. Lahis D, Karen N, Canan C, de Toledo M, Moraes E. Main minerals and organic compounds in comercial roasted and ground coffee: an exploratory data analysis. Quim Nova. (2021) 44:70–5.
5. Alcantara G, Dresch D, Melchert W. Use of non-volatile compounds for the classification of specialty and traditional Brazilian coffees using principal component analysis. Food Chem. (2021) 360:130088. doi: 10.1016/j.foodchem.2021.130088
6. Jung S, Gu S, Lee S, Jeong Y. Effect of roasting degree on the antioxidant properties of espresso and drip coffee extracted from coffea arabica cv. Java. Appl Sci. (2021) 11:7025. doi: 10.3390/app11157025
7. Lee S, Kim M, Lee K. Effect of reversed coffee grinding and roasting process on physicochemical properties including volatile compound profiles. Innov Food Sci Emerg Technol. (2017) 44:97–102. doi: 10.1016/j.ifset.2017.07.009
8. Wang H, Qian H, Yao W. Melanoidins produced by the maillard reaction: structure and biological activity. Food Chem. (2011) 128:573–84. doi: 10.1016/j.foodchem.2011.03.075
9. Somporn C, Kamtuo A, Theerakulpisut P, Siriamornpun S. Effects of roasting degree on radical scavenging activity, phenolics and volatile compounds of Arabica coffee beans (Coffea arabica L. cv. Catimor). Int J Food Sci Technol. (2011) 46:2287–96. doi: 10.1111/j.1365-2621.2011.02748.x
10. Vignoli J, Viegas M, Bassoli D, De Toled Benassi M. Roasting process affects differently the bioactive compounds and the antioxidant activity of Arabica and Robusta coffees. Food Res Int. (2014) 61:279–85. doi: 10.1016/j.foodres.2013.06.006
11. Mehaya F, Mohammad A. Thermostability of bioactive compounds during roasting process of coffee beans. Heliyon. (2020) 6:e05508. doi: 10.1016/j.heliyon.2020.e05508
12. Hasbullah U, Umiyati D. Antioxidant activity and total phenolic compounds of Arabica and Robusta coffee at different roasting levels. J Phys Conf Ser. (2021) 1764:12033. doi: 10.1088/1742-6596/1764/1/012033
13. Seow L, Shamlan S, Seow E. Influence of roasting degrees on the antioxidant and anti-angiogenic effects of Coffea liberica. J Food Meas Charact. (2021) 15:1. doi: 10.1007/s11694-021-00987-7
14. Misto M, Alawiyah K, Rohman L, Supriyadi A, Mutmainnah M, Purwandari E. Spectrophotometric analysis of caffeine in local product of Arabica: observed at different roasted temperatures. IOP Conf Ser Mater Sci Eng. (2021) 1173:12012. doi: 10.1088/1757-899X/1173/1/012012
15. Fernández-Romero E, Chavez-Quintana S, Siche R, Castro-Alayo E, Cardenas-Toro F. The kinetics of total phenolic content and monomeric Flavan-3-ols during the roasting process of Criollo Cocoa. Antioxidants. (2020) 9:146. doi: 10.3390/antiox9020146
16. Maldonado-Mateus L, Perez-Burillo S, Lerma-Aguilera A, Hinojosa-Nogueira D, Ruíz-Pérez S, Gosalbes M, et al. Effect of roasting conditions on cocoa bioactivity and gut microbiota modulation. Food Funct. (2021) 12:9680–92. doi: 10.1039/D1FO01155C
17. Várady M, Ślusarczyk S, Boržíkova J, Hanková K, Vieriková M, Marcinčák S, et al. Heavy-metal contents and the impact of roasting on polyphenols, caffeine, and acrylamide in specialty coffee beans. Foods. (2021) 10:1310. doi: 10.3390/foods10061310
18. Hasni D, Safriani N, Nilda C, Rahmad D, Aneiza R. Comparison of radical scavenging activity of commercial Arabica and Robusta coffee based on roasting method and brewing condition. IOP Conf Ser Earth Environ Sci. (2021) 644:12075. doi: 10.1088/1755-1315/644/1/012075
19. Muzykiewicz-Szymańska A, Nowak A, Wira D, Klimowicz A. The effect of brewing process parameters on antioxidant activity and caffeine content in infusions of roasted and unroasted Arabica coffee beans originated from different countries. Molecules. (2021) 26:3681. doi: 10.3390/molecules26123681
21. Brand-Williams W, Cuvelier M, Berset C. Use of a free radical method to evaluate antioxidant activity. Leb Technol. (1995) 28:25–30. doi: 10.1016/S0023-6438(95)80008-5
22. Çelik E, Gökmen V. A study on interactions between the insoluble fractions of different coffee infusions and major cocoa free antioxidants and different coffee infusions and dark chocolate. Food Chem. (2018) 255:8–14. doi: 10.1016/j.foodchem.2018.02.048
23. Del Castillo M, Ames J, Gordon M. Effect of roasting on the antioxidant activity of coffee brews. J Agric Food Chem. (2002) 50:3698–703. doi: 10.1021/jf011702q
24. Del RosarioBrunetto M, Gutiérrez L, Delgado Y, Gallignani M, Zambrano A, Gómez Á, et al. Determination of theobromine, theophylline and caffeine in cocoa samples by a high-performance liquid chromatographic method with on-line sample cleanup in a switching-column system. Food Chem. (2007) 100:459–67. doi: 10.1016/j.foodchem.2005.10.007
25. Tian W, Chen G, Gui Y, Zhang G, Li Y. Rapid quantification of total phenolics and ferulic acid in whole wheat using UV–Vis spectrophotometry. Food Control. (2021) 123:107691. doi: 10.1016/j.foodcont.2020.107691
26. Dong W, Hu R, Long Y, Li H, Zhang Y, Zhu K, et al. Comparative evaluation of the volatile profiles and taste properties of roasted coffee beans as affected by drying method and detected by electronic nose, electronic tongue, and HS-SPME-GC-MS. Food Chem. (2019) 272:723–31. doi: 10.1016/j.foodchem.2018.08.068
27. Anastácio L, da Silva M, Debona D, Veloso T, Entringer T, Bullergahn V, et al. Relationship between physical changes in the coffee bean due to roasting profiles and the sensory attributes of the coffee beverage. Eur Food Res Technol. (2022) 9:1–13. doi: 10.1007/s00217-022-04118-4
28. Priftis A, Stagos D, Konstantinopoulos K, Tsitsimpikou C, Spandidos D, Tsatsakis A, et al. Comparison of antioxidant activity between green and roasted coffee beans using molecular methods. Mol Med Rep. (2015) 12:7293–302. doi: 10.3892/mmr.2015.4377
29. Ramalakshmi K, Kubra I, Rao L. Physicochemical characteristics of green coffee: comparison of graded and defective beans. J Food Sci. (2007) 72:S333–7. doi: 10.1111/j.1750-3841.2007.00379.x
30. Dang T, Bowyer M, Van Altena I, Scarlett C. Comparison of chemical profile and antioxidant properties of the brown algae. Int J Food Sci Technol. (2018) 53:174–81. doi: 10.1111/ijfs.13571
31. Liao Y, Kim T, Silva J, Hu W, Chen B. Effects of roasting degrees on phenolic compounds and antioxidant activity in coffee beans from different geographic origins. LWT. (2022) 168:113965. doi: 10.1016/j.lwt.2022.113965
32. Bobková A, Hudááčk M, Jakabová S, Belej L’, Čurlej J, Bobko M, et al. The effect of roasting on the total polyphenols and antioxidant activity of coffee. J Environ Sci Heal Part B. (2020) 55:495–500. doi: 10.1080/03601234.2020.1724660
33. Albuquerque B, Heleno SA, Oliveira M, Barros L, Ferreira I. Phenolic compounds: current industrial applications, limitations and future challenges. Food Funct. (2021) 12:14–29. doi: 10.1039/D0FO02324H
34. Saeed M, Musa M, Uslu N, Salamatullah A, Hayat K. Effect of microwave and oven roasting methods on total phenol, antioxidant activity, phenolic compounds, and fatty acid compositions of coffee beans. J Food Process Preserv. (2020) 44:1–9. doi: 10.1111/jfpp.14874
35. Mareček V, Mikyška A, Hampel D, Čejka P, Neuwirthová J, Malachová A, et al. ABTS and DPPH methods as a tool for studying antioxidant capacity of spring barley and malt. J Cereal Sci. (2017) 73:40–5. doi: 10.1016/j.jcs.2016.11.004
36. Wu H, Gu J, Bk A, Nawaz M, Barrow C, Dunshea F, et al. Effect of processing on bioavailability and bioaccessibility of bioactive compounds in coffee beans. Food Biosci. (2021) 2021:101373. doi: 10.1016/j.fbio.2021.101373
37. Esposito F, Fasano E, De Vivo A, Velotto S, Sarghini F, Cirillo T. Processing effects on acrylamide content in roasted coffee production. Food Chem. (2020) 319:1–7. doi: 10.1016/j.foodchem.2020.126550
38. Schouten M, Tappi S, Angeloni S, Cortese M, Caprioli G, Vittori S, et al. Acrylamide formation and antioxidant activity in coffee during roasting – A systematic study. Food Chem. (2021) 343:128514. doi: 10.1016/j.foodchem.2020.128514
39. Souza L, De Carrero Horta I, De Souza Rosa L, Barbosa Lima L, Santos Da Rosa J, Montenegro J, et al. Effect of the roasting levels of: Coffea arabica L. extracts on their potential antioxidant capacity and antiproliferative activity in human prostate cancer cells. RSC Adv. (2020) 10:30115–26. doi: 10.1039/D0RA01179G
40. Suh Y, Lee S, Shang Y, Lee W. Effects of roasting conditions on the physicochemical properties of Coffea arabica beans. Korean J Food Preserv. (2015) 22:690–8. doi: 10.11002/kjfp.2015.22.5.690
41. Yashin A, Yashin Y, Wang J, Nemzer B. Antioxidant and antiradical activity of coffee. Antioxidants. (2013) 2:230–45. doi: 10.3390/antiox2040230
42. Naczk M, Pink J, Zadernowski R, Pink D. Multivariate model for the prediction of total phenolic acids in crude extracts of polyphenols from canola and rapeseed meals: a preliminary study. J Am Oil Chem Soc. (2002) 79:759–62. doi: 10.1007/s11746-002-0555-x
43. Luthria DL. A simplified UV spectral scan method for the estimation of phenolic acids and antioxidant capacity in eggplant pulp extracts. J Funct Foods. (2012) 4:238–42. doi: 10.1016/j.jff.2011.11.002
44. Aleixandre-Tudo J, Buica A, Nieuwoudt H, Aleixandre J, Du Toit W. Spectrophotometric analysis of phenolic compounds in grapes and wines. J Agric Food Chem. (2017) 65:4009–26. doi: 10.1021/acs.jafc.7b01724
45. Navarra G, Moschetti M, Guarrasi V, Mangione M, Militello V, Leone M. Simultaneous determination of caffeine and chlorogenic acids in green coffee by UV/Vis spectroscopy. J Chem. (2017) 2017:1–8. doi: 10.1155/2017/6435086
47. Pittia P, Dalla Rosa M, Lerici C. Textural changes of coffee beans as affected by roasting conditions. LWT. (2001) 34:168–75. doi: 10.1006/fstl.2000.0749
Keywords: Bourbon, Catimor, Caturra, bioactive compound, green grain
Citation: Mestanza M, Mori-Culqui PL and Chavez SG (2023) Changes of polyphenols and antioxidants of arabica coffee varieties during roasting. Front. Nutr. 10:1078701. doi: 10.3389/fnut.2023.1078701
Received: 24 October 2022; Accepted: 09 January 2023;
Published: 26 January 2023.
Edited by:
Sandrina A. Heleno, Polytechnic Institute of Bragança (IPB), PortugalReviewed by:
Fariborz Habibi, University of Florida, United StatesFosca Vezzulli, Università Cattolica del Sacro Cuore, Italy
Copyright © 2023 Mestanza, Mori-Culqui and Chavez. This is an open-access article distributed under the terms of the Creative Commons Attribution License (CC BY). The use, distribution or reproduction in other forums is permitted, provided the original author(s) and the copyright owner(s) are credited and that the original publication in this journal is cited, in accordance with accepted academic practice. No use, distribution or reproduction is permitted which does not comply with these terms.
*Correspondence: Segundo G. Chavez,  c2VndW5kby5xdWludGFuYUB1bnRybS5lZHUucGU=
 Marilu Mestanza
 Pati Llanina Mori-Culqui
 Segundo G. Chavez