 Barbara Brayner
 Gunveen Kaur
 Michelle A. Keske
 Laura E. Marchese
 Katherine M. Livingstone
94% of researchers rate our articles as excellent or good
Learn more about the work of our research integrity team to safeguard the quality of each article we publish.
Find out more
SYSTEMATIC REVIEW article
Front. Nutr., 01 June 2023
Sec. Nutritional Epidemiology
Volume 10 - 2023 | https://doi.org/10.3389/fnut.2023.1071855
This article is part of the Research TopicHealthy Foods and Dietary Patterns in Modern ConsumerView all 15 articles
The effect of dietary fat on type 2 diabetes (T2D) risk is unclear. A posteriori dietary pattern methods have been increasingly used to investigate how dietary fats impact T2D risk. However, the diverse nutrients, foods and dietary patterns reported in these studies requires examination to better understand the role of dietary fats. This scoping review aimed to systematically search and synthesize the literature regarding the association between dietary patterns characterized by dietary fats and T2D risk using reduced rank regression. Medline and Embase were searched for cross-sectional, cohort or case-control studies published in English. Of the included studies (n = 8), five high-fat dietary patterns, mostly high in SFA, were associated with higher T2D risk or fasting glucose, insulin and Homeostasis Model Assessment (HOMA) levels. These were mostly low-fiber (n = 5) and high energy-density (n = 3) dietary patterns characterized by low fruit and vegetables intake, reduced fat dairy products and higher processed meats and butter intake. Findings from this review suggest that a posteriori dietary patterns high in SFA that increase T2D risk are often accompanied by lower fruits, vegetables and other fiber-rich foods intake. Therefore, healthy dietary fats consumption for T2D prevention should be encouraged as part of a healthful dietary pattern.
Type 2 diabetes (T2D) is a chronic condition characterized by elevated glucose levels, or hyperglycaemia (1). If left untreated, chronic hyperglycaemia can lead to an increased risk of cardiometabolic complications and early death (1). In the past 30 years, the prevalence of T2D has increased from approximately 108 million to 422 million adults worldwide (2). The projections estimate that by 2045, 700 million individuals will develop diabetes (3). Therefore, understanding how T2D progresses is critical for developing preventative methods to lower its incidence worldwide.
An unhealthy diet is considered one of the key risk factors for the onset of T2D (4). Whilst the benefits of managing some dietary risk factors, such as carbohydrate intake, have been well researched (5) the role of dietary fats is less clear and this is likely due to the varying sources of fat in our diet (6). Higher polyunsaturated fatty acids (PUFA) intake has been linked to lower fasting blood glucose levels (7) and reduced T2D incidence (8, 9), whilst higher saturated fatty acid (SFA) intake has been linked to the development of insulin resistance (10). However, SFA intake may also differentially affect the risk of developing T2D, depending on its food source; SFA from meat may increase risk (11, 12) whereas SFA from dairy may decrease risk of T2D (13). Moreover, some studies also report no association between dietary fat type and risk of T2D (6, 14). The majority of studies to date have focused on a single nutrient approach (10, 14–16). However, as foods and nutrients are not eaten in isolation, understanding of the role of dietary fat within the context a dietary pattern is warranted.
There are three main delineations of dietary pattern methodologies: a priori, empirical and a posteriori (16, 17). The a priori, or hypothesis-oriented approach, derives dietary patterns using a pre-defined criterion (16) whilst empirical methods use a data-driven approach to create dietary patterns according to the combinations of foods consumed in a specific population (16). Extensive research has been conducted to investigate the association between a priori and empirical dietary patterns and T2D (18, 19). However, the use of a posteriori dietary pattern methods to understand T2D is only beginning to be explored.
A posteriori methods, such as reduced rank regression, combine both hypothesis-oriented and data driven approaches to create patterns of food intake according to pre-defined response variables (16, 20, 21). The response variables selected for use in reduced rank regression are known to be on the causal pathway between diet and the health outcome of interest, which can include biomarkers or nutrient intake. While increasing research has used reduced rank regression to investigate the association between diet and T2D using biomarkers as response variables (22–25) few studies have used nutrient intakes as response variables (16, 26–28). An understanding of how dietary fats, within the context of overall dietary patterns, impact on T2D risk is important for advancing T2D research beyond a single nutrient-focus. Therefore, the aim of this scoping review was to systematically search and synthesize the literature regarding the association between dietary fats and risk of T2D while using reduced rank regression.
This scoping review included publications from human observational studies (cross-sectional and cohort studies) from inception to November 2021. To be eligible for inclusion, studies were required to include information on: (i) a posteriori dietary patterns that used dietary fat [saturated fat (SFA), monounsaturated fat (MUFA), polyunsaturated fat (PUFA), total fat, unsaturated fat, omega-3, omega-6, eicosapentaenoic acid (EPA), docosapentaenoic acid (DPA), docosahexaenoic acid (DHA), arachidonic acid (AA)] as at least one of the response variables regardless of the other response variables (could be nutrient or biomarker); and (ii) T2D risk, insulin resistance, homeostasis model assessment of insulin resistance (HOMA-IR), fasting insulin, fasting glucose, glycated hemoglobin (HbA1c), oral glucose tolerance test (OGTT) or gestational diabetes as an outcome. As a preliminary search identified few studies that investigated T2D as an outcome, the authors have included related outcomes to provide a more comprehensive overview of the research question. All population groups were included. Non-English publications were excluded. This scoping review was undertaken in accordance with Preferred Reporting Items for Systematic Reviews and Meta-analysis—Extension for Scoping Reviews (PRISMA-ScR) (29).
Two electronic databases (Medline and Embase) were searched in November 2021. An updated search was run in July 2022.
The search strategy was developed and piloted in consultation with a librarian. It involved combining two search themes using the Boolean operator “and”, while only searching titles and abstract. The first theme was (“reduced rank regression” or “rrr”) and the second theme was (“type 2 diabetes” or “T2D” or “T2DM” or “type 2 diabetes mellitus” or “TIIDM” or “insulin resistance” or “insulin resistant” or “IR” or “impaired glucose tolerance” or “pre-diabetes” or “glucose intolerance” or “impaired fasting glucose” or “gestational diabetes” or “GDM”). To identify all possible studies that used reduced rank regression, “fat” and “dietary fats” was not used as a search term. Instead, these terms were included during the screening of titles and abstracts by two independent reviewers.
The search results were exported to Covidence. Initial screening of articles titles and abstracts was performed by two independent reviewers (BB and LM) according to the inclusion and exclusion criteria. If both reviewers agreed on the suitability of the article, it was moved to full text screening and again reviewed independently by two reviewers. If there was any disagreement, a third reviewer (KML) was consulted. Duplicates were removed via the in-built function in Covidence.
Data extraction was performed by using a pre-piloted Excel template. The following information was extracted: (i) study design, sample size; (ii) dietary assessment method; (iii) dietary patterns: food groups (predictors) and nutrient intakes (response variables); (iv) outcomes; (v) adjustments made in the analysis; (vi) main results. In studies investigating multiple outcomes, only the outcomes listed in the eligibility criteria were summarized. Where response variables included a combination of nutrient intakes and other measures, these were also extracted.
A narrative approach was used to summarize the main findings of included studies. Results were presented by grouping included studies based on their outcome to better describe the level of evidence for T2D and related outcomes and highlight any gaps in knowledge.
The initial search identified a total of 270 records. After removal of duplicates, titles and abstracts of 207 records were screened and 188 were excluded for not meeting our pre-defined inclusion criteria. Full texts for 19 reports were screened. Of these, 11 articles were excluded: n = 5 exposure didn't match inclusion criteria (reduced rank regression response variable didn't include dietary fat), n = 4 did not have a full-text available, n = 1 was a duplicate of another study and n = 1 had an ineligible study design (meta-analysis). In total, eight studies were deemed eligible and were included in the present review (Figure 1).
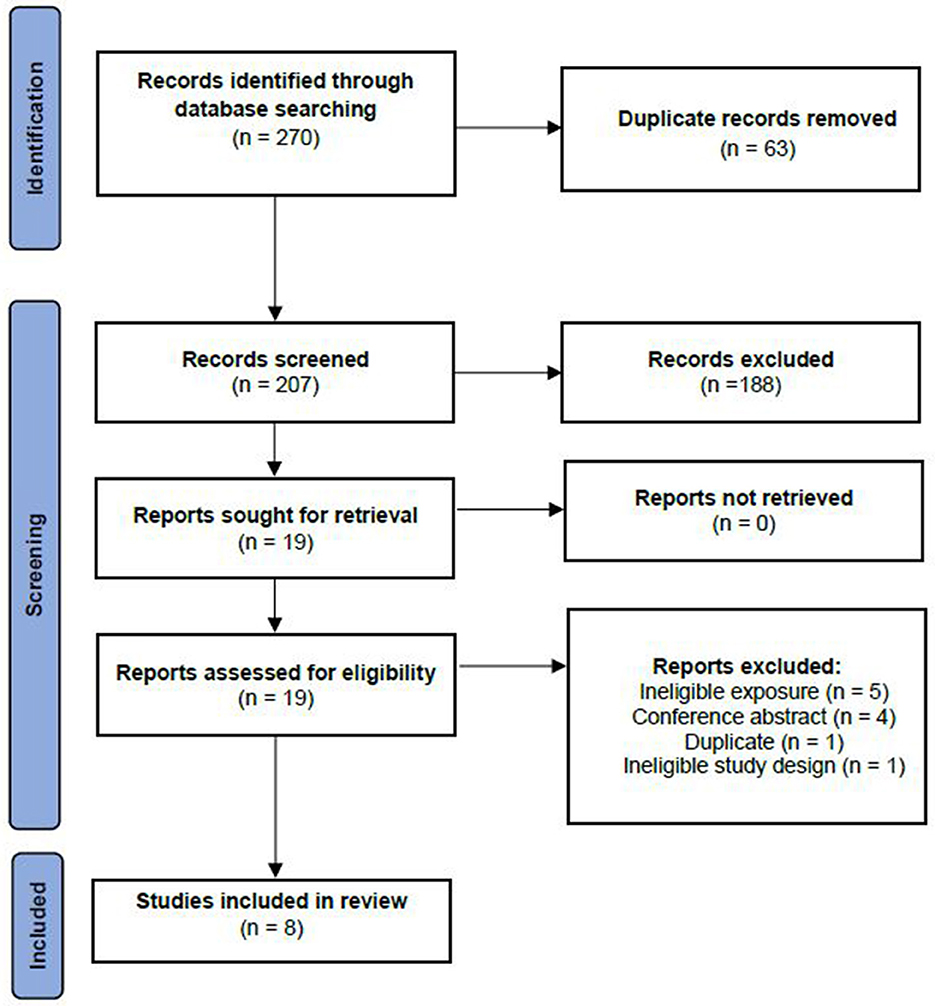
Figure 1. Study selection for inclusion in the systematic review based on the preferred reporting items for systematic reviews and meta-analyses —extension for scoping reviews (PRISMA-ScR).
The description of the studies included in this scoping review is presented in Table 1. Six studies had a prospective design (16, 26, 28, 30, 32) and two were cross-sectional (27, 33). All studies included both male and female participants, except for one study, which investigated the odds of developing GDM in pregnant women (33). Sample sizes ranged from 249 (33) to 120,343 (31). Three studies were conducted in the United Kingdom (26, 28, 31) and others were conducted in Germany (16) Sweden (32) Australia (30) United States (33) and Malaysia (27). Most of the studies (n = 6) were conducted in adults (aged 18 to 69 years), except for two in adolescents (27, 30). One study was conducted in adults with T2D (16) and one in severely obese adults (32). All other studies (n = 6) were conducted in healthy populations (26–28, 30, 31, 33).
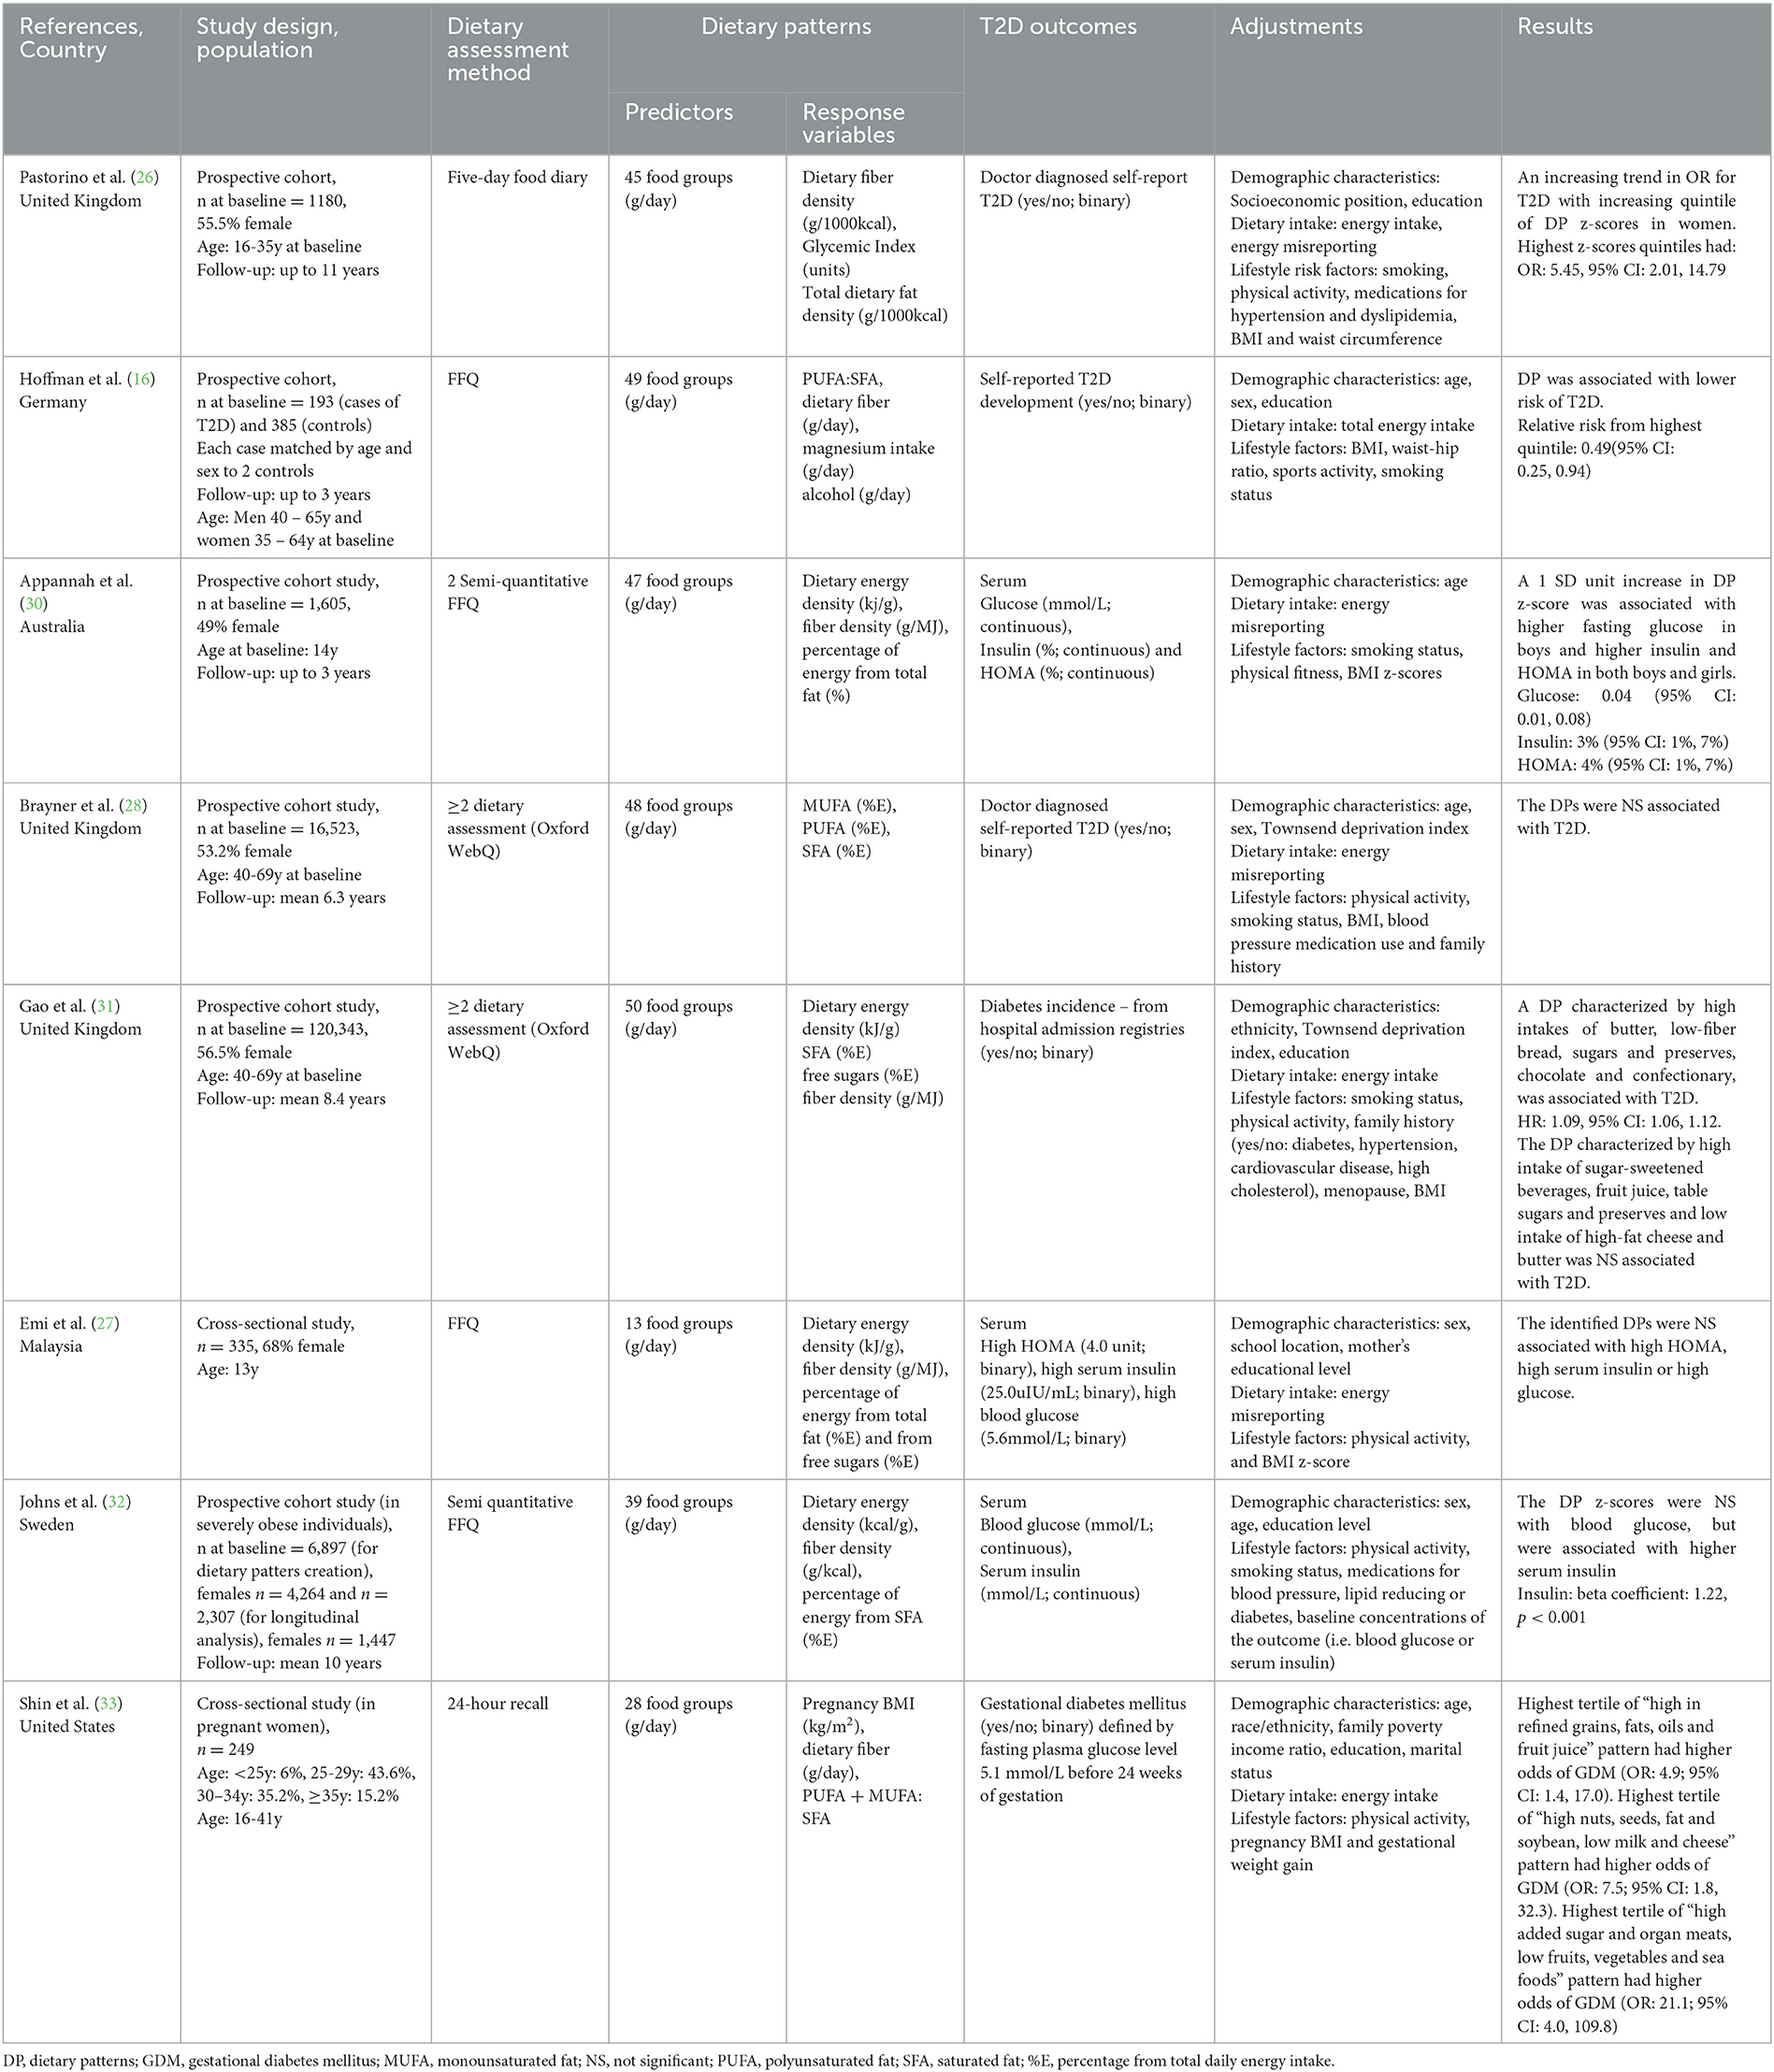
Table 1. Summary of studies investigating the association between a posteriori dietary patterns (reduced rank regression) and T2D and related outcomes [insulin resistance, HOMA-IR, fasting insulin, fasting glucose, oral glucose tolerance test (OGTT) and gestational diabetes].
Two studies used food frequency questionnaires (FFQ) to collect dietary data (16, 27) two used semi-quantitative FFQs (30, 32), two used a 24-hour dietary assessment tool (Oxford WebQ) (28, 31) one used 24-hour dietary recalls (28, 31, 33) and one used food diaries (Table 1) (26).
In terms of dietary pattern predictor variables, food groups were presented in grams per day in all studies, with the number of food groups ranging from 13 (27) to 50 (Table 1) (31). All studies included a rationale for food groups creation. Detailed information on the included food groups is presented in Table 2. Regarding dietary pattern response variables, three studies included a variable for total fat intake: two as percentage from total energy intake (%E) intake (27, 30) and one as fat density (g/1000kcal) (26). Two studies included %E from SFA (29, 33) and one used %E from SFA, PUFA and MUFA (25). Two studies used a ratio of individual dietary fats: one used PUFA:SFA (16) and one used MUFA+PUFA:SFA (33). Seven of the eight included studies used other dietary components in addition to dietary fat as response variables. This included dietary fiber density (g/MJ) (26, 27, 30–32), fiber intake (g/day) (16, 33) glycemic index (%) (26) magnesium intake (g/day) (16) alcohol intake (g/day) (16) %E from free sugars (27, 31) with one study including an anthropometric component [Body Mass Index (BMI kg/m2)] (33). One study included only dietary fats as response variables (28). As summarized in Table 2, each study reported results for multiple dietary patterns. One study reported results for all dietary patterns generated (33). Four studies included dietary patterns that explained as much of the response variable as possible, using subjective cut offs in explained variation ranging from 10 to 20% (26, 28, 30, 31). Three studies only included one of the dietary patterns generated (16, 27, 32).
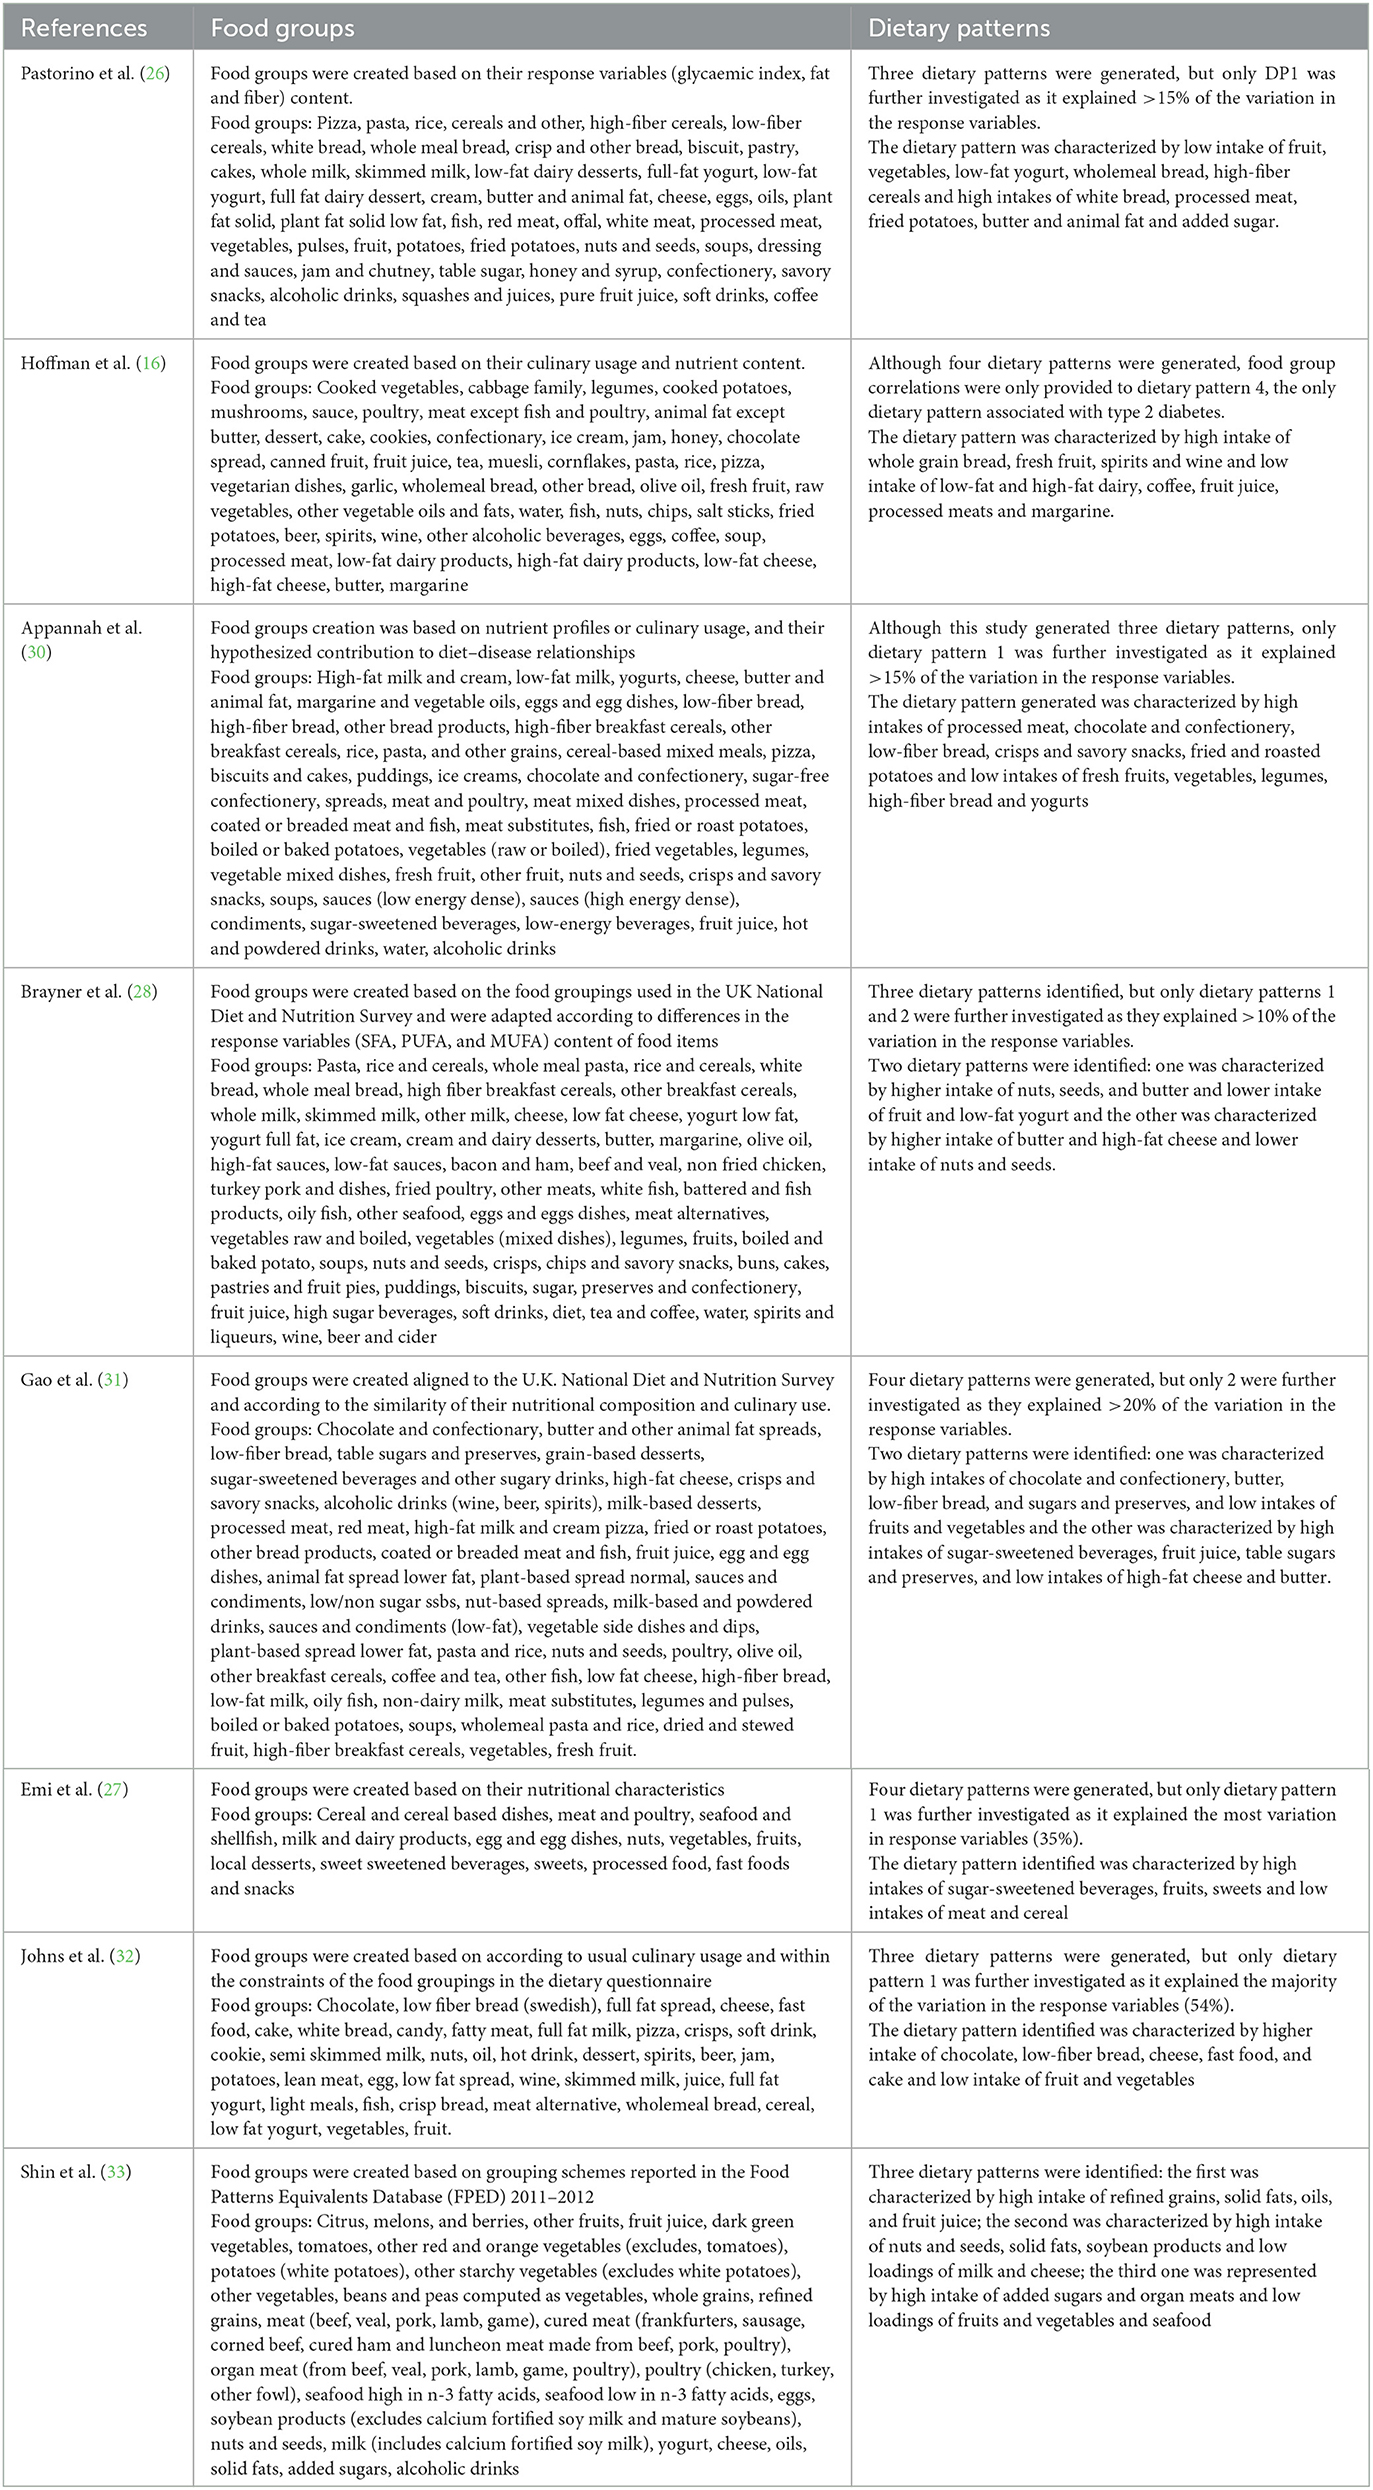
Table 2. Summary of food groups and dietary patterns of included studies.
Four studies investigated T2D incidence (16, 26, 28, 31), two studies investigated associations with HOMA, fasting insulin and glucose levels (27, 30), one study investigated associations with fasting insulin and glucose levels (32) and one study investigated associations with GDM (Table 1) (33).
All included studies adjusted for demographic characteristics, dietary intake and/or lifestyle characteristics (Table 1). All studies adjusted for sex, age, socioeconomic position, education or ethnicity (16, 26–28, 30–33). Seven studies adjusted for either total energy intake or energy intake misreporting (16, 26–28, 30, 31, 33). A combination of some lifestyle factors such as physical activity, BMI, smoking, family history of T2D and/or hypertension and waist to hip ratio were adjusted for in all studies (16, 26–28, 30–33).
Four of the eight studies were prospective studies examining T2D incidence (Table 1). Of these, two studies identified a high-saturated fat dietary pattern associated with higher risk of T2D (26). These studies (n = 2) reported lower intake of foods such as fruit and vegetables (Table 2). Pastorino et al. (26) identified a high-fat, high-GI, low-fiber dietary pattern, characterized by high intake of butter, animal fat and processed meat and low intake of fruits and vegetables, that was associated with higher odds of developing T2D in women (OR: 5.45; 95% CI: 2.01 to 14.79), but not in men. Hoffman et al. (16) generated a low PUFA:SFA ratio and magnesium and high alcohol and fiber pattern, which was significantly associated with lower risk of T2D (relative risk of highest vs lowest quintile: 0.49, 95% CI: 0.25, 0.94). Brayner et al. (28) aimed to investigate the prospective associations between fat-derived dietary patterns and obesity, abdominal obesity and T2D incidence. Of the two dietary patterns investigated, a high SFA and low PUFA and MUFA dietary pattern was associated with higher obesity and abdominal obesity (OR: 1.24, 95% CI: 1.02, 1.45; and OR: 1.19, 95% CI: 1.02, 1.38, respectively), but not with T2D. Gao et al. (31) investigated two dietary patterns. Of these a dietary pattern associated with high intake of chocolate, confectionary, butter, low-fiber bread and low intake of fruits and vegetables (high energy density, SFA, and free sugars and low fiber density pattern) was associated with higher risk of T2D (HR: 1.09, 95% CI: 1.06, 1.12).
Three of the eight studies investigated either prospective (n = 2) or cross-sectional (n = 1) associations with either HOMA, fasting insulin and/or glucose (Table 1). Of these, two studies identified a high-saturated fat dietary pattern associated with higher levels of T2D biomarkers such as fasting insulin, glucose and HOMA (30, 32). These studies reported lower intake of fiber-rich foods such as fruit and vegetables (Table 2). Appannah et al. (30) identified that an energy dense, high-fat, low fiber dietary pattern was associated with 0.04 mmol/L (95% CI: 0.01, 0.08) higher fasting glucose in boys, 3% (95% CI: 1%, 7%) higher insulin and 4% (95% CI: 1%, 7%) higher HOMA in both boys and girls. In contrast, Emi et al. (27) determined that a dietary pattern high in sugar, fiber, high dietary energy density and low fat, and characterized by high intake of sugar sweetened beverages, sweets and low intake of cereal and meat, was not associated with any T2D markers. Johns et al. (32) identified that an energy-dense, low-fiber and higher saturated fat dietary pattern characterized by higher intake of foods such as chocolate, low-fiber bread, cheese and fast food was not associated with blood glucose, but was associated with higher insulin levels (beta coefficient: 1.22 ± 0.17, p < 0.001). Lastly, Shin et al. (33) identified three dietary patterns, “high refined grains, fats, oils and fruit juice”, “high nuts, seeds, fat and soybean; low milk and cheese”, and “high added sugar and organ meats; low fruits, vegetables and seafood”, which were associated with higher odds of GDM (OR:4.9, 95% CI: 1.4, 17.3; OR: 8.2, 95% CI: 1.8, 37.4; OR: 21.1, 95% CI: 4.0, 109.8, respectively).
This is the first scoping review to synthesize information on the associations between dietary fats and risk of T2D in an a posteriori dietary patterns context. The main findings are that of the eight articles included, five high-fat dietary patterns were identified that were positively associated with either T2D incidence or elevated fasting glucose, insulin and/or HOMA levels. All five dietary patterns were characterized by other nutrients in addition to dietary fats, such as low dietary fiber and high dietary energy density, characterized by low intake of fruit and vegetables, reduced fat dairy products and higher intake of processed meats and butter. The only dietary pattern that used exclusively dietary fat as the response variables (namely PUFA, MUFA and SFA) did not find any associations with T2D risk. This suggests that intake of unhealthy fats is often accompanied by lower intake of fruits, vegetables and other fiber-rich foods, which may need to be considered when deriving a posteriori dietary patterns for assessing T2D risk. Therefore, consumption of healthy dietary fats for the prevention of T2D should be encouraged as part of a healthful overall dietary pattern.
Although all studies in this review used dietary fat as one of the response variables, the way these were used varied between studies. Regardless of whether total fat, or individual dietary fats were used, most dietary patterns generated included high factor loadings for meat and dairy (16, 26, 28, 30, 33). This is consistent with literature on the main food sources of saturated fat, where high processed meats intake has been consistently associated with higher risk of T2D and cardiovascular diseases (34, 35) whereas findings for dairy are mixed, and often depend on whether full fat or low fat dairy products are considered separately (36). For the two studies that included saturated and unsaturated fats as response variables, high factor loadings for nuts and seeds were also observed. However, findings from these studies were conflicting; Shin et al. (33) reported that a dietary pattern high in nuts, seeds, fat and soybean was associated with higher odds of developing GDM, whilst Brayner et al. (28) reported that a dietary pattern high in nuts, seeds and butter was not associated with T2D incidence. This difference may be partially attributable to the sample populations, since Shin et al. (33) examined GDM in pregnant women and Brayner et al. (28) examined T2D incidence in healthy adults. Taken together, these findings suggest that the underlying foods that contribute to a high-fat dietary pattern should be taken into consideration to ensure these foods are lower in SFA.
Outcomes from this review align with literature on the effect of dietary fats on fasting serum glucose and insulin levels. The study by Appannah et al. (30) reported an association between a dietary pattern characterized by high intakes of high-SFA foods, such as processed meat, chocolate, savory snacks and fried foods, and higher fasting serum glucose and insulin, which could indicate insulin resistance. This supports evidence from randomized controlled trials (RCT), which have shown that high-SFA diets can decrease insulin sensitivity (37, 38). For example, a 12-week RCT of 486 European adults investigated two high-fat (either high in SFA or high in MUFA) and two low-fat (with or without 1.2 g/day n-3 PUFA supplementation) isocaloric diets. In healthy individuals, the high MUFA diet increased participants' insulin response to glucose, whilst the high SFA diet reduced insulin response (37). Similarly, a meta-analysis of RCTs reported that replacing 5% of energy from SFA with PUFA lead to significant decreases in glucose, HbA1c and HOMA levels. Although the mechanisms behind high-SFA diets and insulin resistance are still unclear, there is evidence to suggest that it might be linked to ceramide production (39). High-SFA diets increase ceramide production, which in turn can impair insulin signaling (39). High-SFA diets have also been suggested to be more inflammatory and chronic low-grade inflammation can inhibit insulin action (40, 41). Although RCTs can provide insight into the causal relationship between dietary fats and glucose or insulin, prospective cohort studies can better understand these associations in a dietary pattern context. Moreover, as fasting glucose and insulin are important biomarkers in T2D development, more prospective studies investigating their long-term associations are needed to better elucidate the associations between dietary fat and T2D incidence in an a posteriori dietary pattern context.
Consistent with this review, evidence suggests that intake of specific nutrients, in addition to dietary fats, may play an important role in the development of T2D (42). Higher dietary fiber, found in fruits and vegetables, for instance, has been shown to modulate blood glucose concentration following a meal (43) and has thus been linked to a lower risk of T2D (5). Conversely, higher intake of carbohydrate, especially refined carbohydrate has a strong positive association with T2D risk (5) High dietary sodium is also linked to insulin resistance (44). Dietary patterns such as Dietary Approaches to Stop Hypertension (DASH) and the Mediterranean diet have dietary fat as a key focus, but are also a rich source of other key nutrients, such as fiber and antioxidants (19). A systematic review and meta-analysis of 48 studies has shown that a higher adherence to either DASH (RR: 0.81; 95% CI: 0.72, 0.92) or Mediterranean diet (RR: 0.87; 95% CI: 0.82, 0.93) was associated with substantial reduction in T2D incidence. Both dietary patterns encourage a high consumption of fiber-rich foods such as fruits and vegetables, along with lower intakes of SFA rich foods such as red meat and processed foods (45, 46). Therefore, the combination of dietary fats with other dietary components may be a stronger predictor for T2D, than any nutrient in isolation. However, as only one study was identified that derived dietary patterns based on dietary fat alone, further prospective evidence is needed to confirm this.
The present review provides supporting evidence for the role of energy-dense dietary patterns as a risk factor for T2D development (47). Half of the studies included in this review included energy density as a response variable (27, 30–32) which has an established positive association with obesity risk (48) whereas associations with T2D are less clear (49). Energy dense foods are also often high in SFA and added sugars, low in fiber and have a high glycaemic load, all of which have been linked to a higher risk of T2D (50). Interestingly, the study by Brayner et al. (28) in which only dietary fats were used to derive dietary patterns, there was no association with T2D. However, there was an association between higher SFA-rich foods and lower PUFA-rich foods with increased odds of developing overall and abdominal obesity. Therefore, although there are no clear associations between dietary fats and T2D, it may be that obesity is on the causal pathway as a key risk factor for T2D development (51). As many as 85% of individuals with T2D have either overweight or obesity (52). Further, obesity can contribute to low-grade chronic inflammation (53) whereas PUFA intake can counteract pro-inflammatory pathways (54).
This review has identified some discrepancies in the design and reporting of reduced rank regression methods that limit the interpretability of results. As the number of dietary patterns generated depended on the number of response variables, studies included in this review ranged from three to four response variables (16). This created challenges when the number of patterns reported differed, as the rationale for which dietary patterns to report also varied. Often, the dietary patterns that explained the most variation in the response variables were reported, regardless of how much was explained by the other dietary patterns. However, this cut off ranged from >10% to 20% (26, 28, 30, 31) of explained variation, with some studies not providing a numerical cut off (16, 27, 32, 33), The number of food groups also varied, ranging from 13 to 50. Evidence from principal component analysis, another data-driven dietary pattern method, has shown that changes in the number of food groups can influence the associations with health outcomes (16). Thus, more consistent definition of this reporting of minimum cut off points and the rationale for classifying food groups would improve the reporting of this dietary pattern method in the literature.
This review acknowledges some strengths and limitations. Firstly, as a scoping review, this study followed systematic searching methods based on PRIMSA-ScR guidelines. Secondly, it identified reporting discrepancies in the use of reduced rank regression that should be addressed. In line with scoping review methodology, no critical appraisal of the evidence has been conducted, and therefore the quality of studies has not been considered. However, most studies were large prospective studies that adjusted for demographic characteristics, dietary intake and lifestyle risk factors.
In conclusion, this scoping review has identified eight studies using reduced rank regression to derive dietary patterns based on dietary fat. Overall, findings suggest that high-fat dietary patterns, especially high-SFA containing foods, were positively associated with T2D incidence and glucose, insulin and HOMA levels. While dietary fat may be an important predictor of T2D risk, evidence from a dietary pattern perspective suggests that foods such as processed meats, low-fiber cereals and low intakes of fruit and vegetables are likely to contribute to an increased T2D risk. Therefore, consumption of healthy dietary fats for the prevention of T2D should be encouraged as part of a healthful overall dietary pattern.
The original contributions presented in the study are included in the article/Supplementary material, further inquiries can be directed to the corresponding author.
BB and LM performed the screening of articles. BB drafted the manuscript. KL reviewed first draft of the manuscript. All authors contributed to the design of the study, the interpretation and critical evaluation of the review, provided edits, and approved final submission of the manuscript.
BB and LM were supported by the Deakin University Postgraduate Research Scholarships. KL was supported by the National Health and Medical Research Council Emerging Leadership Fellowship (APP1173803).
The authors declare that the research was conducted in the absence of any commercial or financial relationships that could be construed as a potential conflict of interest.
All claims expressed in this article are solely those of the authors and do not necessarily represent those of their affiliated organizations, or those of the publisher, the editors and the reviewers. Any product that may be evaluated in this article, or claim that may be made by its manufacturer, is not guaranteed or endorsed by the publisher.
The Supplementary Material for this article can be found online at: https://www.frontiersin.org/articles/10.3389/fnut.2023.1071855/full#supplementary-material
3. Federation ID. Diabetes Atlas Website 2019. (2019). Available online at: https://www.diabetesatlas.org/upload/resources/material/20200302_133351_IDFATLAS9e-final-web.pdf (accessed April, 2022).
4. Kolb H, Martin S. Environmental/lifestyle factors in the pathogenesis and prevention of type 2 diabetes. BMC Med. (2017) 15:131. doi: 10.1186/s12916-017-0901-x
5. Reynolds A, Mann J, Cummings J, Winter N, Mete E, Te Morenga L. Carbohydrate quality and human health: a series of systematic reviews and meta-analyses. Lancet. (2019) 393:434–45. doi: 10.1016/S0140-6736(18)31809-9
6. Schlesinger S, Schwingshackl L, Neuenschwander M. Dietary fat and risk of type 2 diabetes. Curr Opin Lipidol. (2019) 30:37–43. doi: 10.1097/MOL.0000000000000567
7. Song J, Hu M, Li C, Yang B, Ding Q, Wang C, et al. Dose-dependent effects of fish oil on cardio-metabolic biomarkers in healthy middle-aged and elderly Chinese people: a double-blind randomized controlled trial. Food Funct. (2018) 9:3235–43. doi: 10.1039/C7FO01566F
8. Rice Bradley BH. Dietary Fat and Risk for Type 2 Diabetes: a Review of Recent Research. Curr Nutr Rep. (2018) 7:214–26. doi: 10.1007/s13668-018-0244-z
9. Schwab U, Lauritzen L, Tholstrup T, Haldorssoni T, Riserus U, Uusitupa M, et al. Effect of the amount and type of dietary fat on cardiometabolic risk factors and risk of developing type 2 diabetes, cardiovascular diseases, and cancer: a systematic review. Food Nutr Res. (2014) 58: 25145. doi: 10.3402/fnr.v58.25145
10. Koska J, Ozias MK, Deer J, Kurtz J, Salbe AD, Harman SM, et al. A human model of dietary saturated fatty acid induced insulin resistance. Metabolism. (2016) 65:1621–8. doi: 10.1016/j.metabol.2016.07.015
11. Pan A, Sun Q, Bernstein AM, Manson JE, Willett WC, Hu FB. Changes in red meat consumption and subsequent risk of type 2 diabetes mellitus: three cohorts of US men and women. JAMA Intern Med. (2013) 173:1328–35. doi: 10.1001/jamainternmed.2013.6633
12. Micha R, Michas G, Mozaffarian D. Unprocessed red and processed meats and risk of coronary artery disease and type 2 diabetes–an updated review of the evidence. Curr Atheroscler Rep. (2012) 14:515–24. doi: 10.1007/s11883-012-0282-8
13. Yu E, Hu FB. Dairy products, dairy fatty acids, and the prevention of cardiometabolic disease: a review of recent evidence. Curr Atheroscler Rep. (2018) 20:24. doi: 10.1007/s11883-018-0724-z
14. de Souza RJ, Mente A, Maroleanu A, Cozma AI, Ha V, Kishibe T, et al. Intake of saturated and trans unsaturated fatty acids and risk of all cause mortality, cardiovascular disease, and type 2 diabetes: systematic review and meta-analysis of observational studies. BMJ. (2015) 351:h3978-h. doi: 10.1136/bmj.h3978
15. Neuenschwander M, Ballon A, Weber KS, Norat T, Aune D, Schwingshackl L, et al. Role of diet in type 2 diabetes incidence: umbrella review of meta-analyses of prospective observational studies. BMJ. (2019) 366:l2368. doi: 10.1136/bmj.l2368
16. Hoffmann K, Schulze MB, Schienkiewitz A, Nöthlings U, Boeing H. Application of a new statistical method to derive dietary patterns in nutritional epidemiology. Am J Epidemiol. (2004) 159:935–44. doi: 10.1093/aje/kwh134
17. Schulze MB, Hoffmann K. Methodological approaches to study dietary patterns in relation to risk of coronary heart disease and stroke. Br J Nutr. (2006) 95:860–9. doi: 10.1079/BJN20061731
18. Esposito K, Giugliano D. Mediterranean diet and type 2 diabetes. Diabetes Metab Res Rev. (2014) 30:34–40. doi: 10.1002/dmrr.2516
19. Jannasch F, Kroger J, Schulze MB. Dietary patterns and type 2 diabetes: a systematic literature review and meta-analysis of prospective studies. J Nutr. (2017) 147:1174–82. doi: 10.3945/jn.116.242552
20. Brayner B, Keske MA, Kaur G, Islam SMS, Perez-Cornago A, Piernas C, et al. Longitudinal associations between fat-derived dietary patterns and early markers of cardiovascular disease risk in the UK biobank study. J Am Heart Assoc. (2022) 11:e024069. doi: 10.1161/JAHA.121.024069
21. Livingstone KM, Brayner B, Celis-Morales C, Ward J, Mathers JC, Bowe SJ. Dietary patterns, genetic risk, and incidence of obesity: Application of reduced rank regression in 11,735 adults from the UK Biobank study. Prev Med. (2022) 158:107035. doi: 10.1016/j.ypmed.2022.107035
22. Batis C, Mendez MA, Gordon-Larsen P, Sotres-Alvarez D, Adair L, Popkin B. Using both principal component analysis and reduced rank regression to study dietary patterns and diabetes in Chinese adults. Public Health Nutr. (2016) 19:195–203. doi: 10.1017/S1368980014003103
23. Liese AD, Weis KE, Schulz M, Tooze JA. Food intake patterns associated with incident type 2 diabetes: the insulin resistance atherosclerosis study. Diabetes Care. (2009) 32:263–8. doi: 10.2337/dc08-1325
24. McNaughton SA, Mishra GD, Brunner EJ. Dietary patterns, insulin resistance, and incidence of type 2 diabetes in the Whitehall II Study. Diabetes Care. (2008) 31:1343–8. doi: 10.2337/dc07-1946
25. Heidemann C, Hoffmann K, Spranger J, Klipstein-Grobusch K, Möhlig M, Pfeiffer AFH, et al. A dietary pattern protective against type 2 diabetes in the european prospective investigation into cancer and nutrition (epic)—potsdam study cohort. Diabetologia. (2005) 48:1126–34. doi: 10.1007/s00125-005-1743-1
26. Pastorino S, Richards M, Pierce M, Ambrosini GL, A. high-fat, high-glycaemic index, low-fibre dietary pattern is prospectively associated with type 2 diabetes in a British birth cohort. Br J Nutr. (2016) 115:1632–42. doi: 10.1017/S0007114516000672
27. Emi NA, Gan WY, Mohd Shariff Z, Anuar Zaini A, Shamsuddin NH, Appukutty M, et al. Associations of an empirical dietary pattern with cardiometabolic risk factors in Malaysian adolescents. Nutr Metab (Lond). (2020) 17:28. doi: 10.1186/s12986-020-00447-x
28. Brayner B, Kaur G, Keske MA, Perez-Cornago A, Piernas C, Livingstone KM. Dietary patterns characterized by fat type in association with obesity and type 2 diabetes: a longitudinal study of UK biobank participants. J Nutr. (2021) 151:3570–8. doi: 10.1093/jn/nxab275
29. Tricco AC, Lillie E, Zarin W, O'Brien KK, Colquhoun H, Levac D, et al. PRISMA extension for scoping reviews (PRISMA-ScR): checklist and explanation. Ann Intern Med. (2018) 169:467–73. doi: 10.7326/M18-0850
30. Appannah G, Pot GK, Huang RC, Oddy WH, Beilin LJ, Mori TA, et al. Identification of a dietary pattern associated with greater cardiometabolic risk in adolescence. Nutr Metab Cardiovasc Dis. (2015) 25:643–50. doi: 10.1016/j.numecd.2015.04.007
31. Gao M, Jebb SA, Aveyard P, Ambrosini GL, Perez-Cornago A, Papier K, et al. Associations between dietary patterns and incident type 2 diabetes: prospective cohort study of 120,343 UK biobank participants. Diabetes Care. (2022) 45:1315–25. doi: 10.2337/dc21-2258
32. Johns DJ, Lindroos AK, Jebb SA, Sjöström L, Carlsson LM, Ambrosini GL. Dietary patterns, cardiometabolic risk factors, and the incidence of cardiovascular disease in severe obesity. Obesity. (2015) 23:1063–70. doi: 10.1002/oby.20920
33. Shin D, Lee KW, Song WO. Dietary Patterns during Pregnancy Are associated with risk of gestational diabetes mellitus. Nutrients. (2015) 7:9369–82. doi: 10.3390/nu7115472
34. Schwingshackl L, Hoffmann G, Lampousi AM, Knüppel S, Iqbal K, Schwedhelm C, et al. Food groups and risk of type 2 diabetes mellitus: a systematic review and meta-analysis of prospective studies. Eur J Epidemiol. (2017) 32:363–75. doi: 10.1007/s10654-017-0246-y
35. Bechthold A, Boeing H, Schwedhelm C, Hoffmann G, Knüppel S, Iqbal K, et al. Food groups and risk of coronary heart disease, stroke and heart failure: a systematic review and dose-response meta-analysis of prospective studies. Crit Rev Food Sci Nutr. (2019) 59:1071–90. doi: 10.1080/10408398.2017.1392288
36. Drouin-Chartier JP, Brassard D, Tessier-Grenier M, Côté JA, Labonté M, Desroches S, et al. Systematic review of the association between dairy product consumption and risk of cardiovascular-related clinical outcomes. Adv Nutr. (2016) 7:1026–40. doi: 10.3945/an.115.011403
37. Gulseth HL, Gjelstad IMF, Tiereny AC, McCarthy D, Lovegrove JA, Defoort C, et al. Effects of dietary fat on insulin secretion in subjects with the metabolic syndrome. Eur J Endocrinol. (2019) 180:321–8. doi: 10.1530/EJE-19-0022
38. Imamura F, Micha R, Wu JH, de Oliveira Otto MC, Otite FO, Abioye AI, et al. Effects of saturated fat, polyunsaturated fat, monounsaturated fat, and carbohydrate on glucose-insulin homeostasis: a systematic review and meta-analysis of randomised controlled feeding trials. PLoS Med. (2016) 13:e1002087. doi: 10.1371/journal.pmed.1002087
39. Sokolowska E, Blachnio-Zabielska A. The role of ceramides in insulin resistance. Front Endocrinol. (2019) 10:577. doi: 10.3389/fendo.2019.00577
40. DiNicolantonio JJ, O'Keefe JH. Good Fats versus Bad Fats: A Comparison of Fatty Acids in the Promotion of Insulin Resistance, Inflammation, and Obesity. Mo Med. (2017) 114:303–7.
41. Wu H, Ballantyne CM. Metabolic inflammation and insulin resistance in obesity. Circ Res. (2020) 126:1549–64. doi: 10.1161/CIRCRESAHA.119.315896
42. Forouhi NG, Misra A, Mohan V, Taylor R, Yancy W. Dietary and nutritional approaches for prevention and management of type 2 diabetes. BMJ. (2018) 361:k2234. doi: 10.1136/bmj.k2234
43. Stephen AM, Champ MM, Cloran SJ, Fleith M, van Lieshout L, Mejborn H, et al. Dietary fibre in Europe: current state of knowledge on definitions, sources, recommendations, intakes and relationships to health. Nutr Res Rev. (2017) 30:149–90. doi: 10.1017/S095442241700004X
44. Keske MA, Przewlocka-Kosmala M, Woznicka AK, Mysiak A, Jankowska EA, Ponikowski P, et al. Role of skeletal muscle perfusion and insulin resistance in the effect of dietary sodium on heart function in overweight. ESC Heart Failure. (2021) 8:5304–15. doi: 10.1002/ehf2.13620
45. Widmer RJ, Flammer AJ, Lerman LO, Lerman A. The Mediterranean diet, its components, and cardiovascular disease. Am J Med. (2015) 128:229–38. doi: 10.1016/j.amjmed.2014.10.014
46. Chiavaroli L, Viguiliouk E, Nishi SK, Blanco Mejia S, Rahelić D, Kahleová H, et al. DASH dietary pattern and cardiometabolic outcomes: an umbrella review of systematic reviews and meta-analyses. Nutrients. (2019) 11:338. doi: 10.3390/nu11020338
47. Wu Y, Ding Y, Tanaka Y, Zhang W. Risk factors contributing to type 2 diabetes and recent advances in the treatment and prevention. Int J Med Sci. (2014) 11:1185–200. doi: 10.7150/ijms.10001
48. Rouhani MH, Haghighatdoost F, Surkan PJ, Azadbakht L. Associations between dietary energy density and obesity: a systematic review and meta-analysis of observational studies. Nutrition. (2016) 32:1037–47. doi: 10.1016/j.nut.2016.03.017
49. van den Berg SW. van der AD, Spijkerman AM, van Woudenbergh GJ, Tijhuis MJ, Amiano P, et al. The association between dietary energy density and type 2 diabetes in Europe: results from the EPIC-InterAct Study. PLoS One. (2013) 8:e59947. doi: 10.1371/journal.pone.0059947
50. Hingle MD, Wertheim BC, Neuhouser ML, Tinker LF, Howard BV, Johnson K, et al. Association between Dietary Energy Density and Incident Type 2 Diabetes in the Women's Health Initiative. J Acad Nutr Diet. (2017) 117:778–785.e1. doi: 10.1016/j.jand.2016.11.010
51. Maggio CA, Pi-Sunyer FX. Obesity and type 2 diabetes. Endocrinol Metab Clin North Am. (2003) 32:805–22i. doi: 10.1016/S0889-8529(03)00071-9
52. Hruby A, Manson JE, Qi L, Malik VS, Rimm EB, Sun Q, et al. Determinants and consequences of obesity. Am J Public Health. (2016) 106:1656–62. doi: 10.2105/AJPH.2016.303326
53. Esser N, Legrand-Poels S, Piette J, Scheen AJ, Paquot N. Inflammation as a link between obesity, metabolic syndrome and type 2 diabetes. Diabetes Res Clin Pract. (2014) 105:141–50. doi: 10.1016/j.diabres.2014.04.006
Keywords: dietary patterns, dietary fats, type 2 diabetes, reduced rank regression (RRR), review
Citation: Brayner B, Kaur G, Keske MA, Marchese LE and Livingstone KM (2023) Novel approach to investigate the association between type 2 diabetes risk and dietary fats in a dietary pattern context: a scoping review. Front. Nutr. 10:1071855. doi: 10.3389/fnut.2023.1071855
Received: 17 October 2022; Accepted: 09 May 2023;
Published: 01 June 2023.
Edited by:
Annamaria Anita Livia Colao, University of Naples Federico II, ItalyReviewed by:
Robert A. Ngala, Kwame Nkrumah University of Science and Technology, GhanaCopyright © 2023 Brayner, Kaur, Keske, Marchese and Livingstone. This is an open-access article distributed under the terms of the Creative Commons Attribution License (CC BY). The use, distribution or reproduction in other forums is permitted, provided the original author(s) and the copyright owner(s) are credited and that the original publication in this journal is cited, in accordance with accepted academic practice. No use, distribution or reproduction is permitted which does not comply with these terms.
*Correspondence: Barbara Brayner, YnZpdG9yaW5vYWxlbmNhQGRlYWtpbi5lZHUuYXU=
Disclaimer: All claims expressed in this article are solely those of the authors and do not necessarily represent those of their affiliated organizations, or those of the publisher, the editors and the reviewers. Any product that may be evaluated in this article or claim that may be made by its manufacturer is not guaranteed or endorsed by the publisher.
Research integrity at Frontiers
Learn more about the work of our research integrity team to safeguard the quality of each article we publish.