 Xia Shen
 Xue Gu
 Yuan-Yuan Liu1†
 Meng Zheng
- 1Wuxi Medical College, Jiangnan University, Wuxi, China
- 2Department of Pediatric Cardiothoracic Surgery, The First Affiliated Hospital of Xinjiang Medical University, Ürümqi, China
- 3The Fifth Medical Center of People’s Liberation Army (PLA) General Hospital, Beijing, China
- 4Department of Radiology, The Convalescent Hospital of East China, Wuxi, China
Background: There is only limited evidence for an association between calcium (Ca) and depression, and the relationship was inconsistent. Therefore, the aim of this study was to assess the relationship between dietary Ca and the risk of depressive symptoms in individuals over the age of 18 in the US.
Methods: We extracted 14,971 participants from the US National Health and Nutrition Examination Survey (NHANES) 2007–2016 to probe their associations. Dietary Ca intake was measured through 24 h dietary recall method. Patients with the Patient Health Questionnaire-9 (PHQ-9) ≥ 10 scores were believed to have depressive symptoms. The association between dietary Ca and depressive symptoms was investigated using multivariate logistic regression, sensitivity analysis, and restricted cubic spline regression.
Results: In this study, 7.6% (1,144/14,971) of them had depressive symptoms. After adjusting for sex, age, race, poverty to income ratio (PIR), marital status, education, body mass index (BMI), caffeine intake, carbohydrates intake, total energy intake, smoking status, alcohol consumption, physical activity, diabetes, hypertension, severe cardiovascular disease (CVD), cancer, serum vitamin D, serum Ca, and Ca supplement, the adjusted ORs value [95% confidence interval (CI)] of depression for the lowest category (Q1 ≤ 534 mg/day) vs. Q2–Q4 of Ca intake were 0.83 (0.69–0.99), 0.97 (0.65–0.95), and 0.80 (0.63–0.98) with the p for trend (p = 0.014). The relationship between dietary Ca intake and depressive symptoms was linear (non-linear p = 0.148). None of the interactions were significant except among races (p for interaction = 0.001).
Conclusion: Association between dietary Ca and the prevalence of depressive symptoms in US adults. And Ca intake was negatively associated with the risk of depressive symptoms. As Ca intake increased, the prevalence of depressive symptoms decreased.
1. Introduction
Depression remains one of the most prevalent and disabling biopsychosocial conditions in people (1–3). Nearly 300 million people of all ages worldwide suffer from this disease (4). In 2017, nearly 17.3 million adults in the United States were reported to have experienced at least one major depressive episode, with a prevalence of about 7.1% (5). The occurrence of depression can seriously reduce the quality of life and also bring many burdens, especially for the elderly (6). Based on this fact, it is necessary to identify strategies and methods that are effective in preventing depression.
Lifestyle factors are considered to be one of the important mediators of the pathophysiology associated with mental disorders (7). An increasing number of epidemiological studies have shown an association between diet and mental health (8). Several dietary factors such as coffee consumption, carbohydrates, and energy intake are thought to be associated with the risk of depression (9–11). Micronutrients are essential dietary elements that the body needs in varying amounts, including vitamins and trace minerals, to regulate physiological processes to maintain body function and health (12). Dietary minerals play an important role in the occurrence of cell regeneration processes, immune support, and antioxidants in the human body (13, 14). Appropriate requirements for essential dietary micronutrients can minimize the risk of overnutrition or deficiency (15). Moreover, dietary minerals may contribute to the development of disease pathology and course when their balance is impaired in the body (16, 17). Recently, more attention has been paid to the link between trace minerals such as zinc, copper, magnesium, and iron and mental disorders (8, 18–21).
Calcium (Ca) is one of the most essential elements, it’s not made by the body, and it has to be supplied exogenously, mainly through food (22) getting it can from foods such as beans, milk and dairy products, fish and seafood, vegetables, and algae. At the same time, vitamin D supplementation also helps the body absorb Ca better. In addition to getting Ca from food and supplements, exposure to sunlight is also a good way to get it. The ultraviolet light in the sun facilitates the synthesis of vitamin D, which promotes the absorption of Ca in the small intestine, thus achieving the effect of indirect Ca supplementation. Ca is one of the most essential elements and is also an activator of many enzymes in the body, promoting the normal functioning of the body’s organs (23). One study indicated that Ca leakage from ryanodine receptors (RyRs) was associated with neuronal firing and cognitive performance in aged macaques (24). Ca intakes are reported to be below the recommended levels in many countries in the world (25–27). Many countries in Asia have average dietary Ca intakes below 500 mg/day, most countries in Africa and South America have Ca intakes between 400 and 700 mg/day, and only the Nordic countries have national Ca intakes above 1,000 mg/day (28). Ca deficiency is thought to be associated with the development of many diseases, including osteoporosis, high blood pressure, diabetes, and heart disease (29–32).
Clinical studies have shown that Ca is associated with a mental disorders (33, 34). Rare studies have directly examined the relationship between Ca intake and depression separately (35, 36). Therefore, the purpose of this study was to examine the relationship between dietary Ca intake and depressive symptoms in a population of non-hospitalized American adults. We hypothesized that higher dietary Ca intake would be inversely related to depressive symptoms.
2. Materials and methods
2.1. Data sources and study population
We used data from the National Health and Nutrition Examination Survey (NHANES) 2007–2016 database, and people older than 18 years who participated and completed the survey mobile examination center (MEC) were enrolled in our study (37). It uses a multi-stage stratified approach to assess the health and nutritional status of non-institutionalized Americans (38). Individuals lacking data on depression screening and Ca intake were excluded. It also excluded missing data: demographic and lifestyle behavior variables [sex, age, race, poverty to income ratio (PIR), marital status, education, body mass index (BMI), caffeine intake, carbohydrates, total energy intake, smoking, alcohol consumption, physical activity], chronic diseases [diabetes, hypertension, severe cardiovascular disease (CVD), cancer], and laboratory data (serum vitamin D, serum Ca), as shown in Figure 1. We also excluded those with extremely high Ca values to assess the impact of these potentially mismeasured outliers on our results (99th percentile, dietary Ca intake > 3,000 mg/day, n = 155).
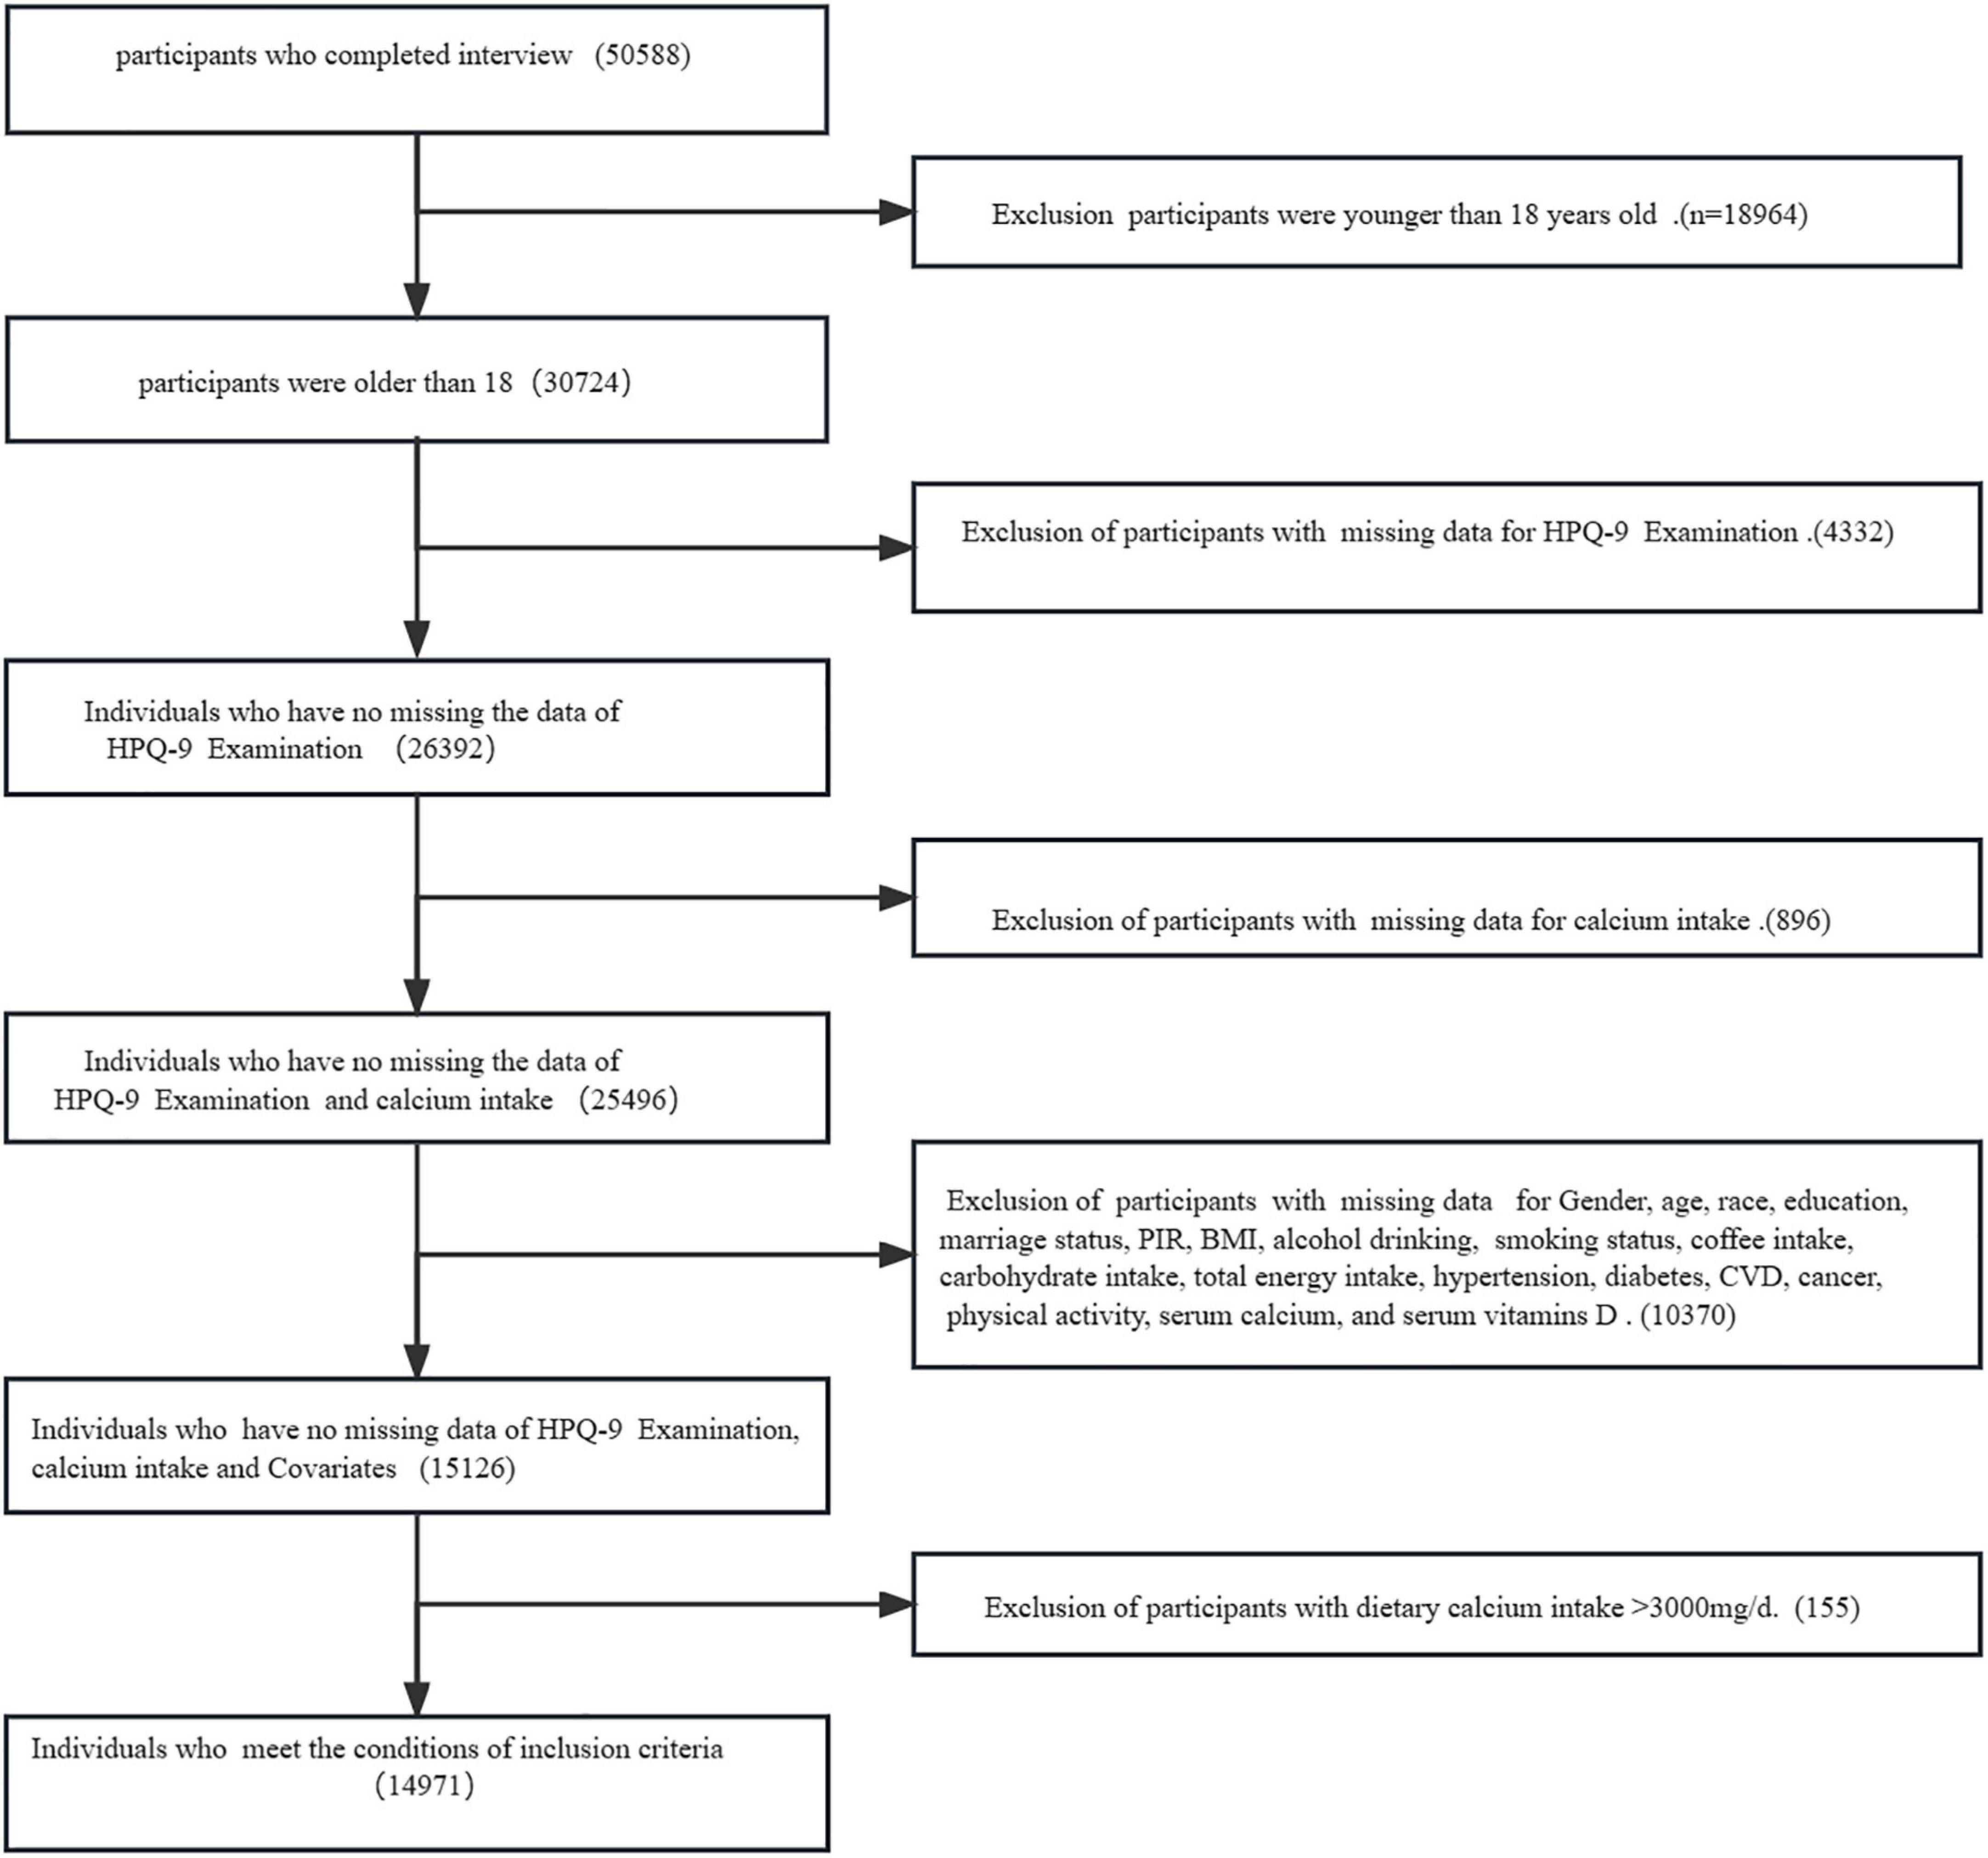
Figure 1. The flow chart of inclusion and exclusion of the participants in the study.
The study was approved by the National Center for Health Statistics (NCHS) and the Research Ethics Review Board (39), and the ethics approval number is Protocol #2005-06 and Protocol #2011-17. Our study is based on publicly available data from NHANES, and the data are analyzed and extracted from 12–30 July, 2022. All details can be found on the official website: https://wwwn.cdc.gov/nchs/nhanes/search/default.aspx.
2.2. Depressive symptoms assessment
Depression symptoms is screened through the Patient Health Questionnaire-9 (PHQ-9) program (40), and the individual interviews were conducted at the mobile screening center using computer assistance. Approximately 5% of the interview information was recorded and reviewed for appropriate quality control. The PHQ consisted of nine depressive mood-related questions according to the Diagnostic and Statistical Manual, Fourth Edition, diagnostic criteria for major depressive disorder (41). It consists of nine questions (42), each of which has a maximum score of 3, with a total maximum score of 27. A total score greater than 10 is considered to be suffering from depressive symptoms, or it is a non-depressed category.
2.3. Dietary assessment
Dietary consumption data were collected from the 24 h before the interview (midnight to midnight). The type and amount of food and beverages consumed (43), as well as the number of nutrients and other food components, were validly assessed, including total energy, carbohydrates, coffee, and Ca. Data from the dietary interview component were collected by the NCHS at the U.S. Department of Agriculture (DHHS), which is responsible for survey sample design and data collection. The USDA’s Food Surveys Research Group (FSRG) was responsible for the dietary data collection methodology, maintenance of the database used to code and process the data, and data review and processing (44). Purpose of conducting dietary interviews was to obtain detailed dietary intake information from NHANES participants. And we chose the first day 24-recall diet interview data in our study.
2.4. Covariates assessment
Based on the literature (35, 45–50) and clinical practical implications we used the following covariates, including age, sex, race and ethnicity, education level, PIR, BMI, marital status, diabetes, hypertension, severe CVD, cancer/malignancy, total energy intake, carbohydrate intake, caffeine intake, serum Ca, Ca supplements, smoking status, alcohol consumption status, and physical activity. We divided the participants into five racial and ethnic groups. Mexican American, non-Hispanic Black, non-Hispanic White, other Hispanic, and other (including multiracial). Educational level was categorized into three levels {below high school, high school, and high school or grad/[General education development diploma (GED)]/equivalent} (51). We classified household income into the following four levels based on the proportion of household income in poverty: poor (PIR < 1), near poor (1 ≤ PIR < 2), moderate income (2 ≤ PIR < 4), and high income (PIR ≥ 4) (52). BMI weight divided by height squared, followed by classification according to criteria: low weight (<18.5), normal weight (18.5 ≤ BMI < 25), overweight (25 ≤ BMI < 30), and obesity (≥30) (53, 54). Marital status was still classified according to the NHANES: married, widowed, divorced, single, never married, living with a partner. Diabetes mellitus was defined as having been diagnosed by a physician (55). Hypertension and cancer were also based on self-reported hypertension or cancer (5, 56). Severe CVD was based on having a doctor’s diagnosis of coronary heart disease or heart attack or stroke (57).
Dietary data were obtained according to the 24-h dietary questionnaire in NHANES. Smoking status was categorized into the following three groups: never smoked (smoked less than 100 cigarettes in life), former (smoked at least 100 cigarettes in life and smoke, not at all), and current smoker (smoked more than 100 cigarettes in life and smoke some days or every day) (56). Drinking status was defined based on whether or not it was greater than 12 drinks in a year, and those who answered “yes” were drinking, otherwise, they were not. Physical activity is measured based on [Metabolic equivalent task (MET)] scores (58). Weekly as well as monthly exercise is converted to daily activity. For example, the met scores for vigorous-intensity work and vigorous recreational activities are calculated by multiplying by 8. Moreover, you multiply cycling or walking, moderate-intensity activity, and moderate recreational activity by four to get its MET scores.
2.5. Statistical analyses
The study was designed strictly according to the STROBE guidelines (59). All analyses were performed using the statistical software R (The R Foundation) and Free Statistics (Free Statistics 1.6) (60, 61). Demographic and clinical data were described by mean ± standard deviations, and frequency (percentages). Depending on whether the distribution was normal (approximately normal) or skewed, the distribution was processed using the one-way ANOVA and Kruskal–Wallis test for the relative response data. We stratified the analyses of dietary Ca intake in the following categories according to four quartiles: 534≤, 535–817, 818–1,190, and ≥1,191 mg/day.
Single sample T-test was used to compare the corresponding age group average values of magnesium intake and population recommended dietary allowances (RDAs). Univariate and multivariate logistic regression were used to investigate the relationship between Ca intake and the risk of depressive symptoms. Model 1 was unadjusted; model 2 adjusted for age and gender; model 3 adjusted for variable 2 in model 1, and chronic diseases, and all variables were adjusted in model 4, including age, gender, chronic diseases, education, marital status, smoking status, PIR, BMI, total daily energy, coffee intake, carbohydrate intake, serum Ca, race/ethnicity, alcohol use, physical activity, and Ca supplementation.
Statistically significant differences (p < 0.05), data with >20% effect on outcome depressive symptoms, variables that were not statistically significant but clinically significant for the occurrence of depressive symptoms. For the variable of Ca supplement, we used a dummy variable due to excessive missingness (>50%). Both variables were entered into the model simultaneously (Y = ax1 + b*dummy variable) (62).
To further explore the relationship between Ca intake and depressive symptoms, Ca intake (mg/day) was included in the model as a continuous variable. We used a restricted cubic spline curve for the analysis (63). Adjusting for all covariates, we chose the median dietary Ca as the reference value, which is not influenced by extreme values in the distribution series and is representative of the distribution series. Nodes were placed at the 5th, 35th, 65th, and 95th percentile. A two-sided p < 0.05 was considered statistically significant. Interactions between subgroups were examined by likelihood ratio tests.
3. Results
3.1. Baseline characteristics of the study populations
There were 14,971 people in this study, including 7,817 men and 7,154 women. We divided the population into four groups based on Ca intake. The lower Ca intake usually occurred in people who were older, female, non-smokers, non-alcohol drinkers, and had no diabetes. Those with higher Ca intakes were more likely to be married, male, better educated, and without serious CVD, as shown in Table 1.
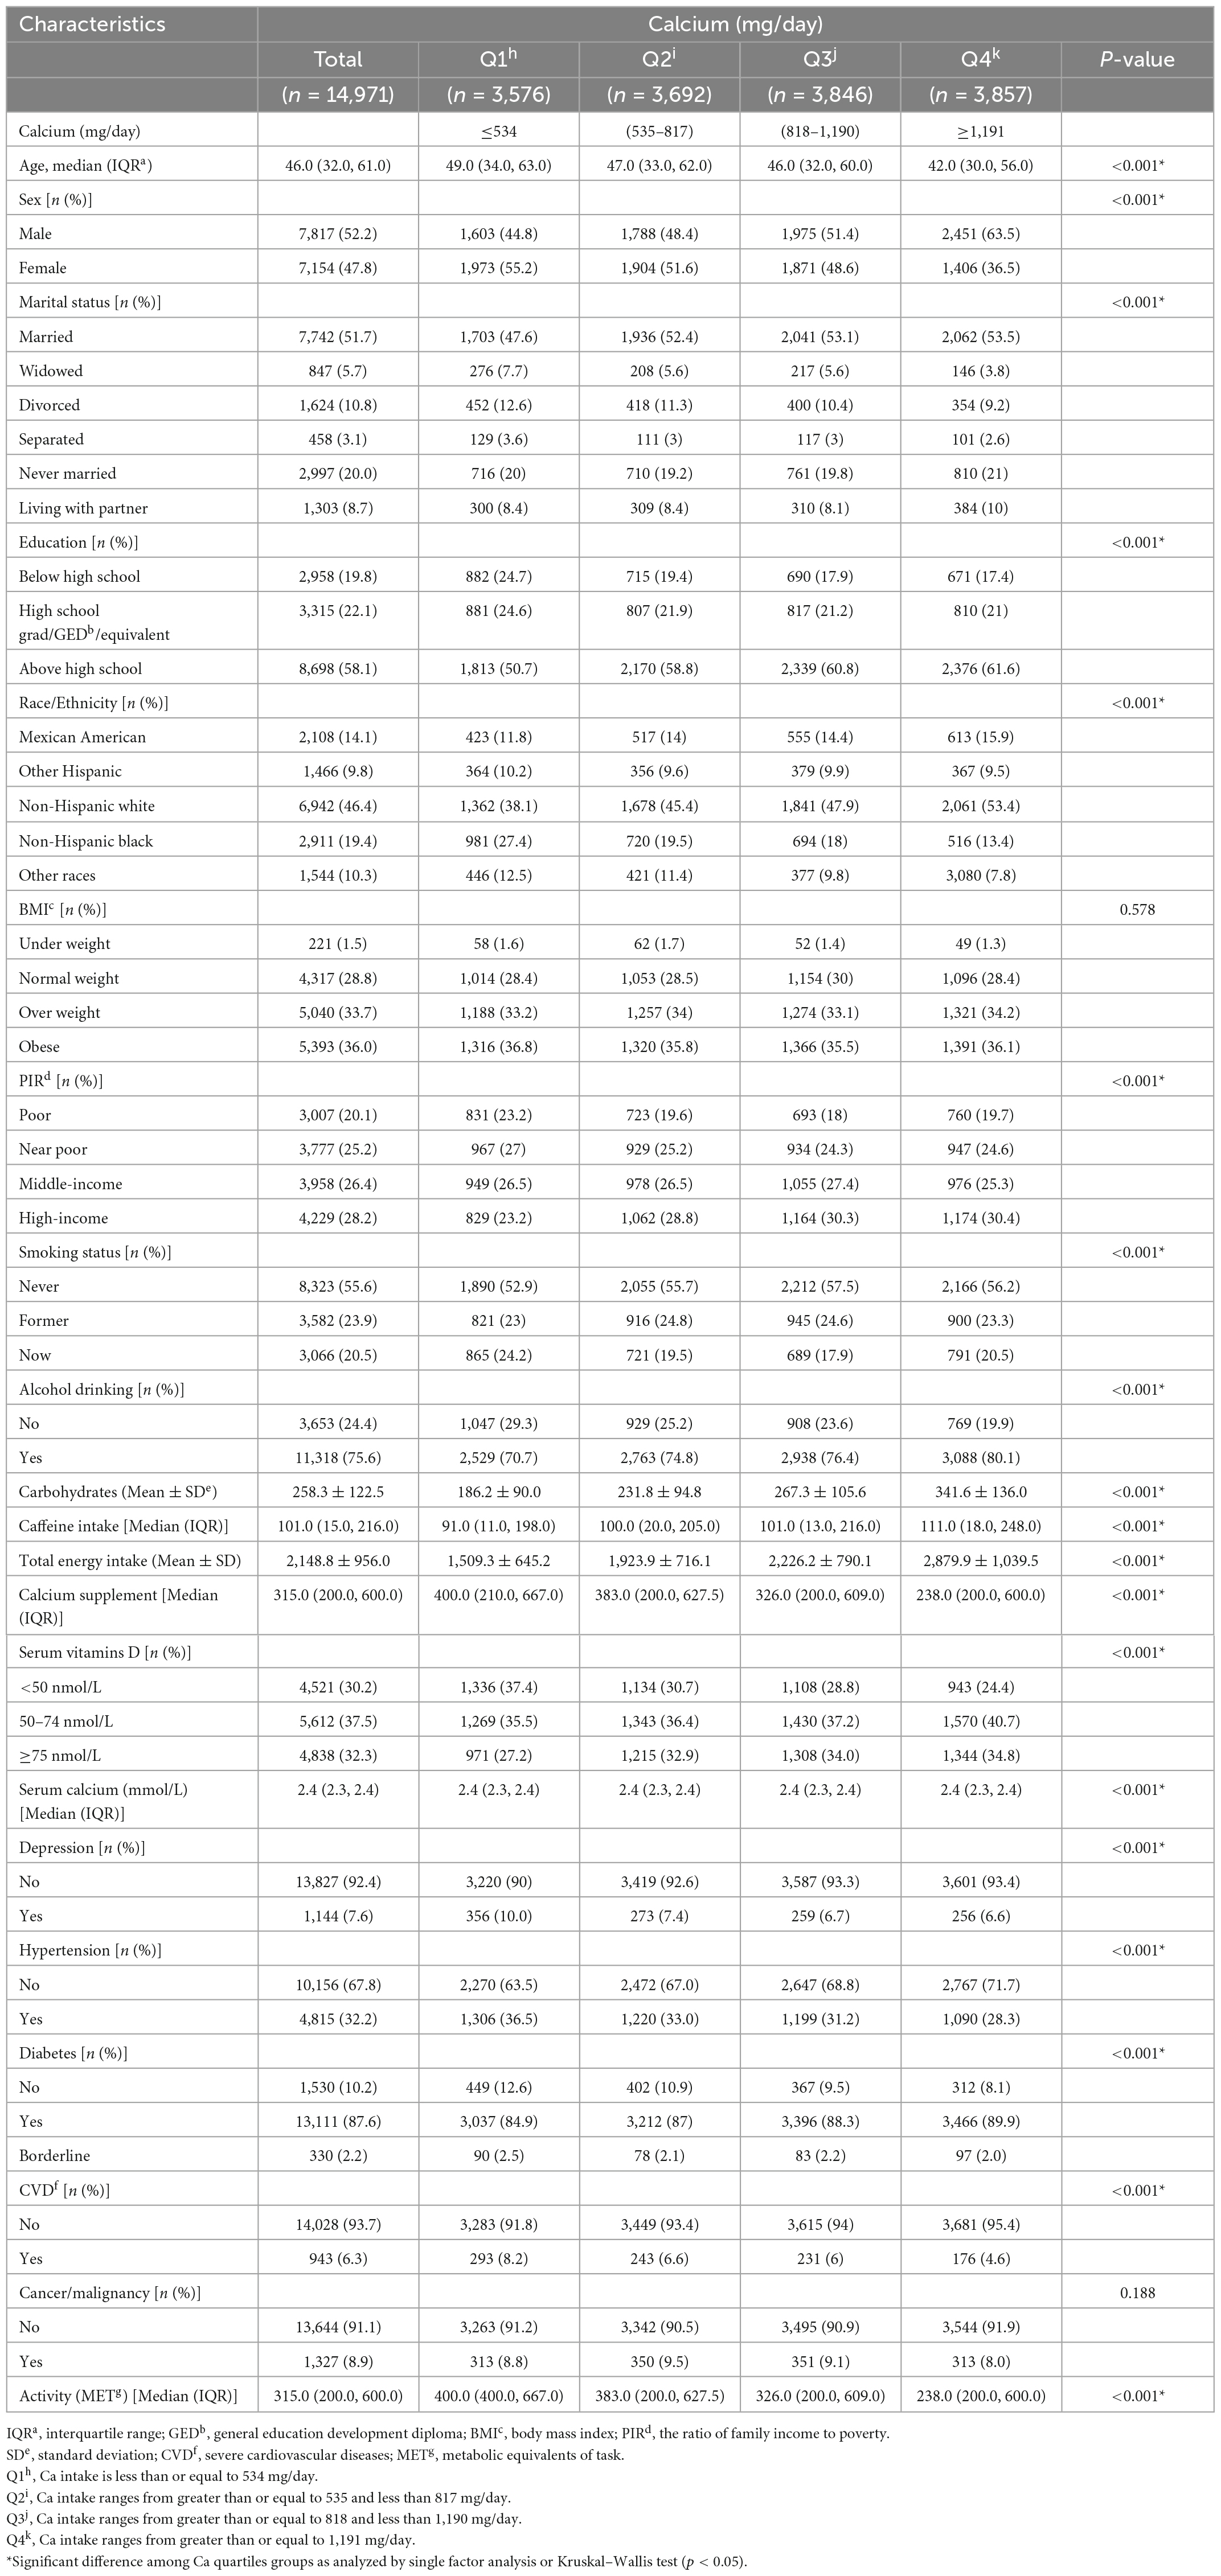
Table 1. Baseline characteristic of participants according to calcium (Ca) quartiles groups.
Table 2 showed the optimal Ca intake, according to the National Institutes of Health consensus conference. We compared the RDAs with the actual average Ca intake and found that the daily Ca intake of female, including pregnant and male aged of 18–24 and over 65, was lower than the recommended value, where the reference values for 18–24-year-olds and pregnant women were calculated by averaging the recommended dose range.
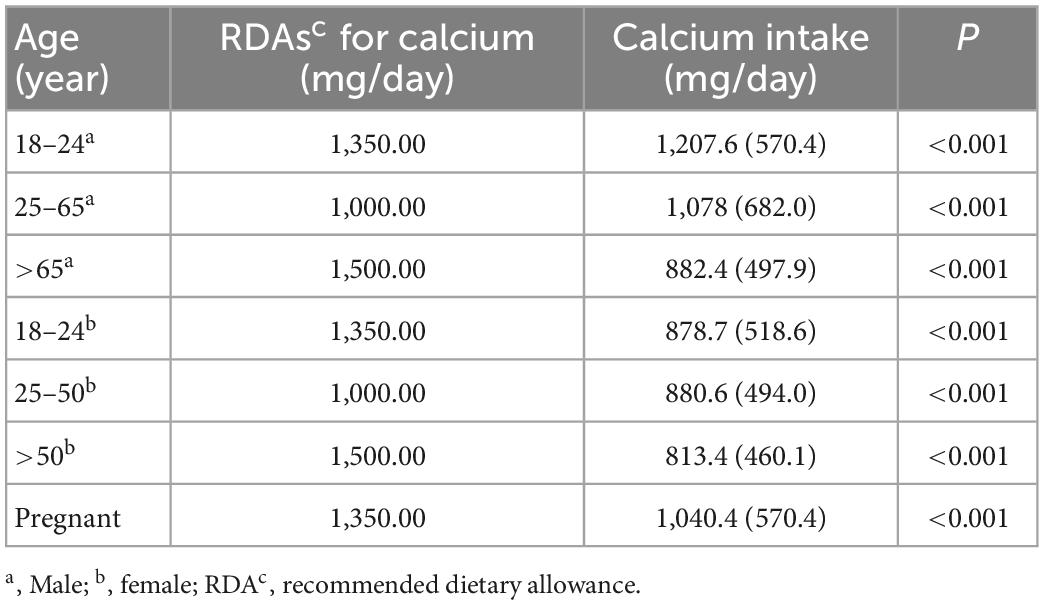
Table 2. Dietary calcium (Ca) among US adults (≥18 years) in National Health and Nutrition Examination Survey (NHANES) 2007–2016.
The model-based ORs and 95% confidence intervals (CIs) are presented in Table 3. When not adjusted for covariates, each one-unit increase in Ca intake (1,000 mg/day) was associated with a 28% reduction in the risk of depressive infection (OR: 0.72; 95% CI: 0.63–0.81). We observed the same trend after adjusting for minimal model 2 sex, age, and model 3 chronic disease. when adjusting for all covariates in model 4, each one-unit increase in Ca intake was associated with an 18% reduction in the risk of depressive symptoms (OR: 0.82; 95% CI: 0.70–0.95).
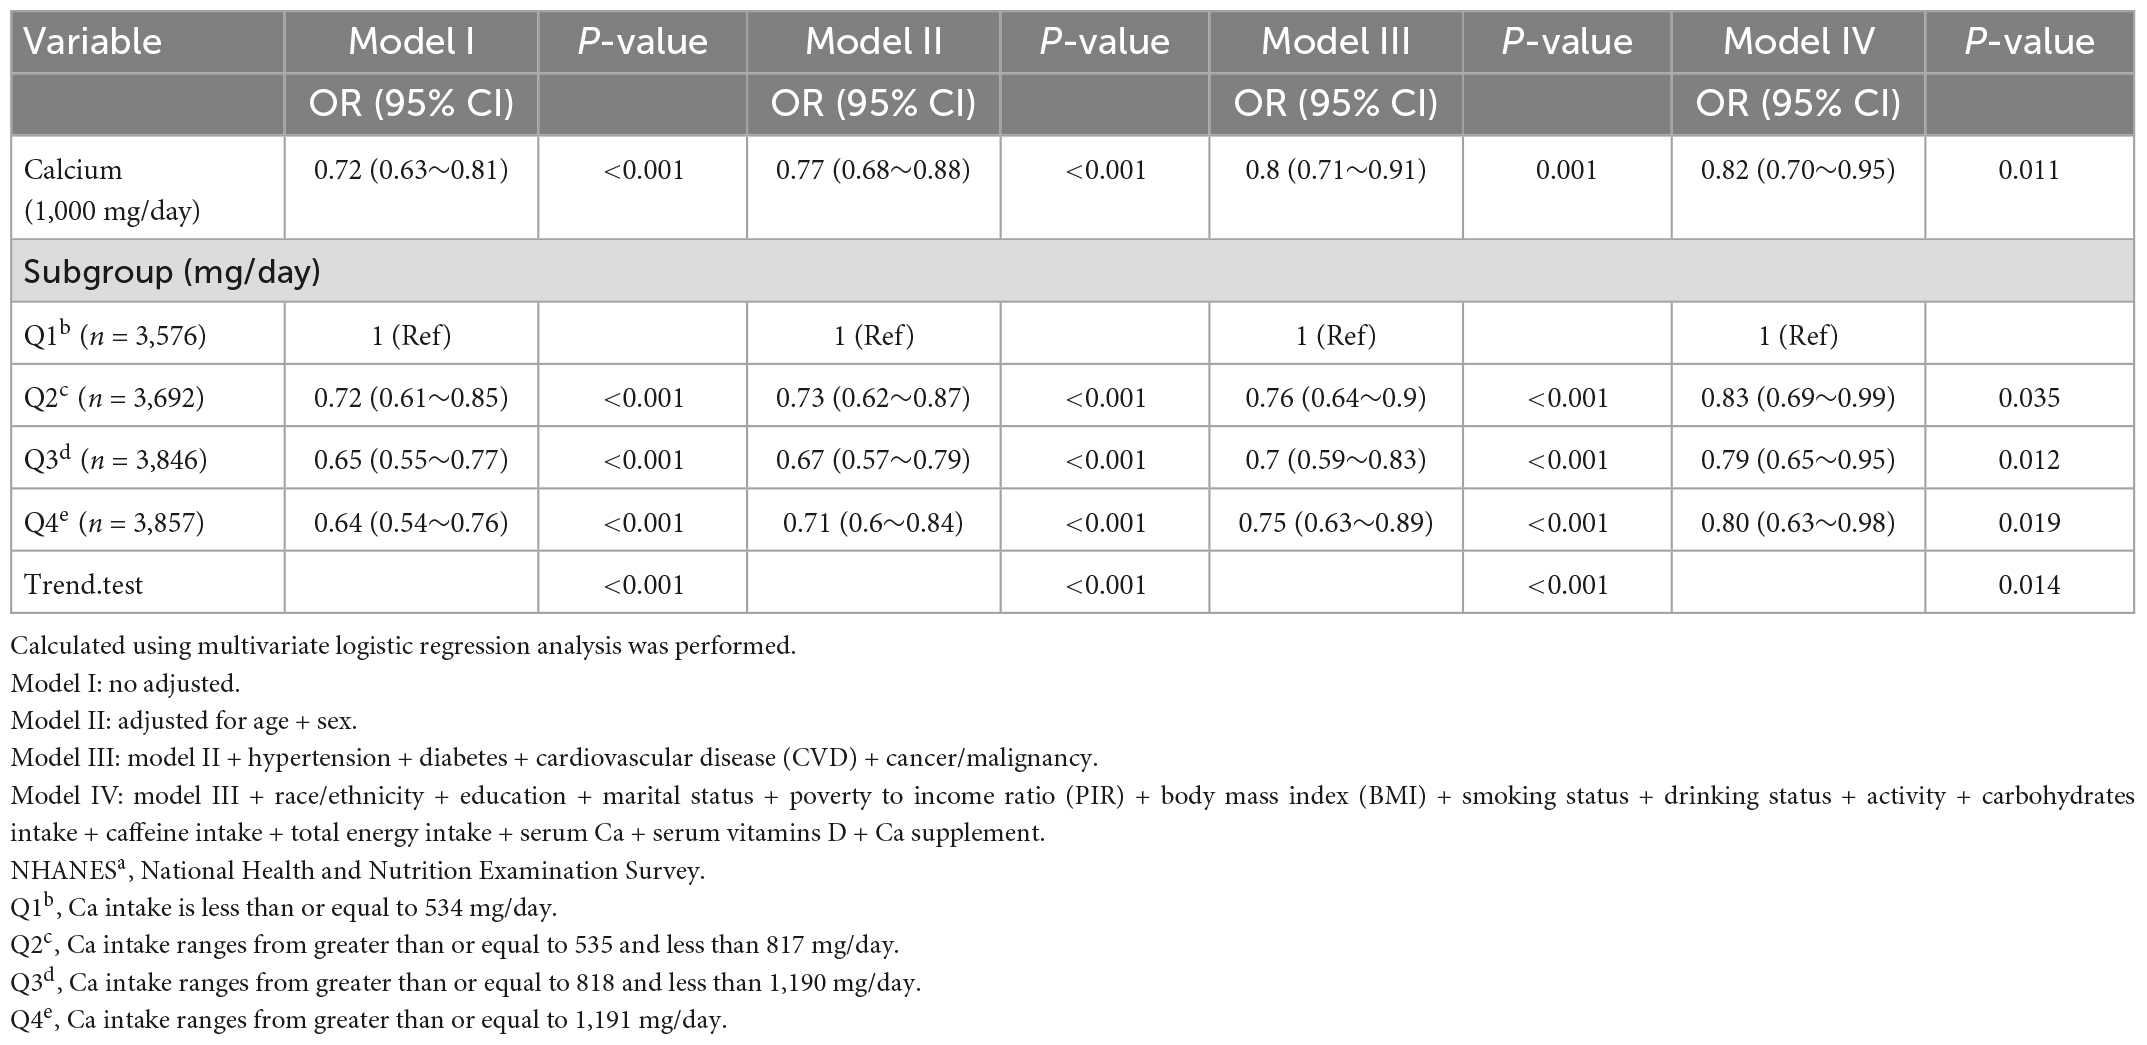
Table 3. Association of calcium (Ca) and depression among participants in the NHANESa 2007–2016 (N = 14,971).
Table 3 showed the effect values were less than 1 between Ca quartiles and depression in model 1 (Q2; OR, 0.72; 95% CI, 0.61–0.85; Q3; OR, 0.65; 95% CI, 0.55–0.77, and Q4; OR, 0.64; 95% CI, 0.54–0.76) compared with Q1 (<534 mg/day). After adjusting all variables, the same trend was observed in adjusted model 2, model 3, and model 4. The results were similar in all participants who did not exclude very high dietary Ca (Supplementary Table 1) and in the weighted analysis (Supplementary Table 2). In restricted cubic curve spline analysis, we observed a linear relationship between the continuous variable Ca intake and depressive symptoms (non-linear p = 0.148) in Figure 2.
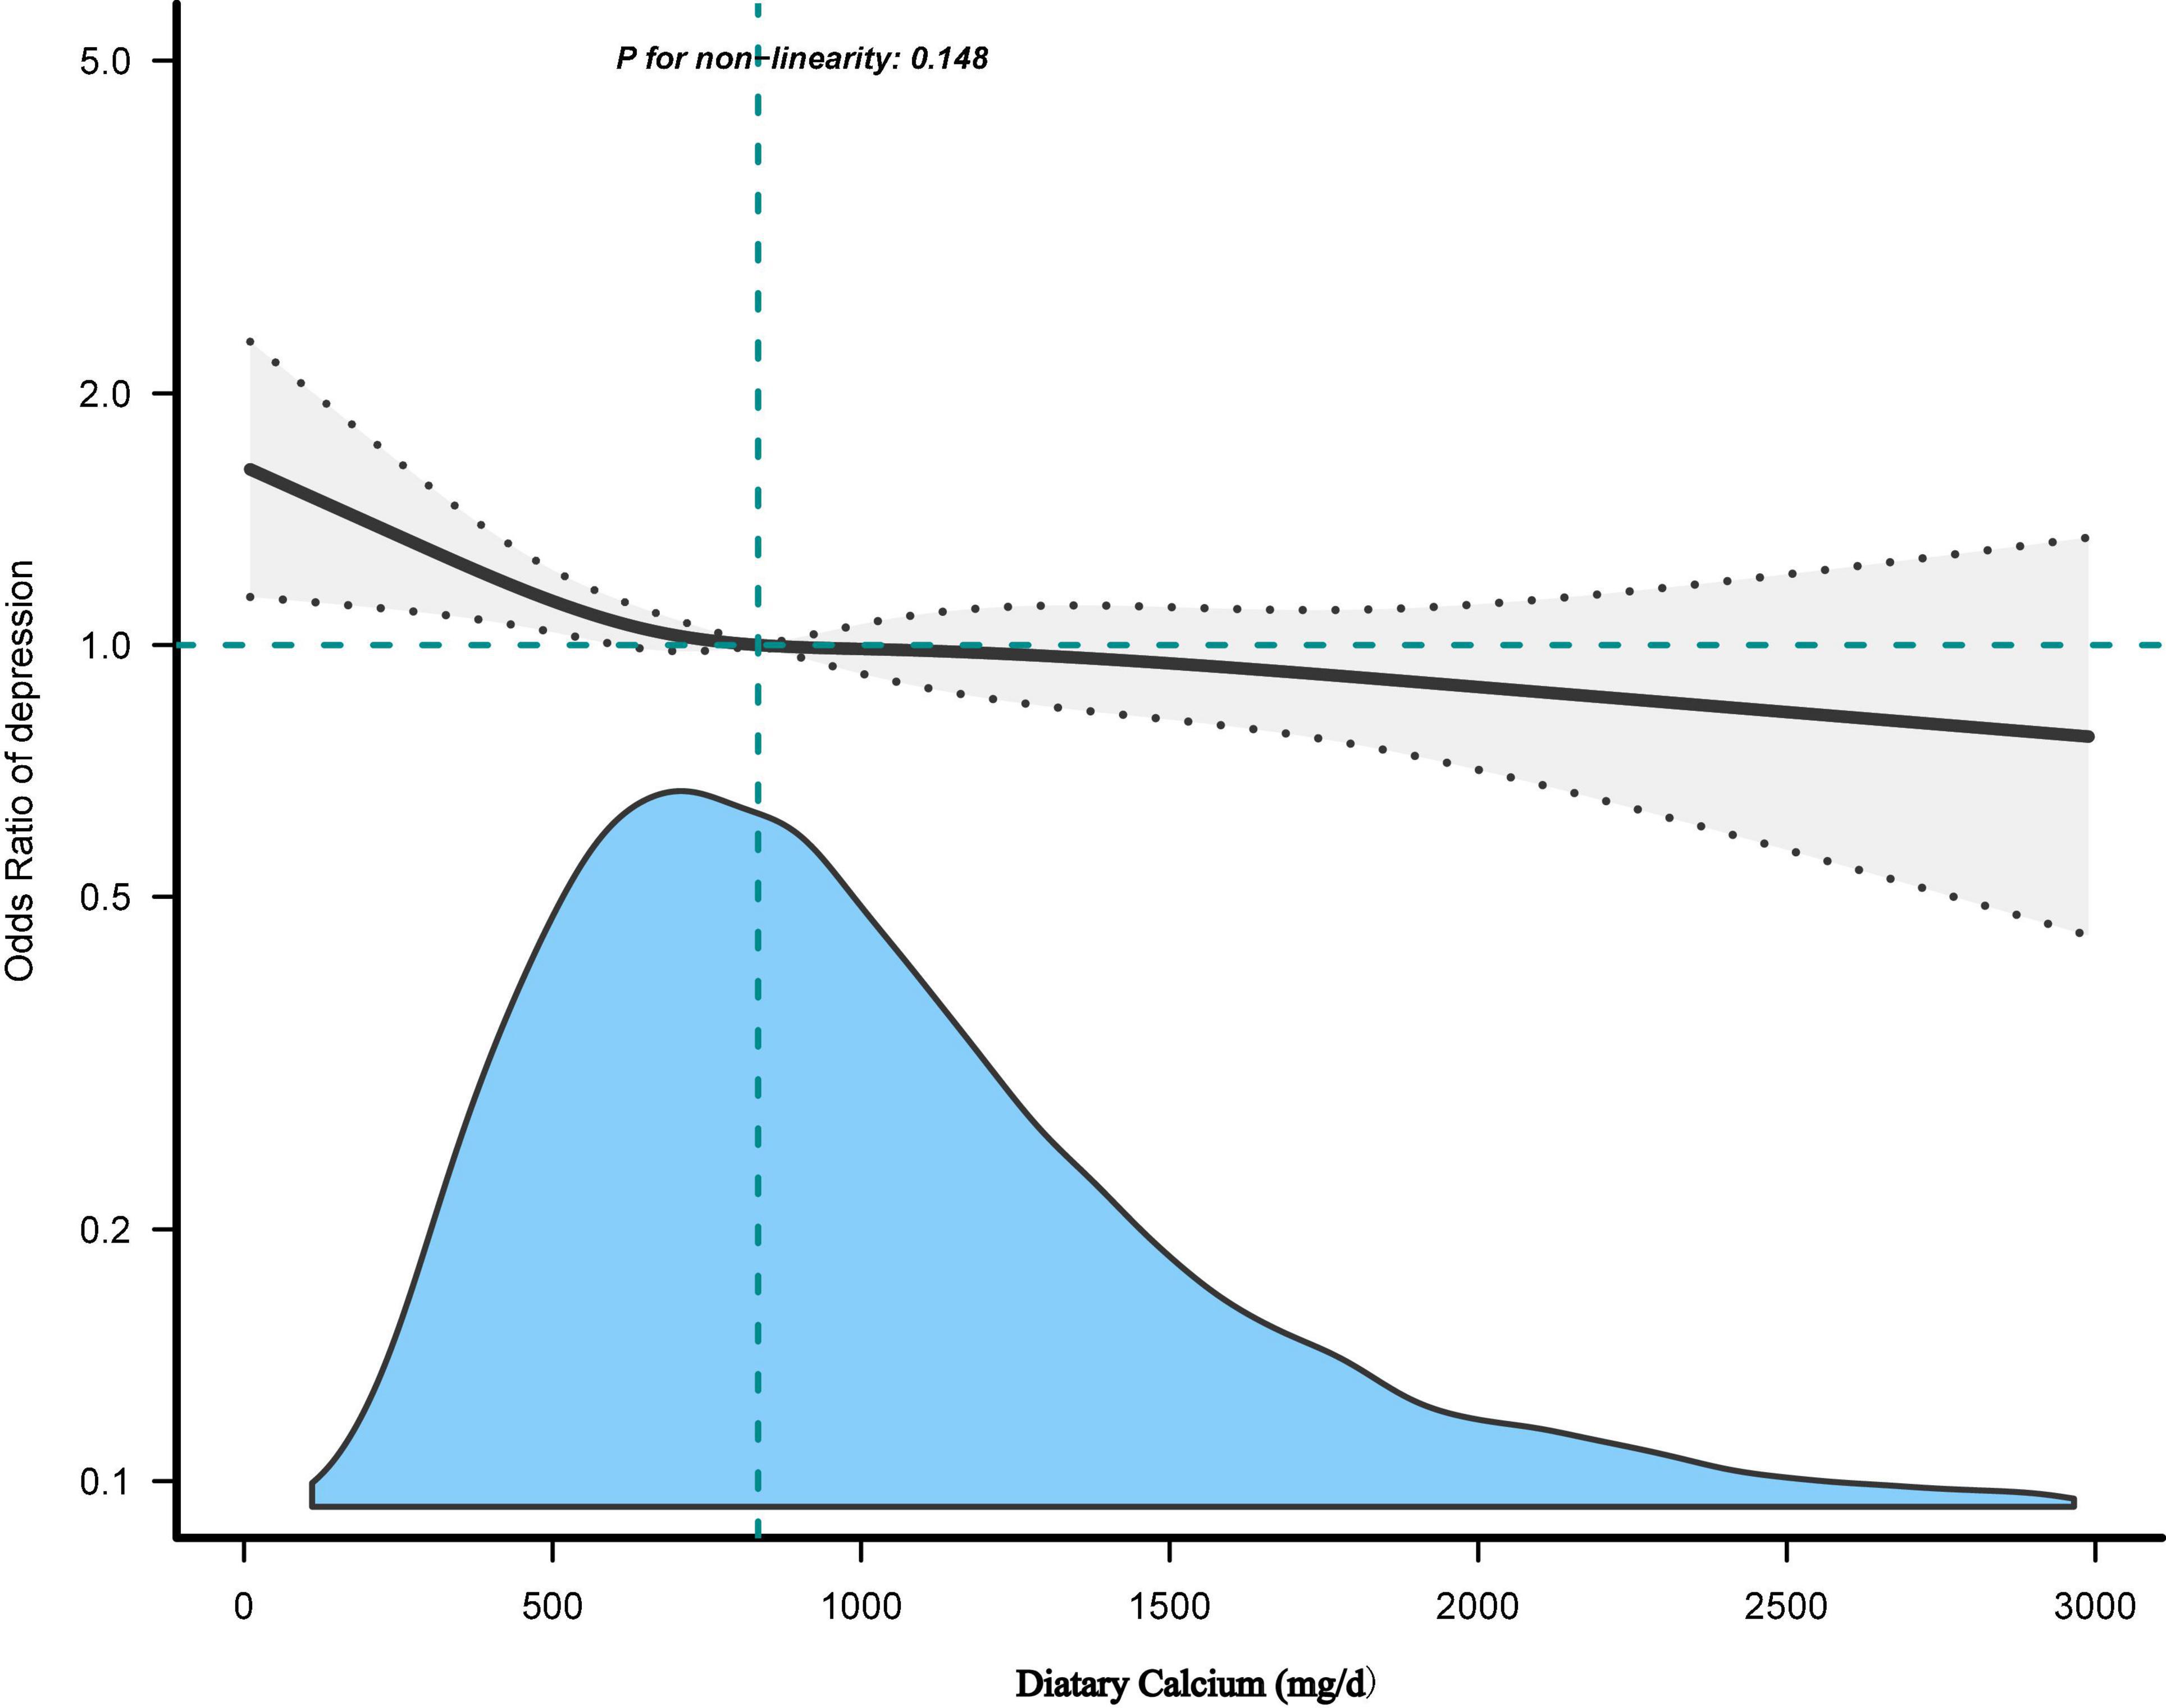
Figure 2. The dose-response relationship between dietary calcium (Ca) intake and the risk of depressive symptoms. Adjusted for: Age + sex + hypertension + diabetes + CVD + cancer/malignancy + race/ethnicity + education + marital status + poverty to income ratio (PIR) + body mass index (BMI) + smoking status + drinking status + activity + carbohydrates intake + caffeine intake + total energy intake + serum Ca + serum vitamins D + Ca supplement.
3.2. Sensitivity analysis
In these subgroups, we adjusted the full model and found an interaction between Ca and depressive symptoms in races (p = 0.001), with Ca intake likely to reduce depressive symptoms in Mexican Americans, while Ca intake may increase depressive symptoms in other races (OR: 1.9; 95% CI, 1.10–3.29) in Table 4. No interactions, however, were found in other subgroups (p > 0.05) in Figure 3.
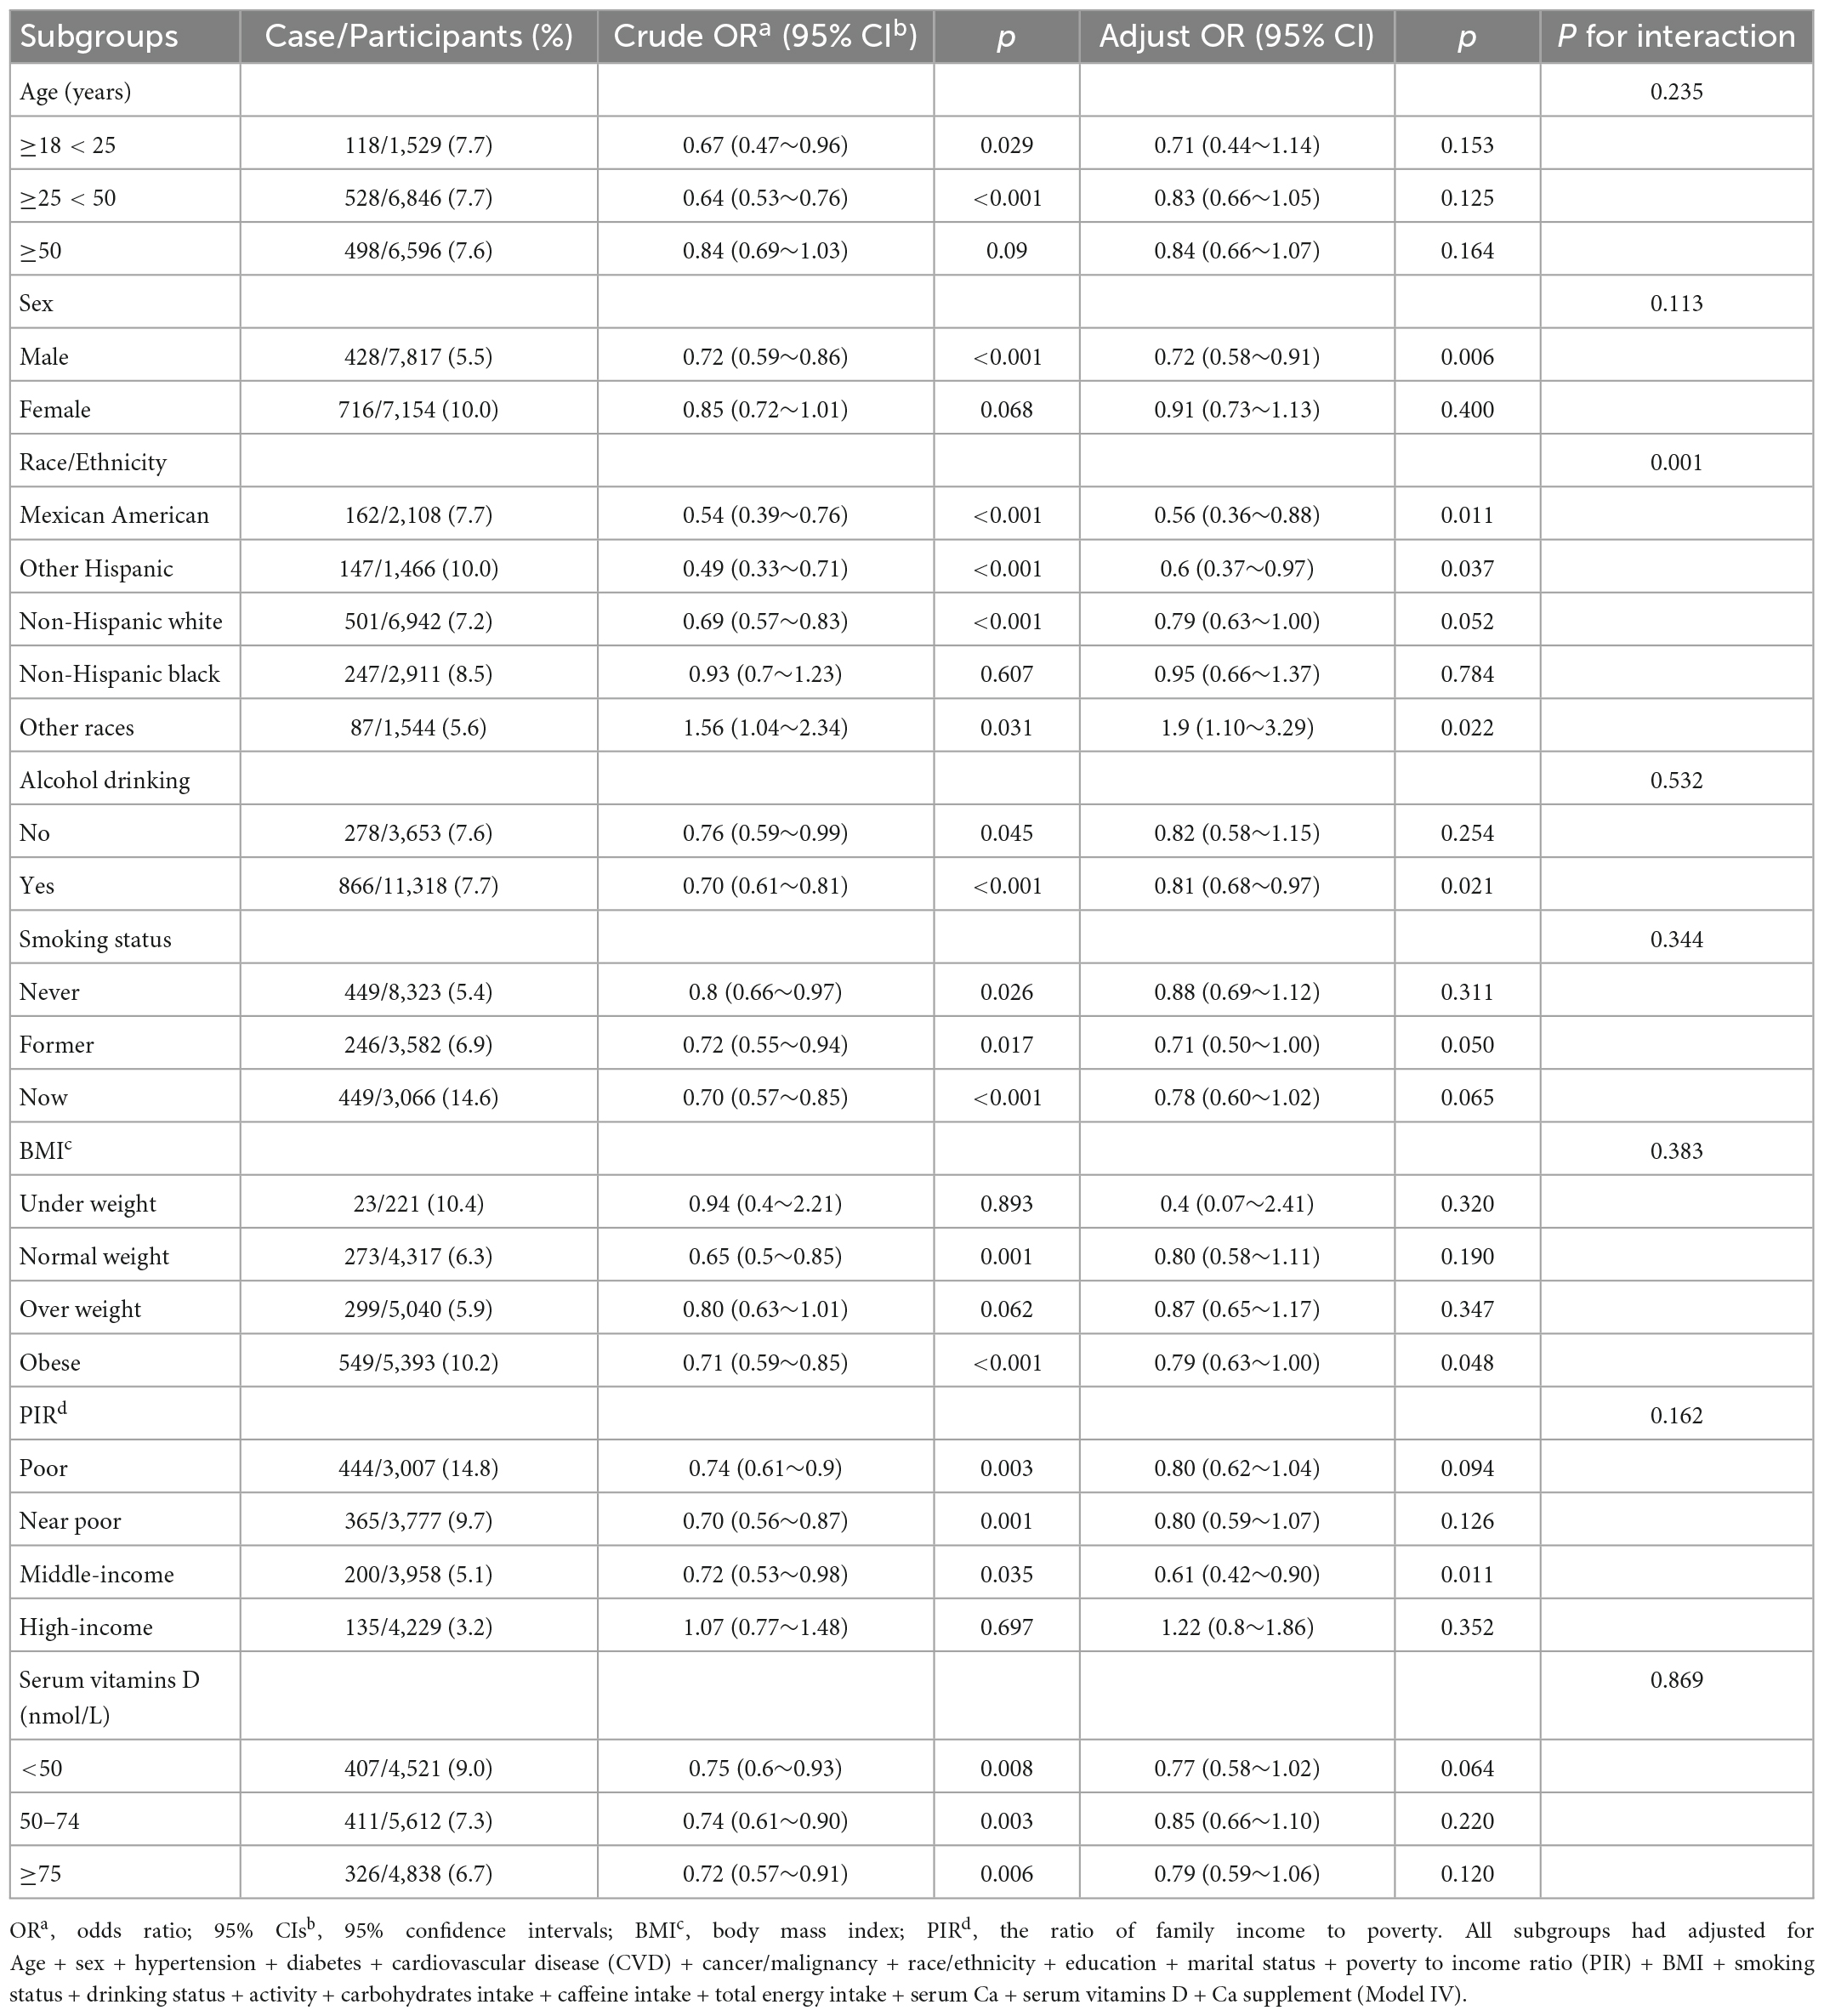
Table 4. Association between depression and calcium (Ca) intake in subgroups.
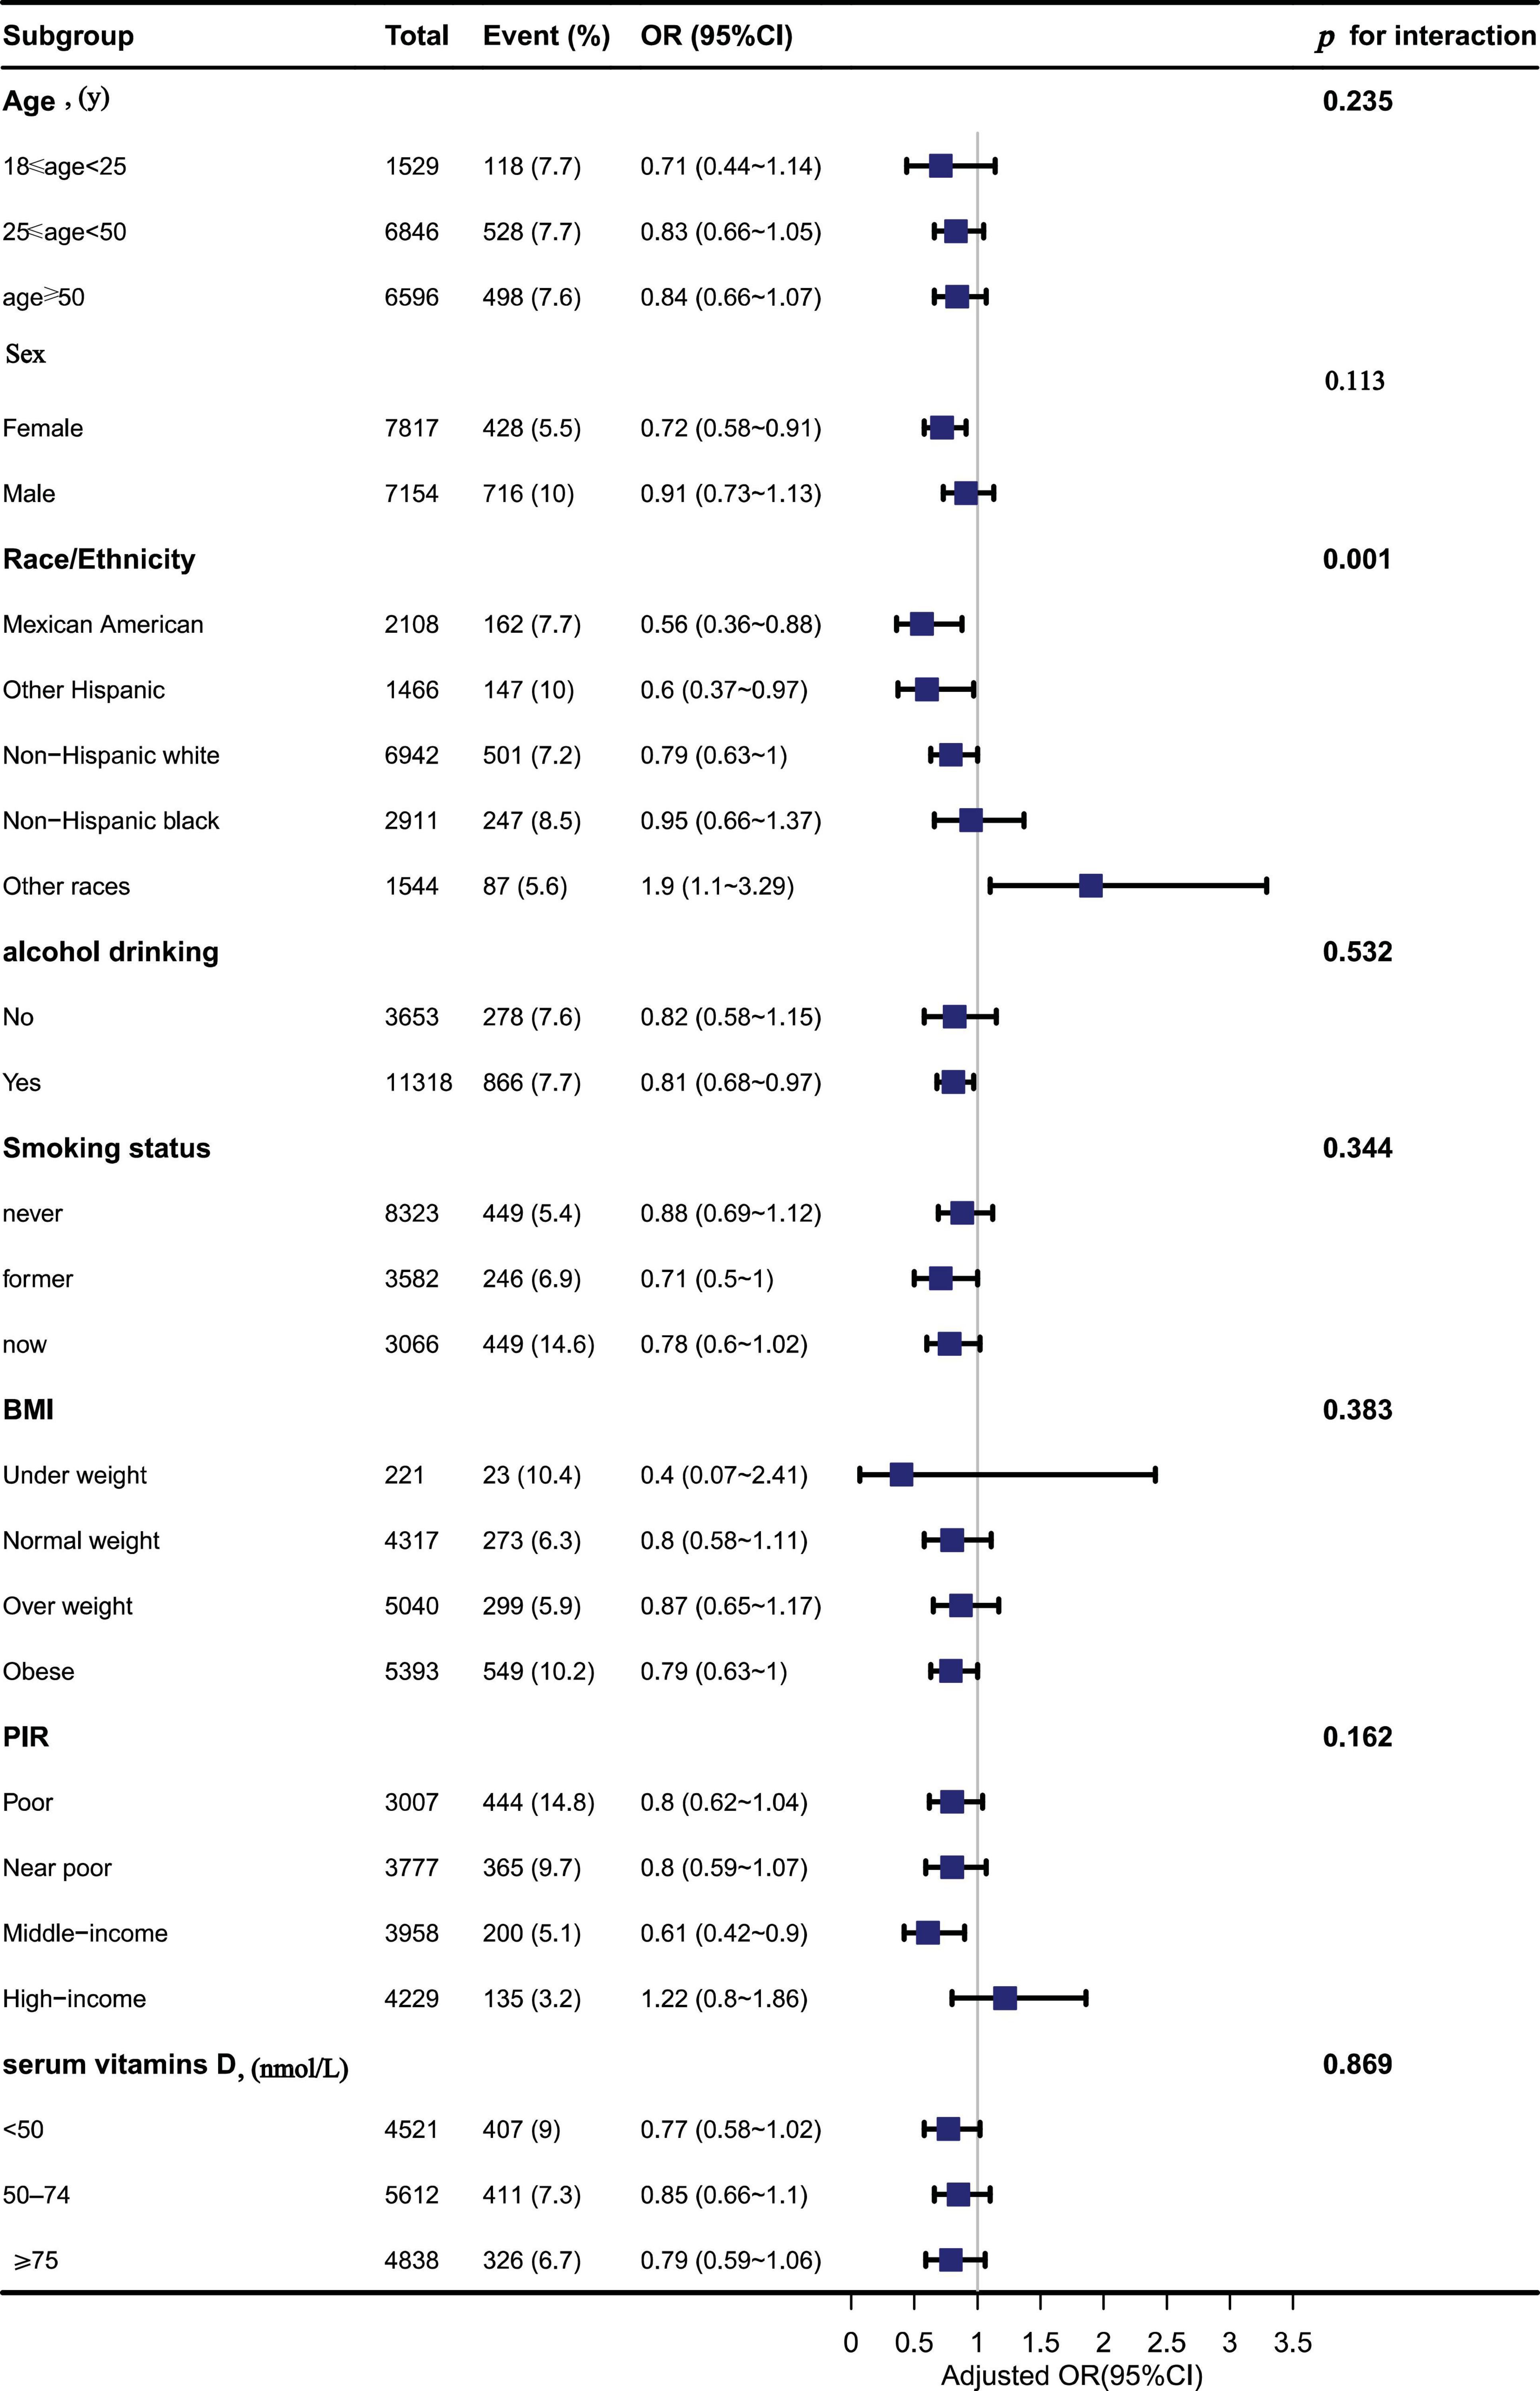
Figure 3. The association between dietary calcium (Ca) intake and depressive symptoms in different subgroups.
4. Discussion
The results suggest an inverse association between dietary Ca intake and the risk of depressive symptoms in the US population >18 years of age. This association was maintained even after adjusting for a large number of potential confounders such as gender, age, race, education, smoking, physical activity, alcohol consumption, marital status, BMI, history of severe CVD, history of hypertension, history of diabetes, cancer or malignancy, Ca supplements, serum Ca, serum vitamin D, caffeine, carbohydrate, and total energy intake. We also found that U.S. adults are eating less Ca than RDAs. Therefore, American adults need to increase their awareness of Ca intake, which may have some benefits in preventing depressive symptoms.
In the cross-sectional study, there is no significant association between dietary Ca intake and risk of depressive symptoms was detected (64). First of all, Joseph R’s study subjects were 279 women at home, and the small sample size compared with ours may lead to the different result from our study. Furthermore, self-reported Older American Nutrition Act Program (OAANP) home delivery services were not able to keep up with the dietary needs of elderly women at home, and 32% of the sample subjects were at risk of insufficient food, which may have influenced their findings. Therefore, differences in study settings and samples may explain the inconsistent results to some extent. However, our results are consistent with those of the previous several cross-sectional studies. In these studies, Ca intake was associated with a lower incidence of depression (65, 66).
The following study can also indirectly support our results. Bae et al. (67) found that pregnant women in the low depression level group had a significantly higher intake of total Ca and plant Ca than those in the high depression level group. A study from Zhejiang’s major public health surveillance program of 8,527 elderly people over 60 years old showed that oral vitamin D supplementation and Ca or Ca alone could relieve depression (68).
The inverse association between Ca intake and depression can be explained by several potentially related mechanisms. First, Ca is involved in regulating the hypothalamic-pituitary-adrenal (HPA) system, which is considered the body’s primary stress response system (69). Corticotropin-releasing hormone (CRH) stimulates the hypothalamus to secrete adrenocorticotropic hormone (ACTH) regulating the release of adrenocorticosteroid, the HPA system is regulated by CRH (70, 71). Therefore, If there is a dysregulation between the CRH and HPA systems, this would further affect stress hormones, such as cortisol, which will affect depressive symptoms (72).
Second, extracellular Ca influx is an important component of many neuronal processes (73). The change of extracellular Ca2+ concentration may participate in emotion regulation, which may be the direct effect of Ca on stabilizing the plasma membrane, and methyl-D-aspartate may also affect neural plasticity (74). Ca/calmodulin-dependent protein kinase II has been reported to mediate the process of metabotropic glutamate receptor production activity in group I of the rat hippocampus, leading to chronic depression (75, 76). Ca activates tryptophan hydroxylase in biosynthetic pathways leading to serotonin synthesis, while cytosolic Ca concentration plays a key role in stimulus-response coupling in various tissues, and disturbances in regulation may have a broad impact on cellular function, which in turn may alter mood (77, 78).
Our study has several strengths. First, to our knowledge, this is one of the few studies that have examined dietary Ca and depressive symptoms alone. In addition, we evaluated the dose relationship between Ca and depressive symptoms in addition to the corresponding sensitivity analysis. However, there are some limitations. Firstly, our study is a cross-sectional study in an observational study and therefore cannot account for causality. Secondly, using the 24-h dietary recall interview for dietary assessment can overestimate or underestimate actual intake. But the way to collect dietary data had been shown to be effective (79). Thirdly, the depressive symptoms in study were based on self-reports, therefore, it may be subject to misunderstanding of the question. Finally, although we have controlled for potential confounders as we have learned about, there may be additional covariates that were not included. However, there is no doubt that our findings contribute to the research on the link between Ca intake and depressive symptoms.
5. Conclusion
In conclusion, our results suggest an association between dietary Ca and the prevalence of depressive symptoms in United States adults. And Ca intake was negatively associated with the risk of depressive symptoms. As Ca intake increased, the prevalence of depressive symptoms decreased. More prospective studies are needed to examine the relationship between Ca and depressive symptoms.
Data availability statement
The datasets presented in this study can be found in online repositories. The names of the repository/repositories and accession number(s) can be found in the article/Supplementary material.
Ethics statement
The survey protocol for the NHANES was approved by the CDC’s National Center for Health Statistics Institutional Research Ethics Review Board. All participants provided written informed consent, and the study was approved by the NCHS Research Ethics Review Board (https://wwwn.cdc.gov/nchs/nhanes/default.aspx).
Author contributions
XS designed the research, conducted the statistical analyses, and drafted the manuscript. XS, XG, Y-YL, and LY completed the final draft. MZ and LJ reviewed the manuscript and supervised. All authors have made substantial contributions to the work, read the manuscript, agreed on the submission of this work to the journal, accept responsibility for the manuscript’s contents, and finalized the manuscript.
Acknowledgments
We would like to express our strong gratitude to all the participants who took part in this study.
Conflict of interest
The authors declare that the research was conducted in the absence of any commercial or financial relationships that could be construed as a potential conflict of interest.
Publisher’s note
All claims expressed in this article are solely those of the authors and do not necessarily represent those of their affiliated organizations, or those of the publisher, the editors and the reviewers. Any product that may be evaluated in this article, or claim that may be made by its manufacturer, is not guaranteed or endorsed by the publisher.
Supplementary material
The Supplementary Material for this article can be found online at: https://www.frontiersin.org/articles/10.3389/fnut.2023.1042522/full#supplementary-material
References
1. Noh J, Kwon Y, Park J, Oh I, Kim J. Relationship between physical disability and depression by gender: a panel regression model. PLoS One. (2016) 11:e0166238. doi: 10.1371/journal.pone.0166238
2. Li B, Lv J, Wang W, Zhang D. Dietary magnesium and calcium intake and risk of depression in the general population: a meta-analysis. Aust N Z J Psychiatry. (2017) 51:219–29. doi: 10.1177/0004867416676895
3. Verhaak P, Dekker J, de Waal M, van Marwijk H, Comijs H. Depression, disability and somatic diseases among elderly. J Affect Disord. (2014) 167:187–91. doi: 10.1016/j.jad.2014.05.057
4. World Health Organization,. Depression. (2021). Available online at: https://www.who.int/en/news-room/fact-sheets/detail/depression (accessed August 1, 2022).
5. Shi Y, Zheng R, Cai J, Qian S. The association between triglyceride glucose index and depression: data from NHANES 2005-2018. BMC Psychiatry. (2021) 21:267.
6. Alexopoulos G. Depression in the elderly. Lancet. (2005) 365:1961–70. doi: 10.1016/S0140-6736(05)66665-2
7. Aguilar-Latorre A, Perez Algorta G, Navarro-Guzman C, Serrano-Ripoll M, Olivan-Blazquez B. Effectiveness of a lifestyle modification programme in the treatment of depression symptoms in primary care. Front Med. (2022) 9:954644. doi: 10.3389/fmed.2022.954644
8. Nakamura M, Miura A, Nagahata T, Shibata Y, Okada E, Ojima T. Low zinc, copper, and manganese intake is associated with depression and anxiety symptoms in the Japanese working population: findings from the eating habit and well-being study. Nutrients. (2019) 11:847. doi: 10.3390/nu11040847
9. Iranpour S, Sabour S. Inverse association between caffeine intake and depressive symptoms in US adults: data from National Health and Nutrition Examination Survey (NHANES) 2005-2006. Psychiatry Res. (2019) 271:732–9. doi: 10.1016/j.psychres.2018.11.004
10. Manchishi S, Cui R, Zou X, Cheng Z, Li B. Effect of caloric restriction on depression. J Cell Mol Med. (2018) 22:2528–35. doi: 10.1111/jcmm.13418
11. Barber T, Kabisch S, Pfeiffer A, Weickert M. The health benefits of dietary fibre. Nutrients. (2020) 12:3208. doi: 10.3390/nu12103209
12. Tucker K. Nutrient intake, nutritional status, and cognitive function with aging. Ann N Y Acad Sci. (2016) 1367:38–49. doi: 10.1111/nyas.13062
13. Pecora F, Persico F, Argentiero A, Neglia C, Esposito S. The role of micronutrients in support of the immune response against viral infections. Nutrients. (2020) 12:3198. doi: 10.3390/nu12103198
14. Maggini S, Maldonado P, Cardim P, Newball C, Sota Latino E. Vitamins C, D and zinc: synergistic roles in immune function and infections. Vitamin Minerals. (2017) 6:3. doi: 10.4172/2376-1318.1000167
15. Trouwborst I, Verreijen A, Memelink R, Massanet P, Boirie Y, Weijs P, et al. Exercise and nutrition strategies to counteract sarcopenic obesity. Nutrients. (2018) 10:605. doi: 10.3390/nu10050605
16. Mohammadifard N, Humphries K, Gotay C, Mena-Sánchez G, Salas-Salvadó J, Esmaillzadeh A, et al. Trace minerals intake: risks and benefits for cardiovascular health. Crit Rev Food Sci Nutr. (2019) 59:1334–46. doi: 10.1080/10408398.2017.1406332
17. Cui Z, Zhou H, Liu K, Wu M, Li S, Meng S, et al. Dietary copper and selenium intakes and the risk of type 2 diabetes mellitus: findings from the China health and nutrition survey. Nutrients. (2022) 14:2055. doi: 10.3390/nu14102055
18. Focker M, Antel J, Grasemann C, Fuhrer D, Timmesfeld N, Ozturk D, et al. Effect of an vitamin D deficiency on depressive symptoms in child and adolescent psychiatric patients - a randomized controlled trial: study protocol. BMC Psychiatry. (2018) 18:57. doi: 10.1186/s12888-018-1637-7
19. Li Z, Wang W, Xin X, Song X, Zhang D. Association of total zinc, iron, copper and selenium intakes with depression in the US adults. J Affect Disord. (2018) 228:68–74. doi: 10.1016/j.jad.2017.12.004
20. Wang J, Um P, Dickerman B, Liu J. Zinc, magnesium, selenium and depression: a review of the evidence, potential mechanisms and implications. Nutrients. (2018) 10:584. doi: 10.3390/nu10050584
21. Sajjadi S, Foshati S, Haddadian-Khouzani S, Rouhani M. The role of selenium in depression: a systematic review and meta-analysis of human observational and interventional studies. Sci Rep. (2022) 12:1045. doi: 10.1038/s41598-022-05078-1
22. Yang B, Campbell P, Gapstur S, Jacobs E, Bostick R, Fedirko V, et al. Calcium intake and mortality from all causes, cancer, and cardiovascular disease: the Cancer Prevention Study II Nutrition Cohort. Am J Clin Nutr. (2016) 103:886–94. doi: 10.3945/ajcn.115.117994
23. Alghamdi M, Al Ghamdi K, Khan R, Uversky V, Redwan E. An interplay of structure and intrinsic disorder in the functionality of peptidylarginine deiminases, a family of key autoimmunity-related enzymes. Cell Mol Life Sci. (2019) 76:4635–62. doi: 10.1007/s00018-019-03237-8
24. Datta D, Leslie S, Wang M, Morozov Y, Yang S, Mentone S, et al. Age-related calcium dysregulation linked with tau pathology and impaired cognition in non-human primates. Alzheimers Dement. (2021) 17:920–32. doi: 10.1002/alz.12325
25. Coy A, Medina A, Rivera A, Sanchez P. Calcium intake in Colombia: are we still in deficit? Arch Osteoporos. (2020) 15:71. doi: 10.1007/s11657-020-00740-5
26. Meng X, Kerr D, Zhu K, Devine A, Solah V, Binns C, et al. Calcium intake in elderly Australian women is inadequate. Nutrients. (2010) 2:1036–43. doi: 10.3390/nu2091036
27. de Assumpcao D, Dias M, de Azevedo Barros M, Fisberg R, de Azevedo Barros Filho A. Calcium intake by adolescents: a population-based health survey. J Pediatr. (2016) 92:251–9. doi: 10.1016/j.jped.2015.09.004
28. Balk E, Adam G, Langberg V, Earley A, Clark P, Ebeling P, et al. Global dietary calcium intake among adults: a systematic review. Osteoporos Int. (2017) 28:3315–24. doi: 10.1007/s00198-017-4230-x
29. Gruchow H, Sobocinski K, Barboriak J. Calcium intake and the relationship of dietary sodium and potassium to blood pressure. Am J Clin Nutr. (1988) 48:1463–70. doi: 10.1093/ajcn/48.6.1463
30. Chae M, Jang J, Park K. Association between dietary calcium intake and the risk of cardiovascular disease among Korean adults. Eur J Clin Nutr. (2020) 74:834–41. doi: 10.1038/s41430-019-0525-7
31. Guo X, Gao J, Meng X, Wang J, Zhang Z, Song Q, et al. Association of dietary calcium intake with bone health and chronic diseases: two prospective cohort studies in China. Front Nutr. (2021) 8:683918. doi: 10.3389/fnut.2021.683918
32. Yao X, Hu J, Kong X, Zhu Z. Association between dietary calcium intake and bone mineral density in older adults. Ecol Food Nutr. (2021) 60:89–100. doi: 10.1080/03670244.2020.1801432
33. Flach F, Liang E, Stokes P. The effects of electric convulsive treatments on nitrogen, calcium, and phosphorus metabolism in psychiatric patients. J Ment Sci. (1960) 106:638–47. doi: 10.1192/bjp.106.443.638
34. Carman J, Wyatt R. Calcium: pacesetting the periodic psychoses. Am J Psychiatry. (1979) 136:1035–9. doi: 10.1176/ajp.136.8.1035
35. Nguyen H, Oh H, Kim M. Higher intakes of nutrients are linked with a lower risk of cardiovascular diseases, type 2 diabetes mellitus, arthritis, and depression among Korean adults. Nutr Res. (2022) 100:19–32. doi: 10.1016/j.nutres.2021.11.003
36. Vanoh D, Shahar S, Yahya H, Che Din N, Mat Ludin A, Ajit Singh D, et al. Dietary supplement intake and its association with cognitive function, physical fitness, depressive symptoms, nutritional status and biochemical indices in a 3-year follow-up among community dwelling older adults: a longitudinal study. Clin Interv Aging. (2021) 16:161–75. doi: 10.2147/CIA.S266587
37. Prevention CfDCa. National Center for Health Statistics NHANES Survey Methods and Analytic Guidelines, 2011–2016. (2018). Available online at: https://wwwn.cdc.gov/nchs/nhanes/AnalyticGuidelines.aspx (accessed August 1, 2022).
38. Zipf G, Chiappa M, Porter K, Ostchega Y, Lewis B, Dostal J. National health and nutrition examination survey: plan and operations, 1999-2010. Vital Health Stat 1. (2013) 56:1–31.
39. Ruan Z, Lu T, Chen Y, Yuan M, Yu H, Liu R, et al. Association between psoriasis and nonalcoholic fatty liver disease among outpatient US adults. JAMA Dermatol. (2022) 158:745–53. doi: 10.1001/jamadermatol.2022.1609
40. Woldetensay Y, Belachew T, Tesfaye M, Spielman K, Biesalski H, Kantelhardt E, et al. Validation of the patient health questionnaire (PHQ-9) as a screening tool for depression in pregnant women: Afaan Oromo version. PLoS One. (2018) 13:e0191782. doi: 10.1371/journal.pone.0191782
41. Bakian A, Huber R, Scholl L, Renshaw P, Kondo D. Dietary creatine intake and depression risk among U.S. adults. Transl Psychiatry. (2020) 10:52. doi: 10.1038/s41398-020-0741-x
42. Spitzer R, Kroenke K, Williams J. Validation and utility of a self-report version of PRIME-MD: the PHQ primary care study. Primary care evaluation of mental disorders. Patient health questionnaire. JAMA. (1999) 282:1737–44. doi: 10.1001/jama.282.18.1737
43. USDA,. Agriculture Research Service FSRG Food and Nutrient Database for Dietary Studies,5.0. (2012). Available online at: https://www.ars.usda.gov/northeastarea/beltsville-md-bhnrc/beltsville-human-nutrition-research-center/food-surveysresearch-group/ (accessed August 1, 2022).
44. Statistics NCfH. National Health and Nutrition Examination Survey:2013-2014 Data Documentation, Codebook, and Frequencies. (2016). Available online at: https://wwwn.cdc.gov/Nchs/Nhanes/2013-2014/DR1TOT_H.htm (accessed August 1, 2022).
45. Wang S, Mao S, Xiang D, Fang C. Association between depression and the subsequent risk of Parkinson’s disease: a meta-analysis. Prog Neuropsychopharmacol Biol Psychiatry. (2018) 86:186–92. doi: 10.1016/j.pnpbp.2018.05.025
46. Sanchez-Villegas A, Perez-Cornago A, Zazpe I, Santiago S, Lahortiga F, Martinez-Gonzalez M. Micronutrient intake adequacy and depression risk in the SUN cohort study. Eur J Nutr. (2018) 57:2409–19. doi: 10.1007/s00394-017-1514-z
47. Alkhatatbeh M, Abdul-Razzak K, Khwaileh H. Poor sleep quality among young adults: the role of anxiety, depression, musculoskeletal pain, and low dietary calcium intake. Perspect Psychiatr Care. (2021) 57:117–28. doi: 10.1111/ppc.12533
48. Alkhatatbeh M, Khwaileh H, Abdul-Razzak K. High prevalence of low dairy calcium intake and association with insomnia, anxiety, depression and musculoskeletal pain in university students from Jordan. Public Health Nutr. (2021) 24:1778–86. doi: 10.1017/S1368980020002888
49. He A, Chen C, Jia M, Fan R. Dietary calcium intake and HPV infection status among American women: a secondary analysis from National Health and Nutrition Examination Survey (NHANES) data set of 2003 - 2016. Med Sci Monit. (2020) 26:e921571. doi: 10.12659/MSM.921571
50. Eck L, Hackett-Renner C. Calcium intake in youth: sex, age, and racial differences in NHANES II. Prev Med. (1992) 21:473–82. doi: 10.1016/0091-7435(92)90054-L
51. Francis E, Zhang L, Witrick B, Chen L. Health behaviors of American pregnant women: a cross-sectional analysis of NHANES 2007-2014. J Public Health. (2021) 43:131–8. doi: 10.1093/pubmed/fdz117
52. Liu Y, Al-Sayegh H, Jabrah R, Wang W, Yan F, Zhang J. Association between C-reactive protein and depression: modulated by gender and mediated by body weight. Psychiatry Res. (2014) 219:103–8. doi: 10.1016/j.psychres.2014.05.025
53. Shin D, Hur J, Cho E, Chung H, Shivappa N, Wirth M, et al. Pre-pregnancy body mass index is associated with dietary inflammatory index and C-reactive protein concentrations during pregnancy. Nutrients. (2017) 9:351. doi: 10.3390/nu9040351
54. Shakya P, Melaku Y, Page A, Gill T. Nutrient patterns and depressive symptoms among Australian adults. Eur J Nutr. (2021) 60:329–43. doi: 10.1007/s00394-020-02243-y
55. Reinstatler L, Khaleel S, Pais V Jr. Association of pregnancy with stone formation among women in the United States: a NHANES analysis 2007 to 2012. J Urol. (2017) 198:389–93. doi: 10.1016/j.juro.2017.02.3233
56. Sun C, Wang R, Li Z, Zhang D. Dietary magnesium intake and risk of depression. J Affect Disord. (2019) 246:627–32. doi: 10.1016/j.jad.2018.12.114
57. Zhang T, Luo J, Ge H, Hao K, Wang Z, Zhang D. Relationships between urinary antimony concentrations and depressive symptoms in adults. Chemosphere. (2022) 291(Pt 3):133104. doi: 10.1016/j.chemosphere.2021.133104
58. Huang W, Gong D, Bao Y. Urinary iodine and serum 25-hydroxyvitamin D are associated with depression in adolescents. Trop J Pharm Res. (2019) 17:2471–6. doi: 10.4314/tjpr.v17i12.24
59. von Elm E, Altman D, Egger M, Pocock S, Gøtzsche P, Vandenbroucke J. The strengthening the reporting of observational studies in epidemiology (STROBE) statement: guidelines for reporting observational studies. Epidemiology. (2007) 18:800–4. doi: 10.1097/EDE.0b013e3181577654
60. Dong L, Xie Y, Zou X. Association between sleep duration and depression in US adults: a cross-sectional study. J Affect Disord. (2022) 296:183–8. doi: 10.1016/j.jad.2021.09.075
61. Yang Q, Zheng J, Chen W, Chen X, Wen D, Chen W, et al. Association between preadmission metformin use and outcomes in intensive care unit patients with sepsis and type 2 diabetes: a cohort study. Front Med. (2021) 8:640785.
62. Vetter C, Devore E, Wegrzyn L, Massa J, Speizer F, Kawachi I, et al. Association between rotating night shift work and risk of coronary heart disease among women. JAMA. (2016) 315:1726–34. doi: 10.1001/jama.2016.4454
63. Durrleman S, Simon R. Flexible regression models with cubic splines. Stat Med. (1989) 8:551–61. doi: 10.1002/sim.4780080504
64. Sharkey J. Risk and presence of food insufficiency are associated with low nutrient intakes and multimorbidity among homebound older women who receive home-delivered meals. J Nutr. (2003) 133:3485–91. doi: 10.1093/jn/133.11.3485
65. Bae Y, Kim S. Low dietary calcium is associated with self-rated depression in middle-aged Korean women. Nutr Res Pract. (2012) 6:527–33. doi: 10.4162/nrp.2012.6.6.527
66. Oishi J, Doi H, Kawakami N. Nutrition and depressive symptoms in community-dwelling elderly persons in Japan. Acta Med Okayama. (2009) 63:9–17.
67. Bae H, Kim S, Ahnv H, Cho Y. Comparison of nutrient intake, life style variables, and pregnancy outcomes by the depression degree of pregnant women. Nutr Res Pract. (2010) 4:323–31. doi: 10.4162/nrp.2010.4.4.323
68. Wu M, He F, Tang Q, Chen J, Gu X, Zhai Y, et al. Association between depressive symptoms and supplemental intake of calcium and vitamin D in older adults. J Nutr Health Aging. (2020) 24:107–12. doi: 10.1007/s12603-019-1278-7
69. Sartori S, Whittle N, Hetzenauer A, Singewald N. Magnesium deficiency induces anxiety and HPA axis dysregulation: modulation by therapeutic drug treatment. Neuropharmacology. (2012) 62:304–12. doi: 10.1016/j.neuropharm.2011.07.027
70. Silva A, Schoeffter P, Weckbecker G, Bruns C, Schmid H. Regulation of CRH-induced secretion of ACTH and corticosterone by SOM230 in rats. Eur J Endocrinol. (2005) 153:R7–10. doi: 10.1530/eje.1.01998
71. Brambilla F, Maggioni M, Cenacchi T, Sacerdote P, Panerai A. T-lymphocyte proliferative response to mitogen stimulation in elderly depressed patients. J Affect Disord. (1995) 36:51–6. doi: 10.1016/0165-0327(95)00059-3
72. Parrott A. Cortisol and 3,4-methylenedioxymethamphetamine: neurohormonal aspects of bioenergetic stress in ecstasy users. Neuropsychobiology. (2009) 60:148–58. doi: 10.1159/000253551
73. Xu L, Zhang S, Chen W, Yan L, Chen Y, Wen H, et al. Trace elements differences in the depression sensitive and resilient rat models. Biochem Biophys Res Commun. (2020) 529:204–9. doi: 10.1016/j.bbrc.2020.05.228
74. Wu C, Bohr D. Mechanisms of calcium relaxation of vascular smooth muscle. Am J Physiol. (1991) 261(5 Pt 2):H1411–6. doi: 10.1152/ajpheart.1991.261.5.H1411
75. Mockett B, Guévremont D, Wutte M, Hulme S, Williams J, Abraham W. Calcium/calmodulin-dependent protein kinase II mediates group I metabotropic glutamate receptor-dependent protein synthesis and long-term depression in rat hippocampus. J Neurosci. (2011) 31:7380–91. doi: 10.1523/JNEUROSCI.6656-10.2011
76. Carman J, Wyatt R. Calcium: bivalent cation in the bivalent psychoses. Biol Psychiatry. (1979) 14:295–336.
77. Llinás R. Depolarization-release coupling systems in neurons. Neurosci Res Program Bull. (1977) 15:555–687.
78. Knapp S, Mandell A, Bullard W. Calcium activation of brain tryptophan hydroxylase. Life Sci. (1975) 16:1583–93. doi: 10.1016/0024-3205(75)90076-4
Keywords: depression, dietary calcium, calcium, adults, National Health and Nutrition Examination Survey (NHANES)
Citation: Shen X, Gu X, Liu Y-Y, Yang L, Zheng M and Jiang L (2023) Association between dietary calcium and depression among American adults: National health and nutrition examination survey. Front. Nutr. 10:1042522. doi: 10.3389/fnut.2023.1042522
Received: 12 September 2022; Accepted: 23 January 2023;
Published: 09 February 2023.
Edited by:
Cain Craig Truman Clark, Coventry University, United KingdomReviewed by:
Dongfeng Zhang, Qingdao University, ChinaAsma Salari-Moghaddam, Tehran University of Medical Sciences, Iran
Copyright © 2023 Shen, Gu, Liu, Yang, Zheng and Jiang. This is an open-access article distributed under the terms of the Creative Commons Attribution License (CC BY). The use, distribution or reproduction in other forums is permitted, provided the original author(s) and the copyright owner(s) are credited and that the original publication in this journal is cited, in accordance with accepted academic practice. No use, distribution or reproduction is permitted which does not comply with these terms.
*Correspondence: Lei Jiang,  jiang178dajishan@163.com
†These authors have contributed equally to this work and share first authorship
‡ORCID: Xia Shen, orcid.org/0000-0003-2229-302X; Long Yang, orcid.org/0000-0003-1870-878X; Lei Jiang, orcid.org/0000-0002-0307-4748