 Takele Gezahegn Demie
 Getachew Tilahun Gessese
95% of researchers rate our articles as excellent or good
Learn more about the work of our research integrity team to safeguard the quality of each article we publish.
Find out more
ORIGINAL RESEARCH article
Front. Nutr. , 16 March 2023
Sec. Nutritional Epidemiology
Volume 10 - 2023 | https://doi.org/10.3389/fnut.2023.1035591
This article is part of the Research Topic Nutrition and Sustainable Development Goal 1: No Poverty View all 5 articles
Background: Food security occurs when all people have physical, social, and economic access to sufficient, safe, and nutritious food that fits their dietary needs and food preferences for an active and healthy life at all times. There is limited evidence on this topic and not well studied in Ethiopia.
Objective: This study aimed to investigate food insecurity and hunger status among households (HHs) in Debre Berhan town, Ethiopia.
Methods: A community-based cross-sectional study was undertaken from 1 January 2017 to 30 January 2017. A simple random sampling technique was used to enroll 395 HHs for the study. An interviewer-administered, structured, and pretested questionnaire was used to collect data through a face-to-face interview. The household food security and hunger status were assessed by using the Household Food Insecurity Access Scale and the Household Hunger Scale, respectively. Data were entered and cleaned using Epiata 3.1 and exported to SPSS software version 20 for statistical analysis. Logistic regression was fitted, and an odds ratio with a 95% confidence interval (CI) and a value of p of less than 0.05 were used to identify factors associated with food insecurity.
Results: A total of 377 HHs participated in the study with a response rate of 95.4%. The proportion of households with food insecurity was 32.4%, among which mild, moderate, and severe food insecurity accounted for 10.3, 18.8, and 3.2%, respectively. The mean score of the Household Food Insecurity Access Scale was 1.88 ± 3.5. Hunger occurred among 3.2% of households. The mean score of the Household Hunger Scale was 2.17 ± 1.03. Husband or male cohabitant’s occupation (AOR = 2.68; 95% CI: 1.31–5.48) and wife or female cohabitant’s literacy (AOR = 3.10; 95% CI: 1.01– 9.55) were the only factors associated with HH food insecurity.
Conclusion: HH food insecurity and hunger in Debre Berhan town were unacceptably high, which can hamper achieving national targets for food security, nutrition, and health. Intensified efforts are further needed to accelerate the decline in food insecurity and hunger prevalence. Therefore, interventions need to target self-employed merchants in small businesses and women who are uneducated.
Food security (FS), as defined by the United Nations Food and Agriculture Organization (FAO), occurs when all people have physical, social, and economic access to sufficient, safe, and nutritious food that fits their dietary needs and food preferences for an active and healthy life at all times (1). Global development efforts target food security as a key component that needs action and are considered a stepping stone for other development goals through eradicating poverty and hunger (2, 3). Despite a Sustainable Development Goal (SDG) to eradicate hunger by 2030 (4) and international recommendations and pledges to achieve universal food security (5–7), so far, it remains a challenge to the world, and it is now becoming clear that the world cannot meet the target unless strict actions are undertaken to accelerate the progress (1, 8).
Therefore, globally, it is projected that 8% of the world’s population will still face hunger by 2030, with no improvement shown since 2015 (1). In 2021, approximately 3.1 billion people lacked access to appropriate food, and approximately 11.7% of the global population faced severe food insecurity (1). The gender disparity in the prevalence of moderate or severe food insecurity widened even further, with women experiencing 10% more moderate or severe food insecurity than men globally (8).
Food insecurity (FINS) has also been identified as a risk factor for malnutrition in studies (9, 10). It has a negative influence on people’s health and nutrition, especially those who are most vulnerable (1, 8). The prevalence of undernourishment grew from 9.3 in 2020 to 9.8 in 2021. With no progress since 2012, approximately one in three women aged 15 to 49 years (571 million) were affected by anemia in 2021 (1), globally. Moreover, stunting and wasting affect 22.0 and 6.7% of children under the age of 5 years, respectively (1, 8).
Given that food insecurity is a global concern and the prevalence of household food insecurity varies depending on a variety of factors, it is necessary to investigate the scope of the problem and the factors influencing it in various contexts. Food insecurity was found to be 4.09% in England (10), 77.2% in northern India (11), 49% in Iran (12), and 68% in Indonesia (13). In Nigeria, FINS was found to be 49.4% (14), 87.2% (15), and 90.9% (16) among rural households conducted in 2016, 2021, and 2022, respectively.
Ethiopia is not an exception to being challenged with food insecurity. More than 10% of Ethiopians and the sub-Saharan population are chronically food insecure (17, 18). According to Ethiopian Demographic and Health Survey Reports (EDHS), the prevalence of stunting, being underweight, and wasting among children in Ethiopia changed from 52, 47, and 11% to only 37, 21, and 7% progressively declining between 2000 and 2019, over a 19-year journey (19–22). The proportion of women in the reproductive age group with chronic energy deficiency changed from 30% to only 22% between 2000 and 2016 (19, 21). In addition, a systematic review showed that FINS among female-headed households was estimated to be high in Ethiopia (23). Various pocket studies in Ethiopia indicated a high prevalence of household food insecurity with varying prevalence (24–27) from place to place in the southern parts of the country and northern Ethiopia (28).
Food insecurity was affected by multiple factors that may vary from place to place. Most studies conducted around the world found that the gender of household heads (14–16, 23, 24, 29–32), age of household heads (15, 16, 24, 32–34), family size (14, 24, 27, 35), uncoupled households (24), marital status of the head of household (25, 33), educational level of women handling food (11), educational status of household head (15, 16, 26, 29, 30, 33), and economic status (14, 32, 33, 35) were determining factors of food insecurity.
Therefore, although the impact of FINS on health and nutritional status is clear, there have been few studies in the sector, and the results of those that have been undertaken are inconsistent. Furthermore, the majority of Ethiopian studies have mostly focused on measuring FINS among rural populations overlooking the urban setup. Given the sociocultural, economic, and ecological diversity of Ethiopian cities, as well as the country’s long-term high food prices, the conditionally varied urban community FINS has received little attention. Therefore, the goal of this study was to determine household food insecurity (FINS) and associated factors in Debre Berhan town, central Ethiopia. The results will inform decision-makers, programmers, health experts, and other stakeholders on food insecurity in an urban highland, as well as provide data for related public health lessons and interventions.
A community-based cross-sectional study was conducted to assess household food insecurity status and its determinant factors among households from 1 January 2017 to 30 January 2017 in Debre Berhan town. The town is located in the North Shewa Zone of Amhara Regional State and situated in a total area of 18,081.95 hectares. It is 130 km away from Addis Ababa to the northeast. Administratively, the town is subdivided into nine kebeles (the lowest administrative unit in Ethiopia). According to the 2013 National Labor Force Survey conducted by the Ethiopian Central Statistics Agency (36), the town had an 87,204 total population, out of which 47,354 were women. The source and study population were all the households in the town. Individual respondents in the households were the study unit.
For sample size calculation, we used the single population proportion formula by using Epi Info StatCalc considering the following assumptions: 95% confidence level (Zα/2), 37.2% proportion of households with food insecurity (25) for prevalence (p), and 5% margin of error (d), which was 359. With a 10% non-response rate, the calculated sample size was 395. However, 377 households participated in this study, and 18 of them refused to consent to their participation.
A simple random sampling technique was used to select the sample of 395 households from all the nine kebeles proportional to population size allocation, after obtaining lists of all households in the Debre Berhan town by their respective kebele of residence from health extension workers. When respondents were not available at the time of data collection, two repeated visits were made before dropping them as non-respondents.
Household food insecurity status was the dependent variable, while independent variables include sociodemographic and economic variables identified to affect food security status in the study area including age, sex, religion, marital status, educational status, occupation, family size, number of children, and average monthly income of the household.
A structured pretested questionnaire was used to collect the required quantitative information through face-to-face interviews. It was first prepared in English, then translated to Amharic, the local survey language, by the language experts, and again back to English to check its consistency. To determine the household FINS status/level, the Household Food Insecurity Access Scale (HFIAS) developed by the Food and Nutrition Technical Assistance (FANTA) project was used (37). HFIAS is a standardized tool that can distinguish food security status in several countries across diverse sociocultural contexts.
The questionnaire is made up of nine “occurrence” or “incidence” questions (See Table 1), which reflect a usually increasing level of FINS (access), and nine “frequency-of-occurrence” questions, which are answered as a follow-up to each occurrence question to find out how frequently the situation happened. Following affirmative responses to the nine HFIAS questions, frequency questions are used to calculate the four categories of household food insecurity prevalence (HFIAP) using the formula supplied by HFIAS version 3 (37).
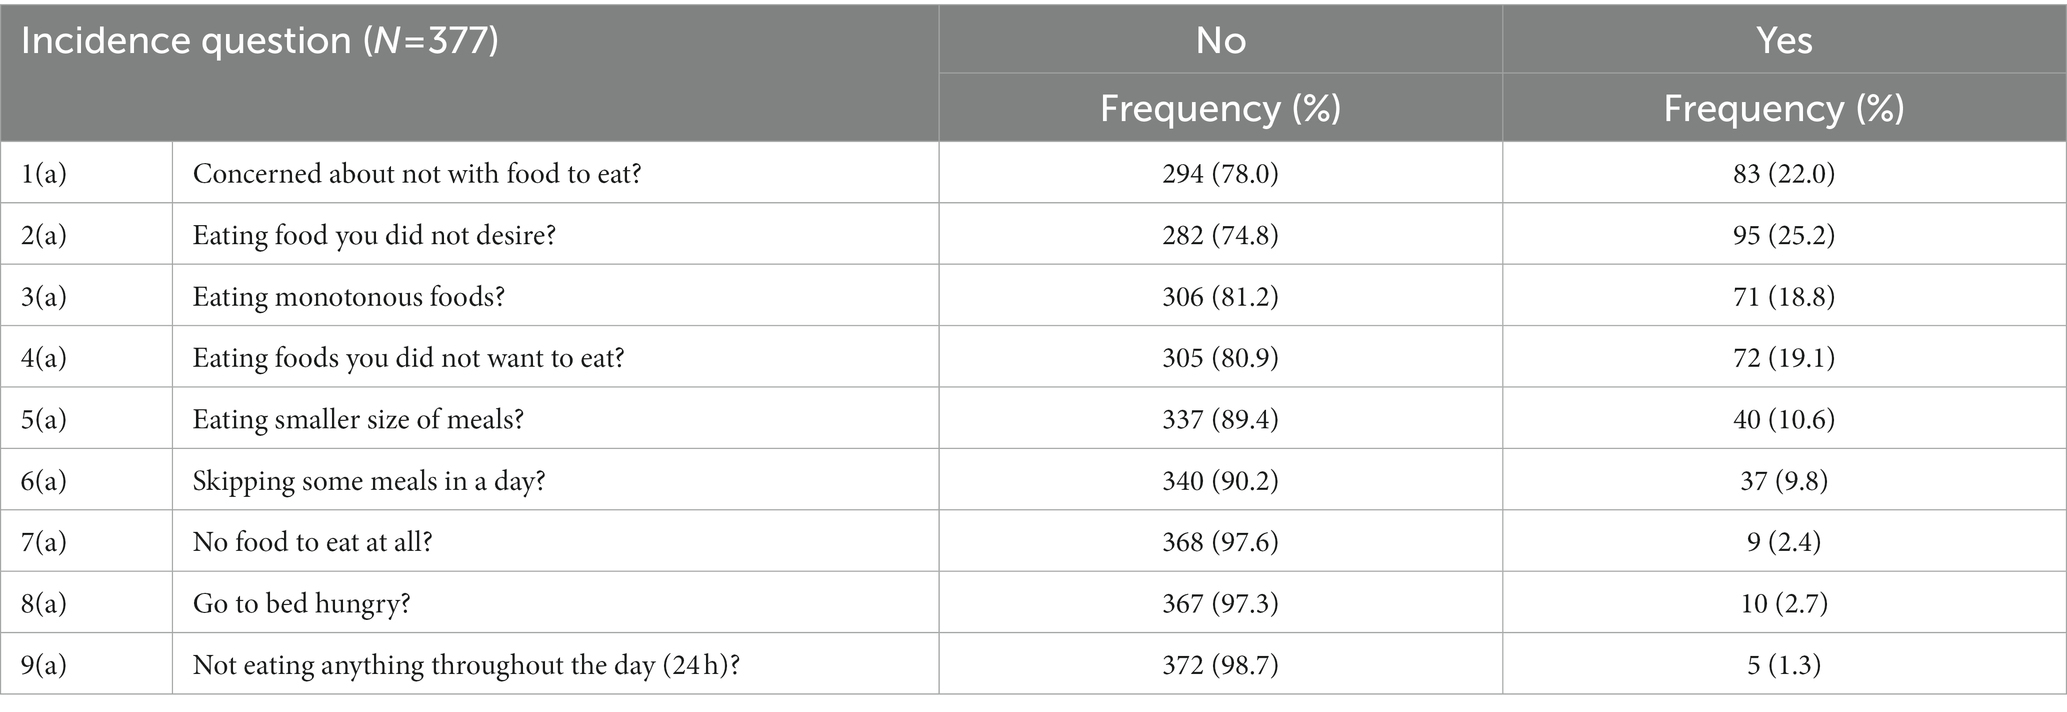
Table 1. Distribution of households based on the incidence of food insecurity conditions in Debre Berhan town, central Ethiopia (n = 377).
According to the HFIAP indicator, there are four levels of food insecurity for households: (i) food secure, (ii) mildly food insecure, (iii) moderately food insecure, and (iv) severely food insecure (Figure 1). As households respond positively to more severe situations and/or encounter such conditions more frequently, they are classified as having a growing level of FINS. Therefore, categories were constructed according to the following criteria set in the HFIAS guideline.
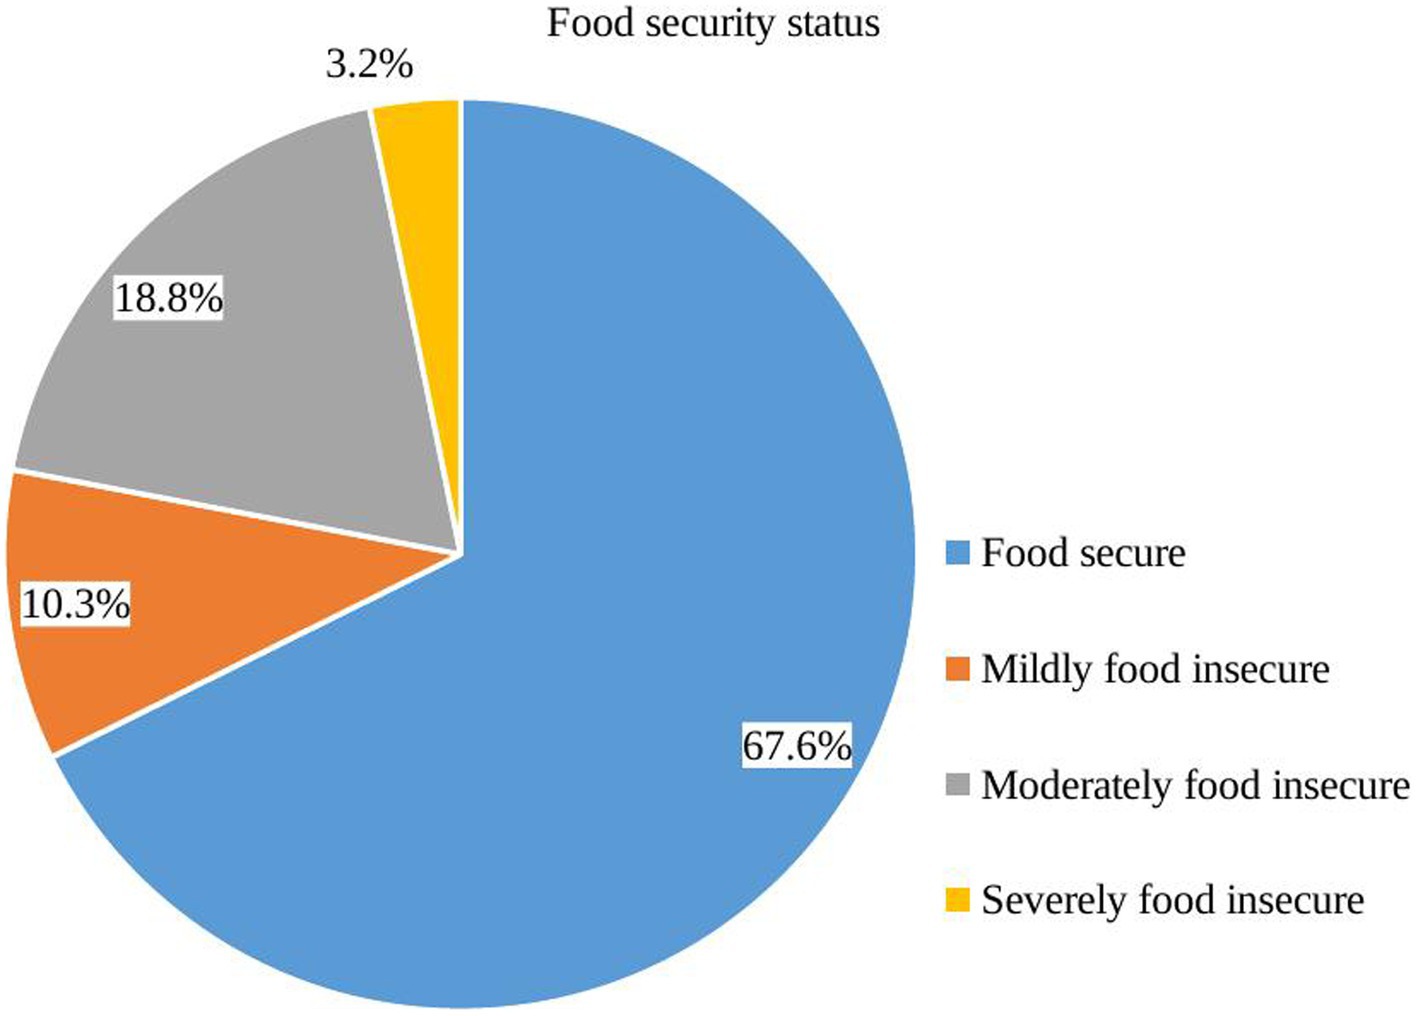
Figure 1. Food insecurity level of households in Debre Berhan town, central Ethiopia (n = 377).
A brief explanation of the categories of household food insecurity levels as assessed through the HFIAS module (37):
Food secure (FS): If [(Q1a = 0 or Q1a = 1) and Q2 = 0 and Q3 = 0 and Q4 = 0 and Q5 = 0 and Q6 = 0 and Q7 = 0 and Q8 = 0 and Q9 = 0], the household did not experience any of the food insecurity situations, or only had the experience of worrying about food but rather infrequently.
Mild food insecurity: If [(Q1a = 2 or Q1a = 3 or Q2a = 1 or Q2a = 2 or Q2a = 3 or Q3a = 1 or Q4a = 1) and Q5 = 0 and Q6 = 0 and Q7 = 0 and Q8 = 0 and Q9 = 0], the household worries about not having food to eat occasionally or frequently, and/or being unable to consume choice foods, and/or having little variety of food, and/or some food referred to as unpalatable only on rare occasions.
Moderate food insecurity: If [(Q3a = 2 or Q3a = 3 or Q4a = 2 or Q4a = 3 or Q5a = 1 or Q5a = 2 or Q6a = 1 or Q6a = 2) and Q7 = 0 and Q8 = 0 and Q9 = 0], the household consumes few varieties or unpalatable foods occasionally or frequently, and/or has begun to reduce the size or number of meals infrequently or occasionally but did not experience any of the three extreme food insecurity situations.
Severely food insecure: If [Q5a = 3 or Q6a = 3 or Q7a = 1 or Q7a = 2 or Q7a = 3 or Q8a = 1 or Q8a = 2 or Q8a = 3 or Q9a = 1 or Q9a = 2 or Q9a = 3], the household has moved gradually to reducing the quantity of meal or number of meals most frequently, and/or experiencing the three most extreme situations such as “not having any food to eat,” “going to bed without eating any food,” or “going a whole day hungry,” even infrequently.
The Household Hunger Scale (HHS) was used to assign households along a continuum of severity in food access from no hunger to severe household hunger (based on the scored value of three HHS questions) that ranges from a minimum score of 0 to a maximum score of 6. Households were categorized as no or little hunger if the score was 0–1, mild hunger if the score was 2–3, and severe hunger if the score was 4–6 (Figure 2) (38). Then, the prevalence of household food with insecurity and hunger was calculated after categorizing households into respective groups. Whereas, for the rest factors included in the study, the tool was adapted from various similar literature on the topic with some modifications to fit with the context (14, 23–25).
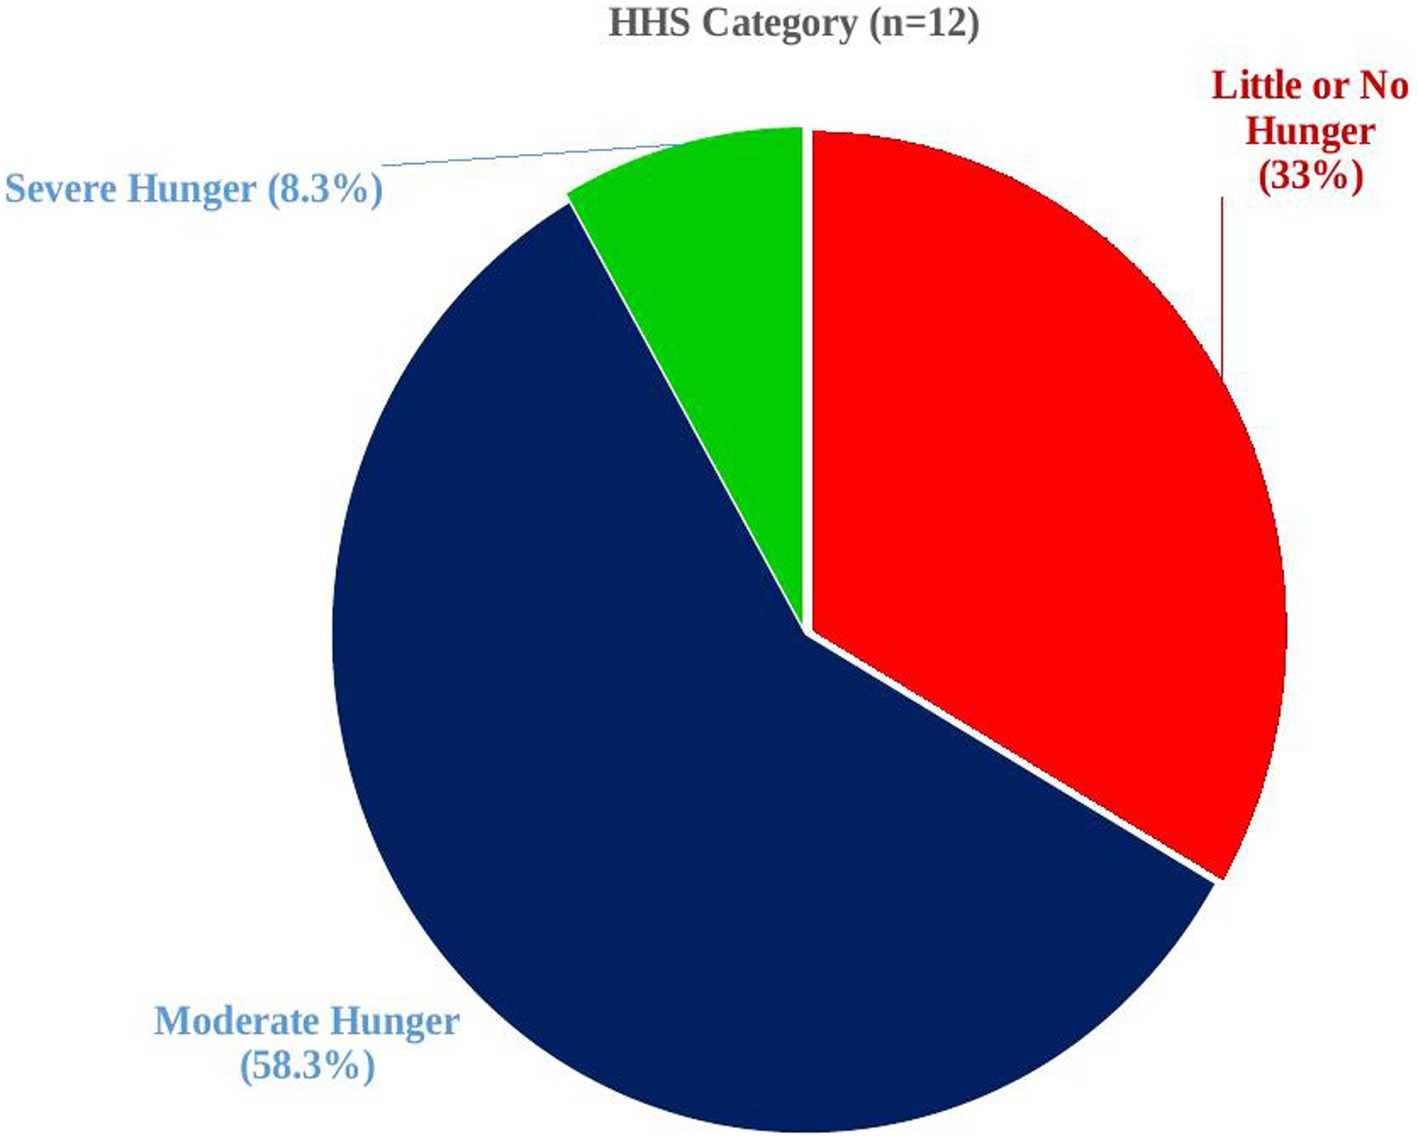
Figure 2. Hunger status of households in Debre Berhan town, central Ethiopia (n = 12).
Six data collectors who were health professionals and had experience with household food insecurity surveys were recruited and trained to facilitate the data collection process. The training was given to data collectors for 1 day on the rationale, objective of the study, confidentiality, the process, and technique of data collection including how to use the questionnaires. A pretest was performed before the actual data collection on 5% of the sample out of the study area, and necessary modifications were made accordingly. The researchers closely supervised the data collection process on daily basis, and feedback and correction were given for incompleteness and inconsistencies throughout the data collection period.
The completeness and consistency of responses were further reviewed on all returned copies of the questionnaire. The data were then entered into EpiData version 3.1 for cleaning and coding, with double-entry verification, and exported to SPSS version 20 for further analysis. The descriptive statistics of the data were summarized using the mean, standard deviation, frequencies, and percentages. The dependent variable was binary coded with a “1” for food-insecure households and a “0” for food-secure households to compute binary logistic regression. To identify factors independently related to household food insecurity, a bivariate logistic regression analysis was used to identify the relationships between the dependent and independent variables at a value of p of 0.2 cutoff point to include in the multivariable logistic regression model. The fitness of the multivariable regression model was tested through the Hosmer–Lemeshow goodness-of-fit. The adjusted odds ratio (AOR) with 95% of confidence intervals at a value of p of ≤0.05 was used to declare the variables significantly associated with the dependent variable in the multivariable analysis. Finally, data were presented using tables, figures, and text descriptions.
The Institutional Ethical Review Board (IRB) of Debre Berhan University granted ethical approval. Support letters were obtained from the research, community service, and Postgraduate Coordination Office of the College of Health Sciences as well as from the Debre Berhan town’s health office. Because some respondents were unable to read or write, each participant gave their informed verbal agreement after being told of the study’s aim, advantages, risks, information confidentiality, and voluntary nature of participation. Furthermore, all data collectors and investigators ensured the confidentiality of the information gathered from each study subject by using code numbers instead of personal identifiers and making the questionnaire inaccessible to anyone other than the investigators.
A total of 377 HHs participated in this study, making a response rate of 95.4%. The sociodemographic characteristics of the study unit are presented in Table 2. The vast majority of HHs were male-headed (88.4%) and more than half of the heads of HH were below 30 years of age (56.1%). The majority of respondents were Orthodox Christian by religion (89.3%), married (94.5%), and the husband or male cohabitant partner’s occupation was a governmental employee (61%). Approximately 89% of couples or partners attended formal education. More than half (60%) of the HHs had families of four to six members, with an average of one child under the age of five in HH (311, 85.2%), a maximum of two children per HH (290, 77.6%), and an income of at least the group’s median monthly earnings (216, 57.3%). The household’s monthly income ranges from 100 to 20,000 Ethiopian Birr. In the U.S. dollar equivalent, these values become approximately 4.3 to 869.6 using the currency exchange rate since April 2017 [1 USD is nearly 23 ETB at that time].
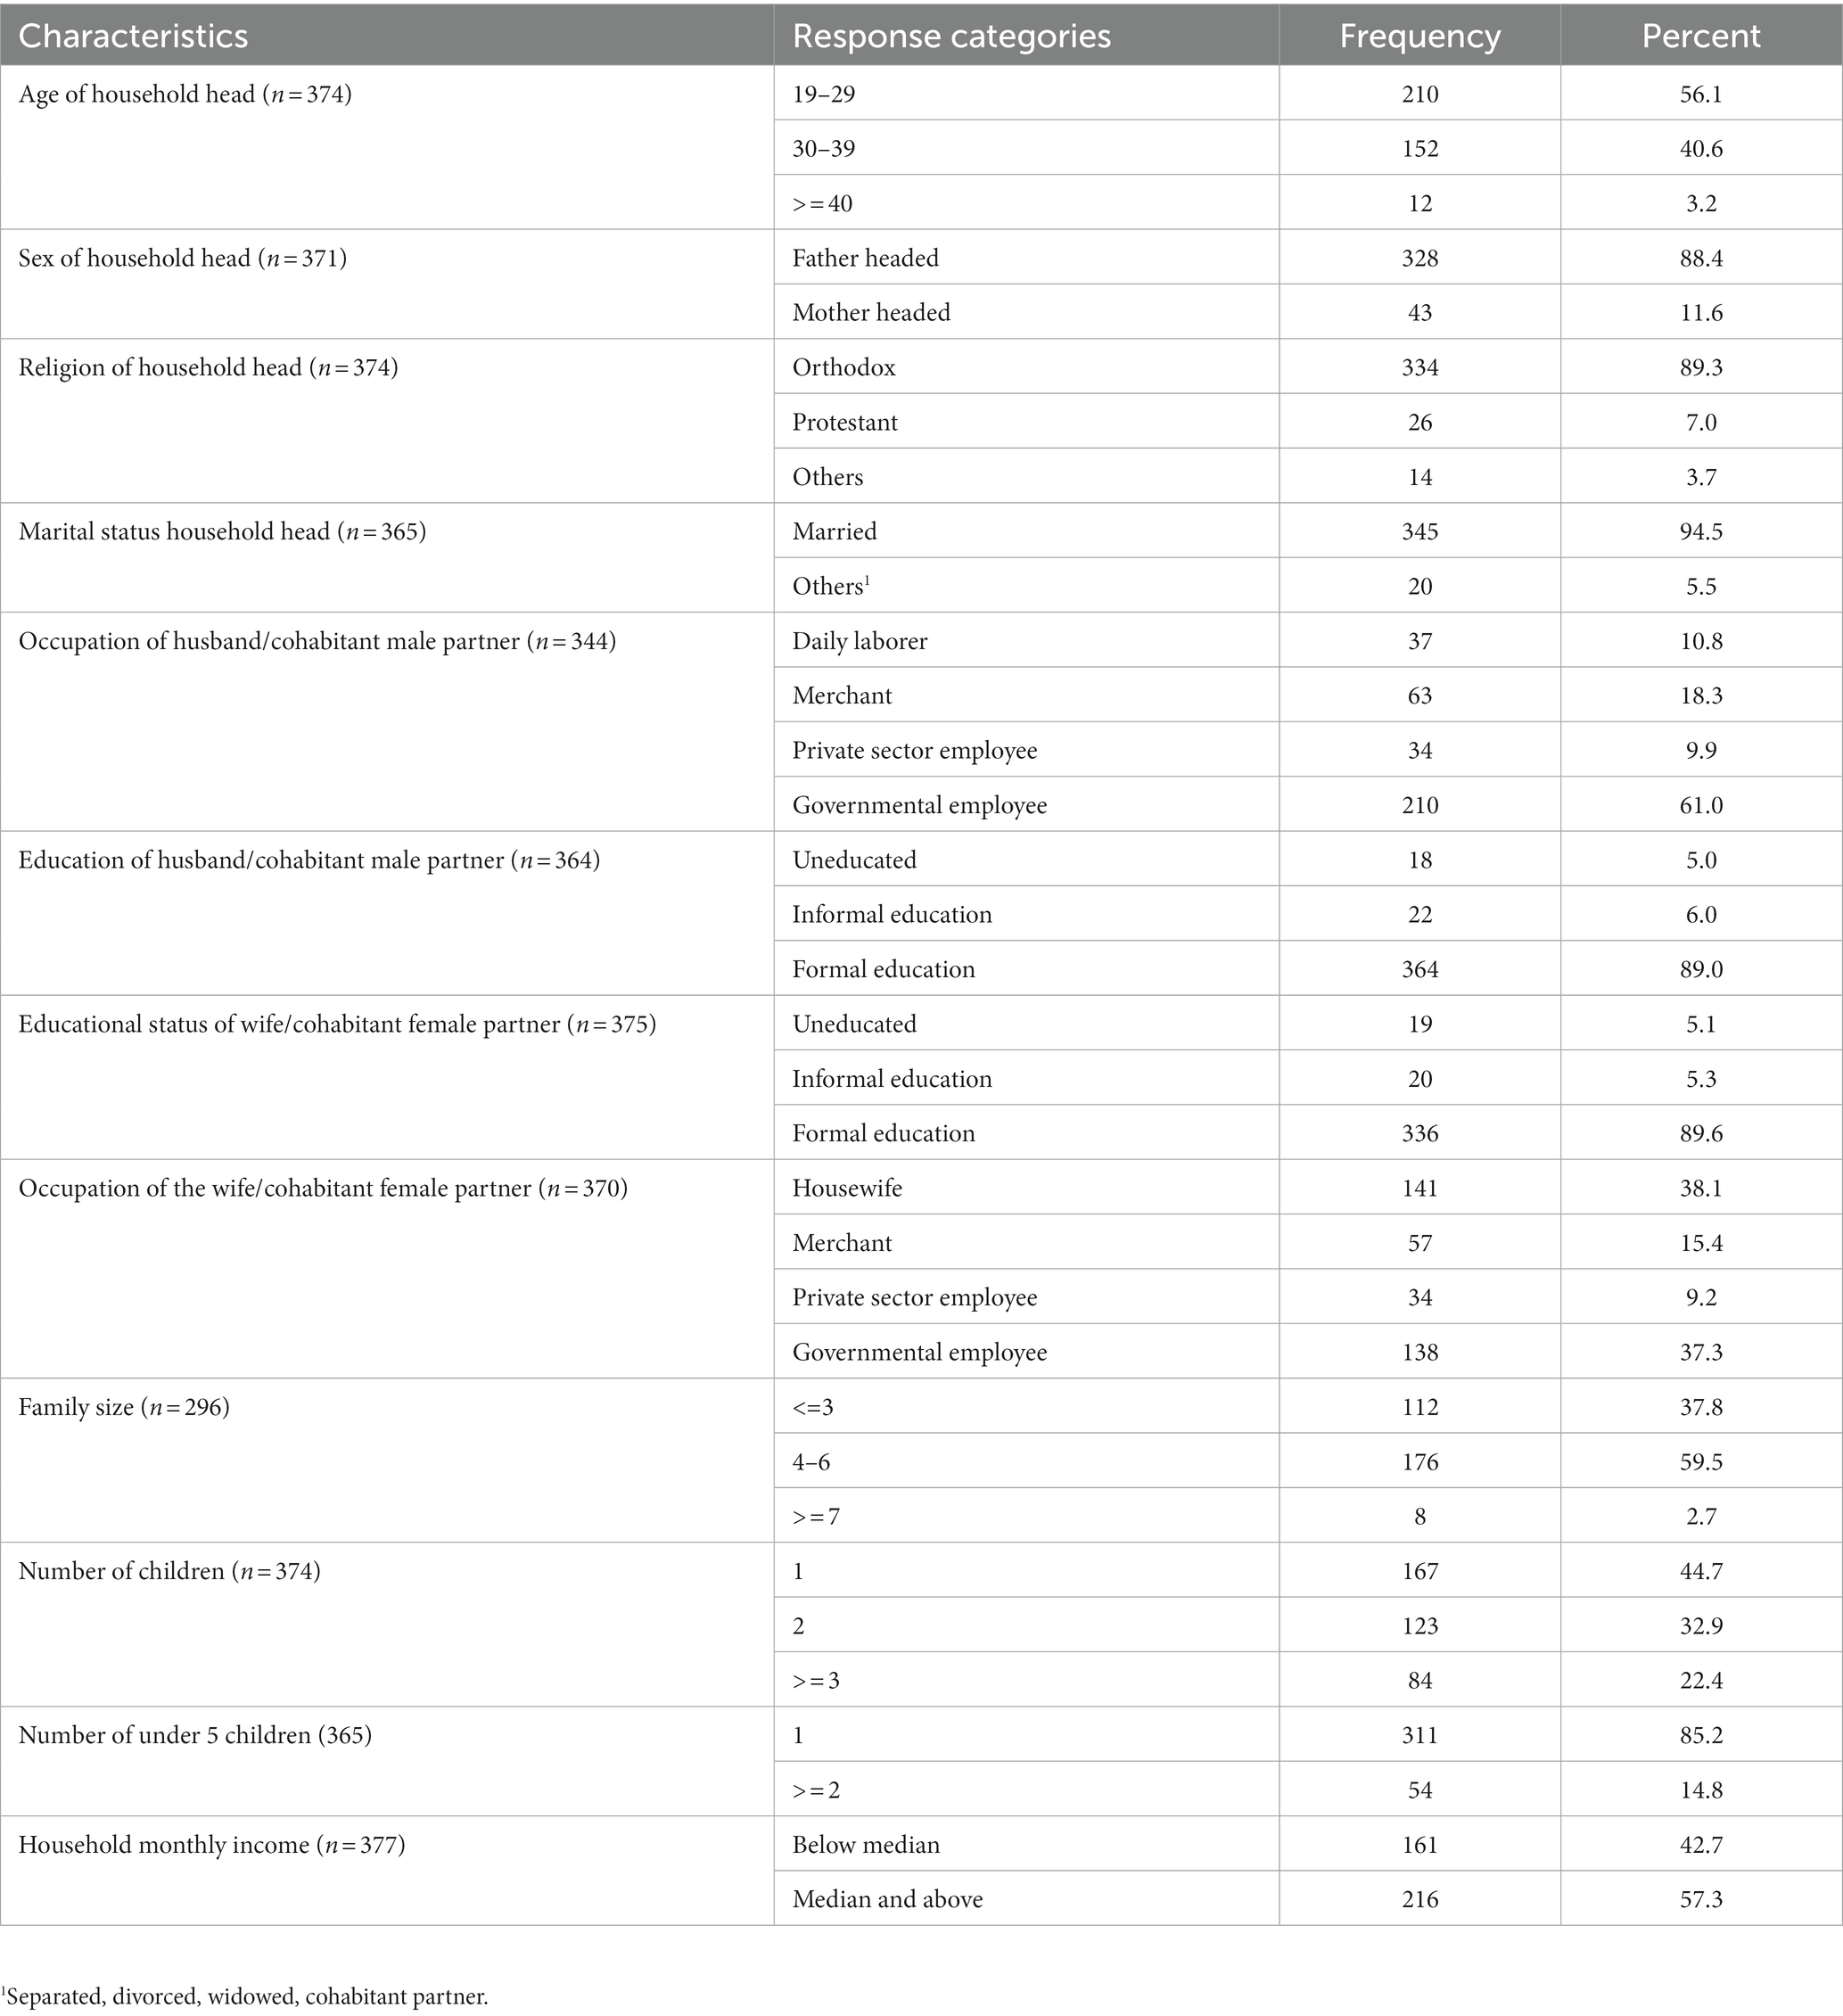
Table 2. Sociodemographic characteristics of respondents and households in Debre Berhan town, central Ethiopia (n = 377).
The HFIAS module of nine occurrence/incidence questions for FINS among households in the study region is shown in Table 1. It indicated 78, 74.8, 81.2, and 80.9% of household questions responded “no” to the occurrence questions 1–4, while 89.4, 90.2, 97.6, 97.3, and 98.7% of them responded “no” to the occurrence questions 5–9. The remaining households answered the nine HFIAS questions positively (“yes”). Table 1 also shows a decreased trend in the percentage of households that replied affirmatively to the nine HFIAS questions with a 4-week recall interval, while there is a steady increase in the percentage of households that responded “no” to the questions.
Approximately 32.4% of households were food insecure (Figure 3) with approximately 10, 19, and 3% facing mild, moderate, and severe FINS (Figure 1), respectively. The mean Household Food Insecurity Access Scale (HFIAS) score was 1.88 ± 3.5 (standard deviation). The mean and standard deviation Household Hunger Scale (HSS) score was 2.17 ± 1.03. Among households with hunger (3.2%), more than half of them were in a stage of moderate hunger (58.3%) while those in the severe hunger stage accounted for 8.3% (Figure 2).
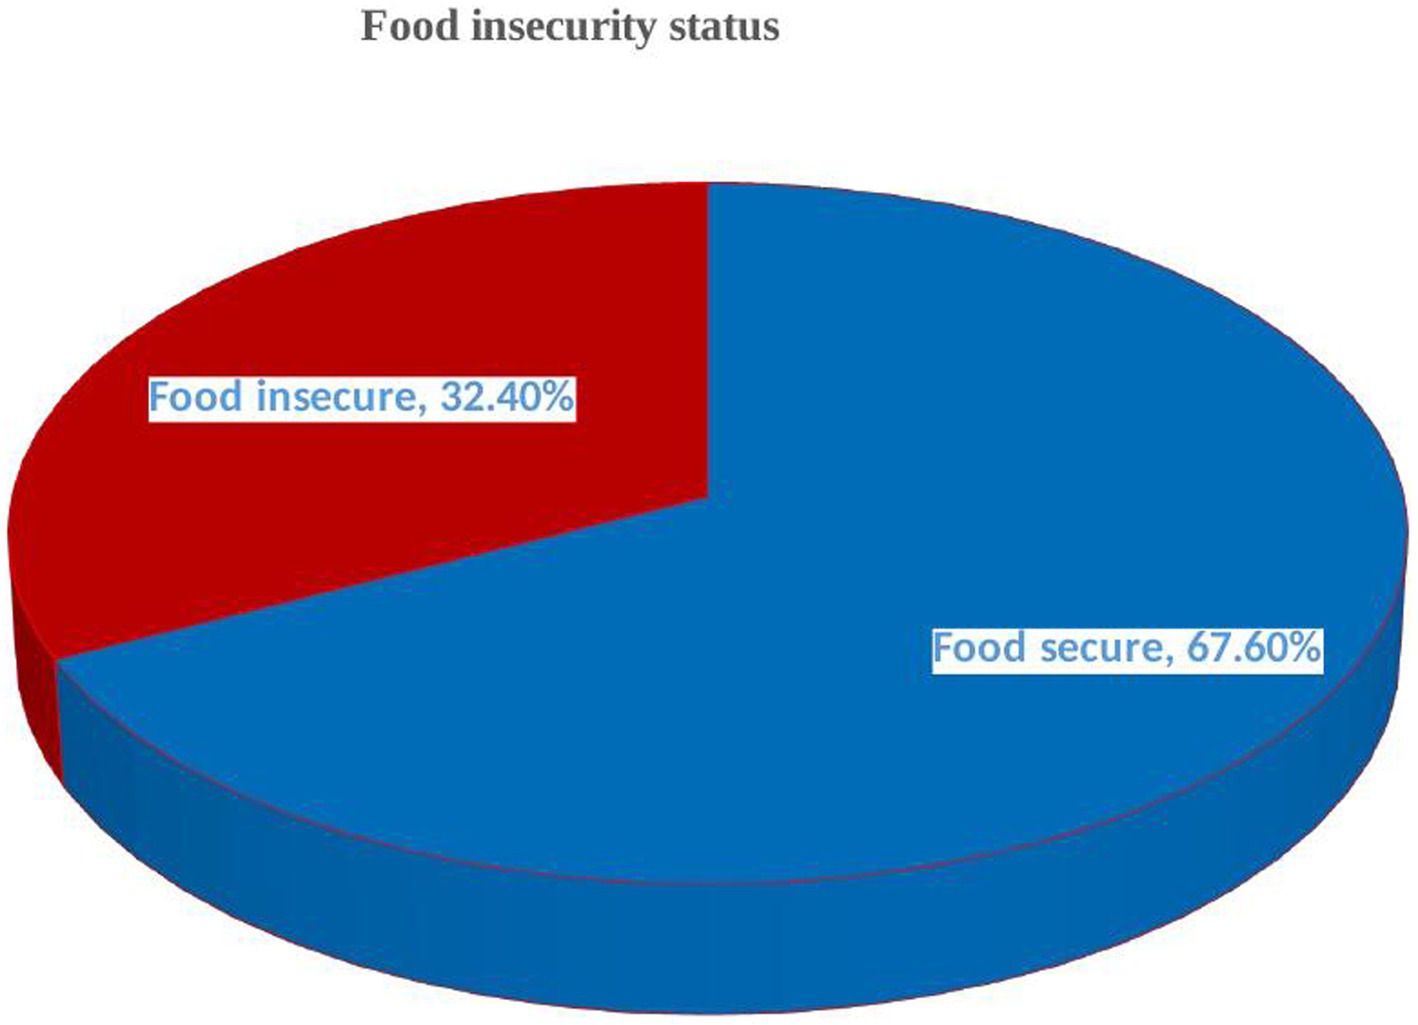
Figure 3. Food security status (secure vs. insecure) in Debre Berhan town, central Ethiopia (n = 377).
Bivariate logistic regression revealed multiple factors associated with food insecurity. In the multivariable analysis, after we adjusted for confounding variables, only the occupation of the husband or male cohabitant and the educational status of the wife or female cohabitant were found to be the determining factors of food insecurity among HHs in Debre Berhan town. The odds of HH food insecurity were approximately two times higher (AOR = 2.68; 95% CI: 1.31–5.48) among husbands or male cohabitants who are merchants than government employees. In addition, the odds of HH food insecurity were approximately three times higher (AOR = 3.10; 95% CI: 1.01–9.55) among uneducated wives or female cohabitants compared with women with formal education (Table 3).
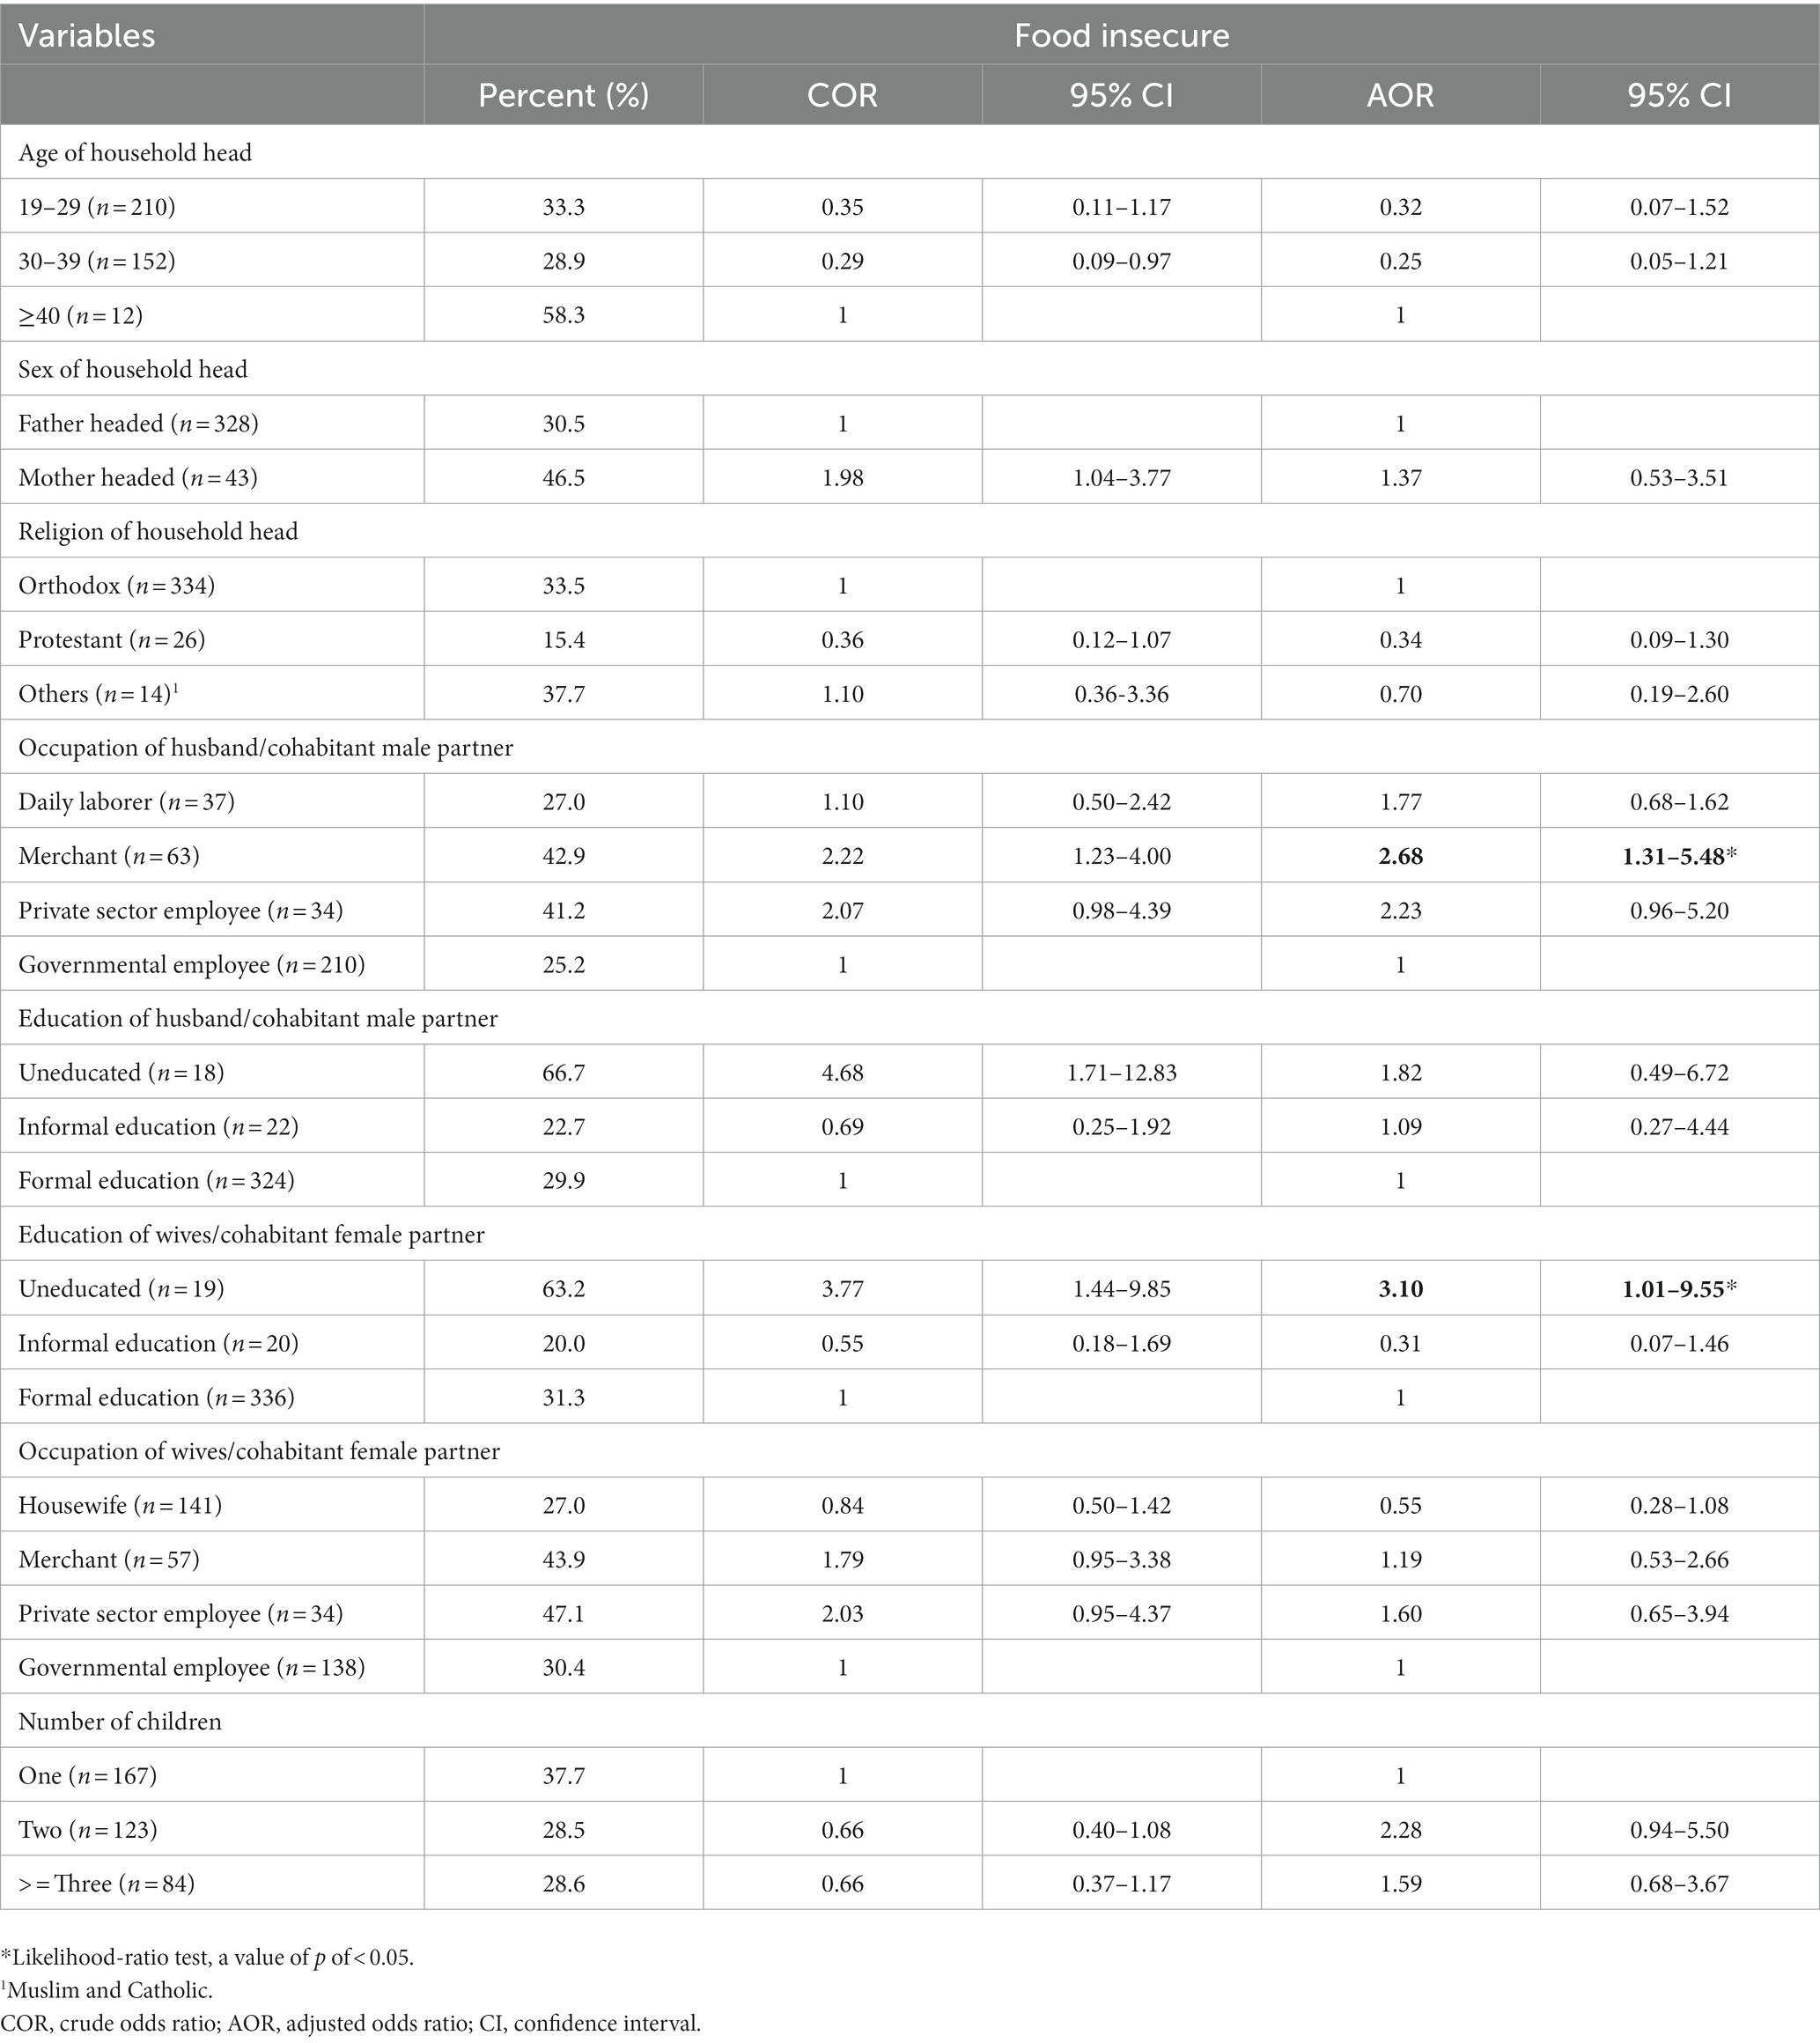
Table 3. Factors associated with food insecurity using multivariable logistic regression among households in Debre Berhan town, central Ethiopia (n = 377).
Food insecurity is a major challenge in Ethiopian HHs. This study investigated the level and determinants of HH food insecurity using HFIAS in Debre Berhan town (urban area). A total of 122 (32.4%) HHs had FINS (10.3, 18.8, and 3.2% were mildly, moderately, and severely food insecure, respectively). The overall hunger prevalence in the study subjects was 3.2%; among them, 33.3, 58.3, and 8.3% had little, moderate, and severe hunger, respectively. Merchant husbands’ or male cohabitant partners’ occupation and educational status of wives or female cohabitant partners were both found to be significant predictors of HH food insecurity in the research area.
The FINS revealed (32.4%) by this study is lower compared with the findings of different studies in northern India (77.2%), Iran (49%), Indonesia (68%), Nigeria (49.4%), Sidama, Ethiopia (82.3%), southwest Ethiopia (42.9%), Abaya, Ethiopia (38.1%), Wolaita Sodo, Ethiopia (37.6%) (11–15, 23–27). However, HH food insecurity was higher than the prevalence in England (4.09%) and Wollo, Ethiopia (20.9%) (10, 28). In all cases, the discrepancies could emanate from the time factor, methodology, and differences in socioeconomic status or infrastructure. The coincidence of the data collection with a harvest season where food is more plentiful and costs are relatively low could be a cause for the variance. As a result, lesser HH food insecurity in this study could be linked to the harvest season of the year in which the survey was conducted in addition to study setting differences. Moreover, most of the other studies included rural HHs as well, while our study is conducted in an urban context. On the other hand, the prevalence was higher than some of the findings stated which could be the result of the study setting and socioeconomic disparities. Nevertheless, the prevalence of FINS and hunger in the area was unacceptably high as seen in the light of the SDGs indicator (4), which targets zero hunger and assures FINS for all nations before 2030. In addition, the FINS in the area hampers the progress toward the national target set in the Health Sector Transformation Plan (HSTP) II (39) of the country to tackle malnutrition and prevention and control of communicable and noncommunicable diseases as well.
HH food insecurity was found to be associated with the occupation of a husband or male cohabitant partner. The odds of FINS were 2.68 times higher among HHs with husbands or male cohabitant partners being merchants than government employees. This could be since most merchants in the Ethiopian context are engaged in small-scale private businesses that may not sufficiently cover the monthly family expense for food and allied basic needs. Studies revealed that HH food insecurity in different parts of the world is associated with lower income, the head of the HH is engaged in low-level jobs such as daily laborers, lower monthly expenditure for food, and overall economic status (14, 25, 33–35).
HH food insecurity was also determined by the educational status of wives or female cohabitant partners in the HH. Moreover, the odds of FINS were approximately three times higher among HHs with uneducated wives or female cohabitant partners compared with those with formal education. This finding goes in line with the findings from other similar studies stating that the educational status of women handling the food in the household (11) and the head of the HH (28, 30, 31, 35) determines FINS. It could be due to lower educational status also affecting monthly earnings and awareness level of the importance of expenditure of increased share of the total income for food to improve health and wellbeing of the family members among others, and thereby increased productivity and income in return. It may also be related to the lower awareness level leading to lower family planning service utilization, thereby leading to larger family sizes and consequently becoming food insecure.
This study is not without limitations. There could be a possibility of recall bias since HFIAS relies on the recall of events that occurred within the last 4 weeks. Because the study period coincided with the harvest season, HH food insecurity in the setting may have been minimally underestimated, even though seasons may not affect urban FINS like that of the local rural farming communities. Aside from that, the study’s potential weakness is concerned with HH income, which is estimated only using an oral report of respondents than a wealth index.
Household (HH) food insecurity and hunger in the study area were unacceptably higher and hamper achieving the global and national targets for food security, nutrition, and health. The occupation of the husband or male cohabitant partner and the educational status of the wife or female cohabitant partner in the HH determined household food insecurity. Despite the progress in improving the food security status of the country so far, intensified efforts are further needed to accelerate the decline in the prevalence of food insecurity and hunger in the area. Therefore, interventions need to target self-employed merchants in small businesses and women who are uneducated.
The original contributions presented in the study are included in the article/supplementary material, further inquiries can be directed to the corresponding author.
The studies involving human participants were reviewed and approved by the Institutional Review Board of Debre Berhan University. Written informed consent for participation was not required for this study in accordance with the national legislation and the institutional requirements.
TD contributed to the conception and design and data collection of the study, wrote the sections of the manuscript, conducted the research, and had primary responsibility for the final content. TD and GG supervised, organized the database, and performed the statistical analysis. GG wrote the first draft of the manuscript. All authors contributed to manuscript revision, read, and approved the submitted version.
Debre Berhan University sponsored the fieldwork of this research. The supporting organization had no role in the study design; collection, analysis, and interpretation of data; writing of the report; and no restrictions regarding publication.
We are thankful to Debre Berhan University, College of Health Sciences, for funding the fieldwork of this research and providing ethical clearance.
The authors declare that the research was conducted in the absence of any commercial or financial relationships that could be construed as a potential conflict of interest.
All claims expressed in this article are solely those of the authors and do not necessarily represent those of their affiliated organizations, or those of the publisher, the editors and the reviewers. Any product that may be evaluated in this article, or claim that may be made by its manufacturer, is not guaranteed or endorsed by the publisher.
AOR, adjusted odds ratio; CI, confidence interval; COR, crude odds ratio; EDHS, Ethiopian Demographic and Health Survey Reports; FANTA, Food and Nutrition Technical Assistance; FAO, Food and Agriculture Organization; FINS, food insecurity; FS, food secure; HFIAS, Household Food Insecurity Access Scale; HHs, Household(s); HFIAP, Household Food Insecurity Prevalence; HHS, Household Hunger Scale; HSTP, Health Sector Transformation Plan; IRB, Ethical Review Board; SDG, Sustainable Development Goal.
1. FAO, IFAD, UNICEF, WFP, WHO. The state of food security and nutrition in the world 2022. Repurposing food and agricultural policies to make healthy diets more affordable. Rome: FAO (2022). Available at: https://www.fao.org/documents/card/en/c/cc0639en
2. World Health Organization. Health and the millennium development goals. Arch Dis Child. (2015) 100:1181–3. doi: 10.1136/archdischild-2015-309460
3. United Nations. The future we want: outcome document of the United Nations conference on sustainable development. United Nations: Department of Economic and Social Affairs, (2012).
4. United Nations. The 2030 agenda for sustainable development. Arsen Res Glob Sustain – Proc 6th Int Congr Arsen Environ AS 2016, Stockholm, Sweden. (2016) 12–14.
6. FAO. The right to food: Voluntary Guidelines to support the progressive realization of the right to adequate food in the context of national food security. Adopted by the 127th Session of the FAO Council. Rome, (2005). Available at: extension://efaidnbmnnnibpcajpcglclefindmkaj/https://www.fao.org/3/y7937e/y7937e.pdf
8. Food and Agriculture Organization of the United Nations. Food security and nutrition in the world security, improved nutrition and affordable healthy diets for all. Rome: FAO (2021).
9. Simsek, H, Meseri, R, Sahin, S, and Ucku, R. Prevalence of food insecurity and malnutrition, factors related to malnutrition in the elderly: a community-based, cross-sectional study from Turkey. Eur Geriatr Med. (2013) 4:226–30. doi: 10.1016/j.eurger.2013.06.001
10. Smith, D, Thompson, C, Harland, K, Parker, S, and Shelton, N. Identifying populations and areas at greatest risk of household food insecurity in England. Appl Geogr. (2017) 91:21–31. doi: 10.1016/j.apgeog.2017.12.022
11. Chinnakali, P, Upadhyay, RP, Shokeen, D, Singh, K, Kaur, M, Singh, AK, et al. Prevalence of household-level food insecurity and its determinants in an urban resettlement colony in North India. J Health Popul Nutr. (2014) 32:227–36.
12. Behzadifar, M, Behzadifar, M, Abdi, S, Malekzadeh, R, Arab Salmani, M, Ghoreishinia, G, et al. Prevalence of food insecurity in Iran: Asystematic review and meta analysis. Arch Iran Med. (2016) 19:288–94.
13. Mahmudiono, T, Nindya, TS, Andrias, DR, Megatsari, H, and Rosenkranz, RR. Household food insecurity as a predictor of stunted children and overweight/obese mothers (SCOWT) in urban Indonesia. Nutrients. (2018) 10:535. doi: 10.3390/nu10050535
14. Adepoju, AO, and Adejare, KA. Food insecurity status of rural households during the post-planting season in Nigeria. J Agric Sustain. (2013) 4:16–35.
15. Otekunrin, OA, Otekunrin, OA, Sawicka, B, and Pszczółkowski, P. Assessing food insecurity and its drivers among smallholder farming households in rural Oyo state, Nigeria: the hfias approach. Agric. (2021) 11:1189. doi: 10.3390/agriculture11121189
16. Otekunrin, OA. Investigating food insecurity, health and environment-related factors, and agricultural commercialization in southwestern Nigeria: evidence from smallholder farming households. Environ Sci Pollut Res. (2022) 29:51469–88. doi: 10.1007/s11356-022-19544-w
17. Drammeh, W, Hamid, NA, and Rohana, AJ. Determinants of household food insecurity and its association with child malnutrition in sub-Saharan Africa: a review of the literature. Curr Res Nutr Food Sci. (2019) 7:610–23. doi: 10.12944/CRNFSJ.7.3.02
18. Endalew, B., Muche, M., and Tadesse, S. Assessment of food security situation in Ethiopia: a review. Asian J Agric Res (2015);9:55–68. doi: 10.3923/ajar.2015.55.68
19. Central Statistical Authority/Ethiopia and ORC Macro. Ethiopia demographic and health survey 2000. Addis Ababa, Ethiopia: Central Statistical Authority/Ethiopia and ORC Macro (2001).
20. Central Statistical Agency/Ethiopia and ICF International. Ethiopia demographic and health survey 2011. Addis Ababa, Ethiopia: Central Statistical Agency and ICF International (2001).
21. Centeral Statistics Authority (CSA). Ethiopia Demograhic and health survey 2016. Addis Ababa: CSA and ICF (2017).
22. Ethiopian Public Health Institute. Ethiopia mini demographic and health survey 2019. Addis Ababa: EPHI and ICF (2019).
23. Negesse, A, Jara, D, Temesgen, H, Dessie, G, Getaneh, T, Mulugeta, H, et al. The impact of being of the female gender for household head on the prevalence of food insecurity in Ethiopia: a systematic-review and meta-analysis. Public Health Rev. (2020) 41:1–14. doi: 10.1186/s40985-020-00131-8
24. Shone, M, Demissie, T, Yohannes, B, and Yohannis, M. Household food insecurity and associated factors in west Abaya district, southern Ethiopia, 2015. Agric Food Secur. (2017) 6:1–9. doi: 10.1186/s40066-016-0080-6
25. Tadesse Tantu, A, Demissie Gamebo, T, Kuma Sheno, B, and Yohannis, KM. Household food insecurity and associated factors among households in Wolaita Sodo town, 2015. Agric Food Secur. (2017) 6:1–8. doi: 10.1186/s40066-017-0098-4
26. Regassa, N., and Stoecker, B.J. Household food insecurity and hunger among households in Sidama district, southern Ethiopia. Public Health Nutr (2012);15:1276–1283. doi: 10.1017/S1368980011003119
27. Muche, M, Endalew, B, and Koricho, T. Determinants of household food security among Southwest Ethiopia rural households. Food Sci Technol. (2014) 2:93–100. doi: 10.13189/fst.2014.020701
28. Agidew, A A., and Singh, K. N. Determinants of food insecurity in the rural farm households in south Wollo zone of Ethiopia: the case of the Teleyayen sub- watershed. Agric Food Econ (2018);6::10. doi: 10.1186/s40100-018-0106-4
29. Zakari, S., Liu, Y., and Song, B. Factors influencing household food security in West Africa: the case of southern Niger. Sustain (2014);6:1191–1202. doi: 10.3390/su6031191
30. Jung, NM, de Bairros, FS, Pattussi, MP, Pauli, S, and Neutzling, MB. Gender differences in the prevalence of household food insecurity: a systematic review and meta-analysis. Public Health Nutr. (2017) 20:902–16. doi: 10.1017/S1368980016002925
31. Habyarimana, BJ. Determinants of household food insecurity in developing countries evidences from a Probit model for the case of rural households in Rwanda. Sustain Agric Res. (2015) 4:78. doi: 10.5539/sar.v4n2p78
32. Abdullah,, Zhou, D, Shah, T, Ali, S, Ahmad, W, Din, IU, et al. Factors affecting household food security in rural northern hinterland of Pakistan. J Saudi Soc Agric Sci. (2019) 18:201–10. doi: 10.1016/j.jssas.2017.05.003
33. Magaña-Lemus, D, Ishdorj, A, Rosson, CP, and Lara-Álvarez, J. Determinants of household food insecurity in Mexico. Agric Food Econ. (2016) 4:10. doi: 10.1186/s40100-016-0054-9
34. Abafita, J, and Kim, KR. Determinants of household food security in rural Ethiopia: an empirical analysis. J Rural Dev. (2014) 37:1–29. doi: 10.22004/ag.econ.196613
35. Kakota, T, Nyariki, D, Mkwambisi, D, and Kogi-Makau, W. Determinants of household vulnerability to food insecurity: a case study of semi-arid districts in Malawi. J Int Dev. (2015) 27:73–84. doi: 10.1002/jid.2958
36. Central Statistics Agency. Statistical report on the 2013 national labour force survey. Addis Ababa: The Federal Democratic Republic of Ethiopia, Central Statistical Agency (2014).
37. Coates, J, Swindale, A, and Bilinsky, P. Household food insecurity access scale (HFIAS) for measurement of food access: Indicator guide. Washington, DC: Food and Nutrition Technical Assistance Project (2007).
38. Ballard, T, Deitchler, M, and Ballard, T. Household hunger scale: Indicator definition and measurement guide household hunger scale: Indicator definition and measurement guide. Washington, D.C.: FANTA-III (2011).
Keywords: food insecurity status, Household Food Insecurity Access Scale, hunger status category, nutrition, Debre Berhan, Central Ethiopia
Citation: Demie TG and Gessese GT (2023) Household food insecurity and hunger status in Debre Berhan town, Central Ethiopia: Community-based cross-sectional study. Front. Nutr. 10:1035591. doi: 10.3389/fnut.2023.1035591
Edited by:
Clinton Beckford, University of Windsor, CanadaReviewed by:
Emyr Reisha Isaura, Airlangga University, IndonesiaCopyright © 2023 Demie and Gessese. This is an open-access article distributed under the terms of the Creative Commons Attribution License (CC BY). The use, distribution or reproduction in other forums is permitted, provided the original author(s) and the copyright owner(s) are credited and that the original publication in this journal is cited, in accordance with accepted academic practice. No use, distribution or reproduction is permitted which does not comply with these terms.
*Correspondence: Takele Gezahegn Demie, dGFrZWxlLmdlejQ0QGdtYWlsLmNvbQ==
†ORCID: Takele Gezahegn Demie https://orcid.org/0000-0002-6296-7706
Disclaimer: All claims expressed in this article are solely those of the authors and do not necessarily represent those of their affiliated organizations, or those of the publisher, the editors and the reviewers. Any product that may be evaluated in this article or claim that may be made by its manufacturer is not guaranteed or endorsed by the publisher.
Research integrity at Frontiers
Learn more about the work of our research integrity team to safeguard the quality of each article we publish.