
94% of researchers rate our articles as excellent or good
Learn more about the work of our research integrity team to safeguard the quality of each article we publish.
Find out more
SYSTEMATIC REVIEW article
Front. Nutr., 01 December 2022
Sec. Nutrition and Metabolism
Volume 9 - 2022 | https://doi.org/10.3389/fnut.2022.996645
 Yu Wen1,2†
 Tiancong Liu3†Changcheng Ma4†Jianwei Fang5†Zhiying Zhao1,2,5†Mengrui Luo1,2
 Yang Xia1,2,5
 Yuhong Zhao1,2,5*
 Chao Ji1,2,5*
Background: Although muscle strength has been reported to be associated with metabolic syndrome (MetS), the association is still controversial. Therefore, the purpose of this meta-analysis was to identify the association between handgrip strength (HGS) and MetS.
Methods: Original research studies involving HGS and MetS from database inception to 20 May 2022 were selected from PubMed, Web of Science, Embase, China National Knowledge Infrastructure, Wanfang databases, and Chinese Biomedical Document Service System. The odds ratios (ORs) with 95% confidence intervals (CIs) of MetS for HGS were calculated using a random-effects model. A dose–response analysis was performed. Subgroup analysis and meta-regression were also conducted.
Results: Thirty effect sizes (reported in 19 articles) with a total of 43,396 participants were included in this meta-analysis. All studies were considered to be of moderate-to-good quality. An inverse association between HGS (low vs. high) with MetS was shown (OR: 2.59, 95% CI: 2.06−3.25). Subgroup analyses demonstrated the pooled ORs of relative HGS (HGS/weight), relative HGS (HGS/BMI), and absolute HGS were 2.97 (95% CI: 2.37−3.71), 2.47 (95% CI: 1.08−5.63), and 1.34 (95% CI: 1.06−1.68), respectively. Dose–response analysis revealed a significant linear dose–response relationship between relative HGS (HGS/weight) and MetS in observational studies (0.1 HGS/weight: OR, 0.68; 95% CI: 0.62−0.75). Univariate meta-regression analysis indicated that country status, measuring tools of HGS, components of MetS, and diagnosed criteria of MetS explained 16.7%, 26.2%, 30.1%, and 42.3% of the tau-squared in the meta-regression, respectively.
Conclusion: The results of the current meta-analysis indicated that lower HGS is associated with a higher risk of MetS. A linear dose–response association between lower relative HGS (HGS/weight) and increased prevalence of MetS was found. Accordingly, a lower HGS is a significant predictor of MetS.
Systematic review registration: [https://www.crd.york.ac.uk/PROSPERO/], identifier [CRD42021276730].
There are a number of definitions of metabolic syndrome (MetS) according to different organizations. National Cholesterol Education Program Adult Treatment Panel III (NCEP ATP III) defines MetS as having three or more of the following five metabolic risk factors: elevated waist circumference (WC), triglycerides (TG), reduced high-density lipoprotein cholesterol (HDL-C), elevated blood pressure (BP), and elevated fasting blood glucose (FBG) (1). American Heart Association (AHA)/the National Heart, Lung, and Blood Institute (NHLBI) statement maintains the NCEP ATP III criteria except for minor modifications in 2005 (2). According to the International Diabetes Federation (IDF) criteria (3), people with MetS are defined by having central obesity along with two or more of the following abnormalities: (1) elevated TG; (2) reduced HDL cholesterol; (3) elevated BP; (4) elevated fasting plasma glucose (FPG). MetS has become a major health challenge worldwide with the prevalence increasing in concert with obesity and sedentary lifestyles, thus, influencing 10%−40% of the total population (4). MetS is linked to type 2 diabetes, cardiovascular disease, kidney disease, cancer, and mortality (5–7). Considering the rising prevalence of MetS and healthy outcomes, MetS is a major health issue.
High muscle strength is a protective factor for cardiovascular and metabolic health, and decreased muscle strength may increase the risk of chronic diseases in the elderly (8, 9). Muscle strength can be easily measured by handgrip strength (HGS). HGS, a simple, convenient, and economical indicator, can reflect skeletal muscle strength effectively and reliably (10). In addition, HGS can represent skeletal muscle strength in community-dwelling older people (11). Recent epidemiologic studies have been conducted to determine the association between HGS and MetS. However, the results were inconsistent between different kinds of HGS (absolute and relative HGS) and MetS (12, 13). Several studies (12, 14, 15) indicated that there is an inverse association between relative HGS [HGS/body weight or HGS/body mass index (BMI)] and MetS. However, other studies (16, 17) have reported no significant association between absolute HGS and MetS.
The potential mechanisms were as follows: Skeletal muscles, major sites of glucose uptake and deposition (18), can secrete multiple myokines (such as interleukin-15, myostatin, and irisin) (19). Of these myokines, interleukin-15 is involved in the regulation of fat mass (20). Myostatin can inhibit body fat accumulation and improve insulin sensitivity (21–23). A release of irisin from skeletal muscle negatively regulates glucose homeostasis and obesity (24). Insulin resistance (IR) is a reduced biological response of peripheral tissues to insulin (25, 26). IR plays a major role in MetS (27). Obesity was significantly associated with the increased risk of MetS. IR and obesity are important factors of MetS, muscle strength is related to MetS.
For the inconsistent results and the potential mechanisms, we conducted the first meta-analysis of HGS and MetS for the following purposes: (1) to assess the association between HGS and MetS; (2) to evaluate a dose–response pattern of HGS and MetS; and (3) to provide reliable evidence-based medicine for the prevention and treatment of MetS in the population.
This meta-analysis was reported according to the Preferred Reporting Items for Systematic Review and Meta-Analyses statement (28).
This study was registered at https://www.crd.york.ac.uk/PROSPERO/ as CRD42021276730.
The inclusion criteria were as follows: (1) The definition of MetS is a cluster of metabolic abnormalities, including abdominal obesity, hypertension, elevated FPG, elevated TG, and low HDL-C. MetS was diagnosed according to NCEP ATP III criteria, IDF classification, and AHA criteria or defined by other criteria. (2) The study was published in English or Chinese. (3) The authors analyzed the association between HGS and MetS. (4) an observational study. (5) Evaluation of grip strength was measured by a handheld dynamometer. (6) Participants were ≥18 years of age.
The exclusion criteria were as follows: (1) reports with only abstracts or unpublished results; (2) the types of papers were reviews, secondary analyses, letters, and conferences; (3) duplicated papers from different search sources; (4) duplicated study population (If more than one publication was published on the same population, study with the largest population was selected); (5) the author did not investigate the association between HGS and MetS; (6) unavailable full text; (7) unavailable data [odds ratios (ORs), hazard ratios (HRs) or prevalence rate ratios (PRRs) were not mentioned in the text]; (8) studies reported the separate MetS components (e.g., elevated WC, elevated TG, low HDL-C, elevated BP, and elevated FBG), instead of MetS; and (9) did not report HGS at baseline.
Original research studies from database inception to 20 May 2022 were selected from PubMed, Web of Science, Embase, Chinese National Knowledge Information (CNKI), Wanfang databases, and Chinese Biomedical Document Service System (SinoMed). A PubMed search for studies involving HGS and MetS was conducted without restrictions by combining synonymous or related search terms for HGS and MetS. The keywords used in the PubMed search were converted to search tags for Web of Science and Embase. The detailed search strategy is shown in Supplementary Table 1.
Two independent researchers (YW and ML) working in pairs screened the titles and abstracts of the initially identified studies to determine if the studies satisfied the selection criteria. Any disagreements were discussed and agreed upon through consensus. The retrieved studies were re-assessed by two independent investigators to ensure that the studies satisfied the inclusion criteria.
Two independent researchers (YW and ML) performed data extraction, relevant data were extracted from each included study using a standardized extraction form. The characteristics included author, year, country, study design, follow-up (years), sample size, age, gender, definition of MetS, HGS measuring tools, HGS measuring position, adjusted variables, and quality score. After extraction, we reviewed the data and compared it interactively. If inconsistent data were detected, we would solve discrepancies by researching and discussing the article. The extracted data results are shown in Table 1.
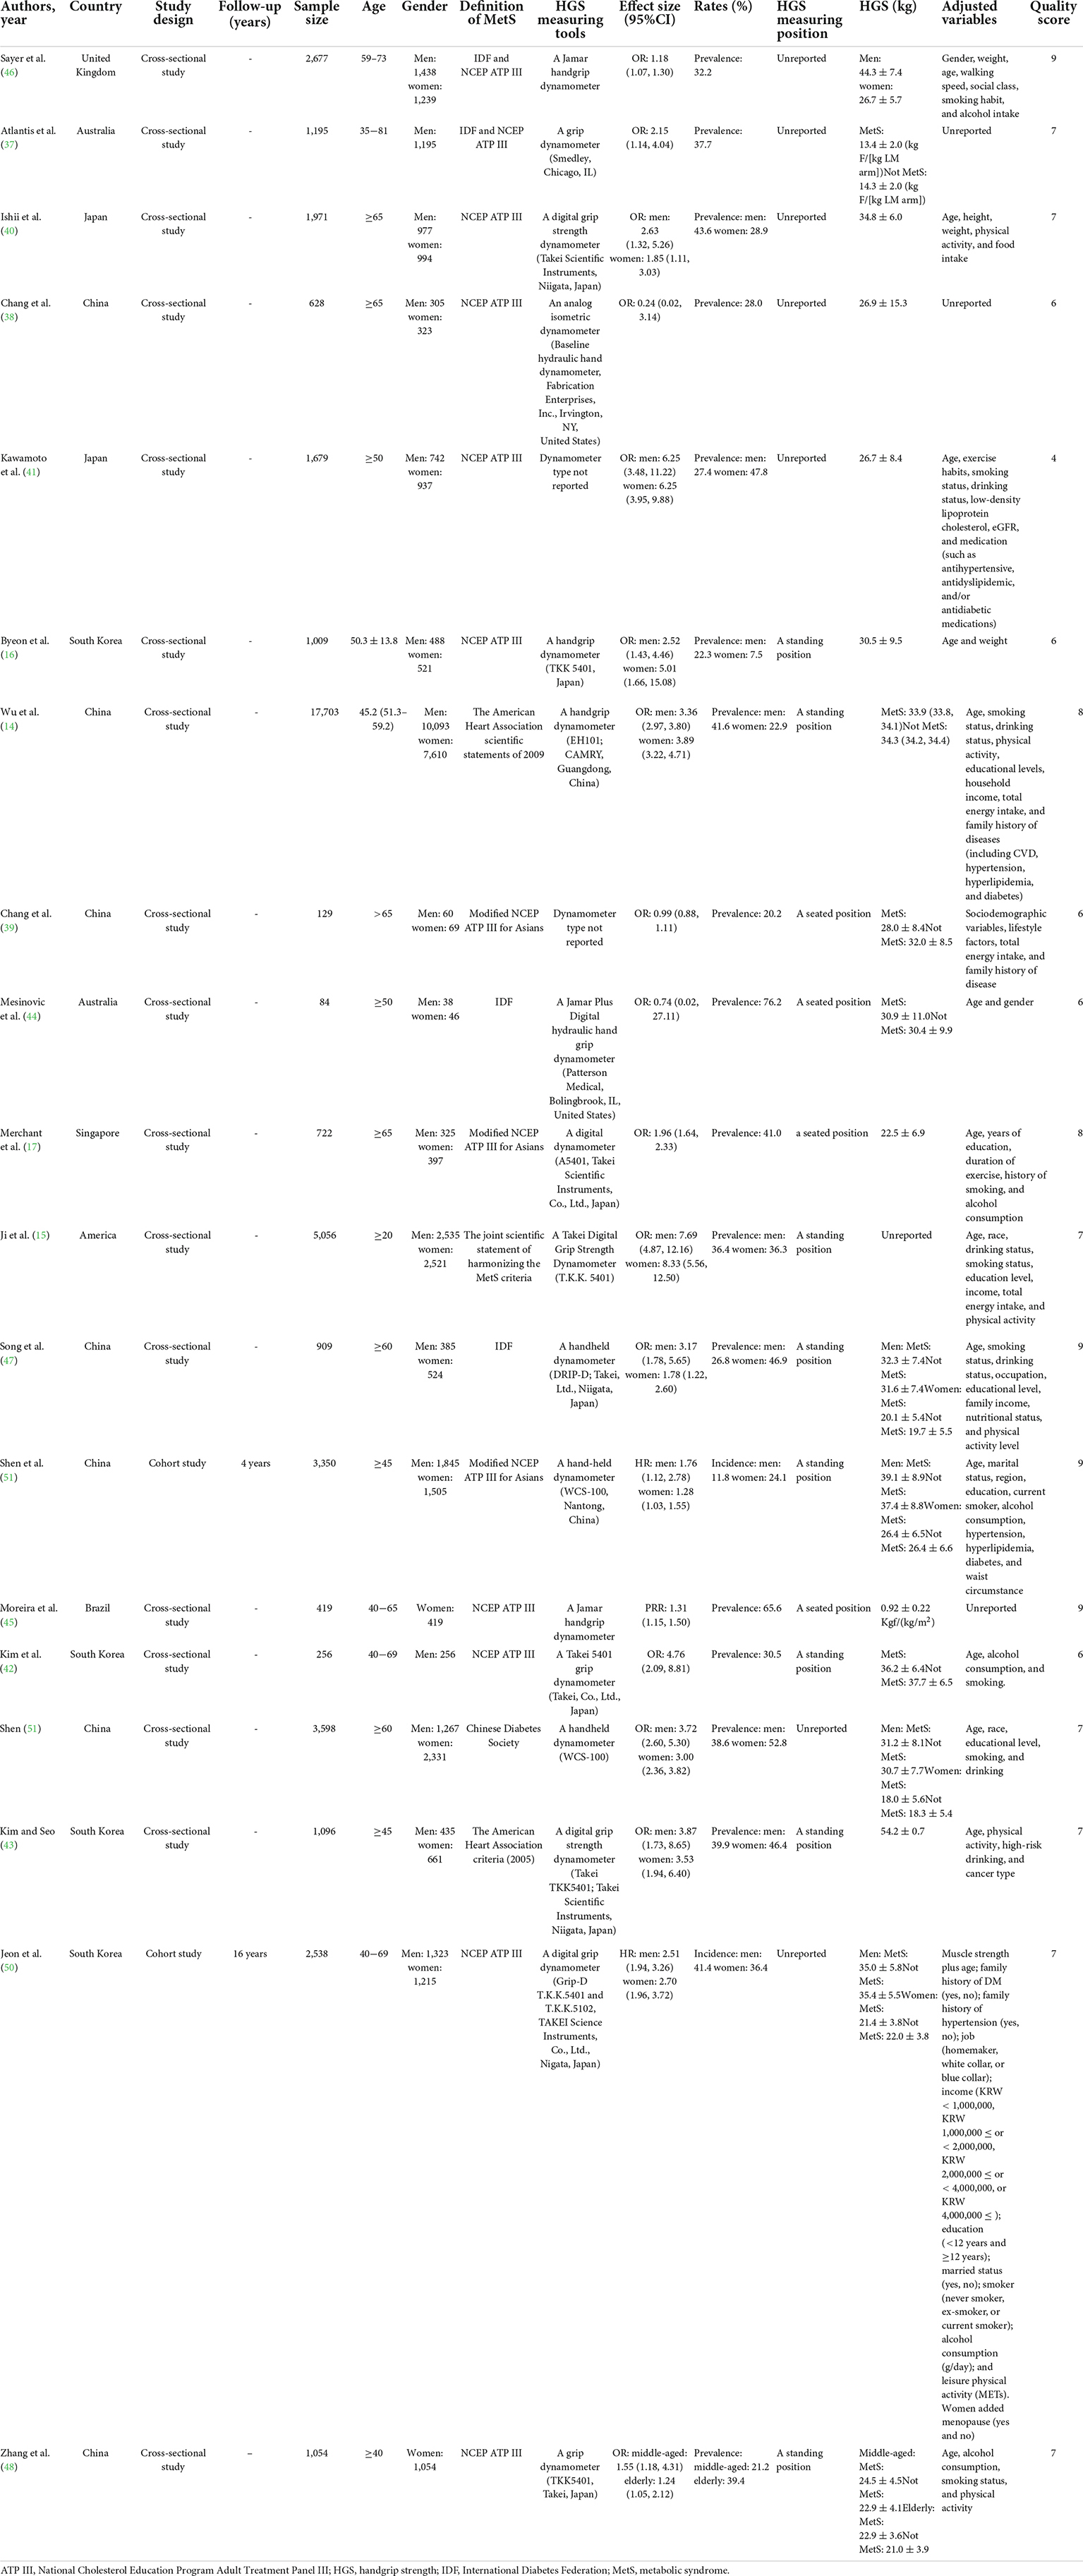
Table 1. Characteristics of observational studies evaluating the association between handgrip strength (HGS) and metabolic syndrome (MetS) in the meta-analysis.
Two researchers (YW and ML) independently assessed the quality of each study by the quality assessment tools. An 11-item checklist of the Agency for Healthcare Research and Quality (AHRQ) (29) was used to assess the quality of cross-sectional studies. An item was scored “0” if the item was answered “NO” or “UNCLEAR;” if the item was answered “YES,” then the item scored “1.” Article quality was assessed as follows: low quality = 0−3; moderate quality = 4−7; and high quality = 8−11. The Newcastle-Ottawa Scale (NOS) (30) was used to evaluate the quality of a cohort or case-control study. A total of 9 points from 3 domains were reported for each study [selection, comparability, and ascertainment of exposure(s) or outcome(s)]. No case-control study was identified for this review. Thus, the NOS was performed for cohort studies only.
In this meta-analysis, we considered that HRs were approximately equivalent to ORs when the prevalence of the outcome was low (31, 32). In addition, the prevalence rate ratio (PRR) was also assumed approximately equivalent to OR (33). The exponential transformation was used to convert β to OR. Therefore, we combined OR, HR, and PRR. Q-statistics and I2 statistics were calculated to evaluate heterogeneity in these studies. A P-value < 0.05 for Q-statistics and I2 > 50% were regarded to be significant heterogeneity. A random effect model was used to pool ORs for participants due to considerable heterogeneities among studies. Sensitivity analysis was performed to assess the influence of a single study on the overall combined results. Egger’s test was used to evaluate publication bias. To address publication bias, trim-and-fill adjusted analysis (34) was applied. We explored potential heterogeneity in estimates of the treatment effects using univariate meta-regression (35).
This study performed subgroup analyses by gender, country status (developing or developed country according to International Monetary Fund1), study type, age, publication year, the diagnosed criteria of MetS (NCEP ATP III classification, IDF classification, and AHA criteria), HGS-adjusted methods (absolute HGS; HGS/body weight; HGS/BMI), measuring tools of HGS, and components of MetS.
We used the method described by Greenland and Longnecker (36) to conduct a dose–response analysis. The assigned dose was the midpoint of the upper and lower boundaries of each HGS category. The distributions of cases and non-cases for at least three categories of exposure were also collected. A dose–response meta-analysis was performed. And the glst order was applied to carry out the model estimation and draw a linear dose–response association plot. All of the statistical analyses were performed using Stata software (version 11.2; Stata Corp., College Station, TX, United States).
Figure 1 indicates the literature search process. Our initial search identified 9,415 papers, 1,686 of which were duplicates, thus, yielding 7,729 articles. After screening, 7,577 articles were excluded because the articles did not meet the inclusion criteria. Of the 152 articles assessed for eligibility, 133 were excluded for the reason that the age of participants in 50 articles was <18 years of age, 1 article was a letter, full texts of 14 articles were unavailable, 32 articles were not in English or Chinese, 10 articles were conferences, 3 articles did not report HGS at baseline, 1 article was a secondary analysis, 17 articles were unavailable data, and 5 articles have duplicated study population. Finally, our meta-analysis included 19 articles.
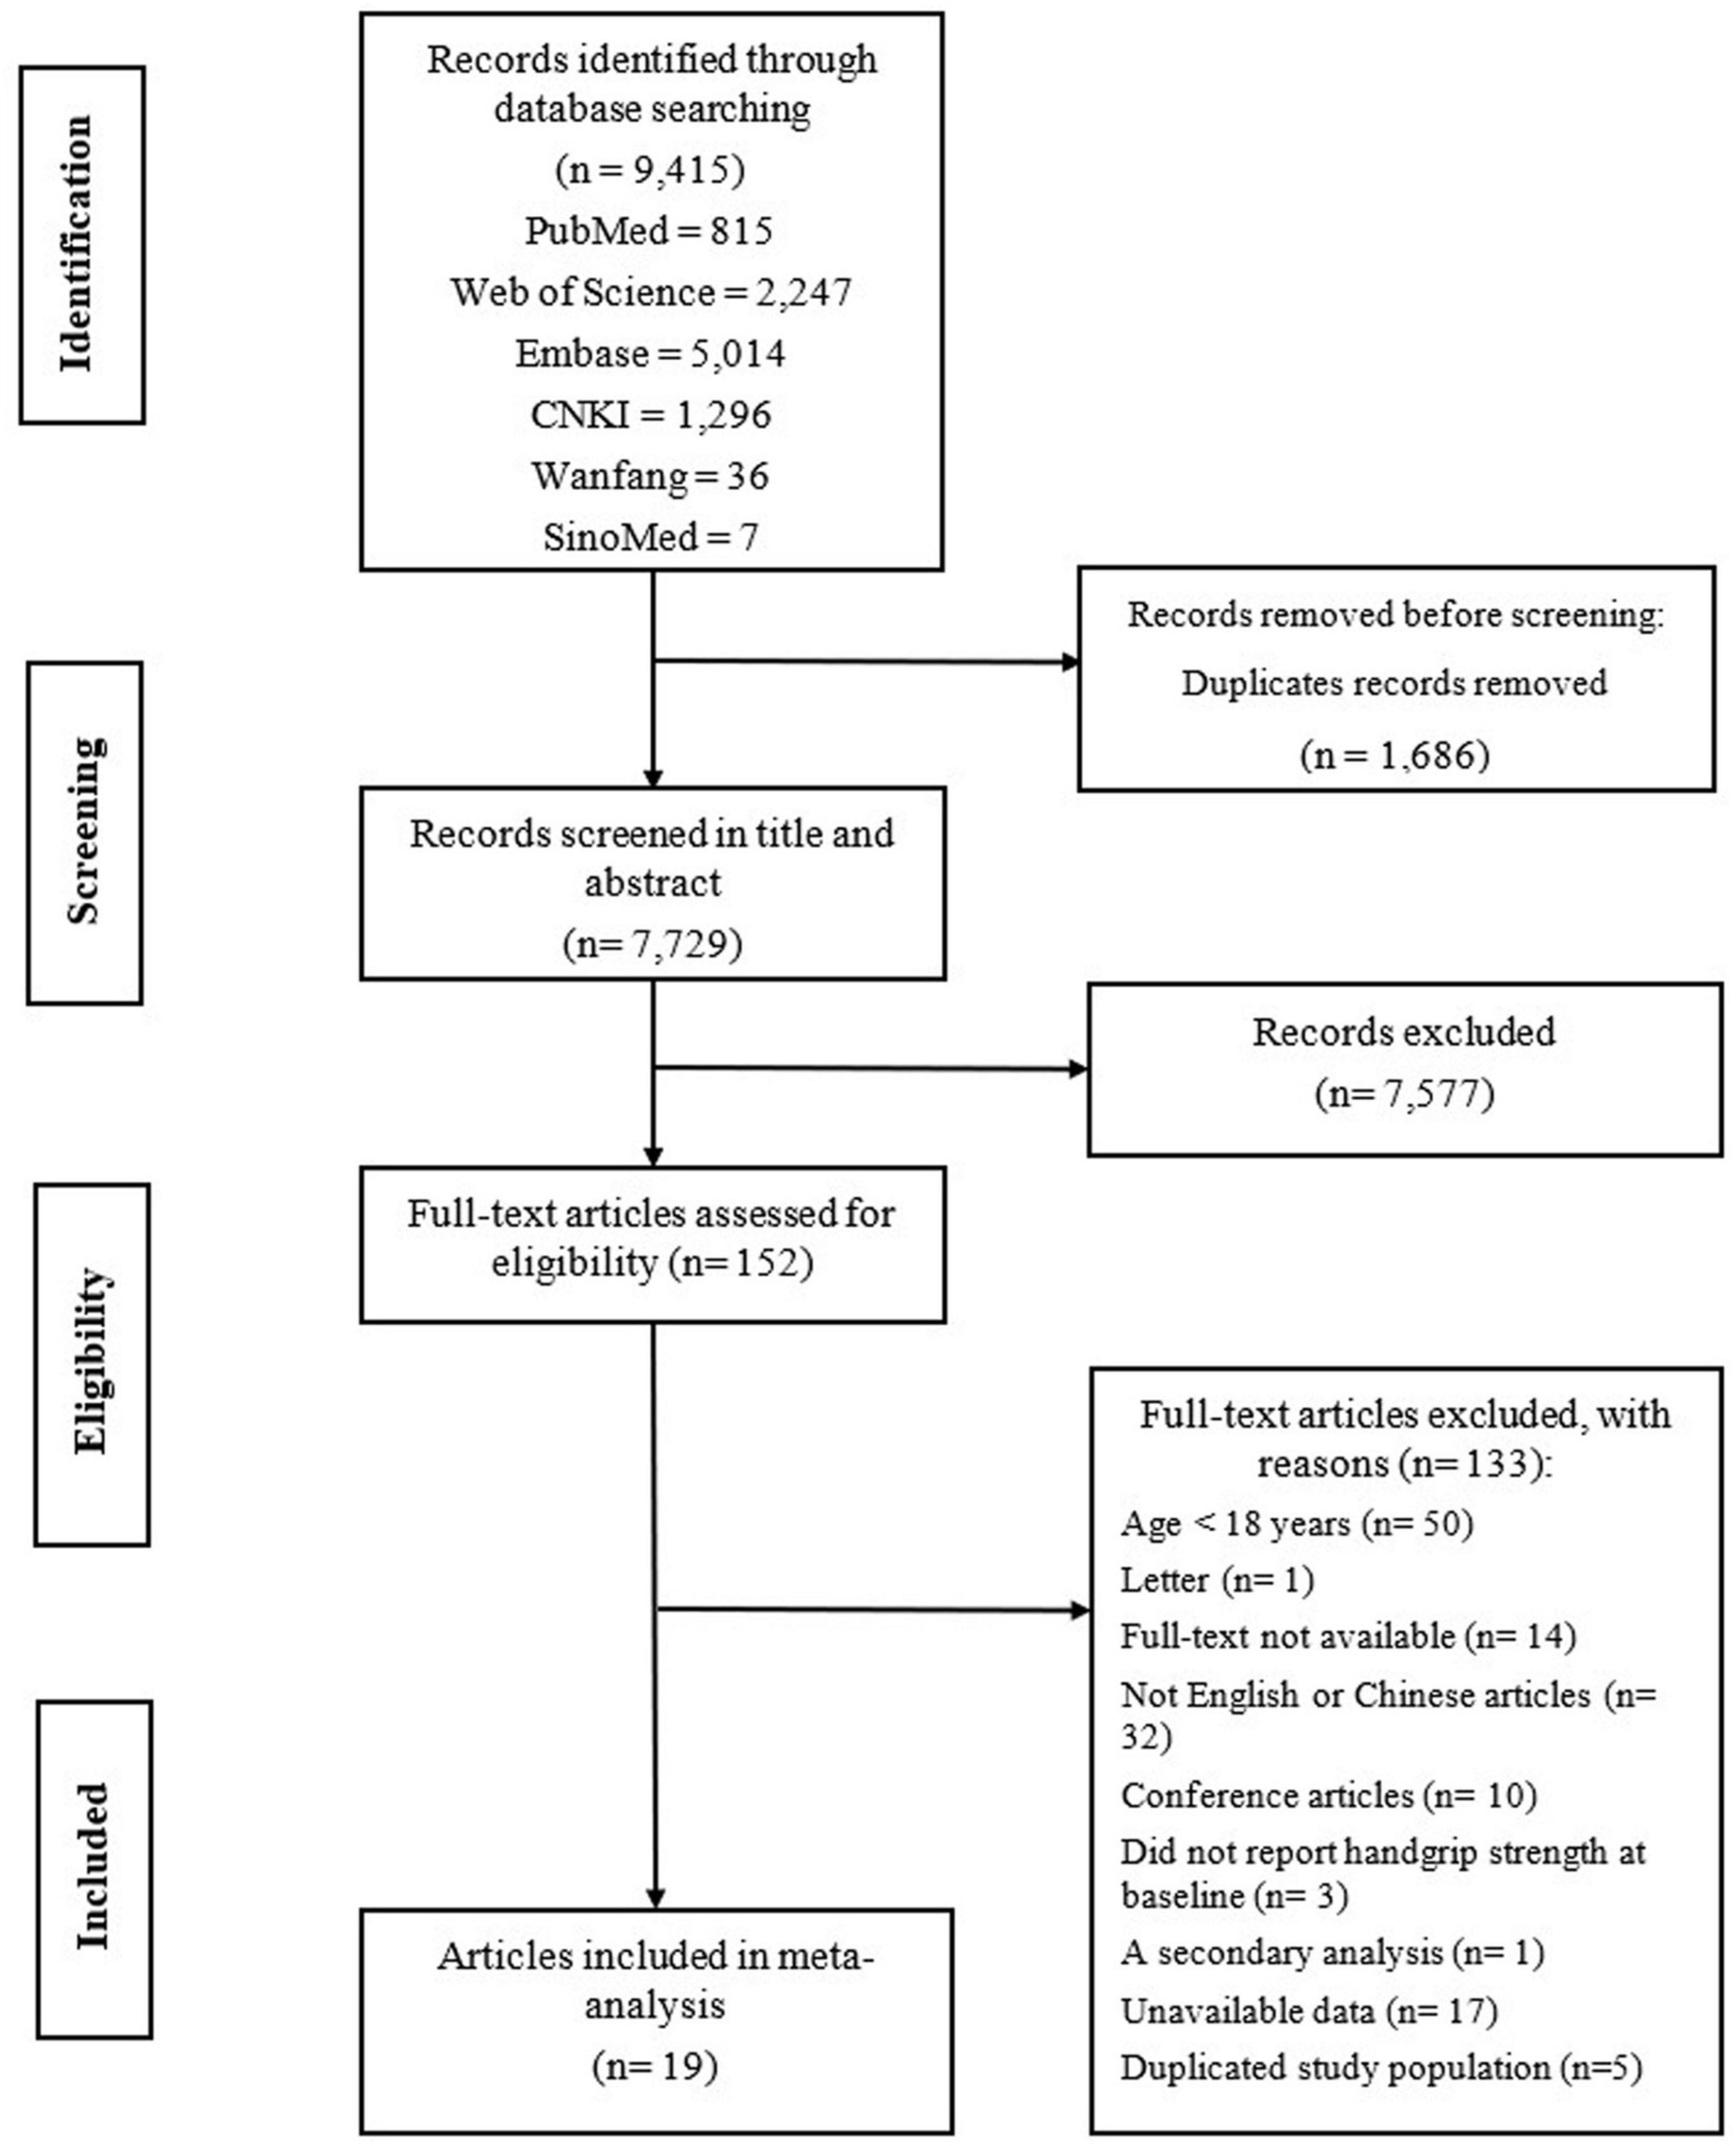
Figure 1. Flow chart of the literature search and selection process.
Table 1 shows the study characteristics. Of the 30 studies in 19 articles, 26 (12, 14, 15, 17, 37–50) were cross-sectional studies and 4 (50, 51) were cohort studies. A total of 24 studies in 14 articles (12, 14, 17, 38–43, 47–51) originated from Asia [7 studies in 4 articles (14, 42, 43, 50) from South Korea, 12 studies in 7 articles (12, 38, 39, 47–49, 51) from China, 4 studies in 2 articles (40, 41) from Japan, and 1 study (17) from Singapore], 2 studies in an article (15) from the United States, 2 studies (37, 44) from Australia, 1 study (46) from United Kingdom, and 1 study (45) from Brazil. The total sample size was 43,396 in the 30 studies (reported in 19 articles). The age of the study population was = 18 years.
Jamar [3 studies (44–46)], Takei [16 studies in 9 articles (14, 15, 17, 40, 42, 43, 47, 48, 50)], Smedley [1 study (37)], Camry [1 study (12)], WCS-100 [4 studies in 2 articles (49, 51)], and hydraulic hand dynamometer [1 study (38)] were used to measure HGS. There were 4 studies in 2 articles (39, 41) that did not specify the name of the handgrip dynamometer. HGS measurement positions included standing [13 studies in 8 articles (12, 14, 15, 42, 43, 47, 48, 51)] and seated positions [4 studies (17, 39, 44, 45)]. A total of 13 studies in 7 studies (37, 38, 40, 41, 46, 49, 50) did not introduce the measurement positions of HGS.
National Cholesterol Education Program Adult Treatment Panel III was the most commonly used criterion to evaluate HGS in the analyzed publications. As shown in Table 1, MetS was defined by the NCEP ATP III classification (n = 13) (14, 17, 37–42, 45, 46, 48, 50, 51), IDF classification (n = 2) (44, 47), AHA classification (n = 2) (12, 43), or other criteria (n = 2) (15, 49).
Results of the quality assessment of the included studies are shown in Table 1 and Supplementary Tables 2, 3. We used the total score of this assessment to evaluate articles of insufficient quality. No study was excluded based on the AHRQ and NOS, as all of them were considered to be of moderate-to-good quality.
Several studies analyzed the association between absolute HGS and MetS. In these studies, 4 studies demonstrated that absolute HGS was not significantly associated with MetS (38, 44, 48, 50). Another 4 studies found that lower absolute HGS had an increased likelihood of having MetS (37, 39, 40, 46). In one Chinese study, Qiu-Feng et al. (52) found that a positive association existed between absolute HGS and MetS in male residents, while the association was opposite in female residents.
A total of 12 studies investigated the association between relative HGS (HGS/weight) and MetS. 11 studies demonstrated that relative HGS (HGS/weight) was inversely associated with MetS (12, 15, 17, 41, 42, 47–52). In a total of 3,598 Chinese community residents over 60 years old, a significant negative correlation between HGS/weight and the risk of MetS, regardless of sex (49). However, no significant association was observed in the 628 community-dwelling elders (38).
5 studies assessed the association between relative HGS (HGS/BMI) and MetS. The results showed HGS/BMI were negatively associated with MetS (17, 43, 45, 47, 50).
Figure 2 demonstrated the pooled OR (low vs. high) of the association between HGS (absolute HGS, HGS/body weight, and HGS/BMI) and MetS was 2.59 (95% CI, 2.06−3.25) in the meta-analysis, with evidence of significant heterogeneity (I2 = 95.1%, P < 0.05). The results illustrated an inverse association of HGS with MetS in adults.
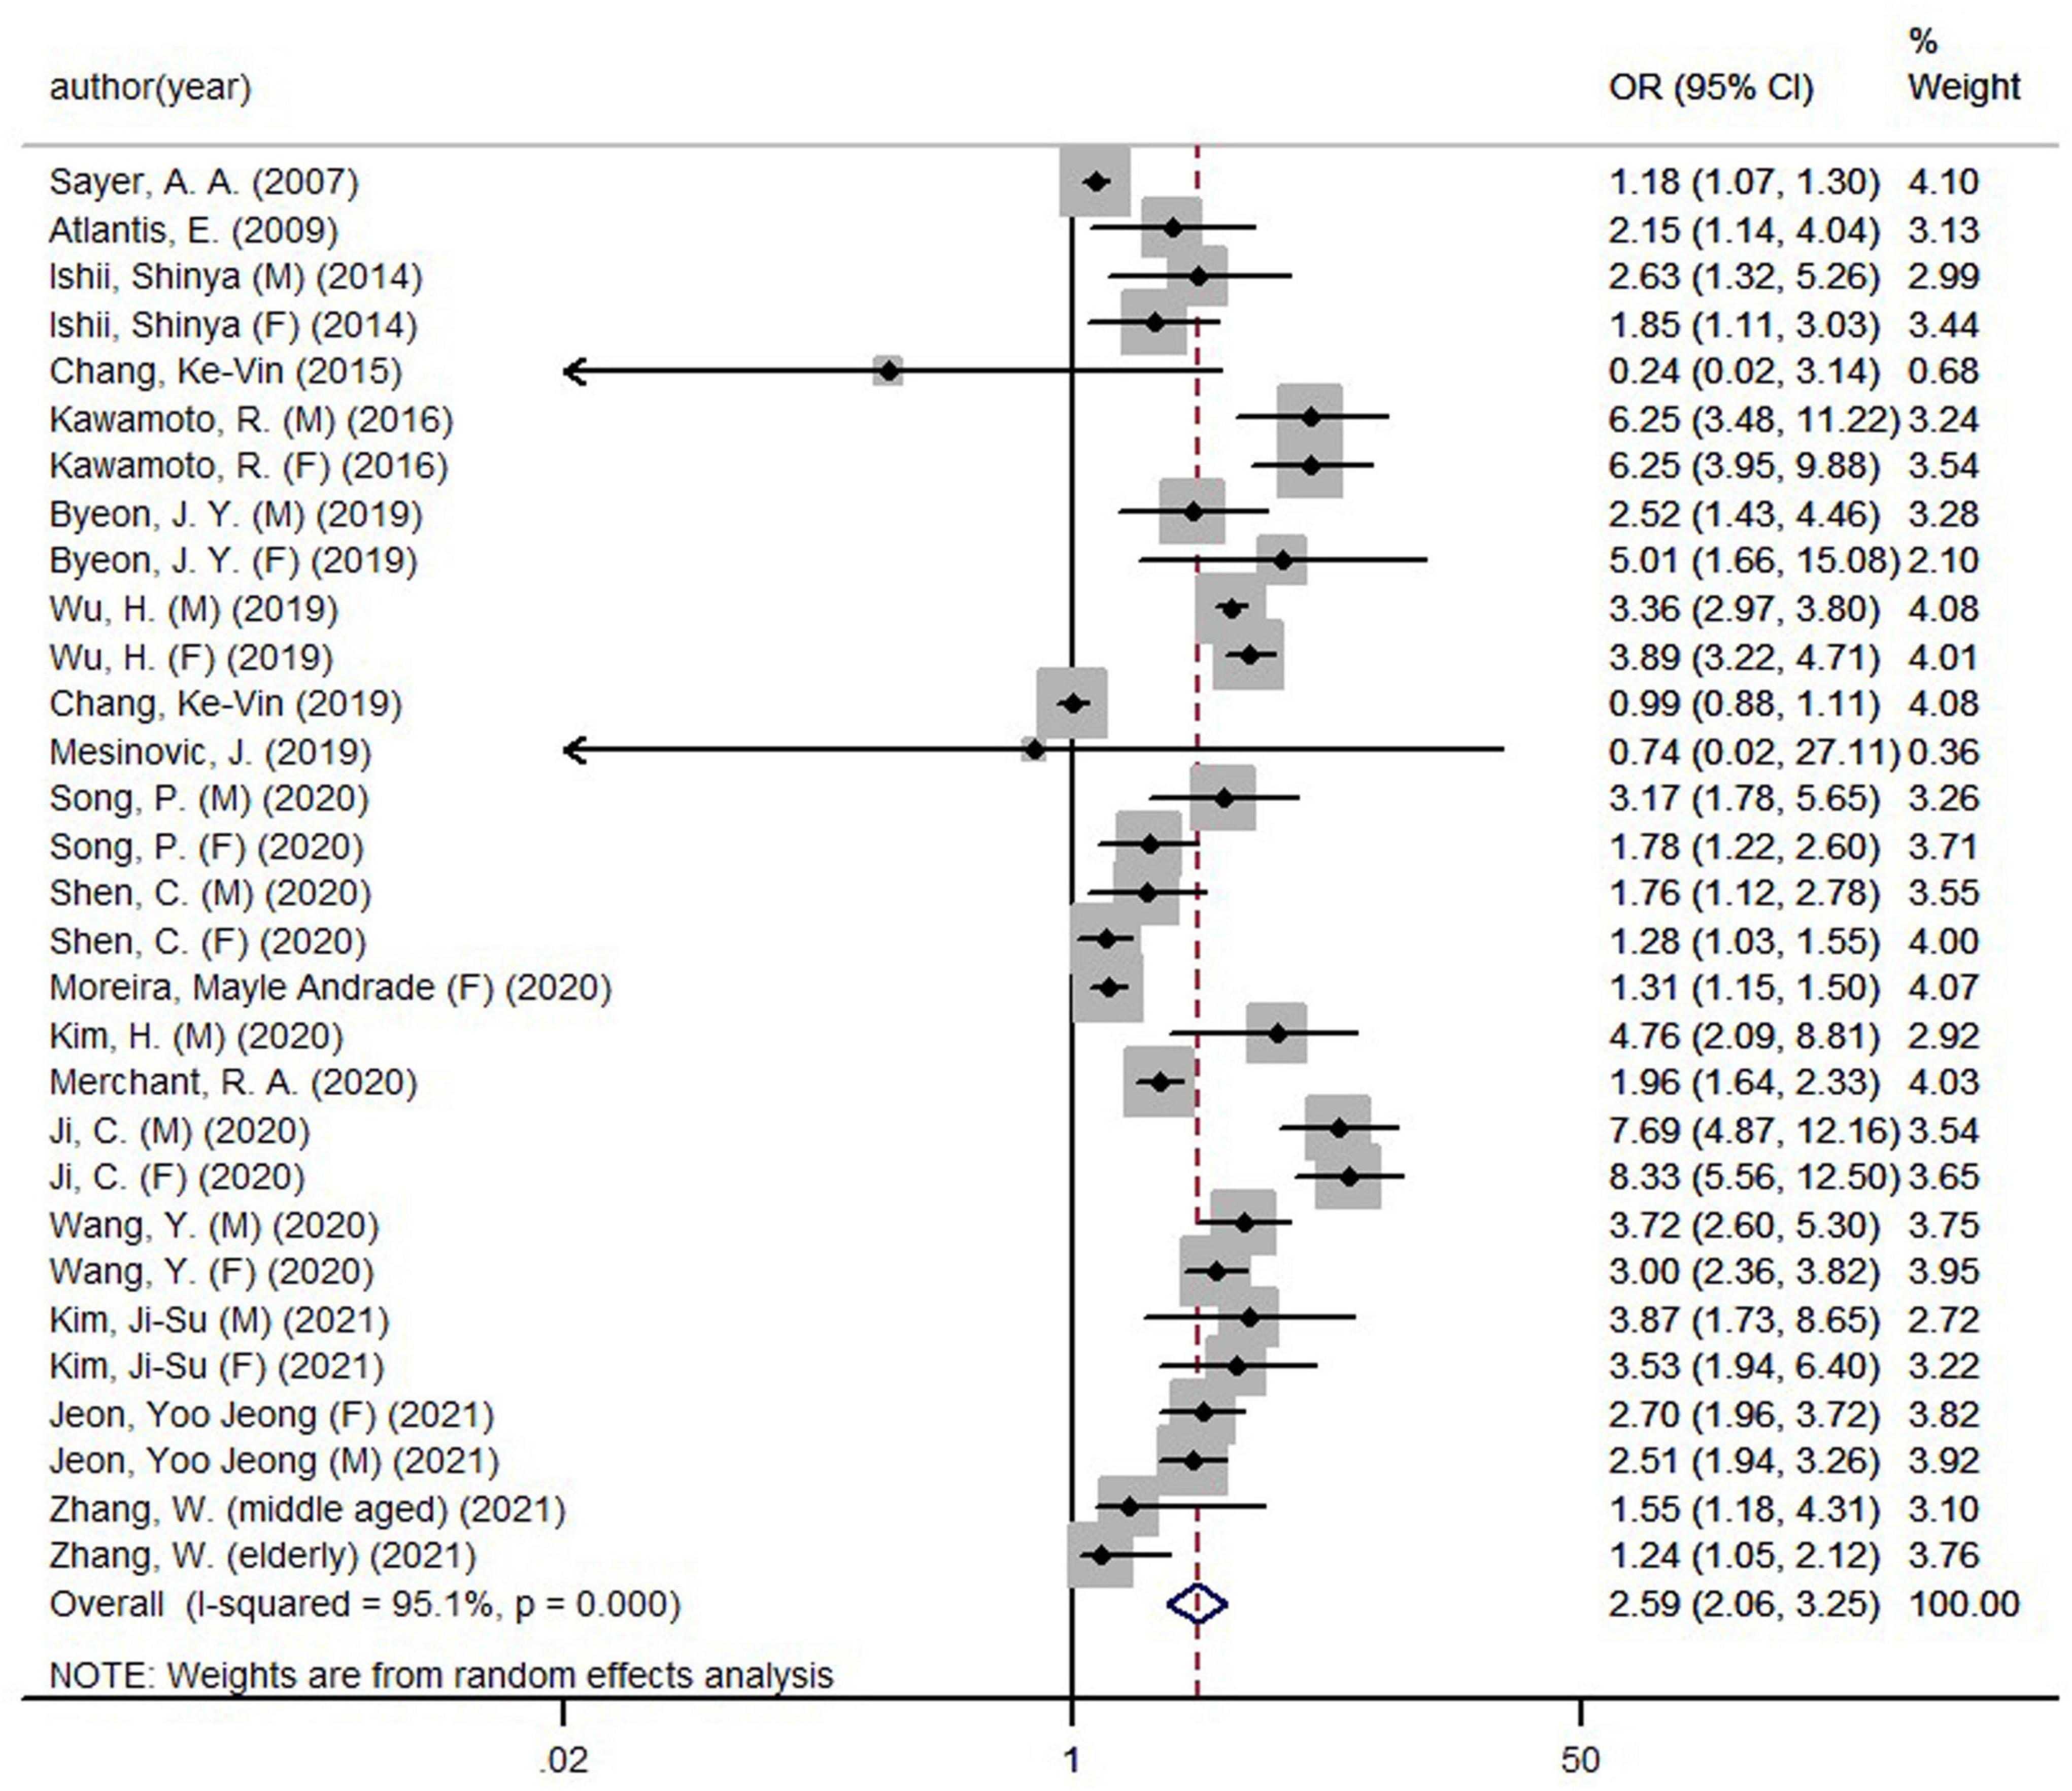
Figure 2. Forest plot of handgrip strength and metabolic syndrome.
In this meta-analysis, we performed a subgroup analysis according to gender, age, publication year, HGS-adjusted methods, country status, study type, MetS for each component, and defined criteria of MetS. Compared with participants with high HGS, the ORs (95% CIs) for MetS in participants with low HGS were 3.33 (2.69, 4.14) and 2.57 (1.82, 3.64) in men and women, respectively (Table 2). Compared with participants with high HGS, the ORs (95% CIs) for MetS in participants with low HGS were 2.03 (1.65−2.51), 3.51 (3.18−3.89), 2.20 (1.37−3.53), 8.04 (5.94, 10.89), and 3.21 (2.63, 3.92) according to the NCEP ATP III criteria, AHA criteria, IDF criteria, the joint scientific statement of harmonizing the MetS criteria, and Chinese Diabetes Society, respectively (Table 2). In addition, subgroup analysis by the HGS-adjusted methods suggested that the risks of MetS among adults were negatively associated with absolute HGS (OR, 1.34; 95% CI, 1.06−1.68), relative HGS (HGS/weight; OR, 2.97; 95% CI, 2.37−3.71), and relative HGS (HGS/BMI; OR, 2.47; 95% CI, 1.08−5.63; Table 2). In developed countries, HGS (low vs. high) was significantly and negatively associated with the risk of MetS (OR, 3.29; 95% CI, 2.32−4.68). Similarly, in developing countries, HGS (low vs. high) was significantly and negatively associated with the risk of MetS (OR, 1.75; 95% CI, 1.20−2.56; Table 2). Subgroup analysis based on study type showed a negative association between HGS (low vs. high) and MetS in cross-sectional studies (OR, 2.72; 95% CI, 2.10−3.52) and cohort studies (OR, 1.97; 95% CI, 1.31−2.95; Table 2). A subgroup analysis based on age indicated that there was an inverse association between HGS (low vs. high) and MetS in the middle-aged (OR, 1.32; 95% CI, 1.16−1.50) and elderly population (OR, 1.92; 95% CI, 1.26−2.92). According to the measuring tools of HGS, we divided all studies into four subgroups. The results of four subgroups, HGS (low vs. high) measured by Jamar (OR, 1.22; 95% CI, 1.13−1.32), Takei (OR, 2.88; 95% CI, 2.20−3.77), CAMRY (OR, 3.55; 95% CI, 3.09−4.08), and WCS-100 (OR, 2.23; 95% CI, 1.30−3.83), demonstrated that HGS (low vs. high) was inversely associated with MetS. Among the subgroup analysis of publication year, there was a negative association between HGS (low vs. high) and MetS in 5 years ago (OR, 2.44; 95% CI, 1.24−4.81) and in recent 5 years (OR, 2.60; 95% CI, 2.01−3.37). Among a subgroup based on the components of MetS, an inverse correlation was shown in the association of HGS (low vs. high) with elevated WC (OR, 4.35; 95% CI, 2.74−6.92), elevated TG (OR, 1.69; 95% CI, 1.38−2.05), HDL-C (OR, 1.55; 95% CI, 1.27−1.88), elevated BP (OR, 1.55; 95% CI, 1.30−1.85), and elevated FBG (OR, 1.55; 95% CI, 1.28−1.88).
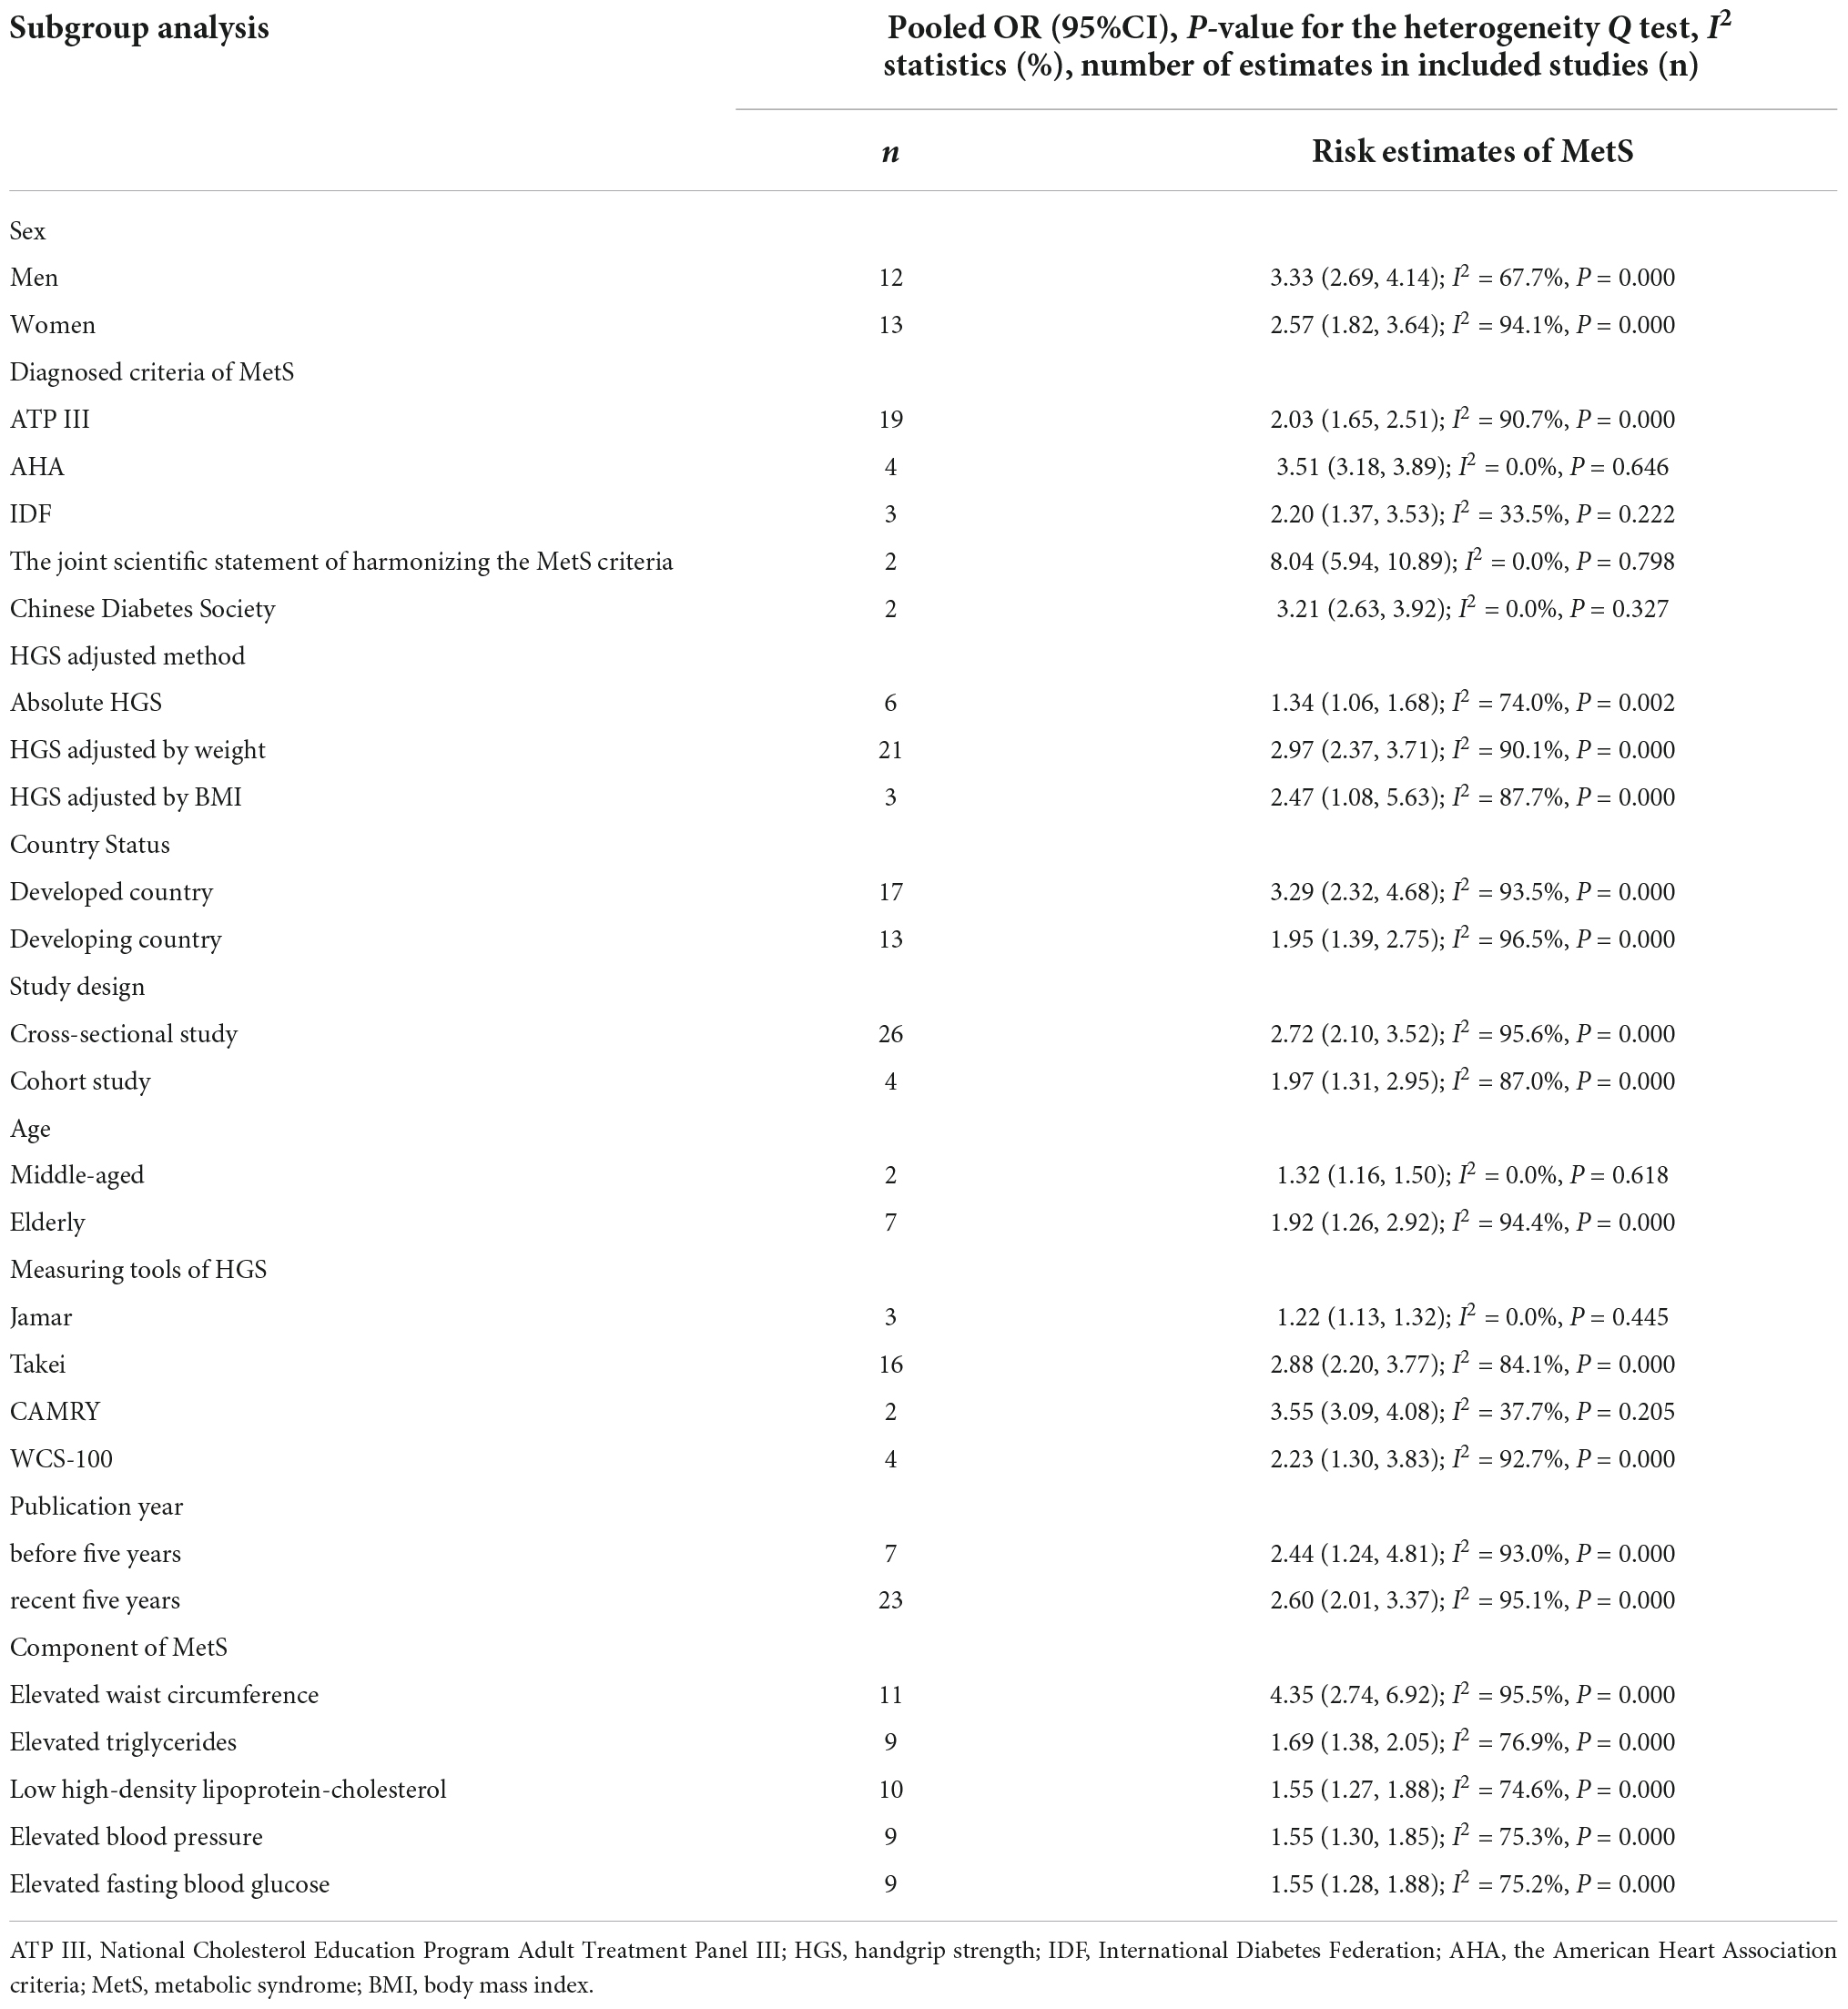
Table 2. Combined results of subgroup analysis of HGS and MetS.
Three articles were included for the dose–response meta-analysis of the association between relative HGS (HGS/weight) and risk of MetS. There was a negative linear association between relative HGS (HGS/weight) and MetS (0.1 HGS/weight: OR, 0.68; 95% CI, 0.62−0.75) in Figure 3.
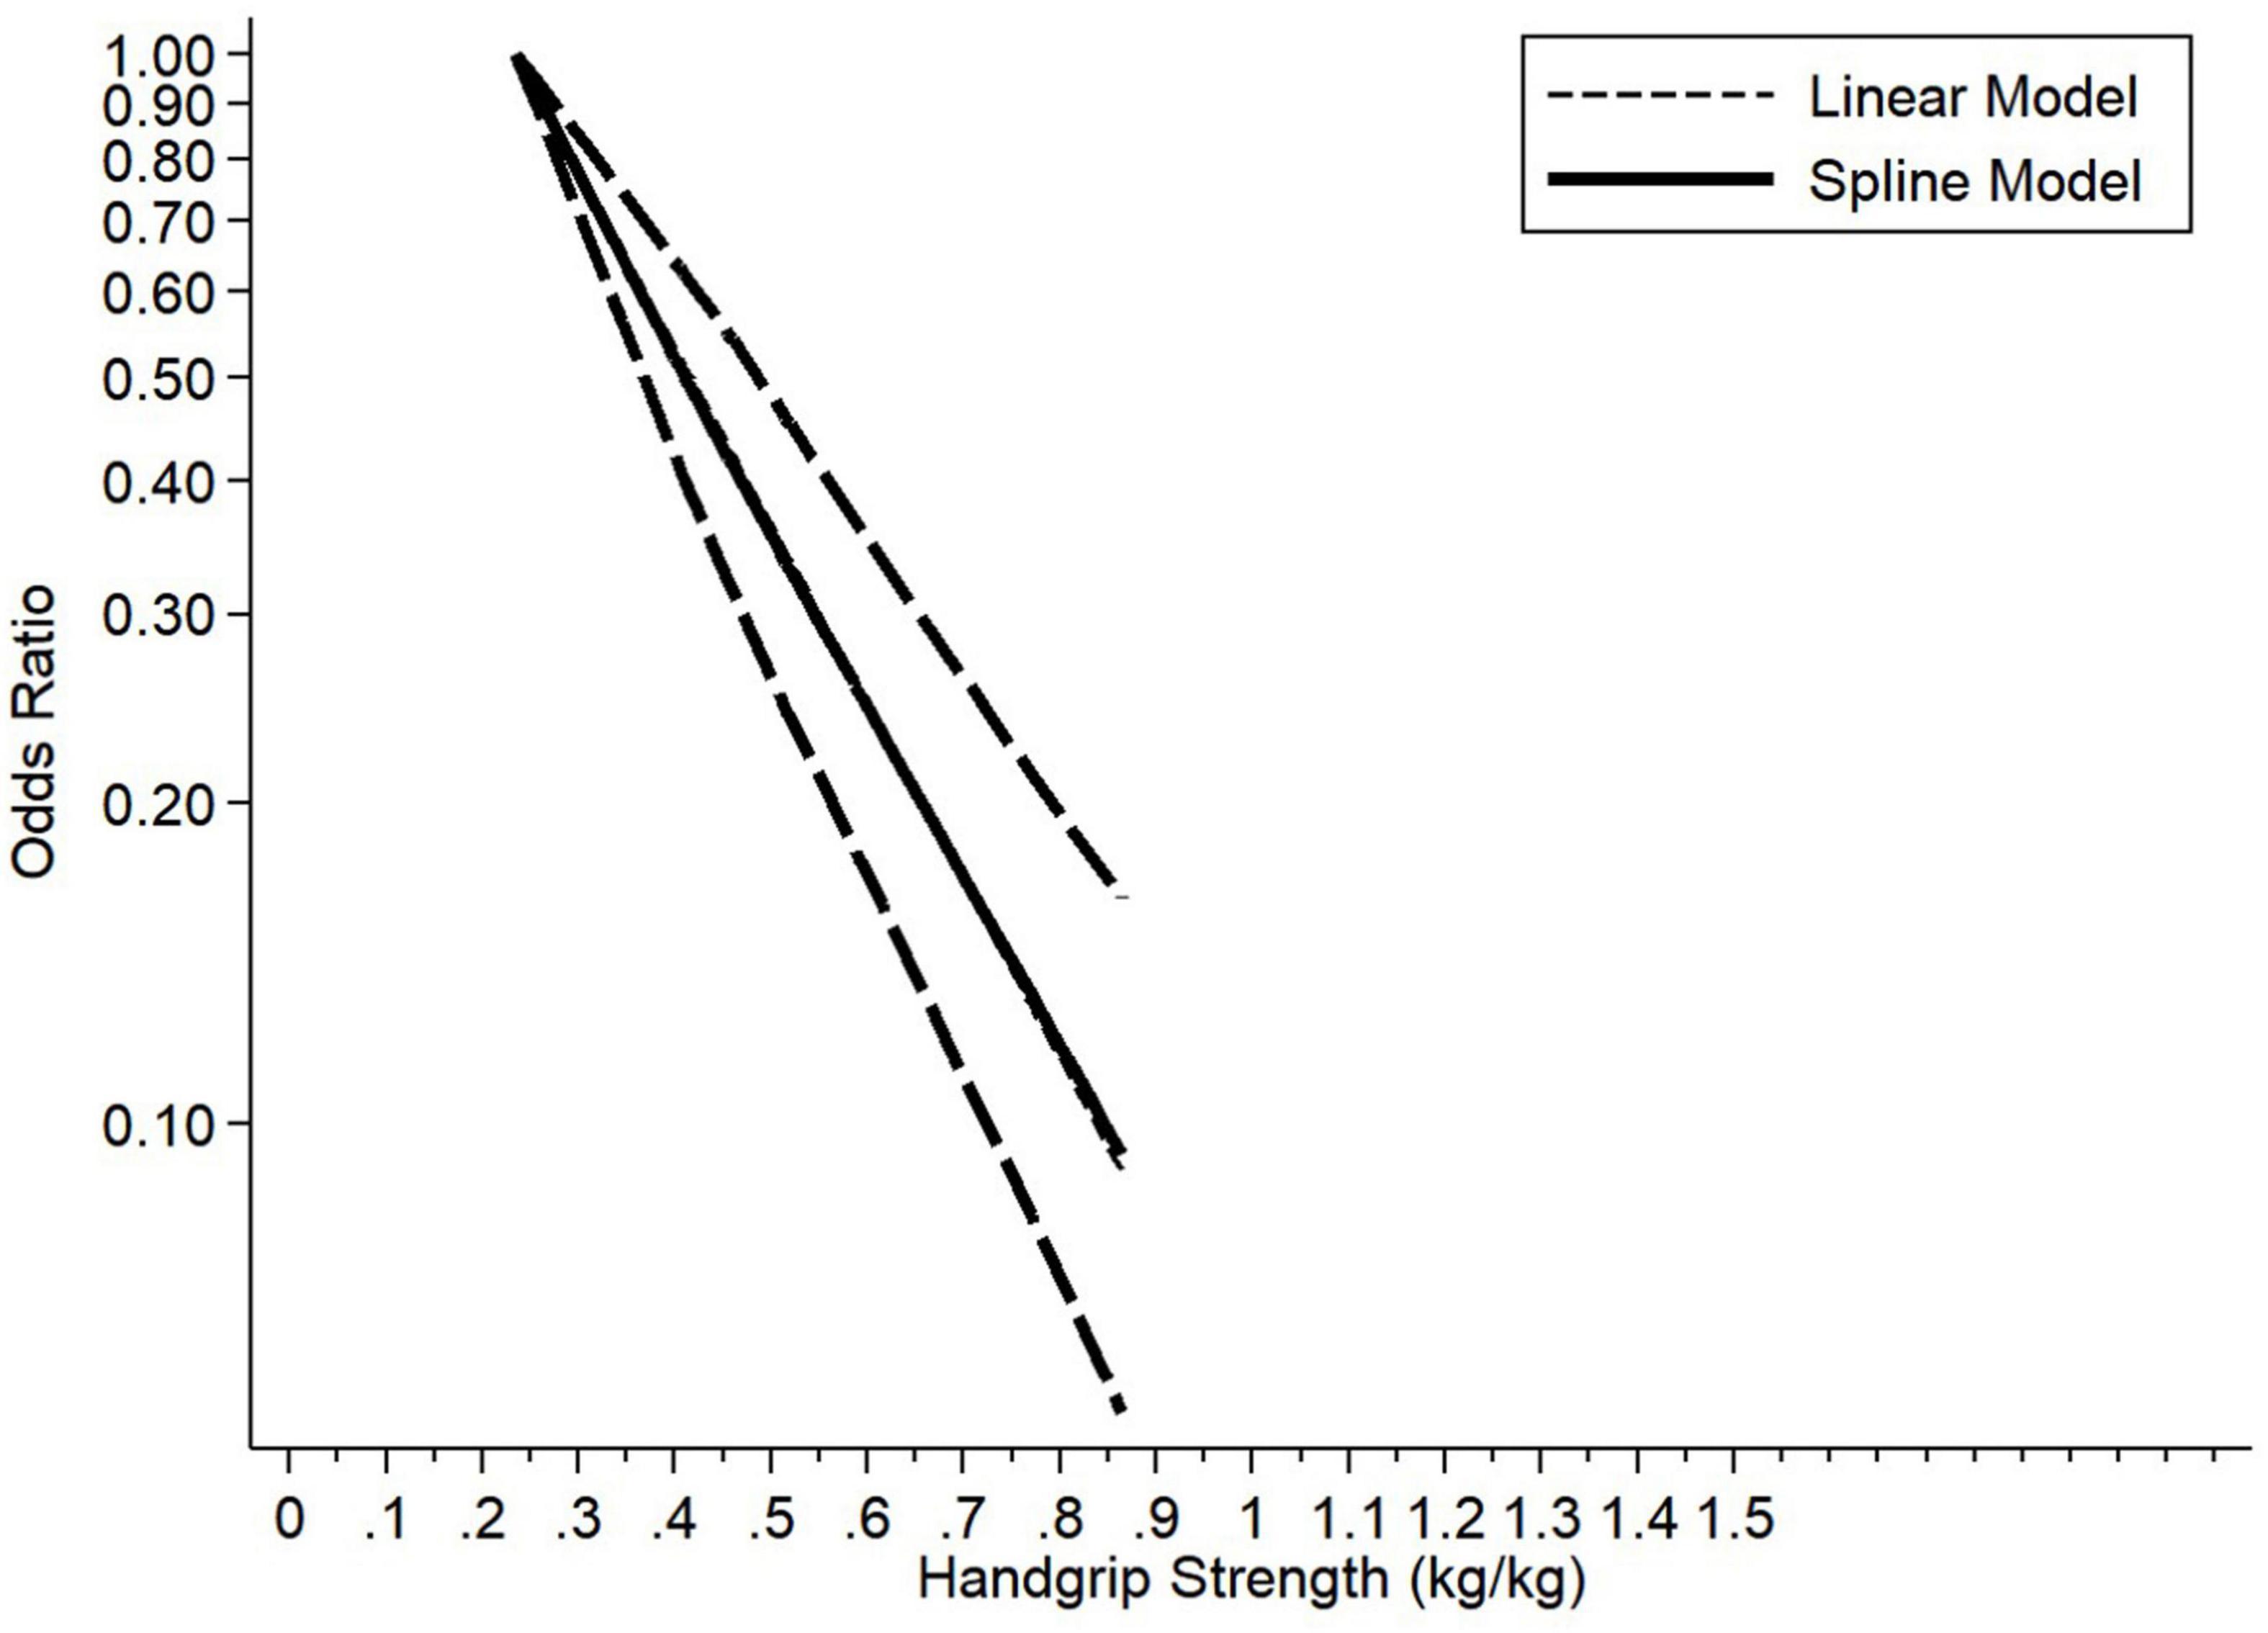
Figure 3. Dose–response association between handgrip strength (HGS/weight) and prevalence of metabolic syndrome.
Egger’s test indicated the existence of publication bias (P < 0.05) among the total group of subjects. Therefore, Duval and Tweedie’s trim-and-fill method was performed to re-examine publication bias. The adjusted pooled OR after adding nine studies was OR was 1.76 (95% CI: 1.40−2.21, P < 0.05). Hence, publication bias was solved when nine studies were incorporated in the funnel plot by trim fill analysis (Supplementary Figure 1). After excluding each article in every turn, the combined results were stable in the sensitivity analysis and the pooled ORs (95% CIs) ranged between 2.47 (1.98, 3.09) and 2.69 (2.15, 3.37).
Examination of the association of HGS and MetS in adults revealed high study heterogeneity (I2 = 95.1%, P < 0.05). Thus, we conducted a meta-regression to identify the sources of high heterogeneity. Univariate meta-regression analysis indicated that country status (P = 0.025), measuring tools of HGS [Takei (P = 0.024) and CAMRY (P = 0.029)], components of MetS [elevated WC (P = 0.000)], and diagnosed criteria of MetS [ATP III (P = 0.001) and IDF (P = 0.016)] were significant sources of heterogeneity. Country status, measuring tools of HGS, components of MetS (elevated TG as the reference), and diagnosed criteria of MetS explained 16.7%, 26.2%, 30.1%, and 42.3% of the tau-squared in the meta-regression, respectively. Sex, HGS-adjusted method, study design, age, and publication year were not the potential sources of heterogeneity. The results are shown in Supplementary Table 4.
This meta-analysis was the first study to systematically evaluate the association between HGS and MetS. In this meta-analysis involving 30 studies (reported in 19 articles) with a total of 43,396 participants, we determined the association between HGS and MetS. The study types of included studies were cross-sectional studies and cohort studies. Additionally, we used AHRQ and NOS scales to assess the quality of our included studies, seven studies were rated high quality and twelve studies were rated moderate quality. Most cross-sectional studies did not mention relevant contents of follow-up. As a whole, all studies reached the criteria of quality assessment. Based on cross-sectional and prospective cohort studies, this meta-analysis of observational studies indicated there was an inverse association between HGS and MetS. Low HGS was associated with a 2.59-fold increase in the pooled prevalent MetS. Consistent results were demonstrated based on subgroup analysis regarding gender, age, publication year, HGS-adjusted methods, region country status, study type, MetS for each component, and defined criteria of MetS. Due to significant heterogeneity among the included studies, we performed meta-regression and subgroup analysis to investigate the potential sources of heterogeneity. Meta-regression analysis revealed that country status, measuring tools of HGS, components of MetS, and diagnosed criteria of MetS contributed to the heterogeneity. However, the heterogeneity was still uncontrolled after subgroup analyses. Furthermore, in the dose–response analysis, a linear association between relative HGS (HGS/body weight) levels and MetS was found among men and women. These results demonstrated that any incremental increase in the relative HGS level was linked to a decreased prevalence in the MetS.
The pathogenesis of MetS is partly understood; however, a sedentary lifestyle, unhealthy diet, overweight or obesity, and still largely unknown genetic factors clearly interact to produce it (53). Regular physical activity has been shown to decrease body weight and visceral fat (54, 55) accumulation and improves insulin sensitivity (56, 57). Those are major constituents or related to MetS. A cohort study of 612 middle-aged men shows that high-intensity leisure-time physical activity at least 3 h/week was half as likely as sedentary to develop the MetS during the 4 years follow-up period (58). However, physical activity seems to be difficult to assess accurately (59). HGS has been introduced as a simple and inexpensive assessment tool for muscle strength and is highly correlated with total muscle strength (60). As a partly function of resistance training, physical activity could increase muscle strength (48). Low physical activity causes a decrease in muscle strength, which is known to increase MetS. And the mechanisms of physical activity and muscle strength were very similar. Both of them could decrease plasma triglyceride concentrations and increase plasma HDL cholesterol concentrations, improving insulin sensitivity (53). HGS is an essential indicator of physical fitness and can reflect total muscle strength (59). Moreover, HGS is much easier to assess. Therefore, HGS is a flexible indicator with which to screen MetS. Several epidemiologic studies (12, 15, 37) showed an adverse association between relative HGS and MetS. A cross-sectional study conducted in Tianjin showed that relative HGS is inversely associated with MetS in a survey of 17,703 individuals > 40 years of age (12). Another study conducted in the United States suggested that increased relative HGS may be inversely related to the prevalence of MetS or its separate components using 2011−2014 National Health and Nutrition Examination Survey (NHANES) data (15). An Australian population-based study indicated that there was a negative association between muscle strength and MetS (37). Previous studies (14, 17) that investigated the association between absolute HGS and MetS were not in agreement with relative HGS (HGS/weight or HGS/BMI). No association between absolute HGS and MetS was detected among 1,009 Korean participants (14). A previous cross-sectional study reported that there was no association between absolute HGS and MetS in older adults from the HOPE study (17). Moreover, no dose–response meta-analysis between relative HGS (HGS/weight) and MetS was conducted. The dose–response meta-analysis results indicated that there was a negative linear association between relative HGS (HGS/weight) and MetS.
In agreement with previous studies, we found that a lower relative HGS (HGS/body weight; HGS/BMI) was associated with a higher prevalence of MetS. Wu et al. (14) revealed that physical inactivity, energy intake, and partial pathophysiologic mechanisms influenced muscle weakness in MetS. First, insulin acts on skeletal muscle and plays a significant role in IR and insulin sensitivity (61–63). Insulin sensitivity and IR are important factors in the pathophysiology of metabolic disorders (61, 62). Second, skeletal muscle secretes muscle factors that have an endocrine role, such as irisin and myonectin (64–67). The above processes are blocked and become a risk factor for MetS (68, 69). Third, in skeletal muscle, excessive accumulation of intramuscular fat will cause IR and develop into MetS (13, 70). Fourth, several studies have shown that lower muscle strength and mass may be associated with higher inflammatory markers (71), thereby increasing the risk of MetS. Therefore, skeletal muscle releases muscle factors and reduces inflammatory markers, decreasing the prevalence of MetS.
The current meta-analysis had several strengths. First, this is the first meta-analysis and systematic review to assess the association between HGS and MetS. Second, we reconciled the inconsistent results of absolute HGS and relative HGS (HGS/weight; HGS/BMI). Third, based on our meta-analysis, despite the limited number of included studies, we evaluated the dose–response association between relative HGS (after adjustment for body weight) and MetS for men and women.
Of note, there were some potential limitations in our meta-analysis. First, the insufficient reporting limited the interpretability of the results. Second, because we solely searched the literature published in English or Chinese, it was likely that all pertinent results were not included. Finally, HRs were treated as equal to ORs for pooling and analyzing data, which may have impacted the results.
In summary, the results of the current meta-analysis indicate that higher HGS is associated with a lower risk of MetS. Moreover, there appears to be a negative dose–response association between relative HGS (HGS/weight) and MetS. Lower levels of relative HGS (HGS/weight) were associated with a higher prevalence of MetS. Accordingly, lowered relative HGS (HGS/weight) might be a significant predictor of MetS.
The original contributions presented in this study are included in the article/Supplementary material, further inquiries can be directed to the corresponding author/s.
YW did the conceptualization, carried out the software and formal analysis, extracted the data, and wrote the original draft. TL, CM, JF, and ZZ wrote, reviewed, and edited the manuscript. ML wrote, reviewed, and edited the manuscript and extracted the data. YX wrote, reviewed, and edited the manuscript and supervised the data. YZ wrote, reviewed, and edited the manuscript and carried out the funding acquisition. CJ did the conceptualization, wrote, reviewed, and edited the manuscript, supervised the data, and carried out the funding acquisition. All authors contributed to the article and approved the submitted version.
This work was supported by the JieBangGuaShuai Project of Liaoning Province (2021JH1/1040050), Precise prevention, diagnosis, and treatment for metabolic diseases, the National Key Research and Development Program of China (Grant No. 2017YFC0907403), the Projects of Shenyang Science and Technology Bureau (Grant No. 20-205-4-029n), Doctoral Research Foundation Project of Liaoning Province (Grant No. 2022-BS-130), and the 345 Talent Project of Shengjing Hospital of China Medical University (Grant Nos. M0700 and M0937).
The authors declare that the research was conducted in the absence of any commercial or financial relationships that could be construed as a potential conflict of interest.
All claims expressed in this article are solely those of the authors and do not necessarily represent those of their affiliated organizations, or those of the publisher, the editors and the reviewers. Any product that may be evaluated in this article, or claim that may be made by its manufacturer, is not guaranteed or endorsed by the publisher.
The Supplementary Material for this article can be found online at: https://www.frontiersin.org/articles/10.3389/fnut.2022.996645/full#supplementary-material
Supplementary Figure 1 | Adjusted effect size using trim and fill method for HGS and MetS.
Supplementary Table 1 | Search strategy.
Supplementary Table 2 | The quality assessment of the included cohort studies.
Supplementary Table 3 | The quality assessment of the included cross-sectional studies.
Supplementary Table 4 | Meta-regression analysis of HGS and MetS.
1. Expert Panel on Detection, Evaluation, and Treatment of High Blood Cholesterol in Adults. Executive summary of the third report of the National cholesterol education program (NCEP) expert panel on detection, evaluation, and treatment of high blood cholesterol in adults (adult treatment panel III). JAMA. (2001) 285:2486–97. doi: 10.1001/jama.285.19.2486
2. Grundy SM, Cleeman JI, Daniels SR, Donato KA, Eckel RH, Franklin BA, et al. Diagnosis and management of the metabolic syndrome: an American Heart Association/national heart, lung, and blood institute scientific statement. Circulation. (2005) 112:2735–52.
3. Alberti KG, Zimmet P, Shaw J. The metabolic syndrome–a new worldwide definition. Lancet. (2005) 366:1059–62.
5. Wu SH, Liu Z, Ho SC. Metabolic syndrome and all-cause mortality: a meta-analysis of prospective cohort studies. Eur J Epidemiol. (2010) 25:375–84.
7. Younis A, Younis A, Tzur B, Peled Y, Shlomo N, Goldenberg I, et al. Metabolic syndrome is independently associated with increased 20-year mortality in patients with stable coronary artery disease. Cardiovasc Diabetol. (2016) 15:149.
8. Dominguez LJ, Barbagallo M. The biology of the metabolic syndrome and aging. Curr Opin Clin Nutr Metab Care. (2016) 19:5–11.
9. Yates T, Zaccardi F, Dhalwani NN, Davies MJ, Bakrania K, Celis-Morales CA, et al. Association of walking pace and handgrip strength with all-cause, cardiovascular, and cancer mortality: a UK Biobank observational study. Eur Heart J. (2017) 38:3232–40.
10. Roberts HC, Denison HJ, Martin HJ, Patel HP, Syddall H, Cooper C, et al. A review of the measurement of grip strength in clinical and epidemiological studies: towards a standardised approach. Age Ageing. (2011) 40:423–9. doi: 10.1093/ageing/afr051
11. Porto JM, Nakaishi APM, Cangussu-Oliveira LM, Freire Júnior RC, Spilla SB, Abreu DCC. Relationship between grip strength and global muscle strength in community-dwelling older people. Arch Gerontol Geriatr. (2019) 82:273–8.
12. Ford ES. Risks for all-cause mortality, cardiovascular disease, and diabetes associated with the metabolic syndrome: a summary of the evidence. Diabetes Care. (2005) 28:1769–78.
13. Cheng YJ, Gregg EW, De Rekeneire N, Williams DE, Imperatore G, Caspersen CJ, et al. Muscle-strengthening activity and its association with insulin sensitivity. Diabetes Care. (2007) 30:2264–70.
14. Wu H, Liu M, Chi VTQ, Wang J, Zhang Q, Liu L, et al. Handgrip strength is inversely associated with metabolic syndrome and its separate components in middle aged and older adults: a large-scale population-based study. Metabolism. (2019) 93:61–7. doi: 10.1016/j.metabol.2019.01.011
15. Ji C, Xia Y, Tong S, Wu Q, Zhao Y. Association of handgrip strength with the prevalence of metabolic syndrome in US adults: the national health and nutrition examination survey. Aging. (2020) 12:7818–29.
16. Byeon JY, Lee MK, Yu M-S, Kang MJ, Lee DH, Kim KC, et al. Lower relative handgrip strength is significantly associated with a higher prevalence of the metabolic syndrome in adults. Metab Syndr Relat Disord. (2019) 17:280–8.
17. Merchant RA, Chan YH, Lim JY, Morley JE. Prevalence of metabolic syndrome and association with grip strength in older adults: findings from the HOPE study. Diabetes Metab Syndr Obes. (2020) 13:2677–86.
18. Lundell LS, Massart J, Altıntas̨ A, Krook A, Zierath JR. Regulation of glucose uptake and inflammation markers by FOXO1 and FOXO3 in skeletal muscle. Mol Metab. (2019) 20:79–88. doi: 10.1016/j.molmet.2018.09.011
19. Li F, Li Y, Duan Y, Hu C-AA, Tang Y, Yin Y. Myokines and adipokines: involvement in the crosstalk between skeletal muscle and adipose tissue. Cytokine Growth Factor Rev. (2017) 33:73–82.
20. Nielsen AR, Hojman P, Erikstrup C, Fischer CP, Plomgaard P, Mounier R, et al. Association between interleukin-15 and obesity: interleukin-15 as a potential regulator of fat mass. J Clin Endocrinol Metab. (2008) 93:4486–93.
21. McPherron AC, Lawler AM, Lee SJ. Regulation of skeletal muscle mass in mice by a new TGF-beta superfamily member. Nature. (1997) 387:83–90.
22. Liu XH, Bauman WA, Cardozo CP. Myostatin inhibits glucose uptake via suppression of insulin-dependent and -independent signaling pathways in myoblasts. Physiol Rep. (2018) 6:e13837. doi: 10.14814/phy2.13837
23. Kewalramani G, Bilan PJ, Klip A. Muscle insulin resistance: assault by lipids, cytokines and local macrophages. Curr Opin Clin Nutr Metab Care. (2010) 13:382–90. doi: 10.1097/MCO.0b013e32833aabd9
24. Lee MJ, Lee SA, Nam BY, Park S, Lee SH, Ryu HJ, et al. Irisin, a novel myokine is an independent predictor for sarcopenia and carotid atherosclerosis in dialysis patients. Atherosclerosis. (2015) 242:476–82. doi: 10.1016/j.atherosclerosis.2015.08.002
25. Martin BC, Warram JH, Krolewski AS, Bergman RN, Soeldner JS, Kahn CR. Role of glucose and insulin resistance in development of type 2 diabetes mellitus: results of a 25-year follow-up study. Lancet. (1992) 340:925–9. doi: 10.1016/0140-6736(92)92814-v
26. DeFronzo RA, Gunnarsson R, Björkman O, Olsson M, Wahren J. Effects of insulin on peripheral and splanchnic glucose metabolism in noninsulin-dependent (type II) diabetes mellitus. J Clin Investig. (1985) 76:149–55. doi: 10.1172/JCI111938
27. Kim SH, Kang HW, Jeong JB, Lee DS, Ahn DW, Kim JW, et al. Association of obesity, visceral adiposity, and sarcopenia with an increased risk of metabolic syndrome: a retrospective study. PLoS One. (2021) 16:e0256083. doi: 10.1371/journal.pone.0256083
28. Moher D, Liberati A, Tetzlaff J, Altman DG. Preferred reporting items for systematic reviews and meta-analyses: the PRISMA statement. BMJ. (2009) 339:b2535.
29. Miller FP, Vandome AF, Mcbrewster J. Agency for healthcare research and quality. In: Proceedings of the International Conference of the IEEE Engineering in Medicine & Biology Society (2002).
30. Wells GA, Shea B, O’Connell D, Peterson J, Welch V, Losos M, et al. The Newcastle Ottawa Scale (NOS) for Assessing the Quality of Nonrandomised Studies in Meta-Analyses. (2000). Available online at: https://www.ohri.ca/programs/clinical_epidemiology/oxford.asp (accessed November 21, 2022).
31. Stare J, Maucort-Boulch D. Odds ratio, hazard ratio and relative risk. Metodoloski Zvezki. (2016) 13:59.
32. Cummings P. The relative merits of risk ratios and odds ratios. Arch Pediatr Adolesc Med. (2009) 163:438–45.
33. Zocchetti C, Consonni D, Bertazzi PA. Relationship between prevalence rate ratios and odds ratios in cross-sectional studies. Int J Epidemiol. (1997) 26:220–3.
34. Duval S, Tweedie R. Trim and fill: a simple funnel-plot-based method of testing and adjusting for publication bias in meta-analysis. Biometrics. (2000) 56:455–63. doi: 10.1111/j.0006-341x.2000.00455.x
35. Thompson SG, Higgins JP. How should meta-regression analyses be undertaken and interpreted? Stat Med. (2002) 21:1559–73.
36. Greenland S, Longnecker MP. Methods for trend estimation from summarized dose-response data, with applications to meta-analysis. Am J Epidemiol. (1992) 135:1301–9. doi: 10.1093/oxfordjournals.aje.a116237
37. Atlantis E, Martin SA, Haren MT, Taylor AW, Wittert GA, Members of the Florey Adelaide Male Ageing Study. Inverse associations between muscle mass, strength, and the metabolic syndrome. Metabolism. (2009) 58:1013–22.
38. Chang K-V, Hung C-Y, Li C-M, Lin Y-H, Wang T-G, Tsai K-S, et al. Reduced flexibility associated with metabolic syndrome in community-dwelling elders. PLoS One. (2015) 10:e0117167. doi: 10.1371/journal.pone.0117167
39. Chang K-V, Yang K-C, Wu W-T, Huang K-C, Han D-S. Association between metabolic syndrome and limb muscle quantity and quality in older adults: a pilot ultrasound study. Diabetes Metab Syndr Obes Targets Ther. (2019) 12:1821–30. doi: 10.2147/DMSO.S219649
40. Ishii S, Tanaka T, Akishita M, Ouchi Y, Tuji T, Iijima K, et al. Metabolic syndrome, sarcopenia and role of sex and age: cross-sectional analysis of kashiwa cohort study. PLoS One. (2014) 9:e112718. doi: 10.1371/journal.pone.0112718
41. Kawamoto R, Ninomiya D, Kasai Y, Kusunoki T, Ohtsuka N, Kumagi T, et al. Handgrip strength is associated with metabolic syndrome among middle-aged and elderly community-dwelling persons. Clin Exp Hypertens. (2016) 38:245–51.
42. Kim H, Kim YH, Kim W. Association of low muscle mass and isokinetic strength with metabolic syndrome. J Mens Health. (2020) 16:e50–8.
43. Kim J-S, Seo Y. Relationship Between handgrip strength and metabolic syndrome among middle-aged and elderly cancer survivors: a national population study. Cancer Nurs. (2021) 45:457–64. doi: 10.1097/NCC.0000000000001018
44. Mesinovic J, McMillan LB, Shore-Lorenti C, De Courten B, Ebeling PR, Scott D. Metabolic syndrome and its associations with components of sarcopenia in overweight and obese older adults. J Clin Med. (2019) 8:145.
45. Moreira MA, Vafaei A, da Camara SMA, do Nascimento RA, de Morais MDSM, Almeida MDG, et al. Metabolic syndrome (MetS) and associated factors in middle-aged women: a cross-sectional study in Northeast Brazil. Women Health. (2020) 60:601–17. doi: 10.1080/03630242.2019.1688445
46. Sayer AA, Syddall HE, Dennison EM, Martin HJ, Phillips DIW, Cooper C, et al. Grip strength and the metabolic syndrome: findings from the hertfordshire cohort study. QJM. (2007) 100:707–13. doi: 10.1093/qjmed/hcm095
47. Song P, Zhang Y, Wang Y, Han P, Fu L, Chen X, et al. Clinical relevance of different handgrip strength indexes and metabolic syndrome in Chinese community-dwelling elderly individuals. Arch Gerontol Geriatr. (2020) 87:104010. doi: 10.1016/j.archger.2020.104010
48. Zhang W, Zhao Z, Sun X, Tian X. Prevalence of metabolic syndrome according to absolute and relative values of muscle strength in middle-aged and elderly women. Int J Environ Res Public Health. (2021) 18:9073. doi: 10.3390/ijerph18179073
49. Yingfang W, Lu C, Feng C, Shuai X, Feng C, Yan G, et al. Relationship between handgrip strength body mass index and metabolic syndrome in community elderly residents. Int J Endocrinol Metab. (2020). 40:5–9, 15 doi: 10.3760/cma.j.issn.1673-4157.2020.01.002
50. Jeon YJ, Lee SK, Shin C. Relative hand grip and back muscle strength, but not mean muscle strength, as risk factors for incident metabolic syndrome and its metabolic components: 16 years of follow-up in a population-based cohort study. Appl Sci Basel. (2021) 11:5198.
51. Shen C, Lu J, Xu Z, Xu Y, Yang Y. Association between handgrip strength and the risk of new-onset metabolic syndrome: a population-based cohort study. BMJ Open. (2020) 10:e041384. doi: 10.1136/bmjopen-2020-041384
52. Qiu-Feng H, Shao-Wei S, Xiao-Rong Y, Yan-Ru Y, Yang L, Ming L. Associations of absolute grip strength and grip strength-weight index with metabolic syndrome among adult residents in rural Shandong. Chin J Public Health. (2021) 37:818–23.
53. Lakka TA, Laaksonen DE. Physical activity in prevention and treatment of the metabolic syndrome. Appl Physiol Nutr Metab. (2007) 32:76–88.
54. Erlichman J, Kerbey AL, James WP. Physical activity and its impact on health outcomes. Paper 2: prevention of unhealthy weight gain and obesity by physical activity: an analysis of the evidence. Obes Rev. (2002) 3:273–87. doi: 10.1046/j.1467-789x.2002.00078.x
55. Saris WH, Blair SN, van Baak MA, Eaton SB, Davies PS, Di Pietro L, et al. How much physical activity is enough to prevent unhealthy weight gain? Outcome of the IASO 1st Stock Conference and consensus statement. Obes Rev. (2003) 4:101–14. doi: 10.1046/j.1467-789x.2003.00101.x
56. Henriksen EJ. Invited review: effects of acute exercise and exercise training on insulin resistance. J Appl Physiol. (2002) 93:788–96.
57. Holloszy JO. Exercise-induced increase in muscle insulin sensitivity. J Appl Physiol. (2005) 99:338–43.
58. Laaksonen DE, Lakka HM, Salonen JT, Niskanen LK, Rauramaa R, Lakka TA. Low levels of leisure-time physical activity and cardiorespiratory fitness predict development of the metabolic syndrome. Diabetes Care. (2002) 25:1612–8.
59. Wind AE, Takken T, Helders PJ, Engelbert RH. Is grip strength a predictor for total muscle strength in healthy children, adolescents, and young adults? Eur J Pediatr. (2010) 169:281–7. doi: 10.1007/s00431-009-1010-4
60. Stevens P, Syddall H, Patel H, Martin H, Cooper C, Sayer AA. Is grip strength a good marker of physical performance among community-dwelling older people? J Nutr Health Aging. (2012) 16:769–74.
61. Barlow J, Solomon TP. Conditioned media from contracting skeletal muscle potentiates insulin secretion and enhances mitochondrial energy metabolism of pancreatic beta-cells. Metabolism. (2019) 91:1–9. doi: 10.1016/j.metabol.2018.11.004
62. Warren JL, Bulur S, Ovalle F, Windham ST, Gower BA, Fisher G. Effects of acute hyperinsulinemia on skeletal muscle mitochondrial function, reactive oxygen species production, and metabolism in premenopausal women. Metabolism. (2017) 77:1–12. doi: 10.1016/j.metabol.2017.08.004
63. Mizgier ML, Casas M, Contreras-Ferrat A, Llanos P, Galgani J. Potential role of skeletal muscle glucose metabolism on the regulation of insulin secretion. Obes Rev. (2014) 15:587–97.
64. Millar P, Levy A, McGowan C, McCartney N, MacDonald M. Isometric handgrip training lowers blood pressure and increases heart rate complexity in medicated hypertensive patients. Scand J Med Sci Sports. (2013) 23:620–6. doi: 10.1111/j.1600-0838.2011.01435.x
65. Chen L-K, Liu L-K, Woo J, Assantachai P, Auyeung T-W, Bahyah KS, et al. Sarcopenia in Asia: consensus report of the Asian working group for Sarcopenia. J Am Med Direct Assoc. (2014) 15:95–101. doi: 10.1016/j.jamda.2013.11.025
66. Bentley DC, Nguyen CH, Thomas SG. High-intensity handgrip training lowers blood pressure and increases heart rate complexity among postmenopausal women: a pilot study. Blood Press Monit. (2018) 23:71–8. doi: 10.1097/MBP.0000000000000313
67. Ouchi N, Ohashi K, Shibata R, Murohara T. Protective roles of adipocytokines and myokines in cardiovascular disease. Circ J. (2016) 80:2073–80.
68. Li K, Liao X, Wang K, Mi Q, Zhang T, Jia Y, et al. Myonectin predicts the development of type 2 diabetes. J Clin Endocrinol Metab. (2018) 103:139–47.
69. Otaka N, Shibata R, Ohashi K, Uemura Y, Kambara T, Enomoto T, et al. Myonectin is an exercise-induced myokine that protects the heart from ischemia-reperfusion injury. Circ Res. (2018) 123:1326–38. doi: 10.1161/CIRCRESAHA.118.313777
70. Verghese J, Holtzer R, Oh-Park M, Derby CA, Lipton RB, Wang C. Inflammatory markers and gait speed decline in older adults. J Gerontol Ser A Biomed Sci Med Sci. (2011) 66:1083–9.
Keywords: absolute HGS, dose–response analysis, metabolic syndrome, meta-analysis, relative HGS, systematic review
Citation: Wen Y, Liu T, Ma C, Fang J, Zhao Z, Luo M, Xia Y, Zhao Y and Ji C (2022) Association between handgrip strength and metabolic syndrome: A meta-analysis and systematic review. Front. Nutr. 9:996645. doi: 10.3389/fnut.2022.996645
Received: 19 July 2022; Accepted: 14 November 2022;
Published: 01 December 2022.
Edited by:
Gregory C. Henderson, Purdue University, United StatesReviewed by:
Yeqing Gu, Chinese Academy of Medical Sciences and Peking Union Medical College, ChinaCopyright © 2022 Wen, Liu, Ma, Fang, Zhao, Luo, Xia, Zhao and Ji. This is an open-access article distributed under the terms of the Creative Commons Attribution License (CC BY). The use, distribution or reproduction in other forums is permitted, provided the original author(s) and the copyright owner(s) are credited and that the original publication in this journal is cited, in accordance with accepted academic practice. No use, distribution or reproduction is permitted which does not comply with these terms.
*Correspondence: Yuhong Zhao, emhhb3l1aG9uZ0Bzai1ob3NwaXRhbC5vcmc=; Chao Ji, amljaGFvQGNtdS5lZHUuY24=
†These authors have contributed equally to this work
Disclaimer: All claims expressed in this article are solely those of the authors and do not necessarily represent those of their affiliated organizations, or those of the publisher, the editors and the reviewers. Any product that may be evaluated in this article or claim that may be made by its manufacturer is not guaranteed or endorsed by the publisher.
Research integrity at Frontiers
Learn more about the work of our research integrity team to safeguard the quality of each article we publish.