- 1School of Public Health, Capital Medical University, Beijing, China
- 2School of Science, Faculty of Engineering and Science, University of Greenwich, Chatham, United Kingdom
Background: Lipid metabolism disorder commonly happens in subjects with Type 2 diabetes mellitus (T2DM) which may be linked to genetic variants of lipid metabolism-related genes. However, few studies have explored the relationship between lipid metabolism-related gene polymorphism and serum lipid profile in aging subjects with T2DM. The present study was designed to explore the impact of genetic polymorphism of cluster determinant 36 (CD36) (rs1049673, rs1054516, rs2151916), scavenger receptor class B type 1 (SCARB1) (rs5888), and major facilitator superfamily domain containing the 2a (MFSD2A) (rs12083239, rs4233508, rs12072037) on the relationship between circulating lipids in aging subjects with T2DM.
Methods: 205 T2DM patients and 205 age and gender matched control subjects were recruited. Information on demographic characteristics was collected by using a self-administered questionnaire. Fasting venous blood samples were taken for lipid-related gene genotyping and serum lipid profile measurement. The Chi-square test was used to compare percentage differences and to calculate P-value for Hardy-Weinberg equilibrium. Logistic regression and multiple linear regression were used to explore the risk or correlation between variables, and general linear model (GLM) was used to compare the means of serum lipids between the groups.
Results: In T2DM group, CD36 rs1054516 and MFSD2A rs12072037 were correlated with serum TC level. In control group, CD36 rs1049673 was correlated with serum HDL-C level. Meanwhile, T2DM subjects with MFSD2A rs12083239 (CG), MFSD2A rs4233508 (TT), and MFSD2A rs12072037 (AA) had higher TG level than control subjects. T2DM subjects with CD36 rs1049673 (CG, GG), CD36 rs1054516 (CT), CD36 rs2151916 (TT, CT), SCARB1 rs5888 (GG), MFSD2A rs12083239 (GG, CG), MFSD2A rs4233508 (TT), and MFSD2A rs12072037 (CA, AA) had lower HDL-C level than control subjects. T2DM subjects with MFSD2A rs12072037 (AA) had lower LDL-C level than control subjects. In dominant model, major genotype (GG) of SCARB1 gene was associated with the risk of T2DM (OR = 0.636, P = 0.032).
Conclusion: The genetic polymorphism of CD36 (rs1049673, rs1054516, rs2151916), SCARB1 (rs5888), and MFSD2A (rs12083239, rs4233508, rs12072037) were associated with serum lipids in T2DM subjects. The SCARB1 rs5888 major genotype (GG) was a protective factor for T2DM. Large scale cohort study is required to determine the relationship between lipid metabolism-related gene polymorphism, serum lipid profile and T2DM in aging subjects.
Introduction
Type 2 diabetes mellitus (T2DM) is a chronic metabolic disease that commonly happens in the middle-aged and aged population. The typical clinical characteristics of T2DM are the disorder of glucose and lipid metabolism, manifested by increased plasma the level of glucose and insulin and compensatory insulin secretion insufficiency (1, 2). Moreover, the lipid metabolism disorder can lead to increased circulating free fatty acids (FFA) level, and adipose ectopia deposit in non-adipose tissues, which partially damage the function of islet β cells (3). Hence, the intervention on the FFA transporter system is one of the therapeutic targets to improve dyslipidemia and slow down the process of T2DM.
Lipid metabolism is involved with various FFA transporters. Scavenger Receptor (SR-B), as a member of the FFA transporter system, was reported directly to participate in lipid metabolism through mediating lipoprotein uptake. SR-B includes the subtypes of fatty acid translocase cluster determinant 36 (CD36) and scavenger receptor class B type 1 (SCARB1). The CD36 gene is highly polymorphic and it locates on the q11.2 region of human chromosome 7, has 15 exons (4). CD36 is extensively expressed in platelets, adipocytes, cardiomyocytes, and macrophages. CD36 is a complex multifunctional protein that acts as a scavenging receptor for oxidized low-density lipoprotein (ox-LDL) and apoptotic cells, as well as a fatty acid transporter (5). Another subtype, SCARB1 gene locates on chromosome 12 and consists of 13 exons and 12 introns (6). SCARB1 is a polyligand membrane receptor protein, involved in cholesterol reverse transport and regulation of HDL metabolism (7). The major facilitator superfamily domain containing the 2a (MFSD2A) gene locates on chromosome 1, 14.3 kb in length and consists of 14 exons and 13 introns. MFSD2A is extensively expressed in brain, liver and brown fat tissues. MFSD2A mainly participants in the cellular uptake of n-3 polyunsaturated fatty acids (n-3 PUFAs) (8, 9).
Genetic susceptibility plays a vital role in the pathology of T2DM, and there are increasing evidence indicated that the genetic architecture of T2DM is polygenic (10–12). Several studies have pointed out that single nucleotide polymorphisms (SNPs) of specific genes, such as mir-143/145 (13), IGFBP2 (14), NR1H2 (15), SLC30A8 (16), miR146a (17), and ADRB-1 (18), are associated with susceptibility to T2DM. These data highly indicate the importance of exploring genetic polymorphism’s role in the risk of T2DM. Results of meta-analysis had shown that genetic variants in low density lipoprotein cholesterol-lowering gene were associated with an increased risk of T2DM (19), suggesting that the SNPs of lipid metabolism-related genes is possibly associated with T2DM. Previous study had indicated an association between the CD36 gene polymorphism with the risk of T2DM (20). Studies found that the elevation of CD36 protein increases cellular FFA uptake and correlates with insulin resistance in diabetes (21, 22), demonstrating the potential role of CD36 in affecting glucose and lipid metabolism in T2DM. Besides, the correlation between the SCARB1 gene polymorphism and insulin sensitivity was also reported by previous study (23), which suggests the involvement of SCARB1 in the metabolism disorder of glucose and lipid in T2DM. Data from animal experiments also showed that MFSD2A knockout mice demonstrate reduced triglyceride (TG) level in serum, liver, and brown adipose tissue (24), suggesting the important role of MFSD2A in affecting lipid metabolism.
CD36 and SCARB1 were found to mediate the uptake of lipoproteins, and MFSD2A was reported to involve in DHA transport. All these molecules play pivotal role in lipids metabolism, as well as correlate with susceptibility to T2DM or glucagon signaling. Given these facts, we therefore speculate that the genetic polymorphism of these lipid metabolism-related genes might modify the correlation of serum lipids with T2DM, especially in the aging population prone to lipid metabolism disorder. Therefore, in the current study, an aging population-based case-control study was conducted to explore the correlation of serum lipids with T2DM in the subjects with different CD36, SCARB1 and MFSD2A genotypes. Our study will provide basic evidence for setting precision lipid management strategies in the diabetic population based on their genetic background.
Materials and methods
Study population
205 T2DM patients and 205 age (±2 years old) and gender matched control subjects were recruited in Nanyuan Community (Beijing, China) and Wulituo Community (Beijing, China). There were 73 men and 132 women in each group. Diabetes patients were determined according to guidelines for the prevention and control of type 2 diabetes in China (2017 Edition, Chinese Diabetes Society), with typical symptoms and fasting blood glucose ≥ 7.0 mmol/L or postprandial blood glucose ≥ 11.1 mmol/L. The study protocol was approved by the Committee on Medical Ethics of Capital Medical University (No. 2012SY23). The study procedures followed the ethical standards of the Helsinki Declaration of 1975. Informed consent was signed by all participants.
Demographic characteristics and anthropometric measures
Participants underwent a general information survey, medical history survey and physical examination. Information on demographic characteristics (age, gender), lifestyle factors [smoking (yes or no), alcohol drinking (yes or no) and physical activity (never, 1–3 times/week, 4–5 times/week, everyday)], and medical history of chronic disease [hyperlipidemia (yes or no), hypertension (yes or no), coronary heart disease (yes or no), stroke (yes or no) and atherosclerosis (yes or no)] were collected by using a self-administered questionnaire. The nurses of the community medical service center documented anthropometric measures (height and weight). Body mass index (BMI) was calculated as weight (kg)/height (m2).
Biochemical measurements
The fasting venous blood (5 mL) was collected from all the participants in the morning. After centrifuging at 1,500 g for 15 min, the plasma was separated and used for lipid parameter measurement. ILAB600 clinical chemistry analyzer (Instrumentation Laboratory, Lexington, WI, United States) was applied for glucose (GLU), total cholesterol (TC) and triglyceride (TG) measurement. High-density lipoprotein cholesterol (HDL-C) was determined by a commercially available assay from the Instrumentation Laboratory (Lexington, WI, United States), and low-density lipoprotein cholesterol (LDL-C) was calculated according to the Friedewald formula (25). All samples for each participant were analyzed within a single batch, and the inter-assay coefficients of variation (CV) were less than 5%.
Genotyping
The Wizard genomic DNA purification kit (Promega, Madison, WI, United States) was used to extract DNA from the whole blood sample. The genetic polymorphism of CD36 (rs1049673, rs1054516, rs2151916), SCARB1 (rs5888), MFSD2A (rs12083239, rs4233508, rs12072037) was detected by SNPscan genotyping assay according to the method descripted by previous study (26).
Statistical analysis
All data were statistically analyzed by SPSS 26.0 software (Chicago, IL, United States). Graphs were prepared by GraphPad Prism 8.0 (GraphPad Software). Continuous variables were represented as mean ± standard deviation (SD). Chi-square test was used to compare the differences in percentages and assess Hardy-Weinberg equilibrium. The allele and genotype frequency were calculated from the observed genotypic counts. The effect of different SNPs on the risk of T2DM in different gene models by using logistic regression. Multiple linear regression was applied to ascertain the correlation between alleles or genotypes and serum lipids. General linear model (GLM) was used to compare the means of the detected parameters between the groups. Potential confounding factors, including sex, age, BMI, hyperlipidemia, hypertension, coronary heart disease, atherosclerosis, smoking, alcohol drinking and physical activity, were adjusted during data analysis. The power was analyzed by using Gpower 3.1 software. P < 0.05 was considered as significant.
Results
Demographic characteristics and plasma lipid levels of the subjects
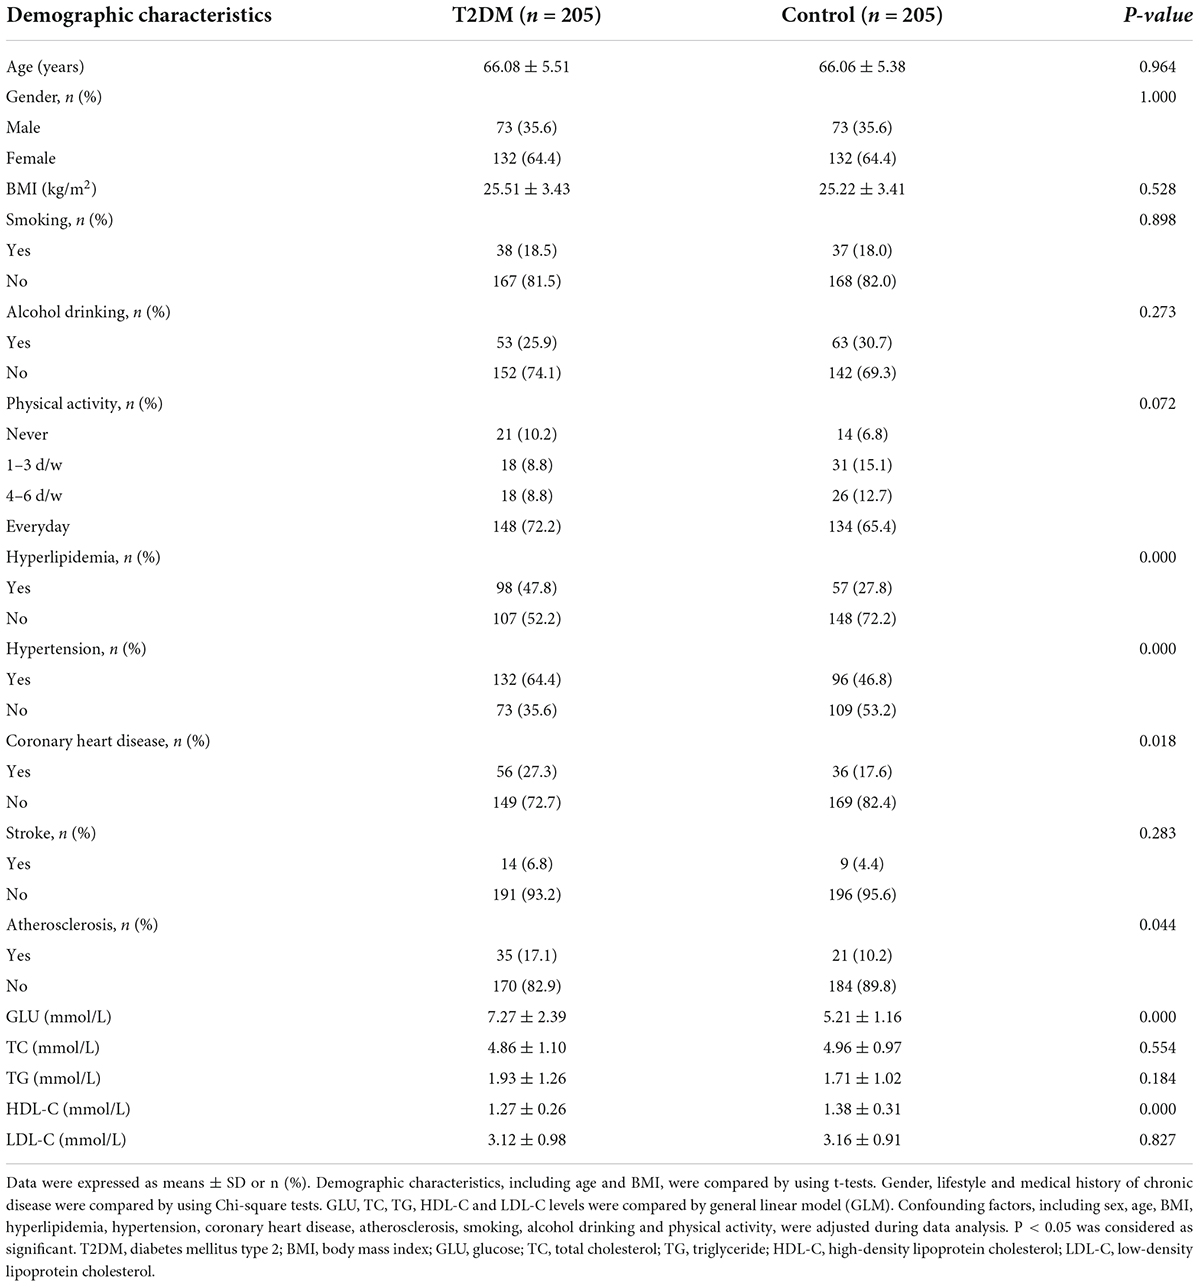
The demographic characteristics and plasma lipid levels of the participants are shown in Table 1. The age of the subjects ranged from 58 to 83 years, with an average age of 66.07 ± 5.44 years. There was no significant difference in age, gender (36% of participates are male) and BMI between T2DM and control groups (P > 0.05). The number of subjects with hyperlipidemia, hypertension, coronary heart disease and atherosclerosis in the T2DM group was significantly higher than that in the control group (P < 0.05). There was no significant difference in lifestyle (including smoking, alcohol drinking, and physical activity) and stroke between groups. Compared with the control subjects, the T2DM subjects had higher plasma GLU and lower HDL-C levels (P < 0.001). There was no significant difference in TC, TG and LDL-C levels between groups.
Correlation of plasma lipids with the risk of type 2 diabetes mellitus
As shown in Figure 1, the results of logistic regression analysis showed that HDL-C was a protective factor for T2DM (OR = 0.232, 95% CI: 0.104–0.522, P < 0.001). No association was found between T2DM risk and TC, TG, or LDL-C levels.
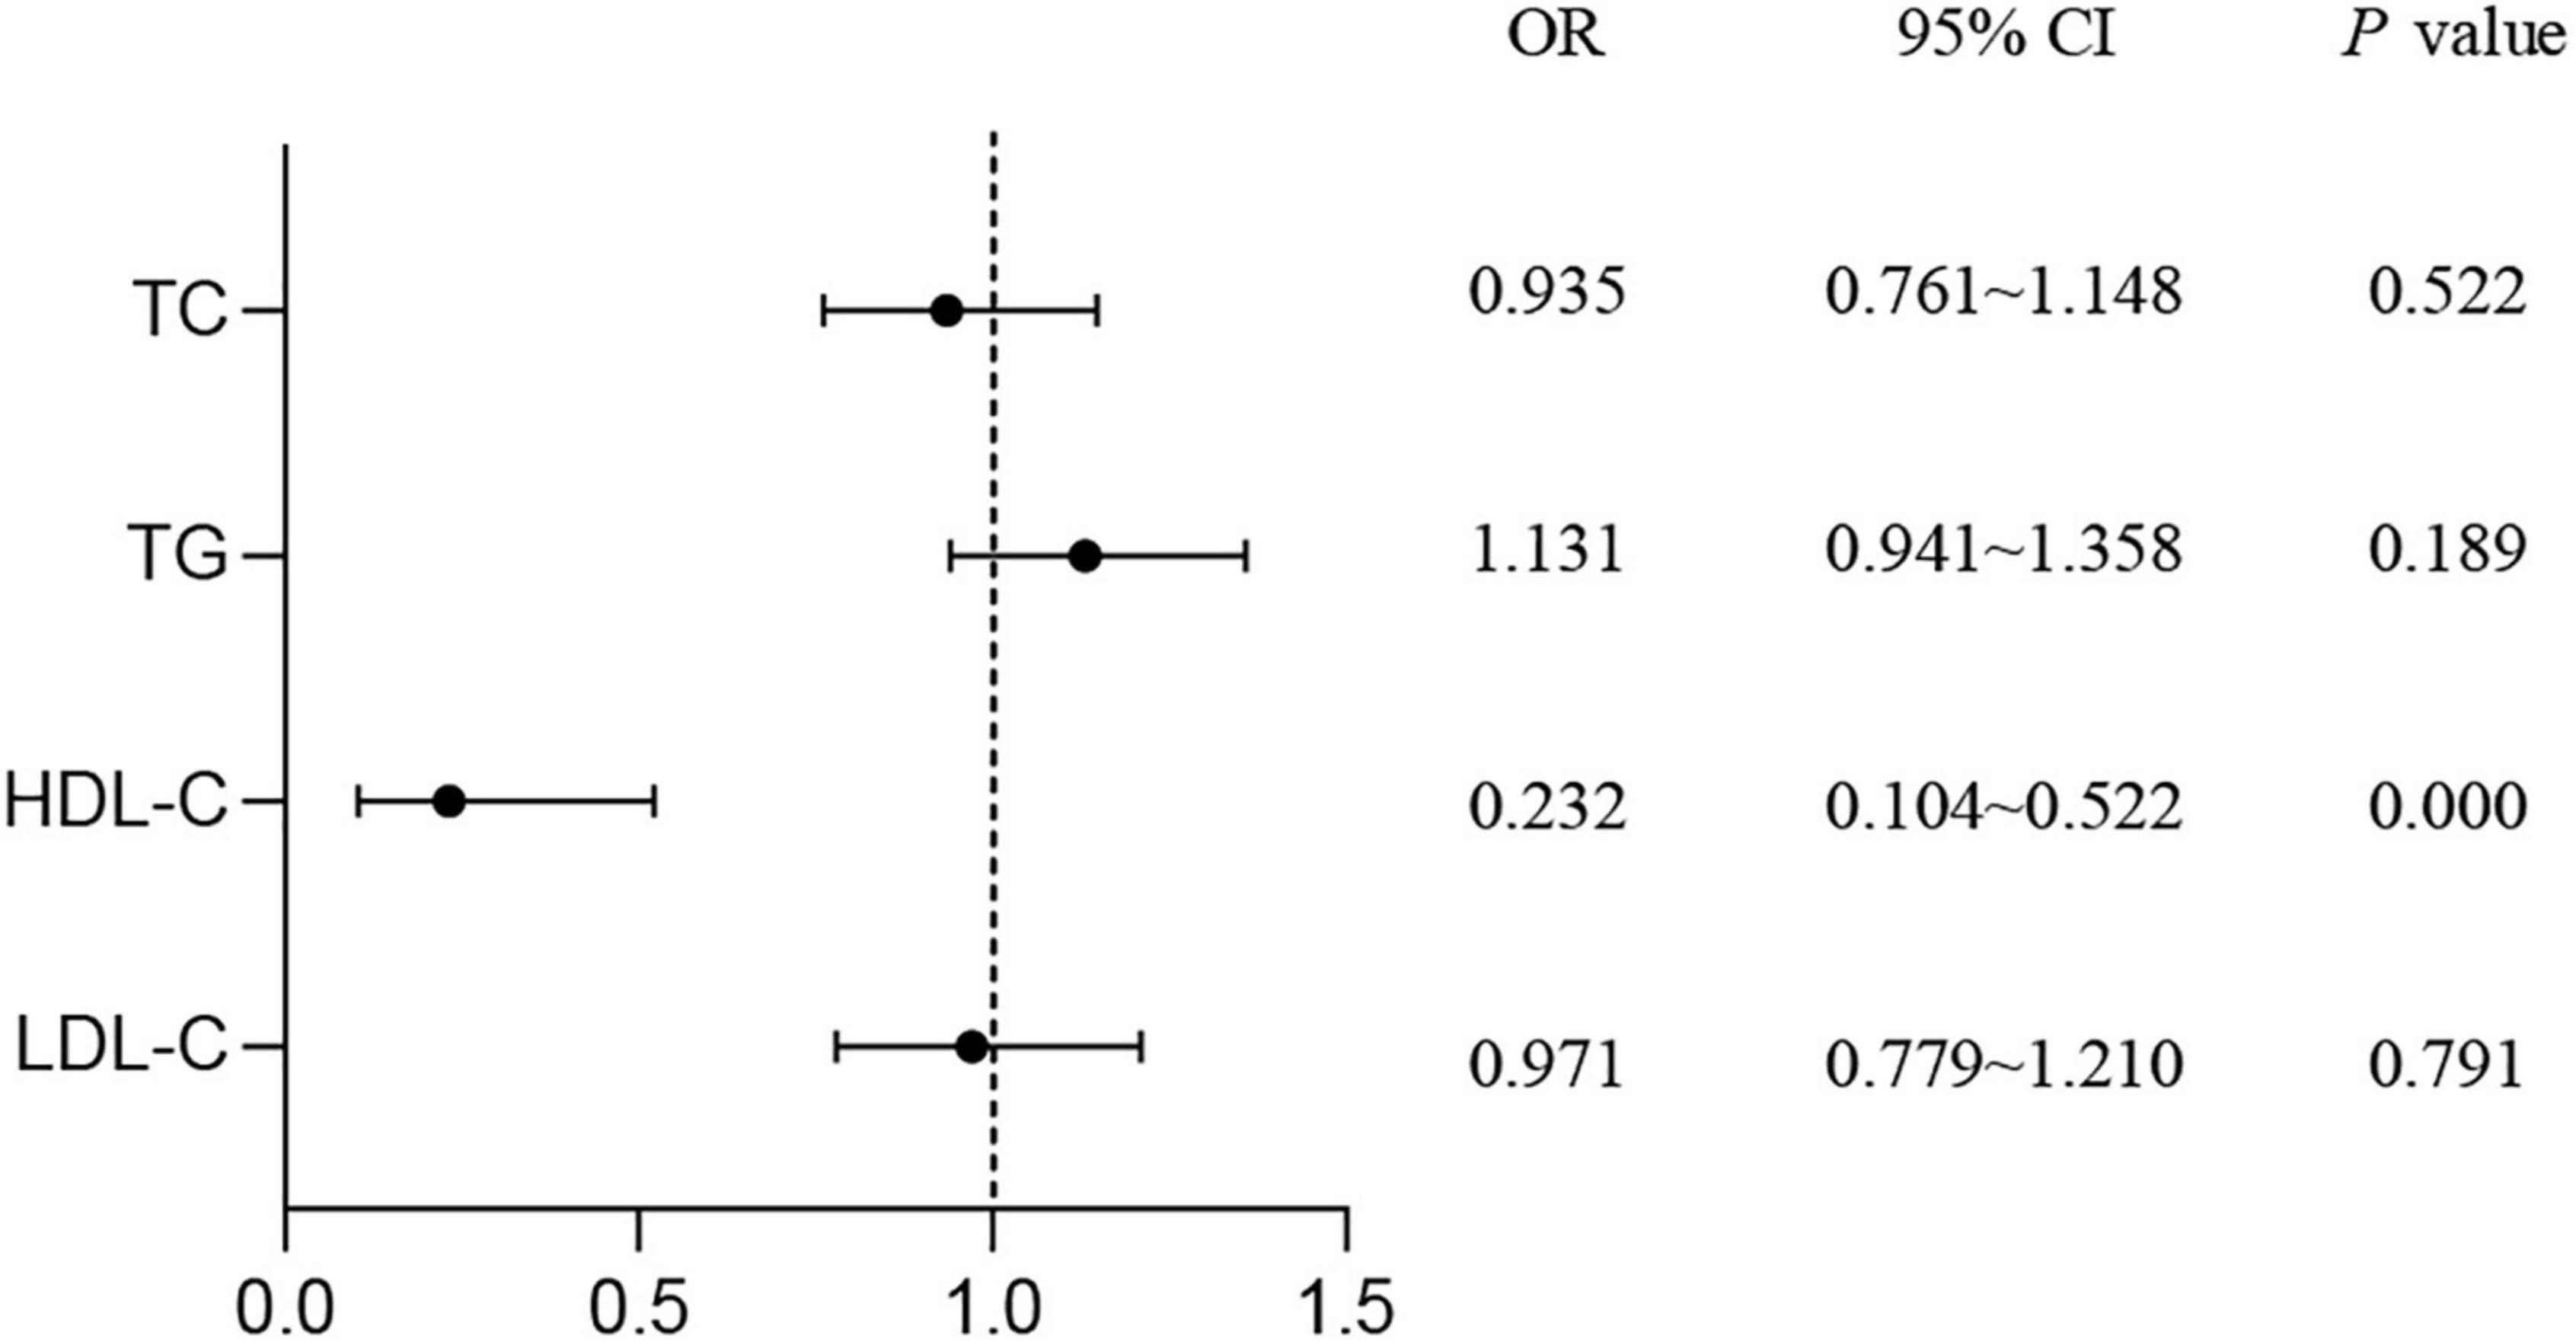
Figure 1. Study on the correlation of serum lipids with the risk of T2DM. Logistic regression was used to detect the risk of lipid levels for T2DM. P < 0.05 was considered as significant. TC, total cholesterol; TG, triglyceride; HDL-C, high-density lipoprotein cholesterol; LDL-C, low-density lipoprotein cholesterol; T2DM, type 2 diabetes mellitus; OR, odds ratio; CI, confidence interval.
The allele and genotype distribution of candidate genes in the type 2 diabetes mellitus and control groups
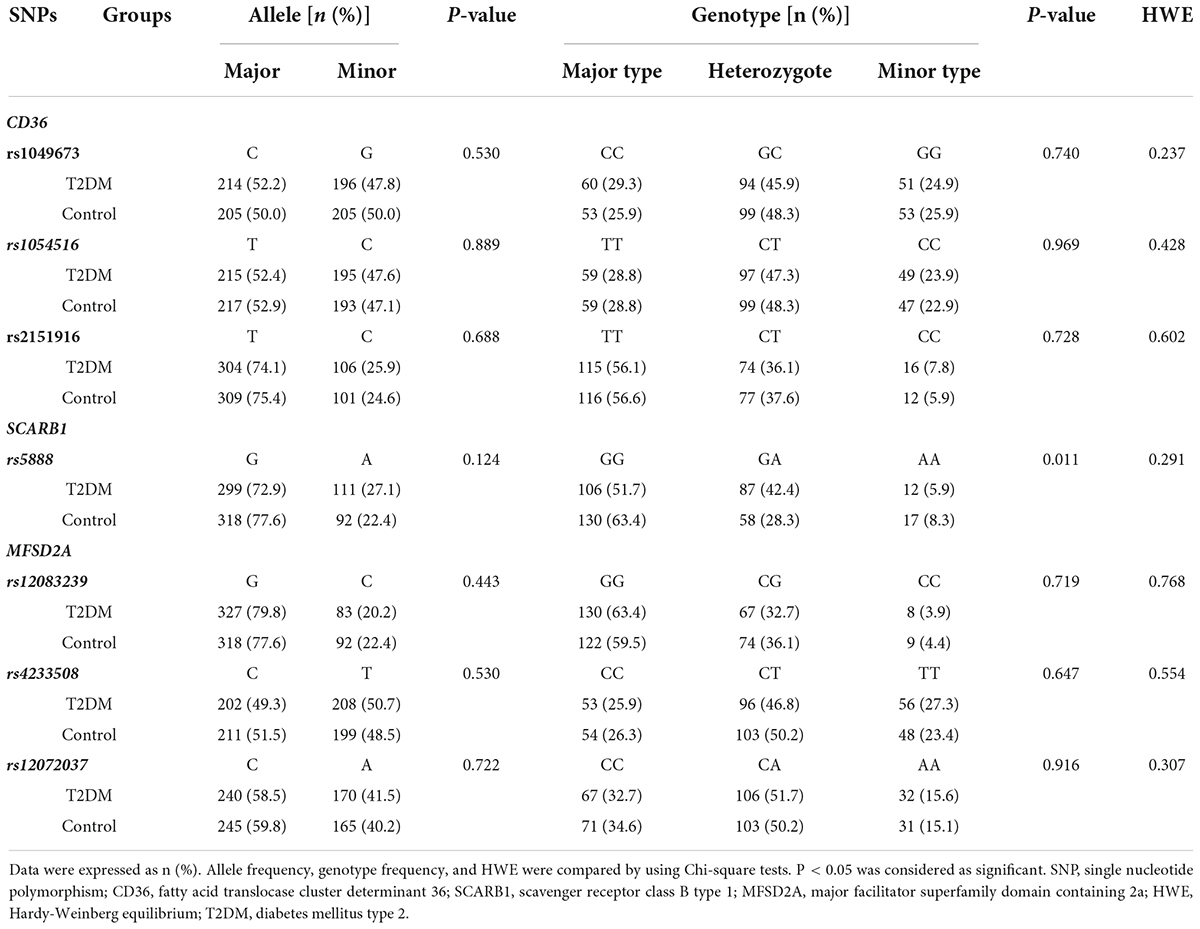
The allele and genotype frequency of the lipid metabolism-related genes in the T2DM and control groups are shown in Table 2. The genotype distribution of the 7 SNPs fitted the Hardy-Weinberg equilibrium (P > 0.05). No significant statistical difference was found in the allele frequency of SCARB1 rs5888 between T2DM and the control groups. However, the difference of SCARB1 rs5888 genotype frequency was detected between T2DM and control groups. Compared to the control group, a higher percentage of subjects with heterozygote (G/A) but a lower percentage of subjects with major (G/G) or minor (A/A) genotype were found in the T2DM group (P < 0.05). There was no significant difference in the allele and genotype frequency of the other SNPs between T2DM and control subjects (P > 0.05).
Association of lipid metabolism-related gene variants with the risk of type 2 diabetes mellitus
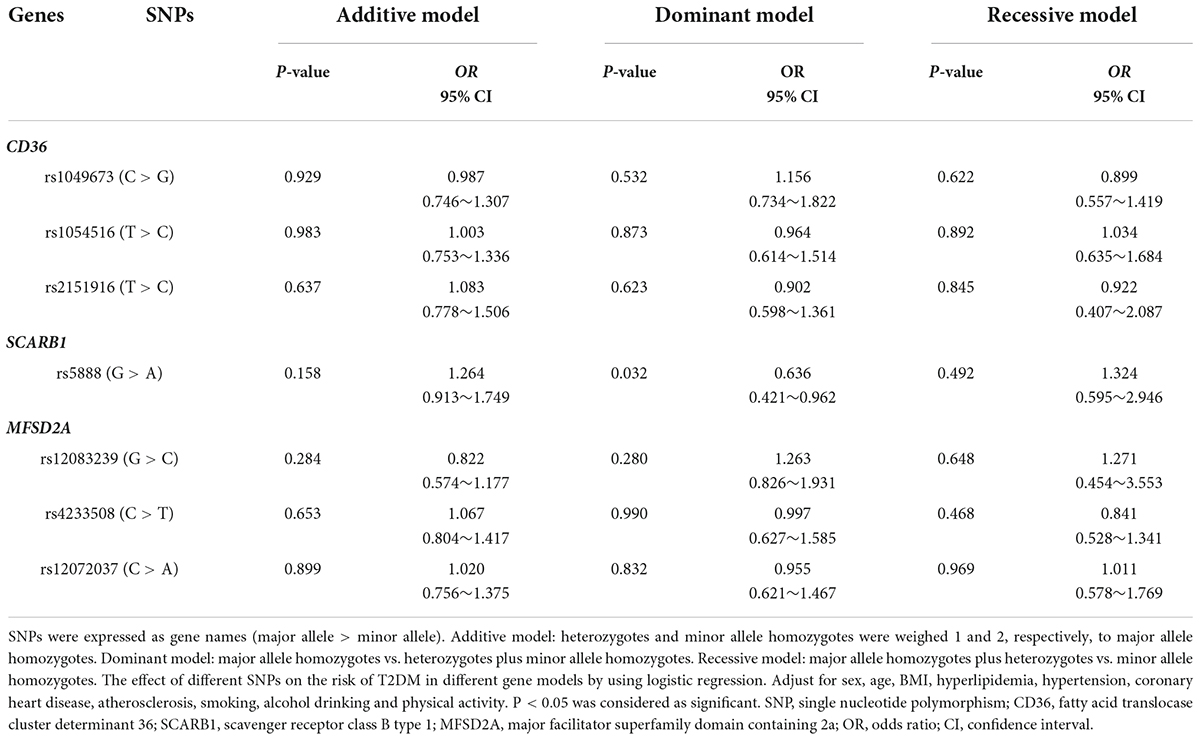
As shown in Table 3, the results of logistic regression analysis found that major allele homozygotes (GG) of SCARB1 rs5888 negatively correlated with the risk of T2DM in aging subjects with the OR value of 0.636 (95% CI: 0.421–0.962, P = 0.032) in dominant model. There was no statistical association between other SNPs and the risk of T2DM in aging subjects.
Correlation of alleles or genotypes with plasma lipids
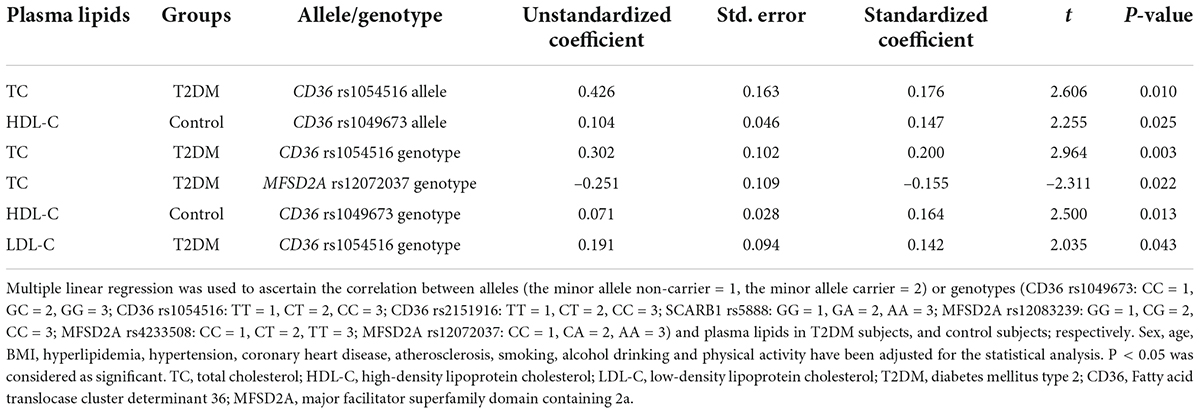
The result of multiple linear regression analysis between alleles or genotypes and plasma lipids is shown in Table 4. Plasma lipid levels were associated with allele or genotype of both CD36 and MFSD2A in T2DM subjects and control subjects (P < 0.05). The allele and genotype of CD36 rs1054516 were associated with TC in the T2DM population (P < 0.05). In T2DM subjects, plasma TC level also was MFSD2A rs12072037 genotype related (P < 0.05); and LDL-C level was CD36 rs1054516 genotype related (P < 0.05). The allele and genotype of CD36 rs1049673 were associated with HDL-C in the control subjects (P < 0.05).
Serum lipids according to genotype in type 2 diabetes mellitus and control subjects
Firstly, the difference of serum lipid was compared between T2DM and control groups according to different genotypes. As shown in Figure 2, that the relationship between serum TC level with both CD36 rs1054516 and MFSD2A rs12072037 was found in T2DM subjects. Subjects with CD36 rs1054516 minor genotype (CC) had higher TC level than subjects with major genotype (TT) (P < 0.05); and the subjects with MFSD2A rs12072037 minor genotype (AA) had lower TC level than the major allele (CC, CA) carrier (P < 0.05). In control group, subjects with CD36 rs1049673 minor genotype (GG) had higher HDL-C level than major genotype (CC) (P < 0.05). There was no difference of serum TC, TG, HDL-C and LDL-C levels between groups according to different genotypes (P > 0.05).
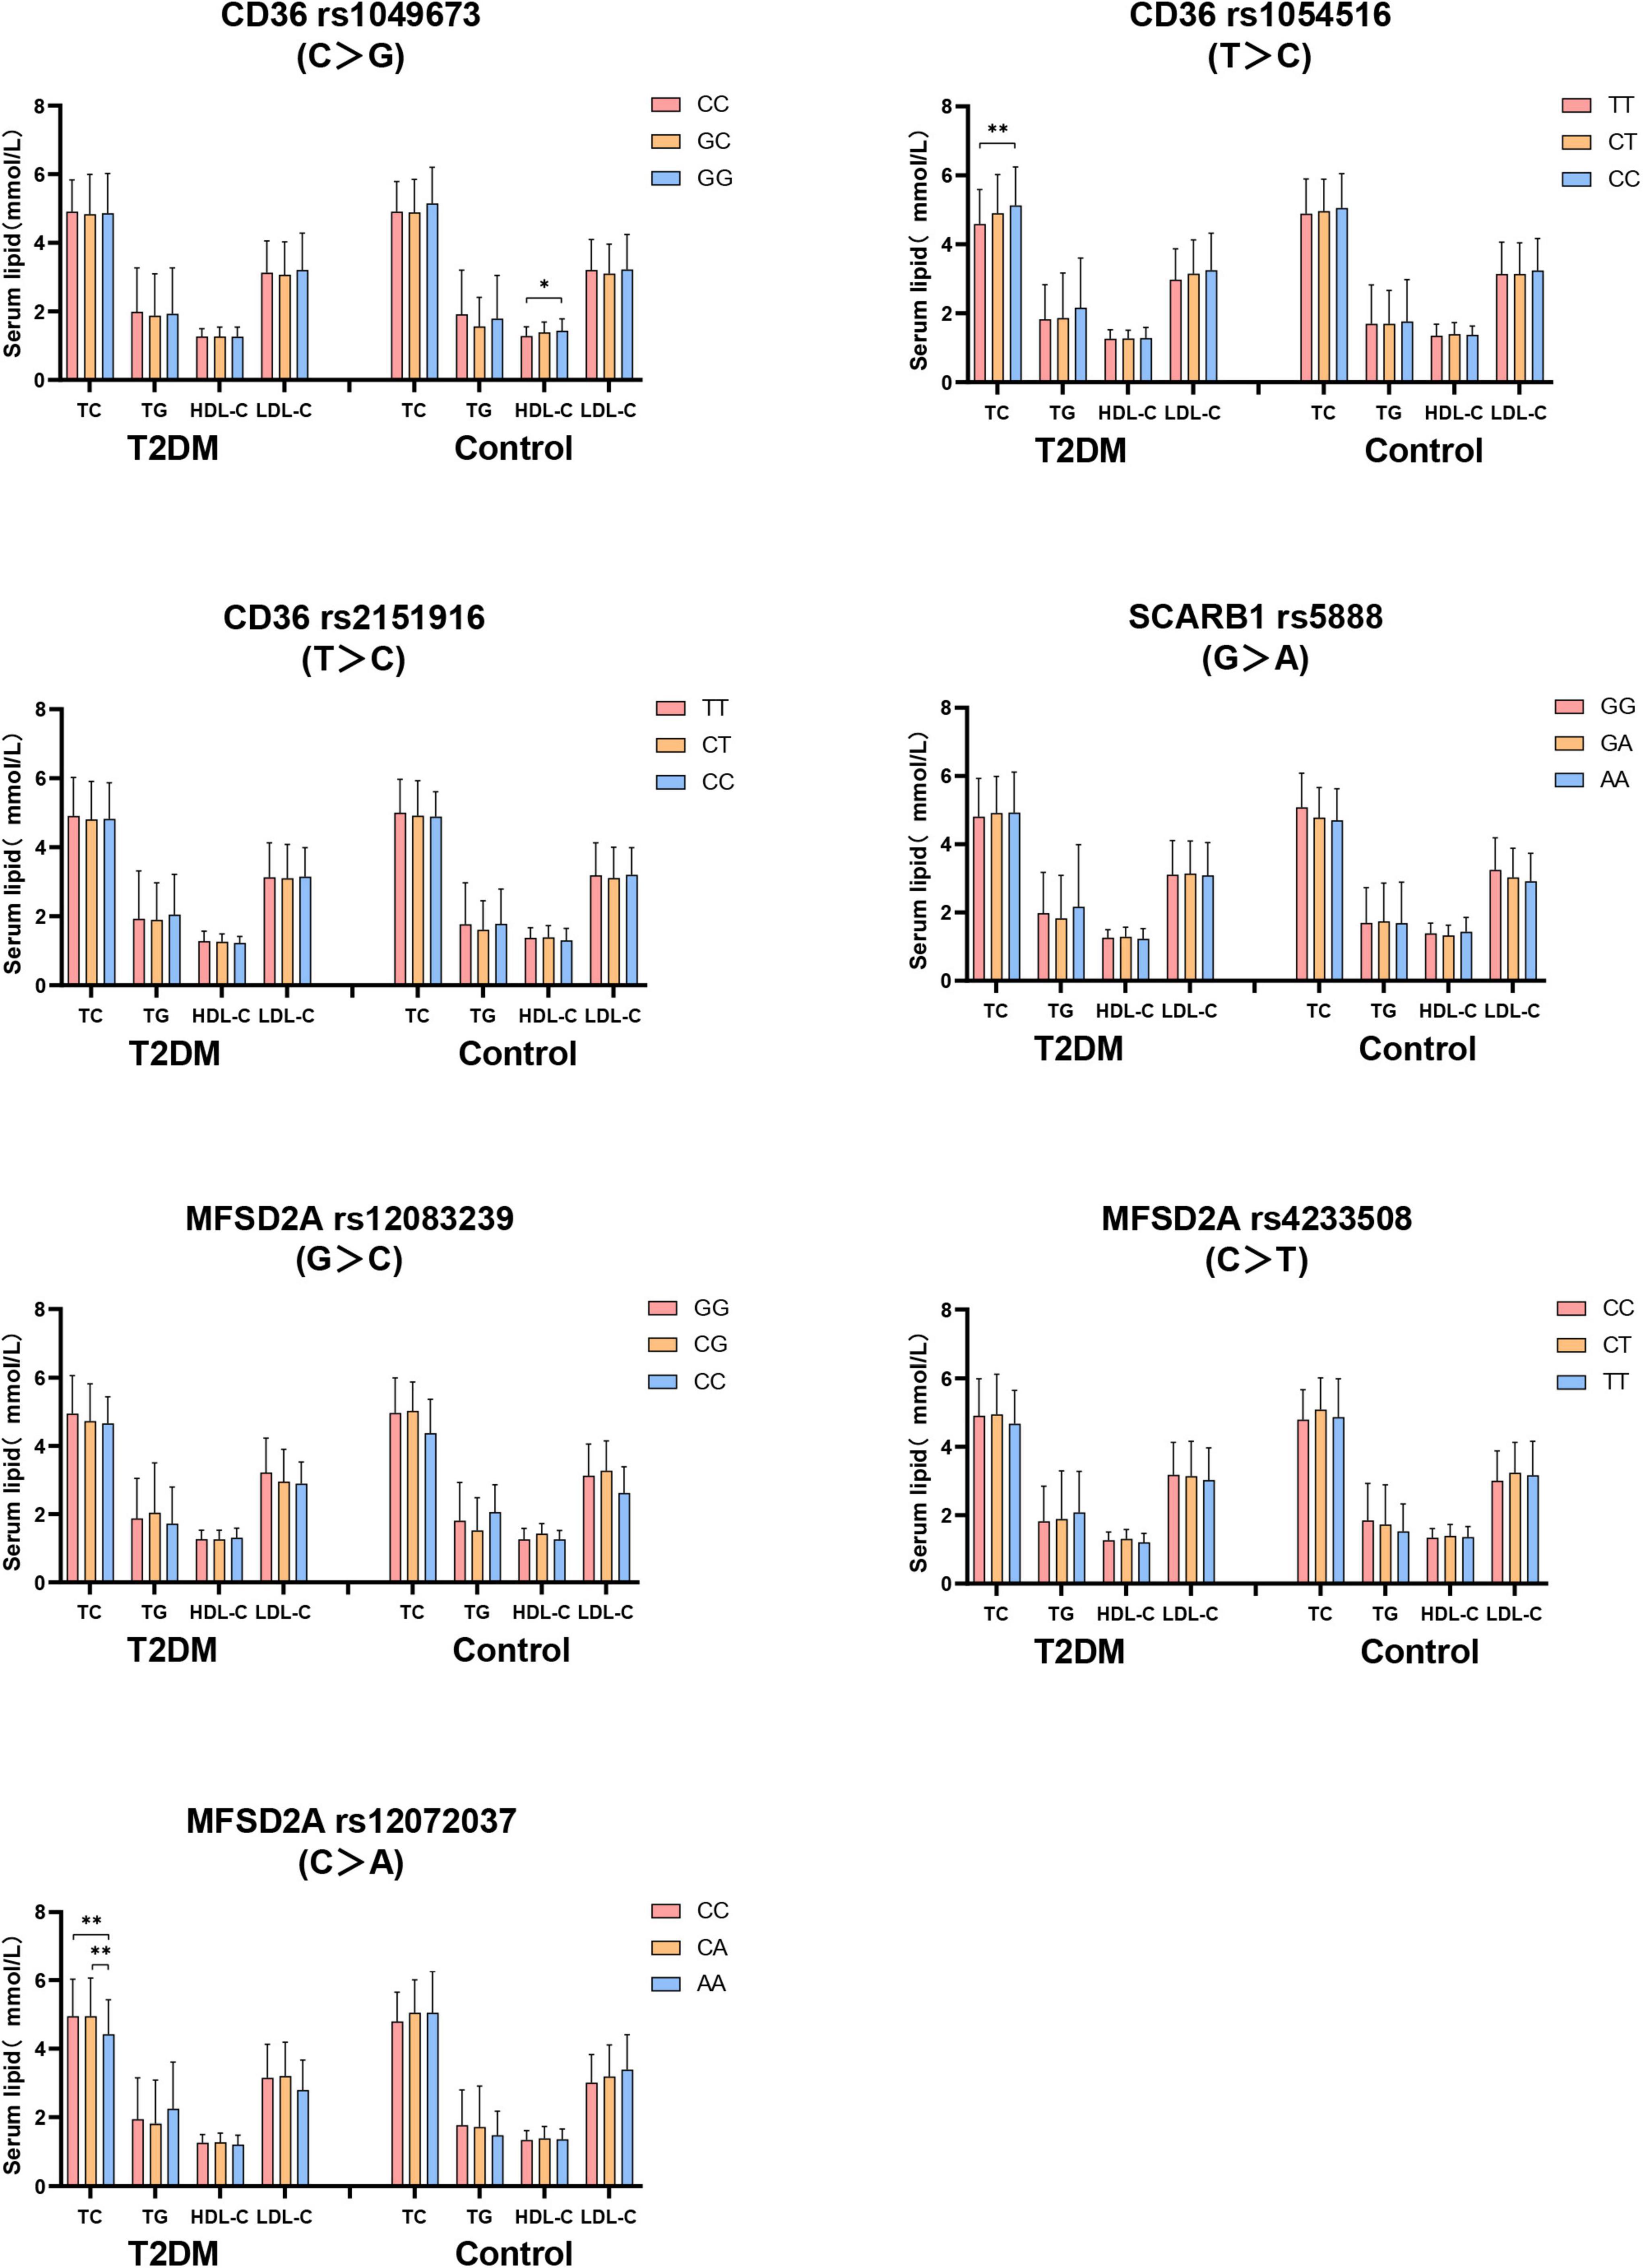
Figure 2. The difference of serum lipid between T2DM and control groups according to different genotypes. General linear model (GLM) was used to compare the means of the detected serum lipids between the groups. P < 0.05 was considered as significant (*P < 0.05; **P ≤ 0.01). Sex, age, BMI, hyperlipidemia, hypertension, coronary heart disease, atherosclerosis, smoking, alcohol drinking, and physical activity have been adjusted for the statistical analysis. TC, total cholesterol; TG, triglyceride; HDL-C, high-density lipoprotein cholesterol; LDL-C, low-density lipoprotein cholesterol, T2DM, type 2 diabetes mellitus; CD36, Fatty acid translocase cluster determinant 36; SCARB1, scavenger receptor class B type 1; MFSD2A, major facilitator superfamily domain containing 2a.
Secondly, the serum lipids between subjects with different genotypes were compared according to whether they were T2DM patients. As shown in Figure 3, no difference of serum TC level in subjects with different genotypes between T2DM and control groups. T2DM subjects with MFSD2A rs12083239 (CG), MFSD2A rs4233508 (TT) and MFSD2A rs12072037 (AA) displayed higher TG level than the control subjects (P < 0.05). Serum HDL-C level was associated with the genetic polymorphism of CD36, SCARB1 and MFSD2A. T2DM patients with CD36 rs1049673 (CG, GG), CD36 rs1054516 (CT), CD36 rs2151916 (TT, CT), SCARB1 rs5888 (GG), MFSD2A rs12083239 (GG, CG), MFSD2A rs4233508 (TT) and MFSD2A rs12072037 (CA, AA) genotypes had lower HDL-C level than the control ones (P < 0.05). And the T2DM subjects with MFSD2A rs12072037 (AA) genotype showed lower LDL-C level than the control subjects (P < 0.05).
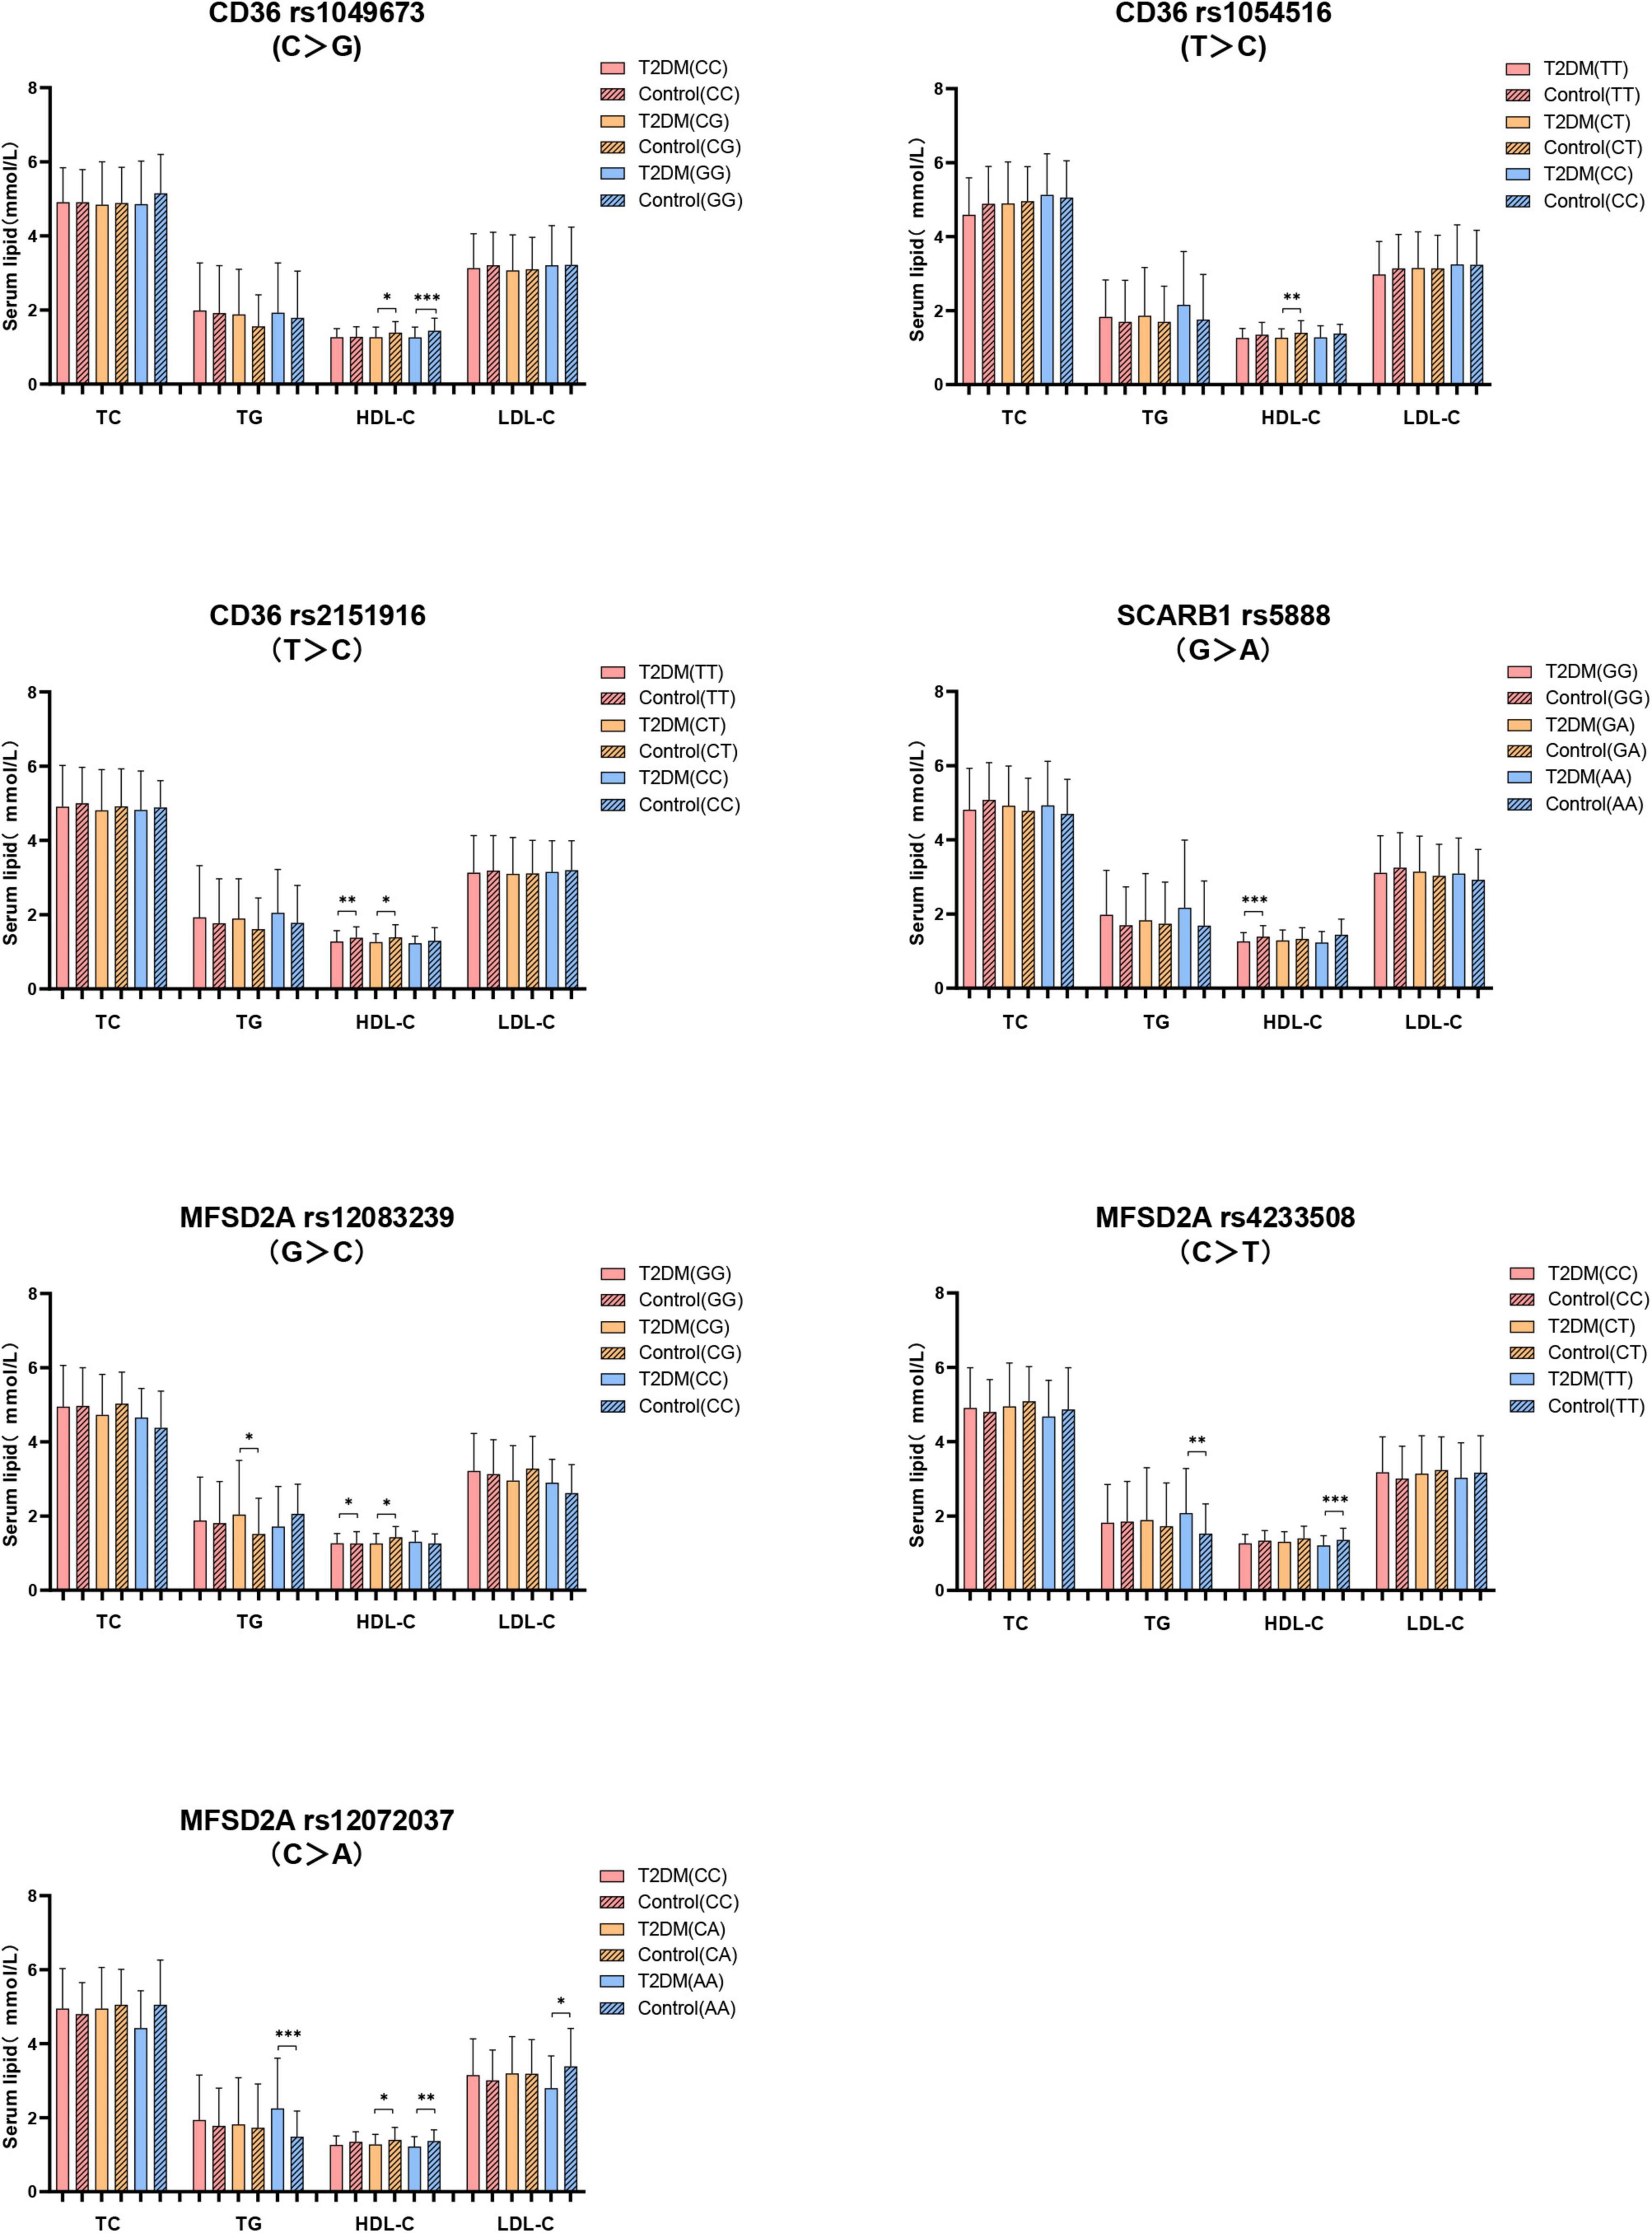
Figure 3. The difference of serum lipids between subjects with different genotypes according to whether they were T2DM patients. General linear model (GLM) was used to compare the means of the detected serum lipids between the groups. P < 0.05 was considered as significant (*P < 0.05; **P ≤ 0.01; ***P ≤ 0.001). Sex, age, BMI, hyperlipidemia, hypertension, coronary heart disease, atherosclerosis, smoking, alcohol drinking, and physical activity have been adjusted for the statistical analysis. TC, total cholesterol; TG, triglyceride; HDL-C, high-density lipoprotein cholesterol; LDL-C, low-density lipoprotein cholesterol, T2DM, type 2 diabetes mellitus; CD36, Fatty acid translocase cluster determinant 36; SCARB1, scavenger receptor class B type 1; MFSD2A, major facilitator superfamily domain containing 2a.
Discussion
Studies found that elevation of insulin during insulin resistance affects the lipid metabolism (27, 28), and resulting in the disturbed plasma lipid level (29, 30). Jaiswal et al. proposed that T2DM patients mostly have the characteristic pattern of diabetic dyslipidemia, which was demonstrated by higher TG level, lower HDL-C level and the predominance of small dense LDL particles (31). Consistent with these reports, in our study, we found that the prevalence of hyperlipidemia (47.8% vs. 27.8%) and atherosclerosis (17.1% vs. 10.2%), as well as lower HDL-C level in the T2DM patients and they were significantly higher than that in the control subjects, indicating that the T2DM patients were associated with increased risk to have lipid metabolic disorder-related chronic diseases.
The association between insulin resistance and low circulating HDL-C level was found in T2DM patients (31–33). Elevating HDL-C level could reduce blood glucose level through various mechanisms, such as affecting pancreatic beta cells secret insulin, promoting insulin-independent glucose uptake, and enhancing tissue sensitivity to insulin (34, 35). The Prevention of Renal and Vascular End-Stage Disease (PREVEND) study reported that higher circulating HDL-C level predicted decreased the risk for T2DM with OR value was 0.55 (95% CI: 0.47–0.64) (36), suggesting HDL-C was a potential protective factor for T2DM. Consistently, in our study, we found that T2DM patients displayed lower plasma HDL-C level than the control ones, and the results of regression analysis also indicated a significant protective role of HDL-C in decreasing the risk for T2DM (OR = 0.232, 95% CI: 0.104–0.522). The study reported a “U-shaped” dose-response relationship between serum HDL-C and the risk of overall all-cause mortality (37). Together with our results, we speculate that optimal circulating HDL-C level might decrease the risk for T2DM in aging subjects.
The close relationship between T2DM and abnormal lipid metabolism, and the role of lipid metabolism-related gene variants in the relationship between serum lipid and diabetes are worthy of exploration. Pérez-Martínez et al. reported that the insulin sensitivity of T2DM patients carrying SCARB1 rs4238001 GA genotype is significantly increased as compared with those carrying GG after ingestion of monounsaturated fatty acids (23), suggesting the impact of the SCARB1 genetic variants on modifying the susceptibility of T2DM patients to lipid metabolism. In the current study, we found that the genotype frequency of SCARB1 rs5888 was different between the T2DM and the control subjects, as demonstrated by higher frequency of heterozygotes (GA) genotype in the T2DM patients than the control ones. The association of SCARB1 rs5888 genetic polymorphism with the risk of T2DM was found in the dominant model, which was demonstrated by a decreased risk for T2DM in subjects with the major genotype (GG) as compared with the minor allele carrier (GA, AA) (OR = 0.636, 95% CI: 0.421–0.962). Studies reported that genetic variation of the SCARB1 gene affected SCARB1 gene expression, resulting in the change of circulating lipids profile, especially the level of HDL (38, 39). Smalinskiene et al. observed that male subjects with the SCARB1 rs5888 CT genotype had significantly lower serum TG levels than the subjects with CC genotype (P < 0.05) (40). In our study, we did not observe the relationship between plasma TG and SCARB1 rs5888 genetic variation. However, we found that the plasma HDL-C level of T2DM subjects carrying major genotype (GG) was significantly lower than that in control subjects. These results indicated that the major genotype (GG) of SCARB1 rs5888 may play a protective role in T2DM through affecting plasma HDL-C level.
Significant relationship between the CD36 rs3211938 genotype as well as the minor alleles of CD36 SNPs (rs1984112 “G,” rs1527479 “C,” rs3211938 “G”) with clinical profiles in T2DM patients has been reported in previous study (20). The impact of CD36 SNPs (rs1761667 “A,” rs3211938 “G,” rs1984112 “G”) on increasing body weight, BMI and the risk of T2DM was also demonstrated (41). Zhang et al.’s study observed that overweight or obesity patients carrying CD36 rs7755 mutant allele showed increased risk for T2DM by 114% (OR = 2.14, 95% CI: 1.33–3.46; P = 0.007) (42). Study have found that CD36 genetic variants are associated with serum TG and HDL-C levels in Chinese population. Subjects with rs3211848 minor genotype (AA) had higher TG level than those with major genotype (GG), and subjects with rs1054516 minor allele carrier (CC, CT) had lower HDL-C level than those with major genotype (TT) (43). In our study, we did not find the relationship between CD36 rs1054516 genotype and HDL-C in T2DM patients. While the T2DM subjects carrying the minor genotype (CC) of CD36 rs1054516 showed increased TC level than the subjects carrying the major genotype (TT). In contrast, in control group, increased plasma HDL-C level was observed in the subjects with the minor genotype (GG) of CD36 rs1049673 as compared with the subjects carrying the major genotype (CC). Moreover, the serum HDL-C level of T2DM patients with CD36 rs1049673 (CG, GG), CD36 rs1054516 (CT), CD36 rs2151916 (TT, CT) genotypes was lower than the control subjects. These results indicated that CD36 genetic variants mainly affect the circulating lipid profile through the regulation of TC and HDL-C, and the T2DM subjects with CD36 rs1049673, rs1054516, and rs2151916 genetic variants are prone to have dyslipidemia.
The study reported that fasting could induce the hepatic MFSD2A mRNA expression in a β-adrenergic signaling-dependent manner in experimental animals (44). Additionally, MFSD2A gene knockout mice showed slimmer bodies, increased energy expenditure, and reduced serum TG level (24), suggesting the involvement of MFSD2A in lipid metabolism and energy metabolism expenditure. In our study, we consistently observed the association of MFSD2A genetic polymorphism with lipids. We found that the T2DM subjects with MFSD2A rs12083239 (CG), MFSD2A rs4233508 (TT), and MFSD2A rs12072037 (AA) displayed increased plasma TG level in comparison with control subjects. Besides, the T2DM subjects with MFSD2A rs12083239 (GG, CG), MFSD2A rs4233508 (TT), and MFSD2A rs12072037 (CA, AA) genotypes showed lower HDL-C level than control subjects. These results indicated that the MFSD2A genetic variants mainly affect circulating lipids through regulating the TG and HDL-C levels, and T2DM subjects with MFSD2A rs12083239, rs4233508, and rs12072037 genetic variants are prone to have abnormal circulating TG and HDL-C levels.
In this study, we found that subjects with minor allele genotypes (GA, GG) of the SCARB1 gene were associated with an increased risk of T2DM, which demonstrated that, for healthy carriers of this gene, regularly monitor of circulating lipids (especially the HDL-C level) and blood glucose levels might be benefit to reduce the risk of T2DM. Therefore, for patients with the SNPs mentioned above, more attention should be paid to lipid management to reduce the risk of dyslipidemia-based complications. This will provide a scientific basis for clinicians to efficiently prevent and treat T2DM and dyslipidemia according to individual’s genetic background.
There are several potential limitations in this study. Firstly, the study was conducted in Chinese population, the difference in lifestyle, living conditions and diet pattern makes the extrapolation of our conclusion to other population should be with caution. Secondly, environmental and genetic factors are regulators of an individual’s lipid profile, the interaction between environment and genetic factors were not measured in our study, and this should be taken into consideration during decomposing the relationship between genetic factors, serum lipids and T2DM in the future. Thirdly, the treatment and management of the T2DM subjects were another potential confounding factor, which should be considered in future large-scale cohort studies. Finally, the relatively small sample size is another limitation of the study, and population-based large scale cohort studies are needed to verify the accurate relationship between lipid metabolism-related gene polymorphism, lipids and T2DM in aging subjects in the future.
Conclusion
In summary, our data implicated the association of lipid metabolism-related gene genetic variation, serum lipid level with T2DM in aging subjects. Genetic variants of SCARB1 are associated with an increased risk of T2DM. Plasma TC, HDL-C and TG levels were related to CD36, SCARB1 and MFSD2A genetic polymorphism in T2DM subjects. Large-scale population-based cohort studies are needed to reveal the biological interactional mechanism between lipid metabolism-related gene polymorphism, serum lipid level and T2DM in aging subjects.
Data availability statement
The original contributions presented in this study are included in the article/Supplementary material, further inquiries can be directed to the corresponding author/s.
Ethics statement
The studies involving human participants were reviewed and approved by the Committee on Medical Ethics of Capital Medical University. The patients/participants provided their written informed consent to participate in this study.
Author contributions
LY designed the study. XW, JX, XM, YG, and HY conducted the investigation and collected the blood sample. XW performed the data statistical analysis. XW, LY, and SZ drafted the manuscript. All authors reviewed the manuscript, read, and approved the final manuscript.
Funding
This study was supported by the National Natural Science Foundation of China (grant nos. 82173508 and 81973027) and the Beijing High-level Public Health Technical Personnel Training Program (grant no. 2022-3-032).
Acknowledgments
We thank all study participants for their participation.
Conflict of interest
The authors declare that the research was conducted in the absence of any commercial or financial relationships that could be construed as a potential conflict of interest.
Publisher’s note
All claims expressed in this article are solely those of the authors and do not necessarily represent those of their affiliated organizations, or those of the publisher, the editors and the reviewers. Any product that may be evaluated in this article, or claim that may be made by its manufacturer, is not guaranteed or endorsed by the publisher.
Supplementary material
The Supplementary Material for this article can be found online at: https://www.frontiersin.org/articles/10.3389/fnut.2022.981200/full#supplementary-material
References
1. Roden M, Shulman GI. The integrative biology of type 2 diabetes. Nature. (2019) 576:51–60. doi: 10.1038/s41586-019-1797-8
2. Galicia-Garcia U, Benito-Vicente A, Jebari S, Larrea-Sebal A, Siddiqi H, Uribe KB, et al. Pathophysiology of type 2 diabetes mellitus. Int J Mol Sci. (2020) 21:6275. doi: 10.3390/ijms21176275
3. Montgomery MK, De Nardo W, Watt MJ. Impact of lipotoxicity on tissue “cross talk” and metabolic regulation. Physiology. (2019) 34:134–49. doi: 10.1152/physiol.00037.2018
4. Rać ME, Safranow K, Poncyljusz W. Molecular basis of human Cd36 gene mutations. Mol Med. (2007) 13:288–96. doi: 10.2119/2006-00088.Rac
5. Handberg A, Levin K, Højlund K, Beck-Nielsen H. Identification of the oxidized low-density lipoprotein scavenger receptor Cd36 in plasma: a novel marker of insulin resistance. Circulation. (2006) 114:1169–76. doi: 10.1161/CIRCULATIONAHA.106.626135
6. Trigatti BL. Sr-B1 and Pdzk1: partners in Hdl regulation. Curr Opin Lipidol. (2017) 28:201–8. doi: 10.1097/MOL.0000000000000396
7. Shen W-J, Azhar S, Kraemer FB. Sr-B1: a unique multifunctional receptor for cholesterol influx and efflux. Annu Rev Physiol. (2018) 80:95–116. doi: 10.1146/annurev-physiol-021317-121550
8. Nguyen LN, Ma D, Shui G, Wong P, Cazenave-Gassiot A, Zhang X, et al. Mfsd2a is a transporter for the essential omega-3 fatty acid docosahexaenoic acid. Nature. (2014) 509:503–6. doi: 10.1038/nature13241
9. Eser Ocak P, Ocak U, Sherchan P, Zhang JH, Tang J. Insights into major facilitator superfamily domain-containing protein-2a (Mfsd2a) in physiology and pathophysiology. What do we know so far? J Neurosci Res. (2020) 98:29–41. doi: 10.1002/jnr.24327
10. Flannick J, Florez JC. Type 2 diabetes: genetic data sharing to advance complex disease research. Nat Rev Genet. (2016) 17:535–49. doi: 10.1038/nrg.2016.56
11. Wang X, Strizich G, Hu Y, Wang T, Kaplan RC, Qi Q. Genetic markers of type 2 diabetes: progress in genome-wide association studies and clinical application for risk prediction. J Diabetes. (2016) 8:24–35. doi: 10.1111/1753-0407.12323
12. Mattis KK, Gloyn AL. From genetic association to molecular mechanisms for islet-cell dysfunction in type 2 diabetes. J Mol Biol. (2020) 432:1551–78. doi: 10.1016/j.jmb.2019.12.045
13. Jahantigh D, Mirani Sargazi F, Sargazi S, Saravani R, Ghazaey Zidanloo S, Heidari Nia M, et al. Relationship between functional cluster variants and susceptibility to type 2 diabetes mellitus: a preliminary case-control study and bioinformatics analyses. Endocr Res. (2021) 46:129–39. doi: 10.1080/07435800.2021.1914079
14. Sargazi S, Nia MH, Saravani R, Shahroudi MJ, Jahantigh D, Shakiba M. Igf2bp2 polymorphisms as genetic biomarkers for either schizophrenia or type 2 diabetes mellitus: a case-control study. Gene Rep. (2020) 20:100680. doi: 10.1016/j.genrep.2020.100680
15. Sadeghi MB, Nakhaee A, Saravani R, Sargazi S. Significant association of polymorphisms (Rs28514894, Rs2303044) with type 2 diabetes mellitus and laboratory characteristics. J Diabetes Metab Disord. (2021) 20:261–70. doi: 10.1007/s40200-021-00740-3
16. Sargazi S, Heidari Nia M, Sargazi FM, Sheervalilou R, Saravani R, Mirinejad S. Snps in the 3’-untranslated region of confer risk of type 2 diabetes mellitus in a South-East Iranian population: evidences from case-control and bioinformatics studies. J Diabetes Metab Disord. (2020) 19:979–88. doi: 10.1007/s40200-020-00590-5
17. Sargazi S, Mollashahi B, Sargazi S, Nia MH, Saravani R, Mirinejad S, et al. Prevalence of Mir146a gene polymorphisms in diabetic and non-diabetic patients with chronic kidney disease. Iran J Sci Technol Trans A Sci. (2022) 46:21–31. doi: 10.1007/s40995-021-01229-7
18. Galavi H, Noorzehi N, Saravani R, Sargazi S, Mollashahee-Kohkan F, Shahraki H. Genetic polymorphism in Adrb-1 is associated with type 2 diabetes susceptibility in Iranian population. Gene Rep. (2018) 12:171–4. doi: 10.1016/j.genrep.2018.06.019
19. Lotta LA, Sharp SJ, Burgess S, Perry JRB, Stewart ID, Willems SM, et al. Association between low-density lipoprotein cholesterol-lowering genetic variants and risk of type 2 diabetes: a meta-analysis. JAMA. (2016) 316:1383–91. doi: 10.1001/jama.2016.14568
20. Gautam S, Pirabu L, Agrawal CG, Banerjee M. Cd36 gene variants and their association with type 2 diabetes in an Indian population. Diabetes Technol Ther. (2013) 15:680–7. doi: 10.1089/dia.2012.0326
21. Moon JS, Karunakaran U, Suma E, Chung SM, Won KC. The role of Cd36 in type 2 diabetes mellitus: B -cell dysfunction and beyond. Diabetes Metab J. (2020) 44:222–33. doi: 10.4093/dmj.2020.0053
22. Gautam S, Banerjee M. The macrophage Ox-Ldl receptor, Cd36 and its association with type ii diabetes mellitus. Mol Genet Metab. (2011) 102:389–98. doi: 10.1016/j.ymgme.2010.12.012
23. Pérez-Martínez P, Pérez-Jiménez F, Bellido C, Ordovás JM, Moreno JA, Marín C, et al. A polymorphism exon 1 variant at the locus of the scavenger receptor class b type i (Scarb1) gene is associated with differences in insulin sensitivity in healthy people during the consumption of an olive oil-rich diet. J Clin Endocrinol Metab. (2005) 90:2297–300. doi: 10.1210/jc.2004-1489
24. Berger JH, Charron MJ, Silver DL. Major facilitator superfamily domain-containing protein 2a (Mfsd2a) has roles in body growth, motor function, and lipid metabolism. PLoS One. (2012) 7:e50629. doi: 10.1371/journal.pone.0050629
25. Nierenberg DW, Nann SL. A method for determining concentrations of retinol, tocopherol, and five carotenoids in human plasma and tissue samples. Am J Clin Nutr. (1992) 56:417–26. doi: 10.1093/ajcn/56.2.417
26. Du W, Cheng J, Ding H, Jiang Z, Guo Y, Yuan HA. Rapid method for simultaneous multi-gene mutation screening in children with nonsyndromic hearing loss. Genomics. (2014) 104:264–70. doi: 10.1016/j.ygeno.2014.07.009
27. Huang Z, Huang L, Waters MJ, Chen C. Insulin and growth hormone balance: implications for obesity. Trends Endocrinol Metab. (2020) 31:642–54. doi: 10.1016/j.tem.2020.04.005
28. Siddle K. Signalling by insulin and igf receptors: supporting acts and new players. J Mol Endocrinol. (2011) 47:R1–10. doi: 10.1530/JME-11-0022
29. Boden G. Obesity, insulin resistance and free fatty acids. Curr Opin Endocrinol Diabetes Obes. (2011) 18:139–43. doi: 10.1097/MED.0b013e3283444b09
30. Wilding JPH. The importance of free fatty acids in the development of type 2 diabetes. Diabet Med. (2007) 24:934–45.
31. Jaiswal M, Schinske A, Pop-Busui R. Lipids and lipid management in diabetes. Best Pract Res Clin Endocrinol Metab. (2014) 28:325–38. doi: 10.1016/j.beem.2013.12.001
32. Gatti A, Maranghi M, Bacci S, Carallo C, Gnasso A, Mandosi E, et al. Poor glycemic control is an independent risk factor for low Hdl cholesterol in patients with type 2 diabetes. Diabetes Care. (2009) 32:1550–2. doi: 10.2337/dc09-0256
33. Drexel H, Aczel S, Marte T, Benzer W, Langer P, Moll W, et al. Is atherosclerosis in diabetes and impaired fasting glucose driven by elevated Ldl cholesterol or by decreased Hdl cholesterol? Diabetes Care. (2005) 28:101–7.
34. Siebel AL, Heywood SE, Kingwell BA. Hdl and glucose metabolism: current evidence and therapeutic potential. Front Pharmacol. (2015) 6:258. doi: 10.3389/fphar.2015.00258
35. Drew BG, Rye K-A, Duffy SJ, Barter P, Kingwell BA. The emerging role of Hdl in glucose metabolism. Nat Rev Endocrinol. (2012) 8:237–45. doi: 10.1038/nrendo.2011.235
36. Abbasi A, Corpeleijn E, Gansevoort RT, Gans ROB, Hillege HL, Stolk RP, et al. Role of Hdl cholesterol and estimates of Hdl particle composition in future development of type 2 diabetes in the general population: the prevend study. J Clin Endocrinol Metab. (2013) 98:E1352–9. doi: 10.1210/jc.2013-1680
37. Ko DT, Alter DA, Guo H, Koh M, Lau G, Austin PC, et al. High-density lipoprotein cholesterol and cause-specific mortality in individuals without previous cardiovascular conditions: the canheart study. J Am Coll Cardiol. (2016) 68:2073–83. doi: 10.1016/j.jacc.2016.08.038
38. Hu S, Hu D, Wei H, Li S-Y, Wang D, Li C-Z, et al. Functional deletion/insertion promoter variants in associated with increased susceptibility to lipid profile abnormalities and coronary heart disease. Front Cardiovasc Med. (2021) 8:800873. doi: 10.3389/fcvm.2021.800873
39. Hsu L-A, Ko Y-L, Wu S, Teng M-S, Peng T-Y, Chen C-F, et al. Association between a novel 11-base pair deletion mutation in the promoter region of the scavenger receptor class B type i gene and plasma Hdl cholesterol levels in Taiwanese chinese. Arterioscler Thromb Vasc Biol. (2003) 23:1869–74. doi: 10.1161/01.ATV.0000082525.84814.A9
40. Smalinskiene A, Petkeviciene J, Luksiene D, Jureniene K, Klumbiene J, Lesauskaite V. Association between apoe, scarb1, Pparα polymorphisms and serum lipids in a population of lithuanian adults. Lipids Health Dis. (2013) 12:120. doi: 10.1186/1476-511X-12-120
41. Gautam S, Agrawal CG, Banerjee M. Cd36 gene variants in early prediction of type 2 diabetes mellitus. Genet Test Mol Biomarkers. (2015) 19:144–9. doi: 10.1089/gtmb.2014.0265
42. Zhang D, Zhang R, Liu Y, Sun X, Yin Z, Li H, et al. Cd36 gene variants is associated with type 2 diabetes mellitus through the interaction of obesity in rural chinese adults. Gene. (2018) 659:155–9. doi: 10.1016/j.gene.2018.03.060
43. Chien K-L, Hsu H-C, Liu P-H, Lin H-J, Chen M-F. Common sequence variants in Cd36 gene and the levels of triglyceride and high-density lipoprotein cholesterol among ethnic chinese in Taiwan. Lipids Health Dis. (2012) 11:174. doi: 10.1186/1476-511X-11-174
Keywords: serum lipid profile, type 2 diabetes mellitus, lipid metabolism-related gene, genetic polymorphism, the elderly
Citation: Wang X, Ma X, Xu J, Guo Y, Zhou S, Yu H and Yuan L (2022) Association of cluster determinant 36, scavenger receptor class B type 1, and major facilitator superfamily domain containing the 2a genetic polymorphism with serum lipid profile in aging population with type 2 diabetes mellitus. Front. Nutr. 9:981200. doi: 10.3389/fnut.2022.981200
Received: 29 June 2022; Accepted: 23 August 2022;
Published: 14 September 2022.
Edited by:
Manja Zec, University of Arizona, United StatesReviewed by:
Mahmut Cerkez Ergoren, Near East University, CyprusSaman Sargazi, Zahedan University of Medical Sciences, Iran
Copyright © 2022 Wang, Ma, Xu, Guo, Zhou, Yu and Yuan. This is an open-access article distributed under the terms of the Creative Commons Attribution License (CC BY). The use, distribution or reproduction in other forums is permitted, provided the original author(s) and the copyright owner(s) are credited and that the original publication in this journal is cited, in accordance with accepted academic practice. No use, distribution or reproduction is permitted which does not comply with these terms.
*Correspondence: Linhong Yuan, eWxobWVkdUAxMjYuY29t
 Xixiang Wang
 Xiaojun Ma
 Jingjing Xu1
 Shaobo Zhou
 Linhong Yuan