- 1First Affiliated Hospital, School of Medicine, Shihezi University, Shihezi, China
- 2Analysis and Testing Center, Shihezi University, Shihezi, China
- 3School of Medicine, Shihezi University, Shihezi, China
Several studies indicated that the gut microbiota might participate in the beneficial effect of inulin on obesity. However, the mechanisms involved were still largely unknown. Sixteen high-fat diets (HFDs)-induced obese C57BL/6 mice were converted to a normal diet and then randomized into two groups, OND (obese mice + normal diet) group gavage-fed for 10 weeks with normal saline and ONDI (obese mice + normal diet + inulin) group with inulin at 10 g/kg/day. The body weight of HFD-induced obese mice showed different degrees of decrease in both groups. However, the ONDI group lost more weight and returned to normal earlier. Compared to the OND group, inulin supplementation significantly shifted the composition and structure of gut microbiota, such as higher α diversity. The β diversity analysis also confirmed the changes in gut microbiota composition between groups. At the genus level, the abundance of Alistipes was considerably increased, and it was significantly correlated with inulin supplementation (r = 0.72, P = 0.002). Serum metabolite levels were distinctly altered after inulin supplementation, and 143 metabolites were significantly altered in the ONDI group. Among them, indole-3-acrylic acid level increased more than 500-fold compared to the OND group. It was also strongly positive correlation with Alistipes (r = 0.72, P = 0.002) and inulin supplementation (r = 0.99, P = 9.2e−13) and negatively correlated with obesity (r = −0.72, P = 0.002). In conclusion, inulin supplementation could accelerate body weight loss in obese mice by increasing Alistipes and indole-3-acrylic acid level.
Introduction
Currently, public health is threatened by the increasing occurrence of obesity worldwide. It is reported that 20% of the adult population will be subjected to obesity by 2030 (1). Obesity is caused by a complex interplay of genetic and environmental factors and is thought to result from a chronic imbalance between energy intake and expenditure (2). Excessive consumption of high-fat diets (HFDs) can increase adipose tissue (3), predispose to obesity (4), and induce metabolic and cardiovascular disorders (5). Meanwhile, a HFD can wreak havoc on the balance of gut microbiota in the host (6–8). Clinical studies have found that gut microbiota dysbiosis is closely related to obesity (9, 10), which can affect the occurrence and development of obesity by regulating lipid metabolism and energy homeostasis (11). Growing evidence has shown that prebiotics, especially inulin, can alleviate glucose, lipid metabolism disorders, and obesity by modulating gut microbiota (12–15).
Inulin is a common prebiotic, defined as an indigestible dietary fiber that is beneficial for the growth of probiotics (16). The European Food Safety Authority has identified only one prebiotic: inulin improves intestinal function (17). It has been widely reported that inulin could alter the gut microbiota of obese individuals, increase the abundance of bifidobacteria and Akkermansia muciniphila in obese individuals, and improve metabolic disorders (18–22). Furthermore, inulin supplementation may promote short-chain fatty acid (SCFA) production in overweight or obese men (12). Animal experiments have also shown that inulin supplementation was associated with changes in the colon SCFAs levels, including acetic acid, propionic acid, and butyric acid (14). Dietary supplementation of the SCFAs was shown to significantly inhibit the body weight gain by enhancing triglyceride hydrolysis and FFA oxidation in the adipose tissue, promoting beige adipogenesis and mitochondrial biogenesis, and inhibiting chronic inflammation (23). Therefore, the effect of inulin on weight loss may be related to the interaction between gut microbiota and related metabolites.
However, alterations in metabolite levels were not limited to SCFAs, and there may be many other inulin-related metabolites that were not well studied. The development of non-targeted metabolomics has allowed us to understand better the impact of a factor on the overall metabolic profile of the host to find new biomarkers. In this study, we sought to unravel the important role of inulin in regulating gut microbiota and related metabolites and in accelerating the weight loss of HFD-induced obese mice, and further investigate whether the therapeutic effect of inulin on obesity is associated with gut microbiota and metabolites. Therefore, we examined changes in body weight, gut microbiota composition in feces, and metabolites in serum.
Materials and methods
Animals and study design
In total, 36 male 4-week-old C57BL/6 mice were purchased from the Experimental Animal Center of Xinjiang Medical University. Mice were kept in the environmental control room (25 ± 3°C, 40 ± 5% humidity, 12 h light/dark cycle) with free access to food and water. After 1 week of acclimatization, an experimental design was shown in Figure 1. All mice were randomly divided into two groups and treated for 12 consecutive weeks. The first group was fed a normal diet (ND, Kcal%: 10% fat, 20% protein, and 70% carbohydrate; 3.85 kcal/gm, n = 12). The second group was fed a HFD (Kcal%: 60% fat, 20% protein, and 20% carbohydrate; 5.24 kcal/gm, n = 24). After the obesity model of mice in the HFD group was established successfully, the surviving mice in the HFD group were randomly subdivided into two groups (n = 8 per group) that were fed a normal diet for 10 weeks. Specifically, (1) obese mice + normal diet (OND) group, obese mice were fed with a normal diet; (2) obese mice + normal diet + inulin (ONDI) group, obese mice were fed with a normal diet with inulin (Cosucra Co., Ltd., Belgium) at 10 g/kg/day by gavage. All the mice had ad libitum access to diet and water. During the period of treatment, the body weight and food intake were recorded weekly. By the end of the experiment, the mice were sacrificed after 12 h of fasting. Orbital blood sampling was used to collect plasma of mice in each group, and the feces was also collected for the follow-up experiments, immediately frozen in liquid nitrogen, and stored at −80°C. White adipose tissue (epididymal, retroperitoneal, and perirenal fat) and liver were weighed.
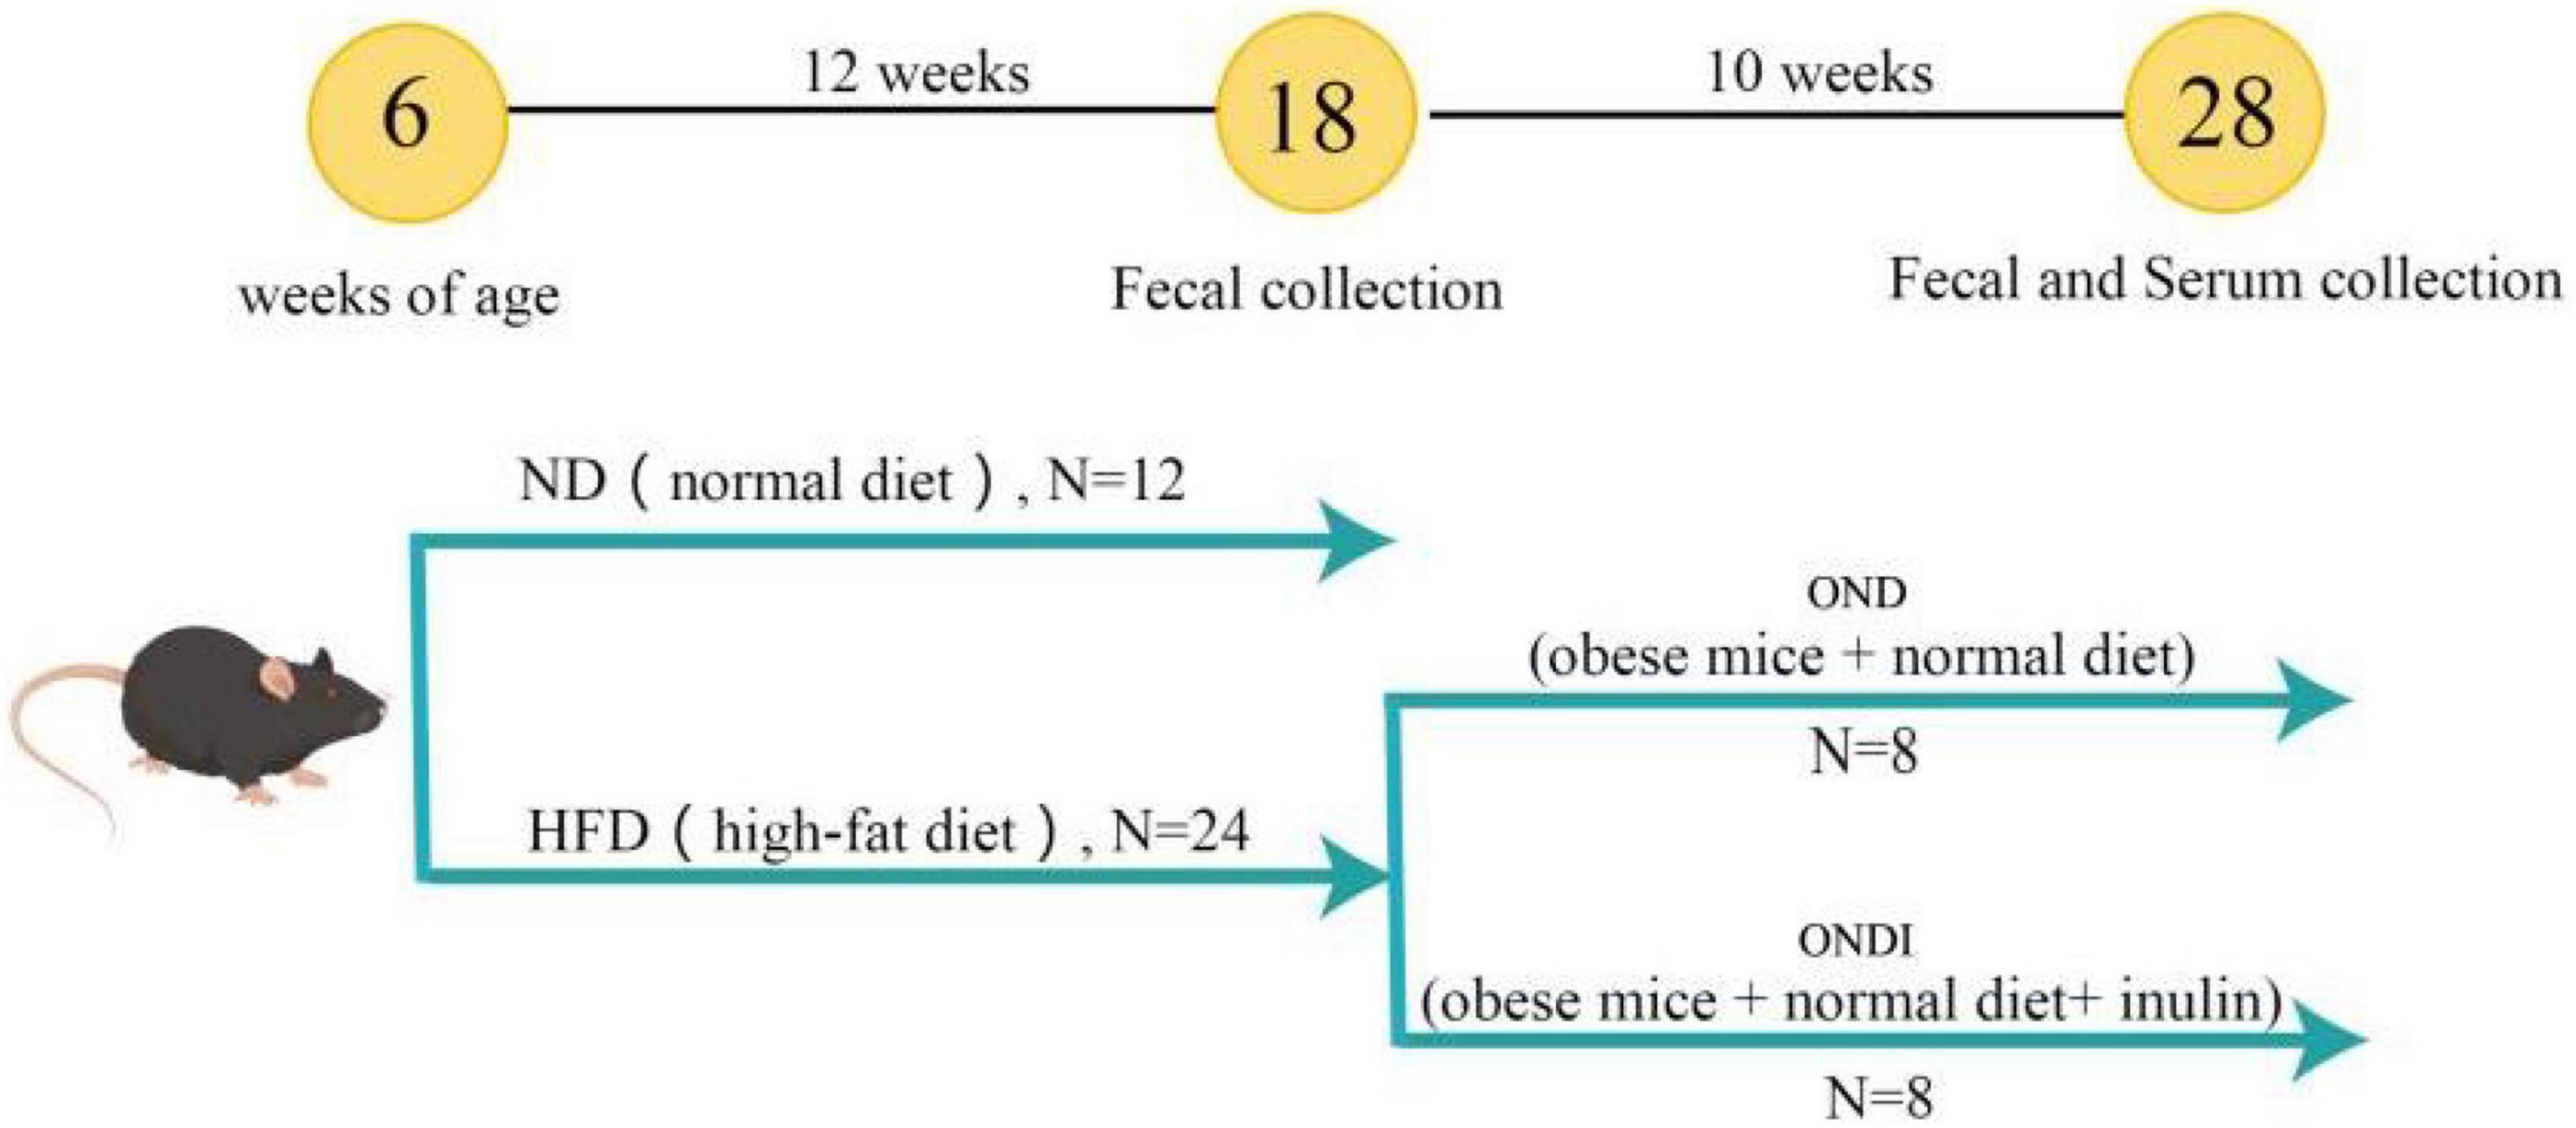
Figure 1. Graphical illustration of experimental design. C57BL/6J male mice were fed a normal diet (ND) and a high-fat diet (HFD) for 12 weeks to establish an obesity model. Subsequently, the diet of the obese mice in the HFD group was switched to a normal diet and supplemented with inulin.
Gut microbiota analysis
Genomic DNA was extracted from fecal samples using a TIANamp Stool DNA kit (TIAN GEN Bio-Tech Co., Ltd., Beijing, China). The variable V3–V4 region of the bacterial 16S rRNA gene was amplified by PCR using primers (F 5′-ACTCCTACGGGAGGCAGCAG-3′ and R 5′-GGACTACHVGGGTWTCTAAT-3′). 16S rRNA amplicons were detected on the Illumina NovaSeq platform by Novogene (Beijing, China). Paired-end reads from sequencing were merged utilizing Fast Length Adjustment of SHort reads (FLASH) (24) to obtain raw tags. Then use fastp software to carry out quality control on the obtained raw tags to obtain high-quality clean tags. Finally, the Usearch software is used to compare the clean tags with the database to detect and remove chimeras, so as to obtain the final effective tags. For the above-obtained effective tags, use the DADA2 module in the QIIME2 software to denoise, and filter out sequences with an abundance of less than 5, so as to obtain the final Amplicon Sequence Variants (ASVs). QIIME2’s class-sklearn algorithm (25, 26) was used for species annotation for each ASV using a pre-trained Naive Bayes classifier.
The alpha diversity (within-sample diversity) was assessed using Shannon, Simpson, Pielou, and Chao 1 indexes. Beta diversity (between-sample diversity) was measured with non-metric multidimensional scaling (NMDS) and principal coordinate analysis (PCoA). ANOSIM analysis with unifrac distance was applied to test for significant group clusters differences. Diagrams are visualized using R packages. The linear discriminant analysis effect size (LEfSe, LDA > 4) was applied to distinguish the vital bacterial biomarkers of the differential representation within groups by Qiime2. PICRUSt2 version 2.2.0 was used to predict the gut microbial metabolic functions based on the 16S sequences. The plot was performed on the Tutools platform,1 a free online data analysis website.
Serum metabolite profiling
Detection of non-targeted metabolites in serum samples was based on liquid mass spectrometry (LC-MS) by Novogene (Beijing, China). Take 100 μl of the sample and put it in an EP tube, add 400 μl of 80% methanol aqueous solution. Then take a certain amount of supernatant and add mass spectrometry grade water to dilute to 53% methanol, centrifuge at 15,000g, 4°C for 20 min, collect the supernatant for LC-MS analysis. Quality Control (QC) samples will be controlled throughout the process of on-machine testing, namely, before, during, and after LC-MS/MS sampling. The first three QC before injection were used to monitor the instrument state and balance the chromatography-mass spectrometry system. The following three QC were used for segmental scanning, and the secondary spectrum obtained from the experimental sample was used for the characterization of metabolites. QC inserted in the middle of sample testing is used to evaluate the system stability during the whole experiment process and conduct data quality control analysis.
The original files obtained by mass spectrometry were imported into Compound Discoverer 3.1 (CD3.1) software for spectral processing and database search, and the qualitative and quantitative results of metabolites were obtained. Based on high-resolution mass spectrometry (HRMS) detection technology combined with the mzCloud database, mzVault database, and MassList database, the characteristic molecular peaks were matched and identified to reflect the total metabolite information to the maximum extent. The metabolite peak was extracted, and the peak area was relatively quantified by CD3.1 software. Then, the metabolite was identified by comparison with mzCloud, mzVault, and MassList databases. Finally, the final identification results retain metabolites with a Coefficient of Variance (CV) of less than 30% (27) in QC samples.
The variable importance for the projection (VIP) values of the metabolites was obtained by PLS-DA (diagram is visualized using R package). Differential metabolites were screened according to VIP > 1, | log2FC| > 1.5 and P < 0.05. R was used to visualize the top 30 differential metabolite levels heatmap.
Statistical analyses
Statistical analyses were performed with SPSS 22.0 (USA). All data were expressed as the mean ± SD. A two-tailed Student’s t-test analyzed the differences between groups. The correlation was tested by Spearman correlation analyses. GraphPad Prism Version 8.0 (USA) and R were used for plotting. *P < 0.05, **P < 0.01, and ***P < 0.001 were considered statistically significant.
Results
Inulin supplementation contributes to the treatment of obesity
After 12 weeks of HFD treatment, the final body weight and weight gain of mice in the HFD group significantly increased compared with ND group (Figures 2A,C). Subsequently, mice in the HFD group were switched to a normal diet for 10 weeks, and we found that both the OND group and ONDI group showed a tendency to lose weight. However, the weight loss of the ONDI group was faster, and the body weight in the ONDI group was significantly lower than that of the OND group from week 9. By the 10th week, compared with OND group the weight of the ONDI group first returned to normal, and the weight loss obviously increased, indicating that additional inulin supplementation accelerated weight loss in obese mice (Figures 2B,D). Besides, inulin supplementation did not significantly change food intake of mice in OND and ONDI groups (Supplementary Figure 1), the reduction of liver and white fat weight was closely related to the weight loss of ONDI group mice (Figures 2E,F).
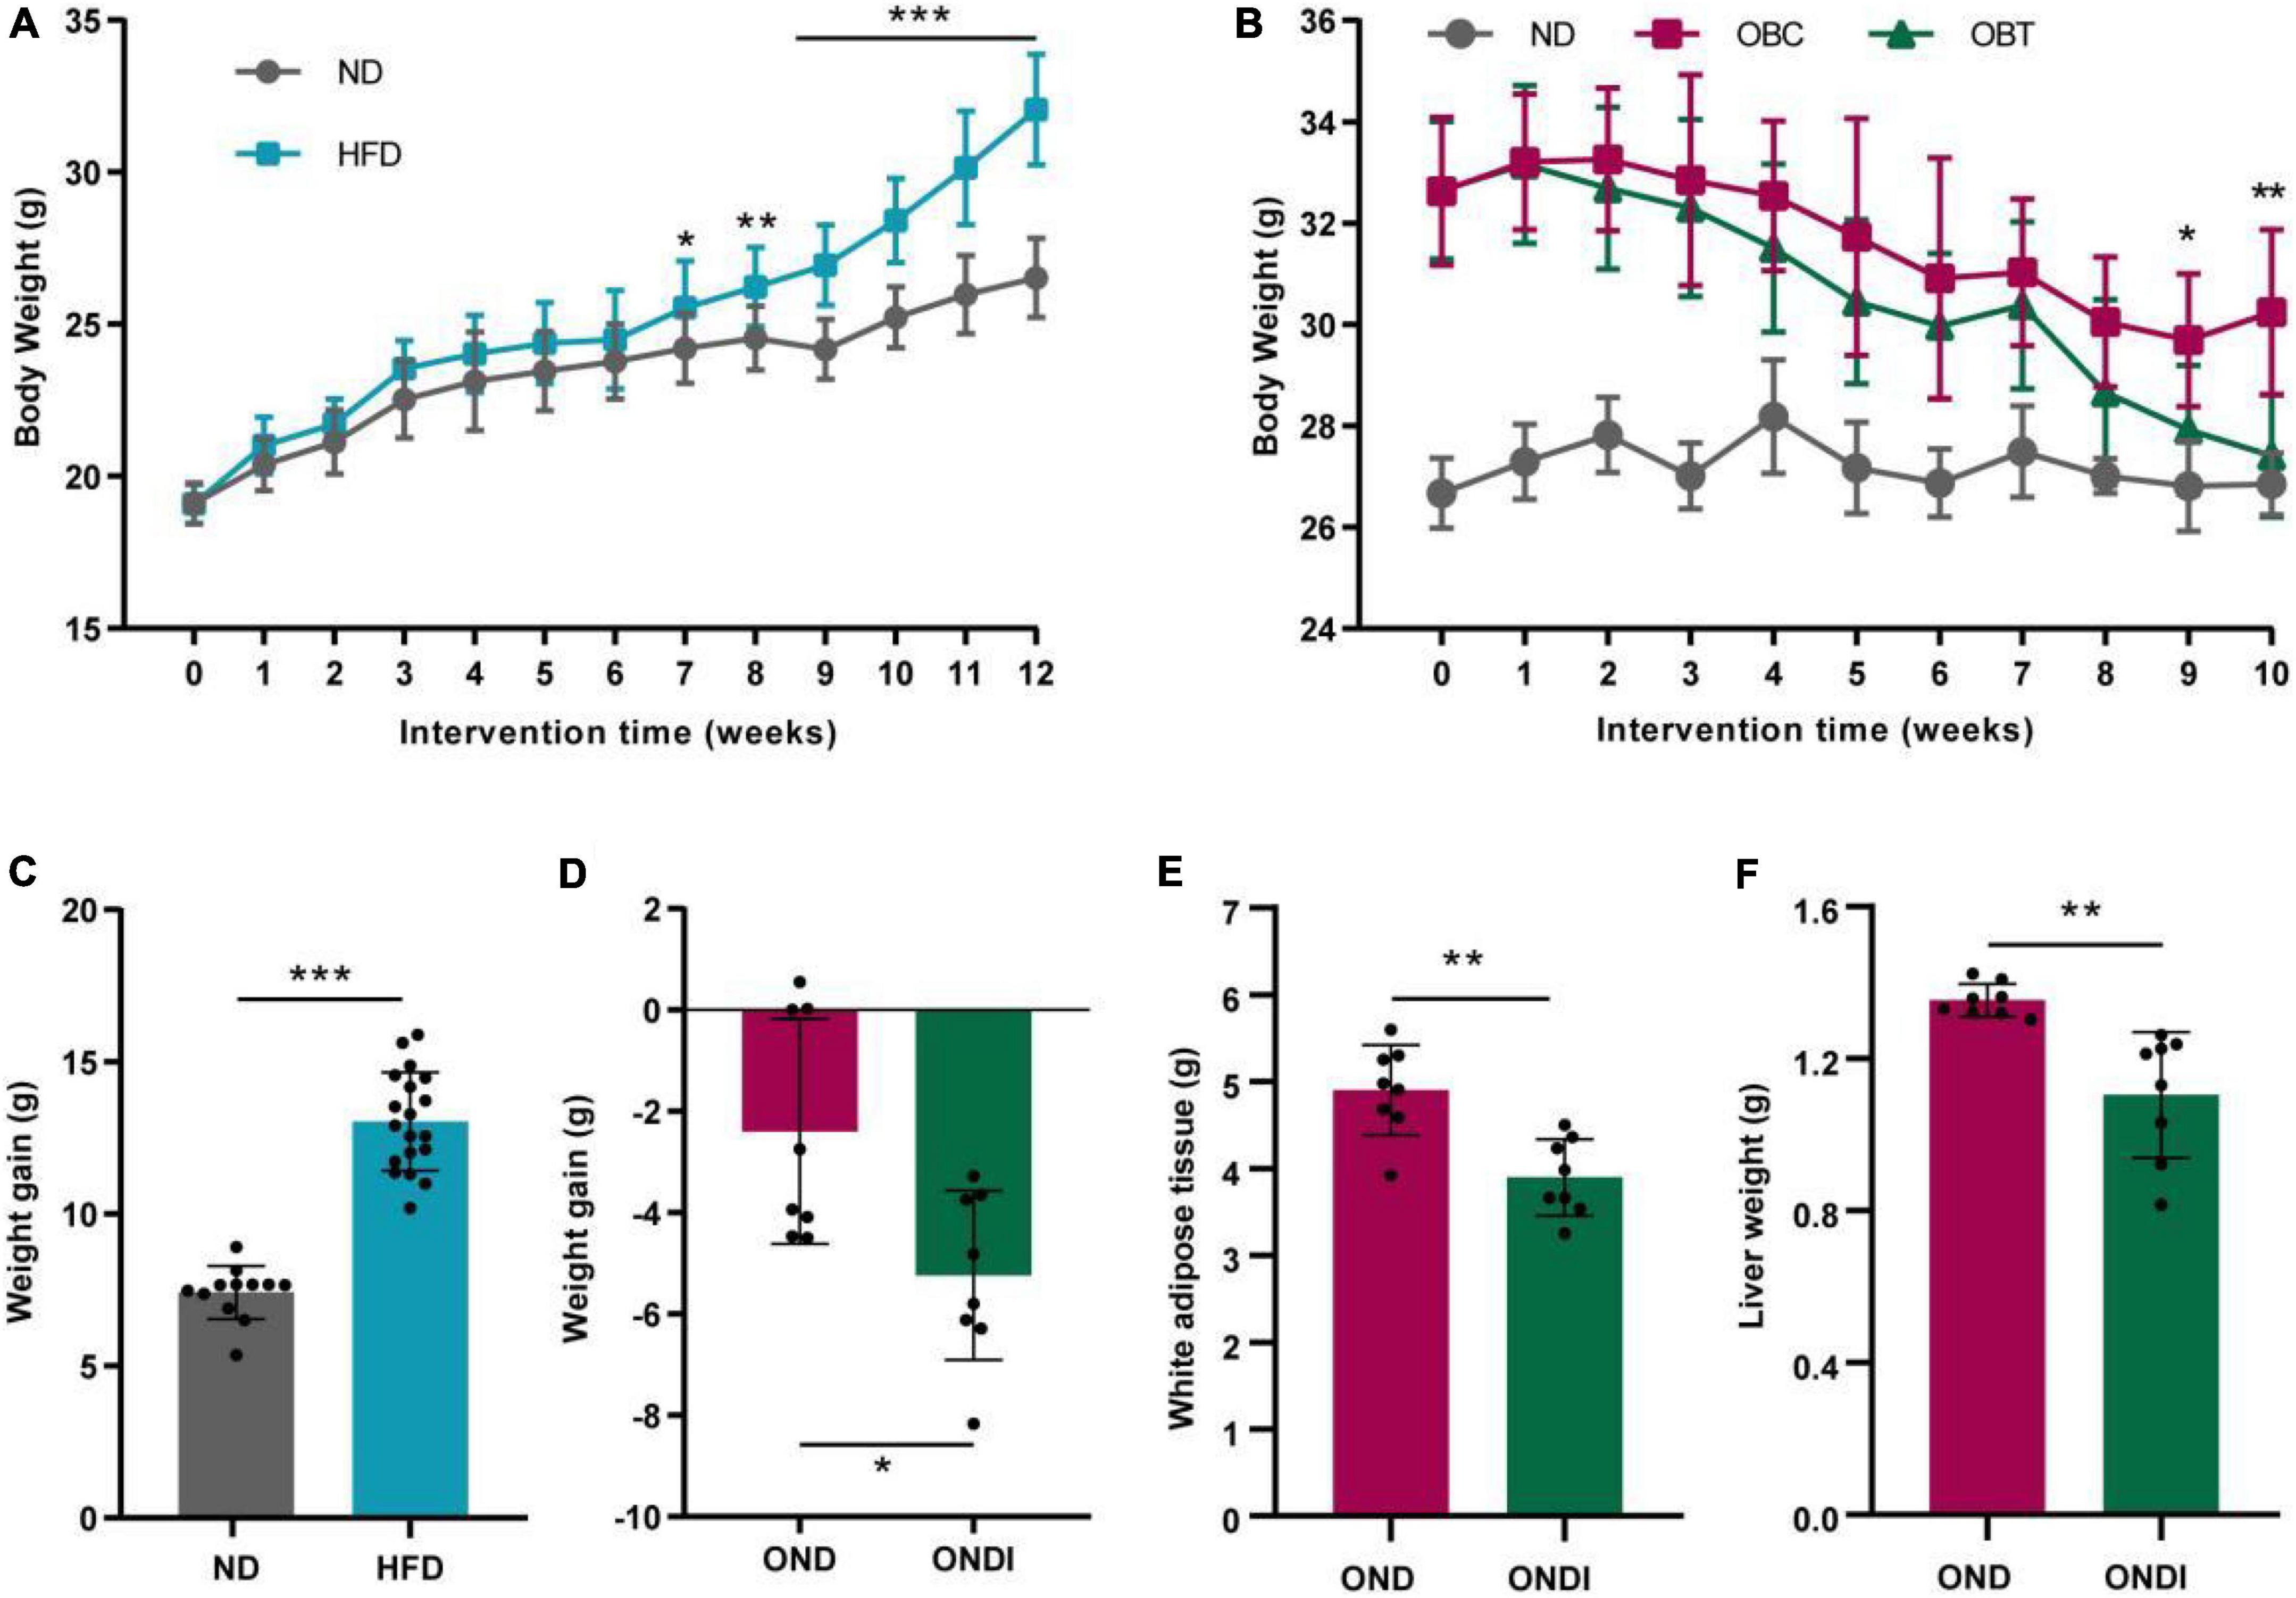
Figure 2. Effect of inulin on body weight, weight gain, white adipose tissue and liver weight. (A) Changes in body weight of mice fed with a high-fat diet for 12 weeks. (B) Changes in body weight of obese mice supplemented with inulin for 10 weeks. (C) Weight gain after 12 weeks of HFD treatment. (D) Weight gain after 10 weeks of inulin treatment. (E,F) White adipose tissue and liver weight after 10 weeks of inulin supplementation. Each value was expressed as mean + SD. *P < 0.05, **P < 0.01, and ***P < 0.001, HFD or OND compared with ND mice. ND, normal diet; HFD, high-fat diet; OND, obese mice + normal diet; ONDI, obese mice + normal diet + inulin.
Effects of inulin on gut microbial diversity in obese mice
Compared with the ND group, high-fat feeding significantly reduced the α diversity, including reduced Chao index, Pielou index, and Shannon index considerably (Figure 3A). Compared with the OND group, inulin supplementation significantly increased the α diversity, such as the Pielou index, Shannon index, and Simpson index (Figure 3B). By using β diversity analysis based on PCoA and NMDS, the ND and HFD formed clusters separated from each other, indicating that gut microbiota composition changed significantly in response to HFD. Moreover, a similar phenomenon was also observed in the reaction to inulin supplementation between OND and ONDI groups (Figures 3C,D).
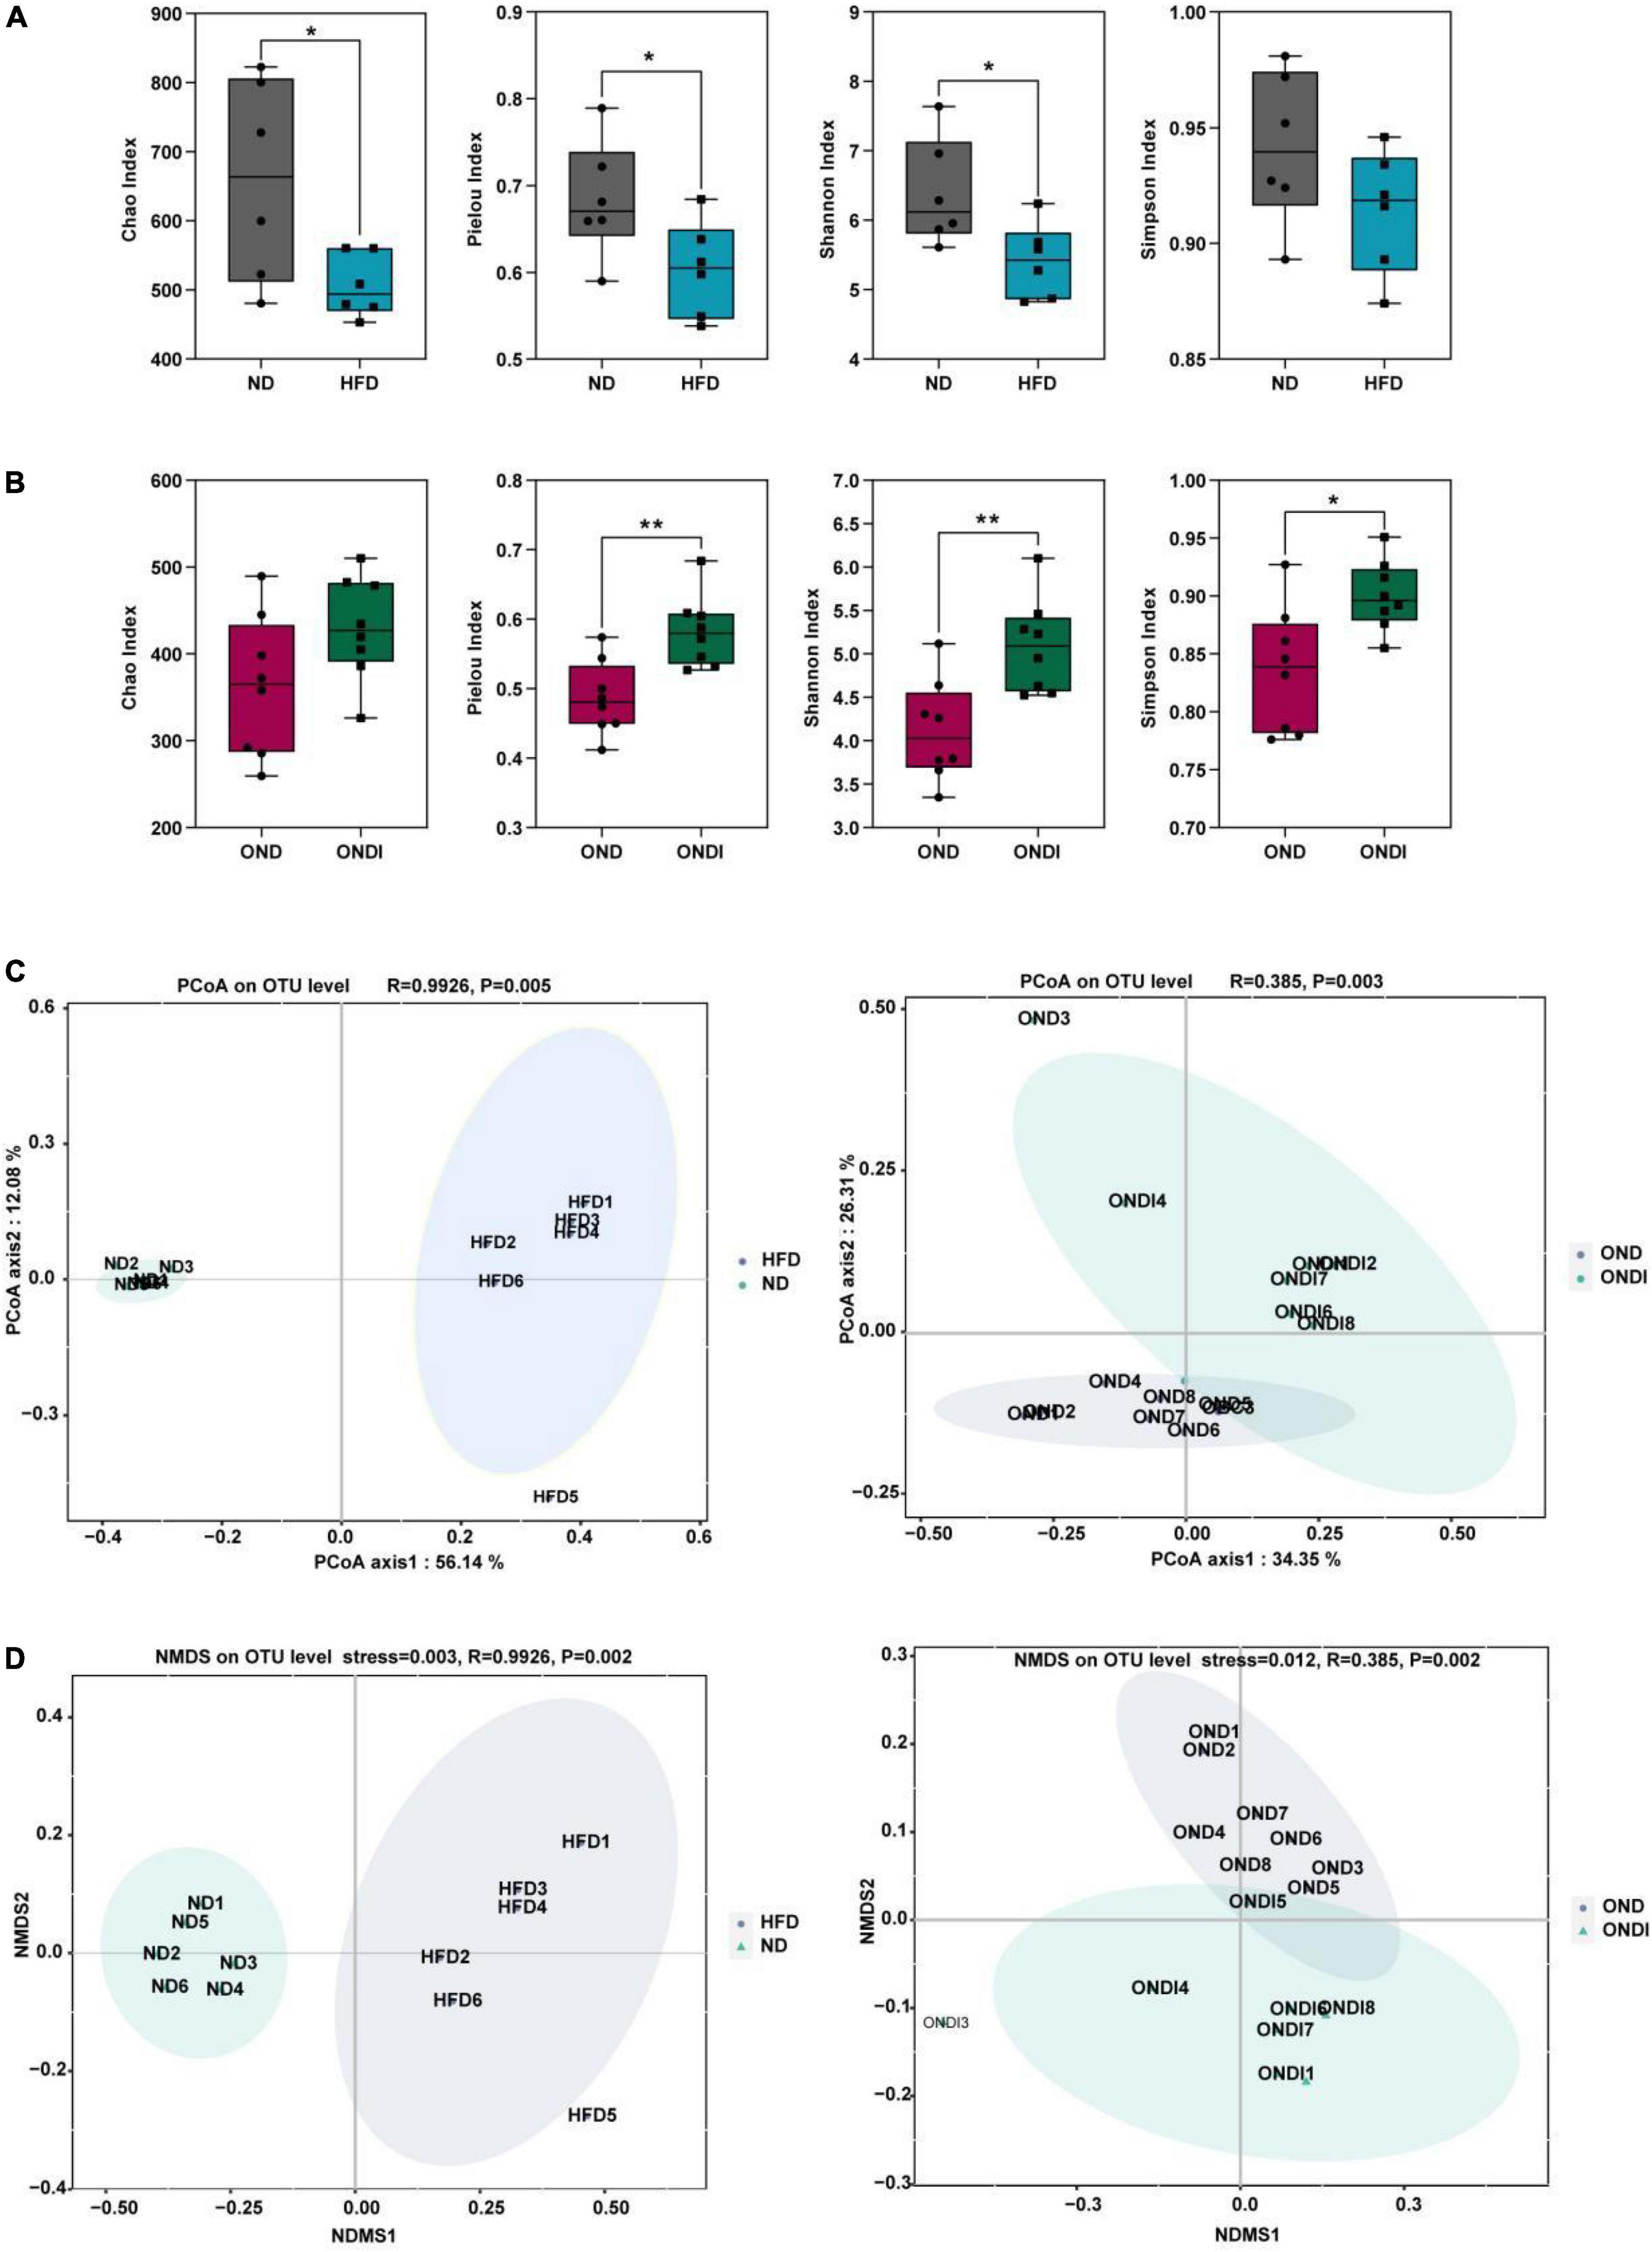
Figure 3. Effects of inulin supplementation on α and β diversity of gut microbiota in obese mice. (A,B) The Chao index accessed the community richness, and the community diversity was accessed by the Pielou, Shannon, and Simpson indices. (C,D) Principal coordinate analysis (PcoA) and NMDS analysis. Each value was expressed as mean + SD. *P < 0.05, **P < 0.01, ***P < 0.001. ND, normal diet; HFD, high-fat diet; OND, obese mice + normal diet; ONDI, obese mice + normal diet + inulin.
Effects of inulin on differences of microbial composition in obese mice
Bar graphs were drawn according to the relative abundance of the top 10 most abundant gut bacterial phyla (Figures 4A,B) and the top 15 most abundant gut genera in different groups (Figures 4C,D). At the phylum level, Firmicutes and Bacteroidetes were the most abundant gut bacterial phyla, and their overall mean relative abundance of all groups was greater than 88%. Compared with the ND group, the abundance of Firmicutes and Actinobacteriota were obviously increased, while the abundance of Bacteroidota was significantly decreased in the HFD group (Figure 5A). Meanwhile, HFD feeding significantly increased the ratio of Firmicutes to Bacteroidetes (Figure 5B). Compared with the OND group, inulin supplementation significantly reduced the abundance of Firmicutes in the ONDI group (Figure 5D). At the genus level, high-fat feeding significantly decreased the abundance of Muribaculaceae and Alistipes and enriched Bifidobacterium, Ileibacterium, Clostridia_UCG-014, Faecalibaculum, and Colidextribacter compared with the ND group (Figure 5C). After supplementing with inulin, we found statistically significant changes in Alistipes, Ruminococcus, and Colidextribacter in the top 15 most important gut genera compared to the OND group. Notably, the relative abundance of Alistipes in the ONDI group was greatly increased to 17.8%, 2.3 times that of the OND group (Figure 5E). At the same time, Ruminococcus and Colidextribacter were significantly lowered (Figures 5F,G). Furthermore, Alistipes was strongly negatively correlated with Colidextribacter (r = −0.57, P = 0.023, Supplementary Figure 2A) and Ruminococcus (r = −0.55, P = 0.016, Supplementary Figure 2B), while Ruminococcus was strongly positively correlated with Colidextribacter (r = 0.86, P = 2.2e−05, Supplementary Figure 2C).
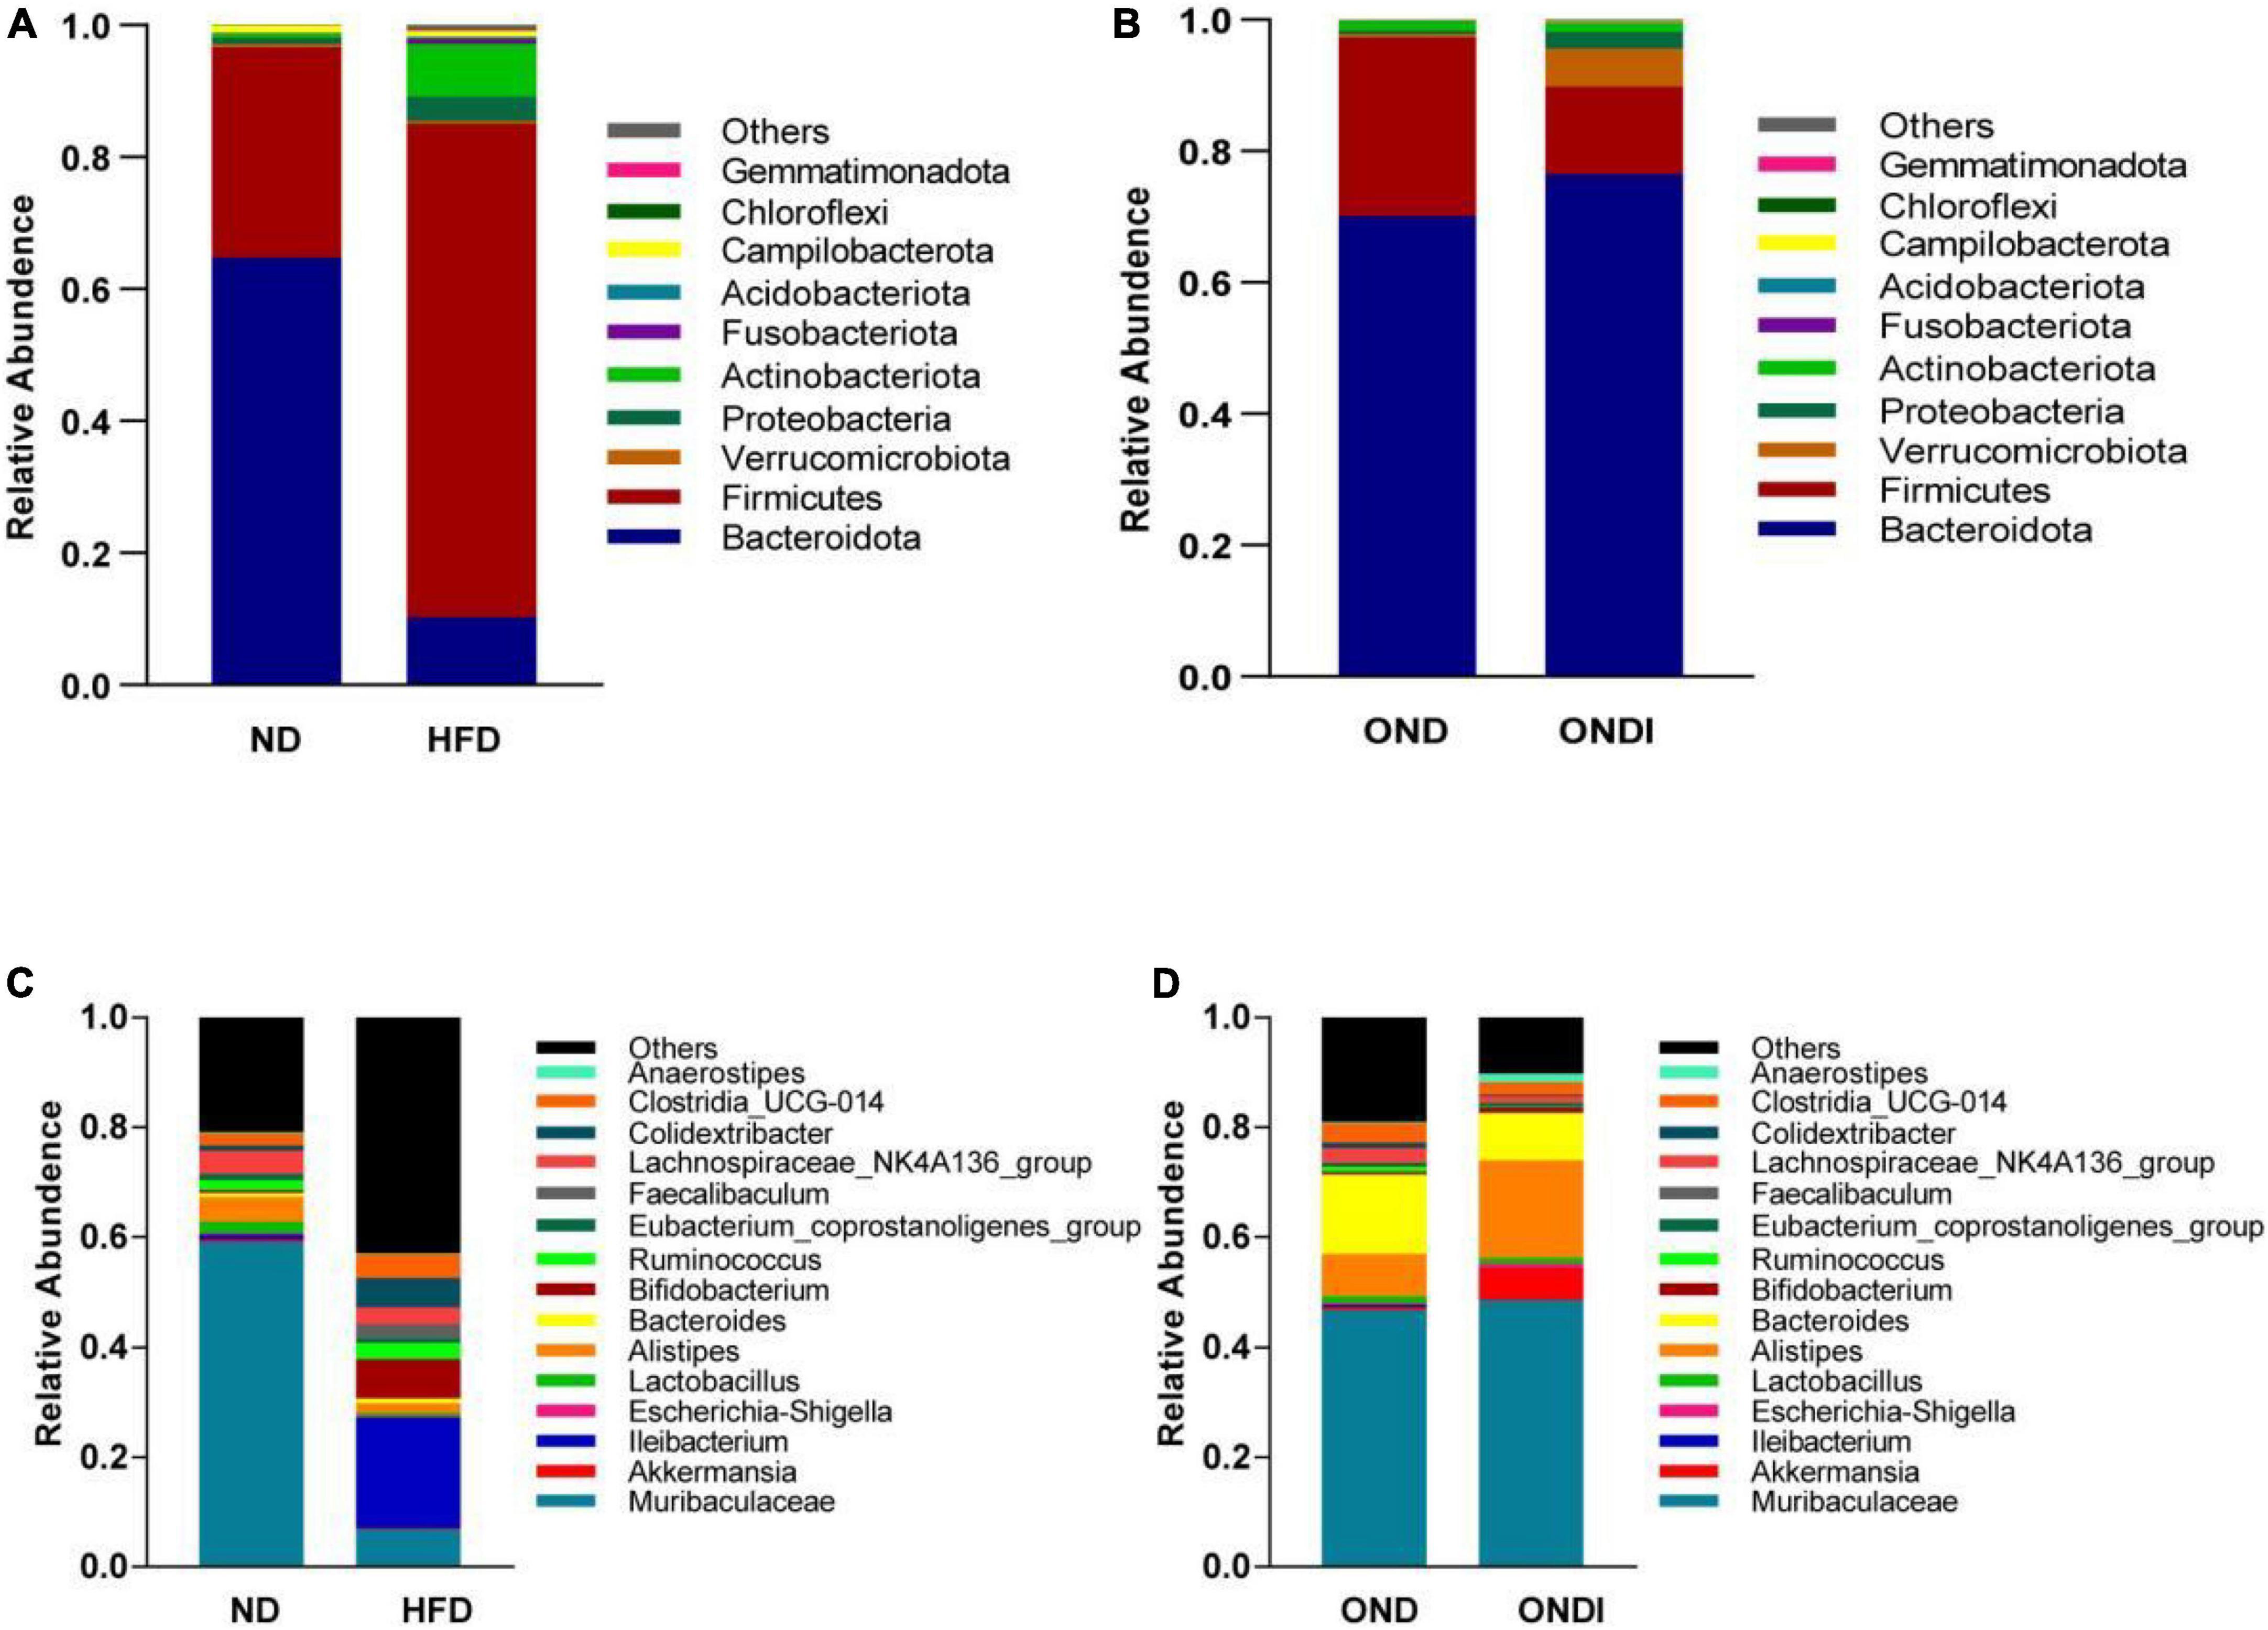
Figure 4. Relative abundance of the top 10 phylum-level (A,B) and genus-level top 15 (C,D) most important gut microbial components following inulin supplementation. Each column represents the composition of the microbial taxa in one group.
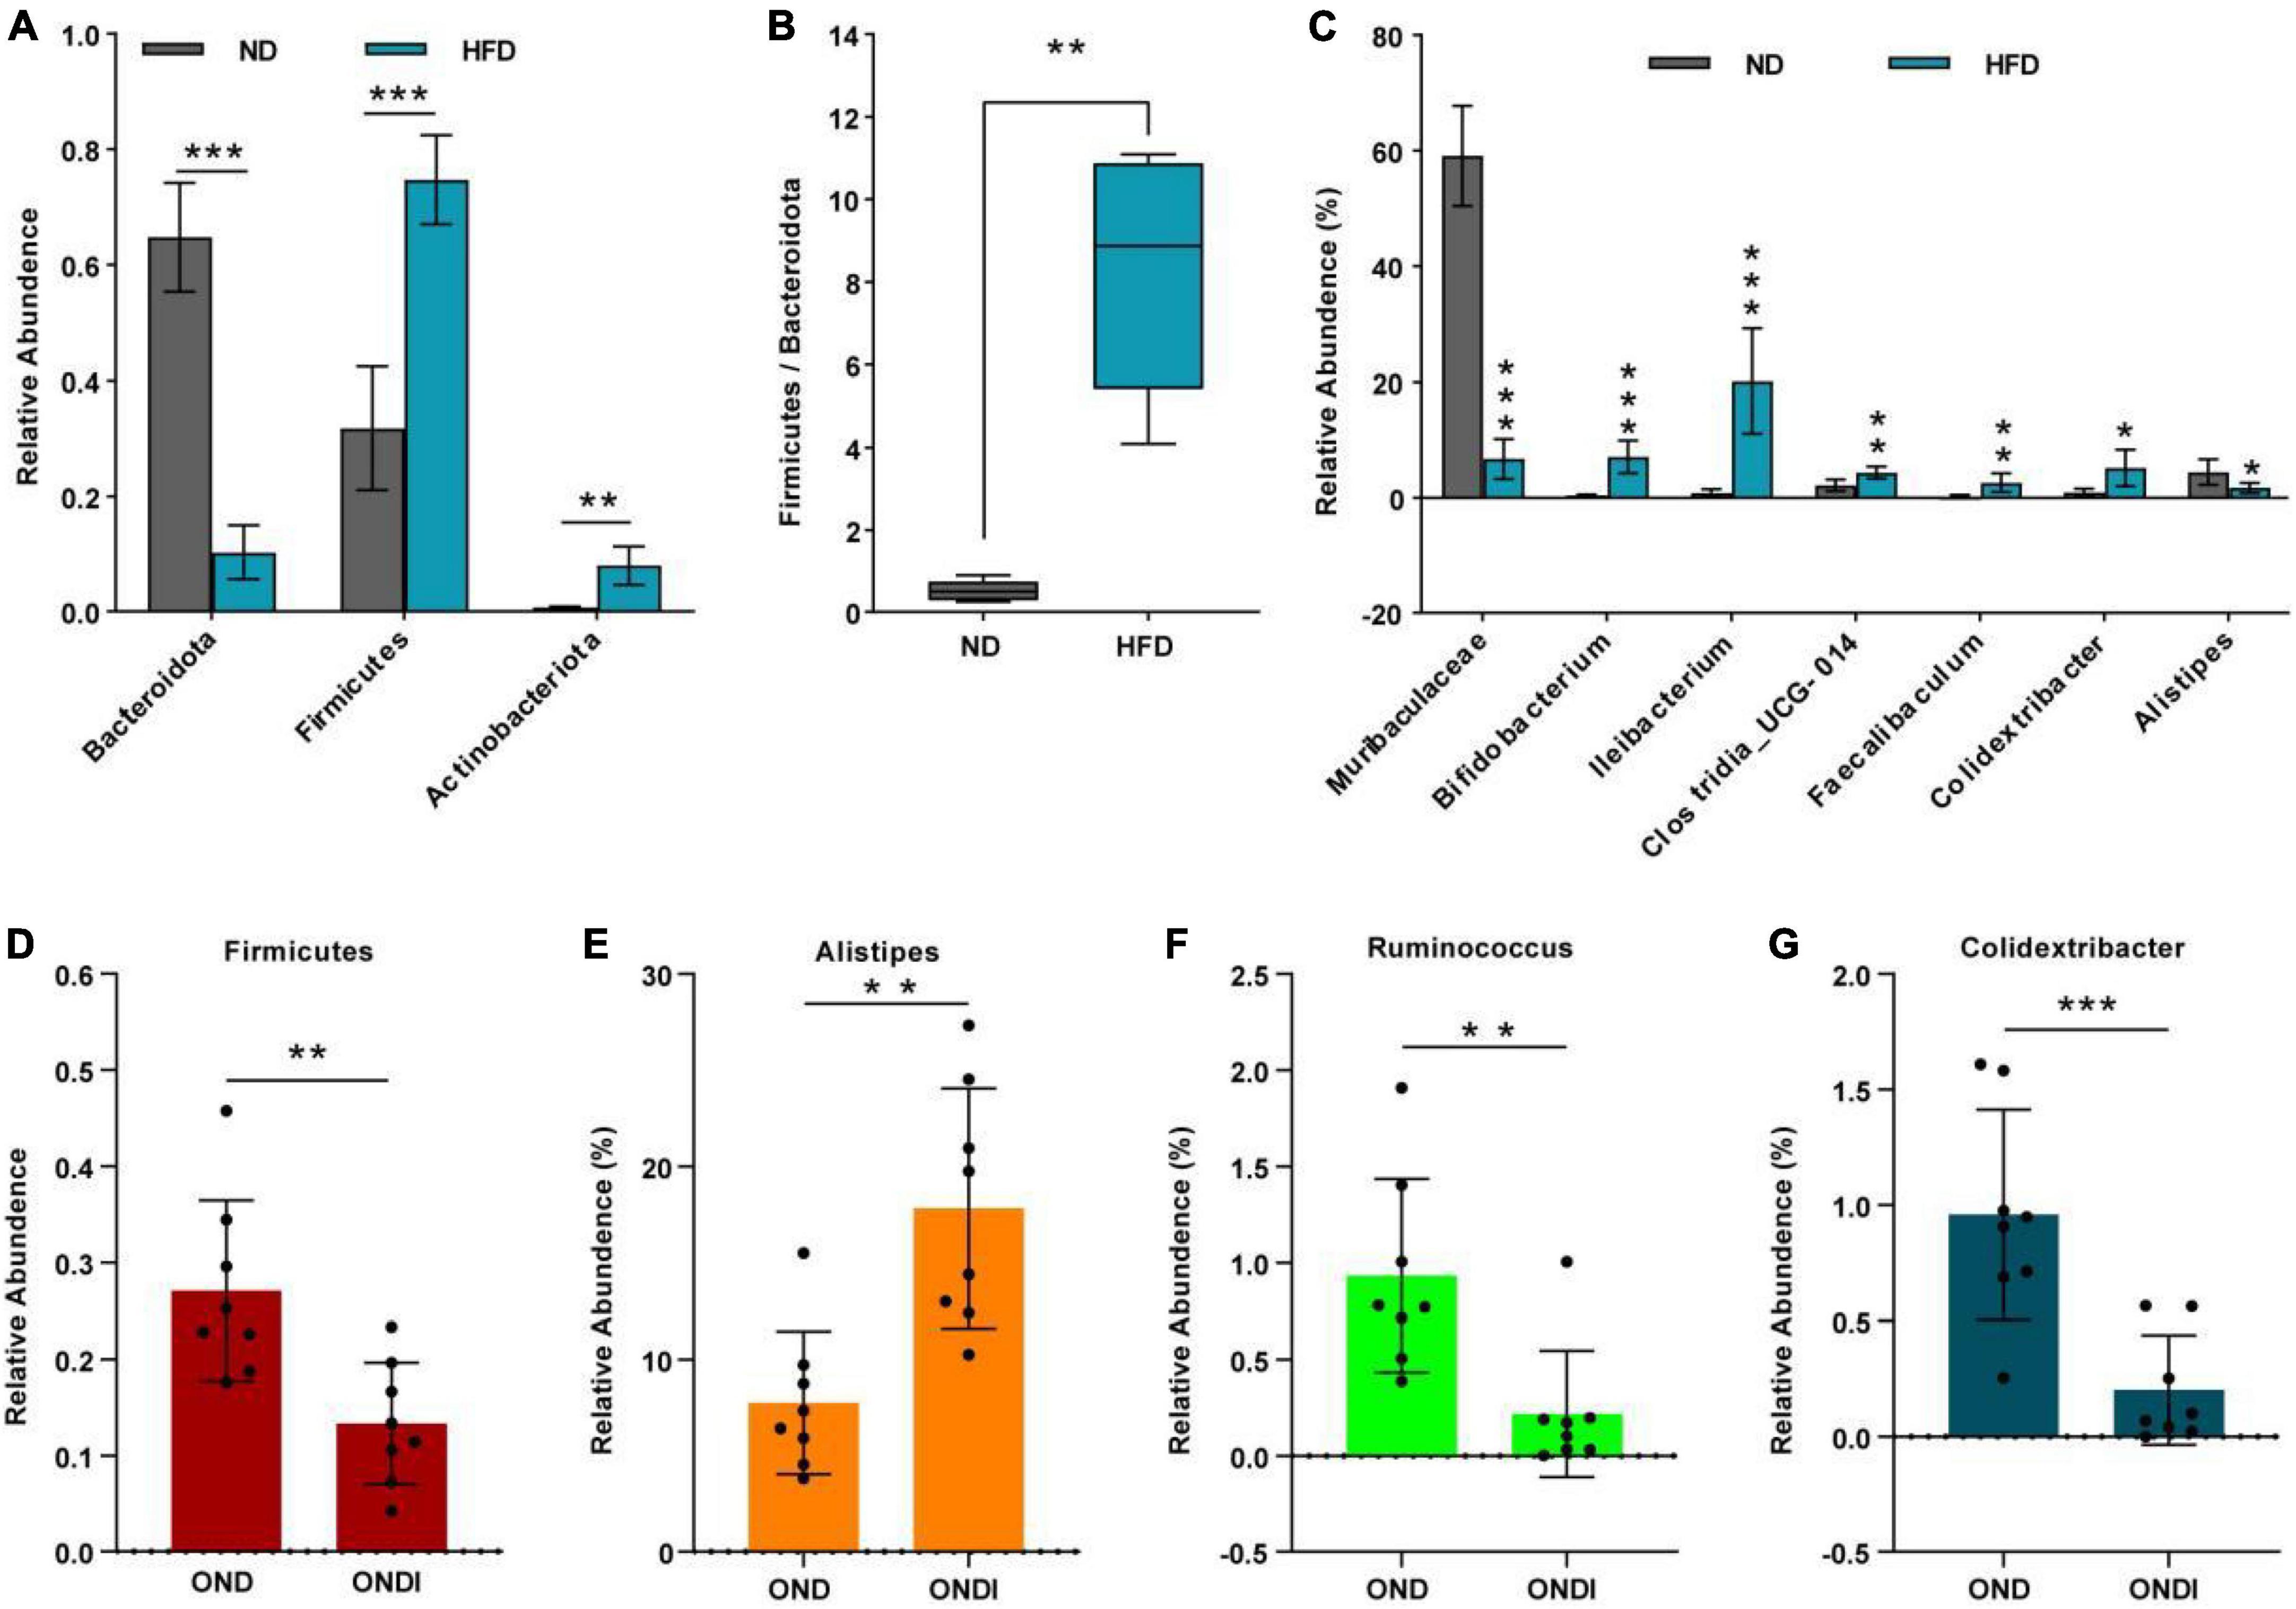
Figure 5. Alterations of feature gut species after inulin supplementation. (A) Changes in top 10 gut phyla between ND and HFD groups; (B) the ratio of the abundance of Firmicutes and Bacteroidetes; (C) changes in top 15 gut genus between ND and HFD groups. (D) Changes in top 10 gut phyla between OND and ONDI groups; (E–G) changes in top 15 gut genus between OND and ONDI groups. *P < 0.05, **P < 0.01, and ***P < 0.001.
The LEfSe analysis showed that bacteria from phyla Bacteroidota (e.g., Alistipes genus and Rikenellaceae family) were significantly enriched in the ND group and the bacteria from the phyla Firmicutes were significantly associated with the HFD group. For example, Ileibacterium, Colidextribacter, Faecalibaculum, Clostridia_UCG-014 genus from Firmicutes were mainly linked to the HFD group (Figure 6A). Surprisingly, inulin supplementation reversed the above phenomenon after 10 weeks. The Alistipes genus and Rikenellaceae family from phyla Bacteroidota especially distinguished the OND group from the ONDI group, while phyla Firmicutes were still significantly related to the OND group (Figure 6B). The cladogram corresponding to five phylogenetic levels (from phylum to genus) generated from LEfSe analysis showed the most relevant bacterial taxa among each group, consistent with the results mentioned above (Supplementary Figures 3A,B).
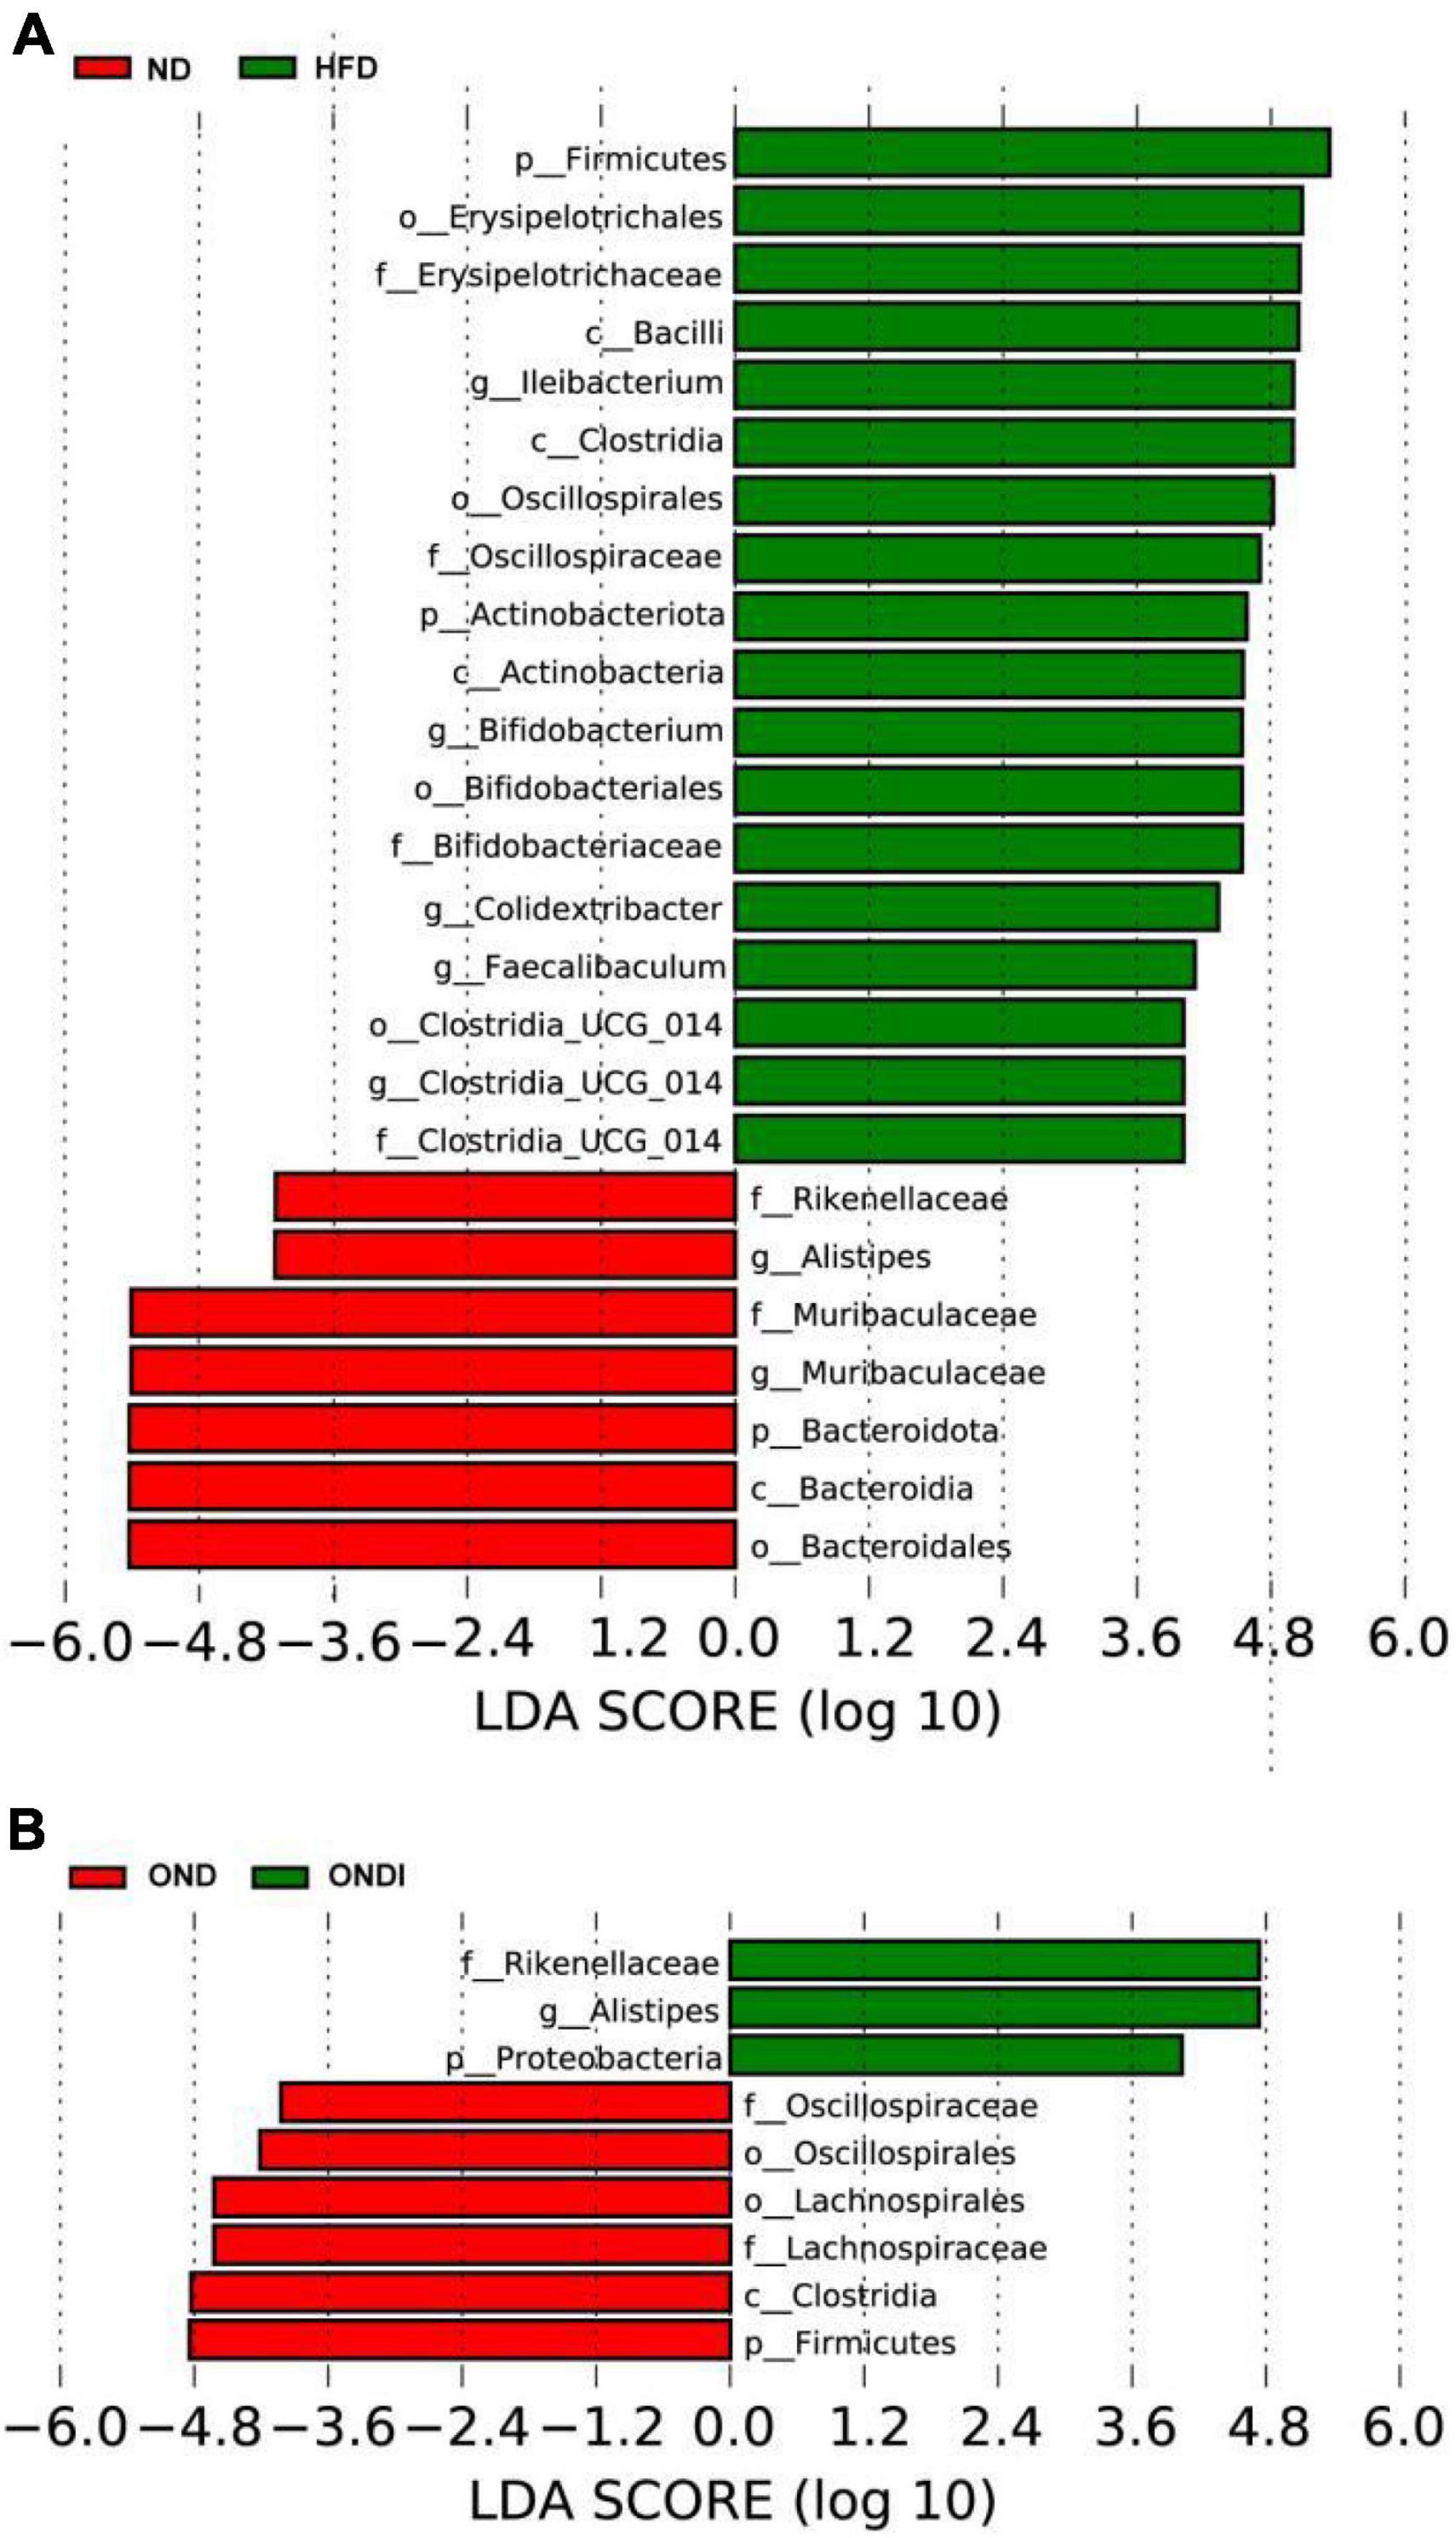
Figure 6. LEfSe analysis of key phylotypes of mice gut microbiota. (A,B) linear discriminant analysis (LDA > 4) scores derived from LEfSe analysis.
Gut microbial metabolic functions
PICRUSt2 predicted a total of 413 function pathways. According to the abundance distribution of each metabolic pathway in each sample, the metabolic characteristics of gut microbiota were predicted after inulin supplementation for 10 weeks. Compared with the OND group, inulin supplementation significantly reduced glycogen biosynthesis I, NAD salvage pathway I, purine ribonucleosides degradation, pentose phosphate pathway, starch degradation V, tryptophan biosynthesis, Calvin–Benson–Bassham cycle, and dTDP-N-acetylthomosamine biosynthesis; and enhanced superpathway of menaquinol-8 biosynthesis II, 1,4-dihydroxy-6-naphthoate biosynthesis I, 1,4-dihydroxy-6-naphthoate biosynthesis II and L-methionine biosynthesis III (Figure 7A). Furthermore, the three critical gut microbiota, Alistipes, Ruminococcus, and Colidextribacter, were statistically associated with these metabolic pathways. The Alistipes were significantly positively correlated with L-methionine biosynthesis III and significantly negatively correlated with tryptophan biosynthesis and NAD salvage pathway I, whereas the Ruminococcus and Colidextribacter were the opposite (Figure 7B).
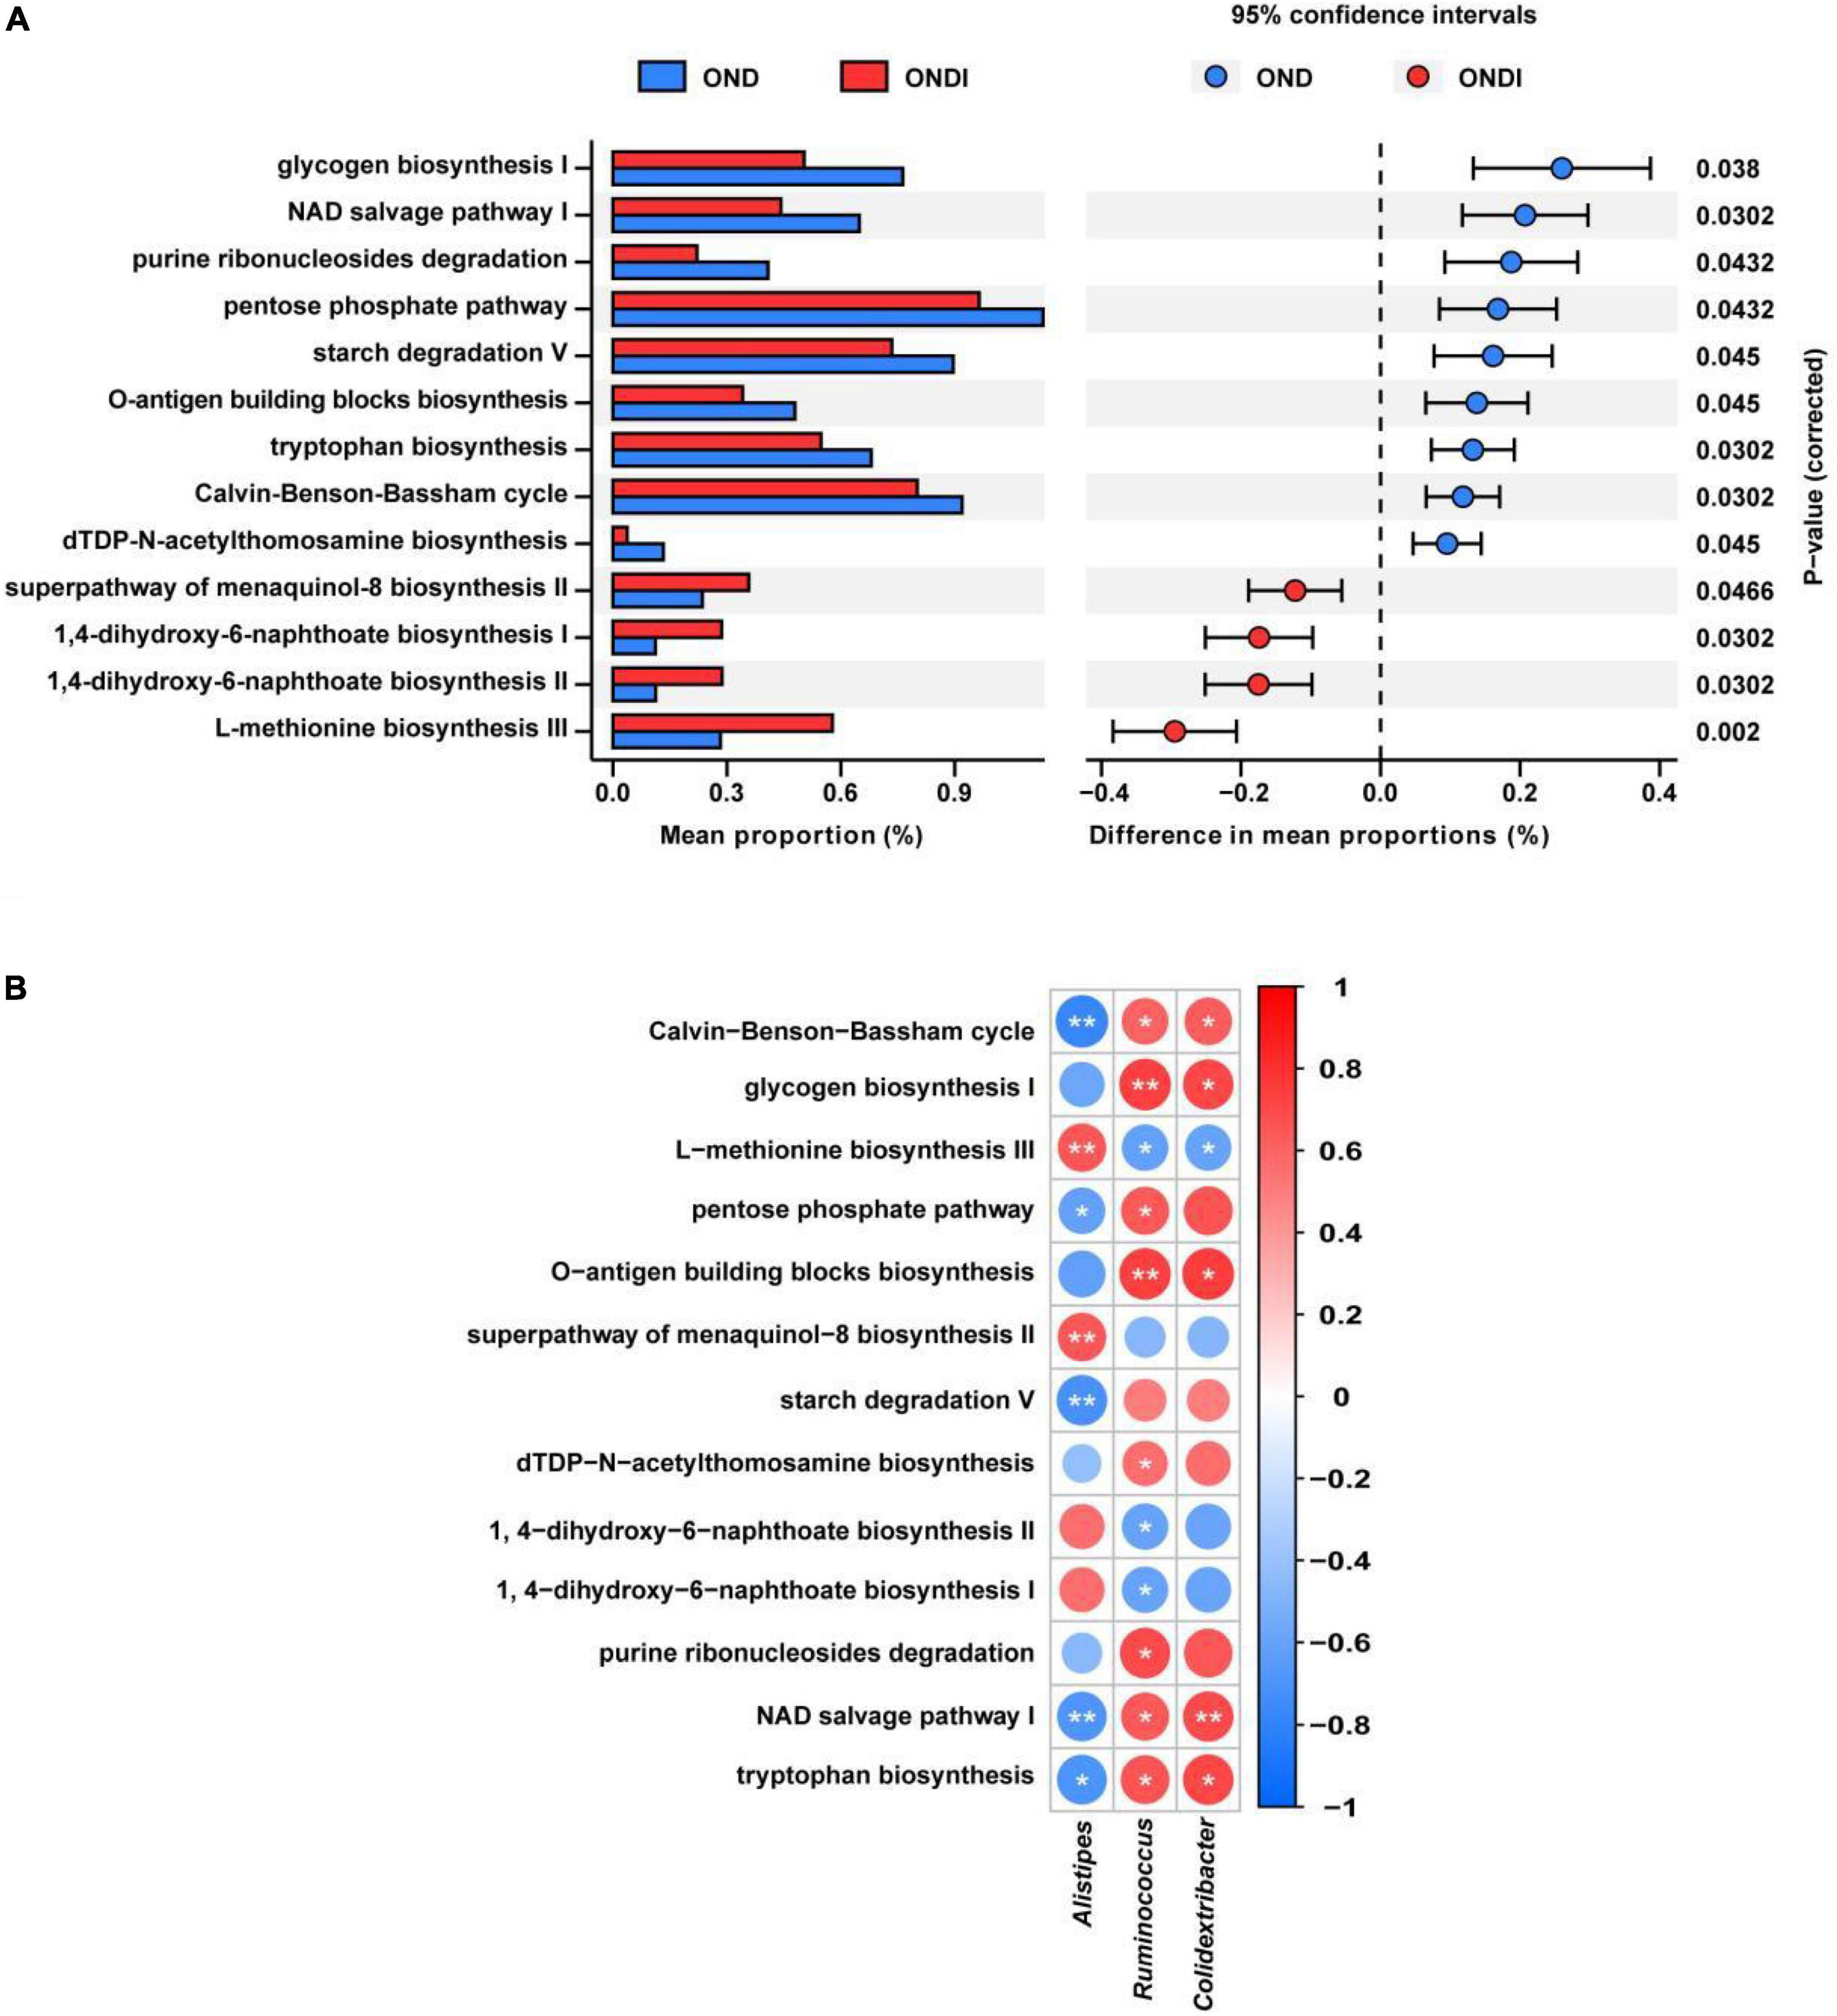
Figure 7. Predicted metabolic profile of the gut microbiota after inulin supplementation (A) and association of feature gut species and metabolic profile (B). *P < 0.05, **P < 0.01.
Effects of inulin on alterations of serum metabolites
A total of 421 serum metabolites were detected using the positive ion mode of LC-MS. To identify the particular metabolites associated with inulin among thousands of variables, a pairwise comparison of the PLS-DA model was established with satisfactory validation (R2Y = 0.99, Q2Y = 0.94). There was a significant separation between the OND and ONDI groups (Figure 8A). According to the screening criteria: VIP > 1, P < 0.05, and | log2FC| > 1.5, a total of 113 differential metabolites were screened out, including 68 increased and 45 decreased metabolites (Figure 8B). The top 30 metabolites were selected to construct the heatmap (Figure 8C). The samples were well clustered into OND and ONDI groups, and the level changes of each metabolite within the group were basically consistent. The top 30 metabolites mainly include indoles and derivatives (indole-3-acrylic acid, tryptophan, 5-hydroxyindole, and methyl indole-3-acetate).
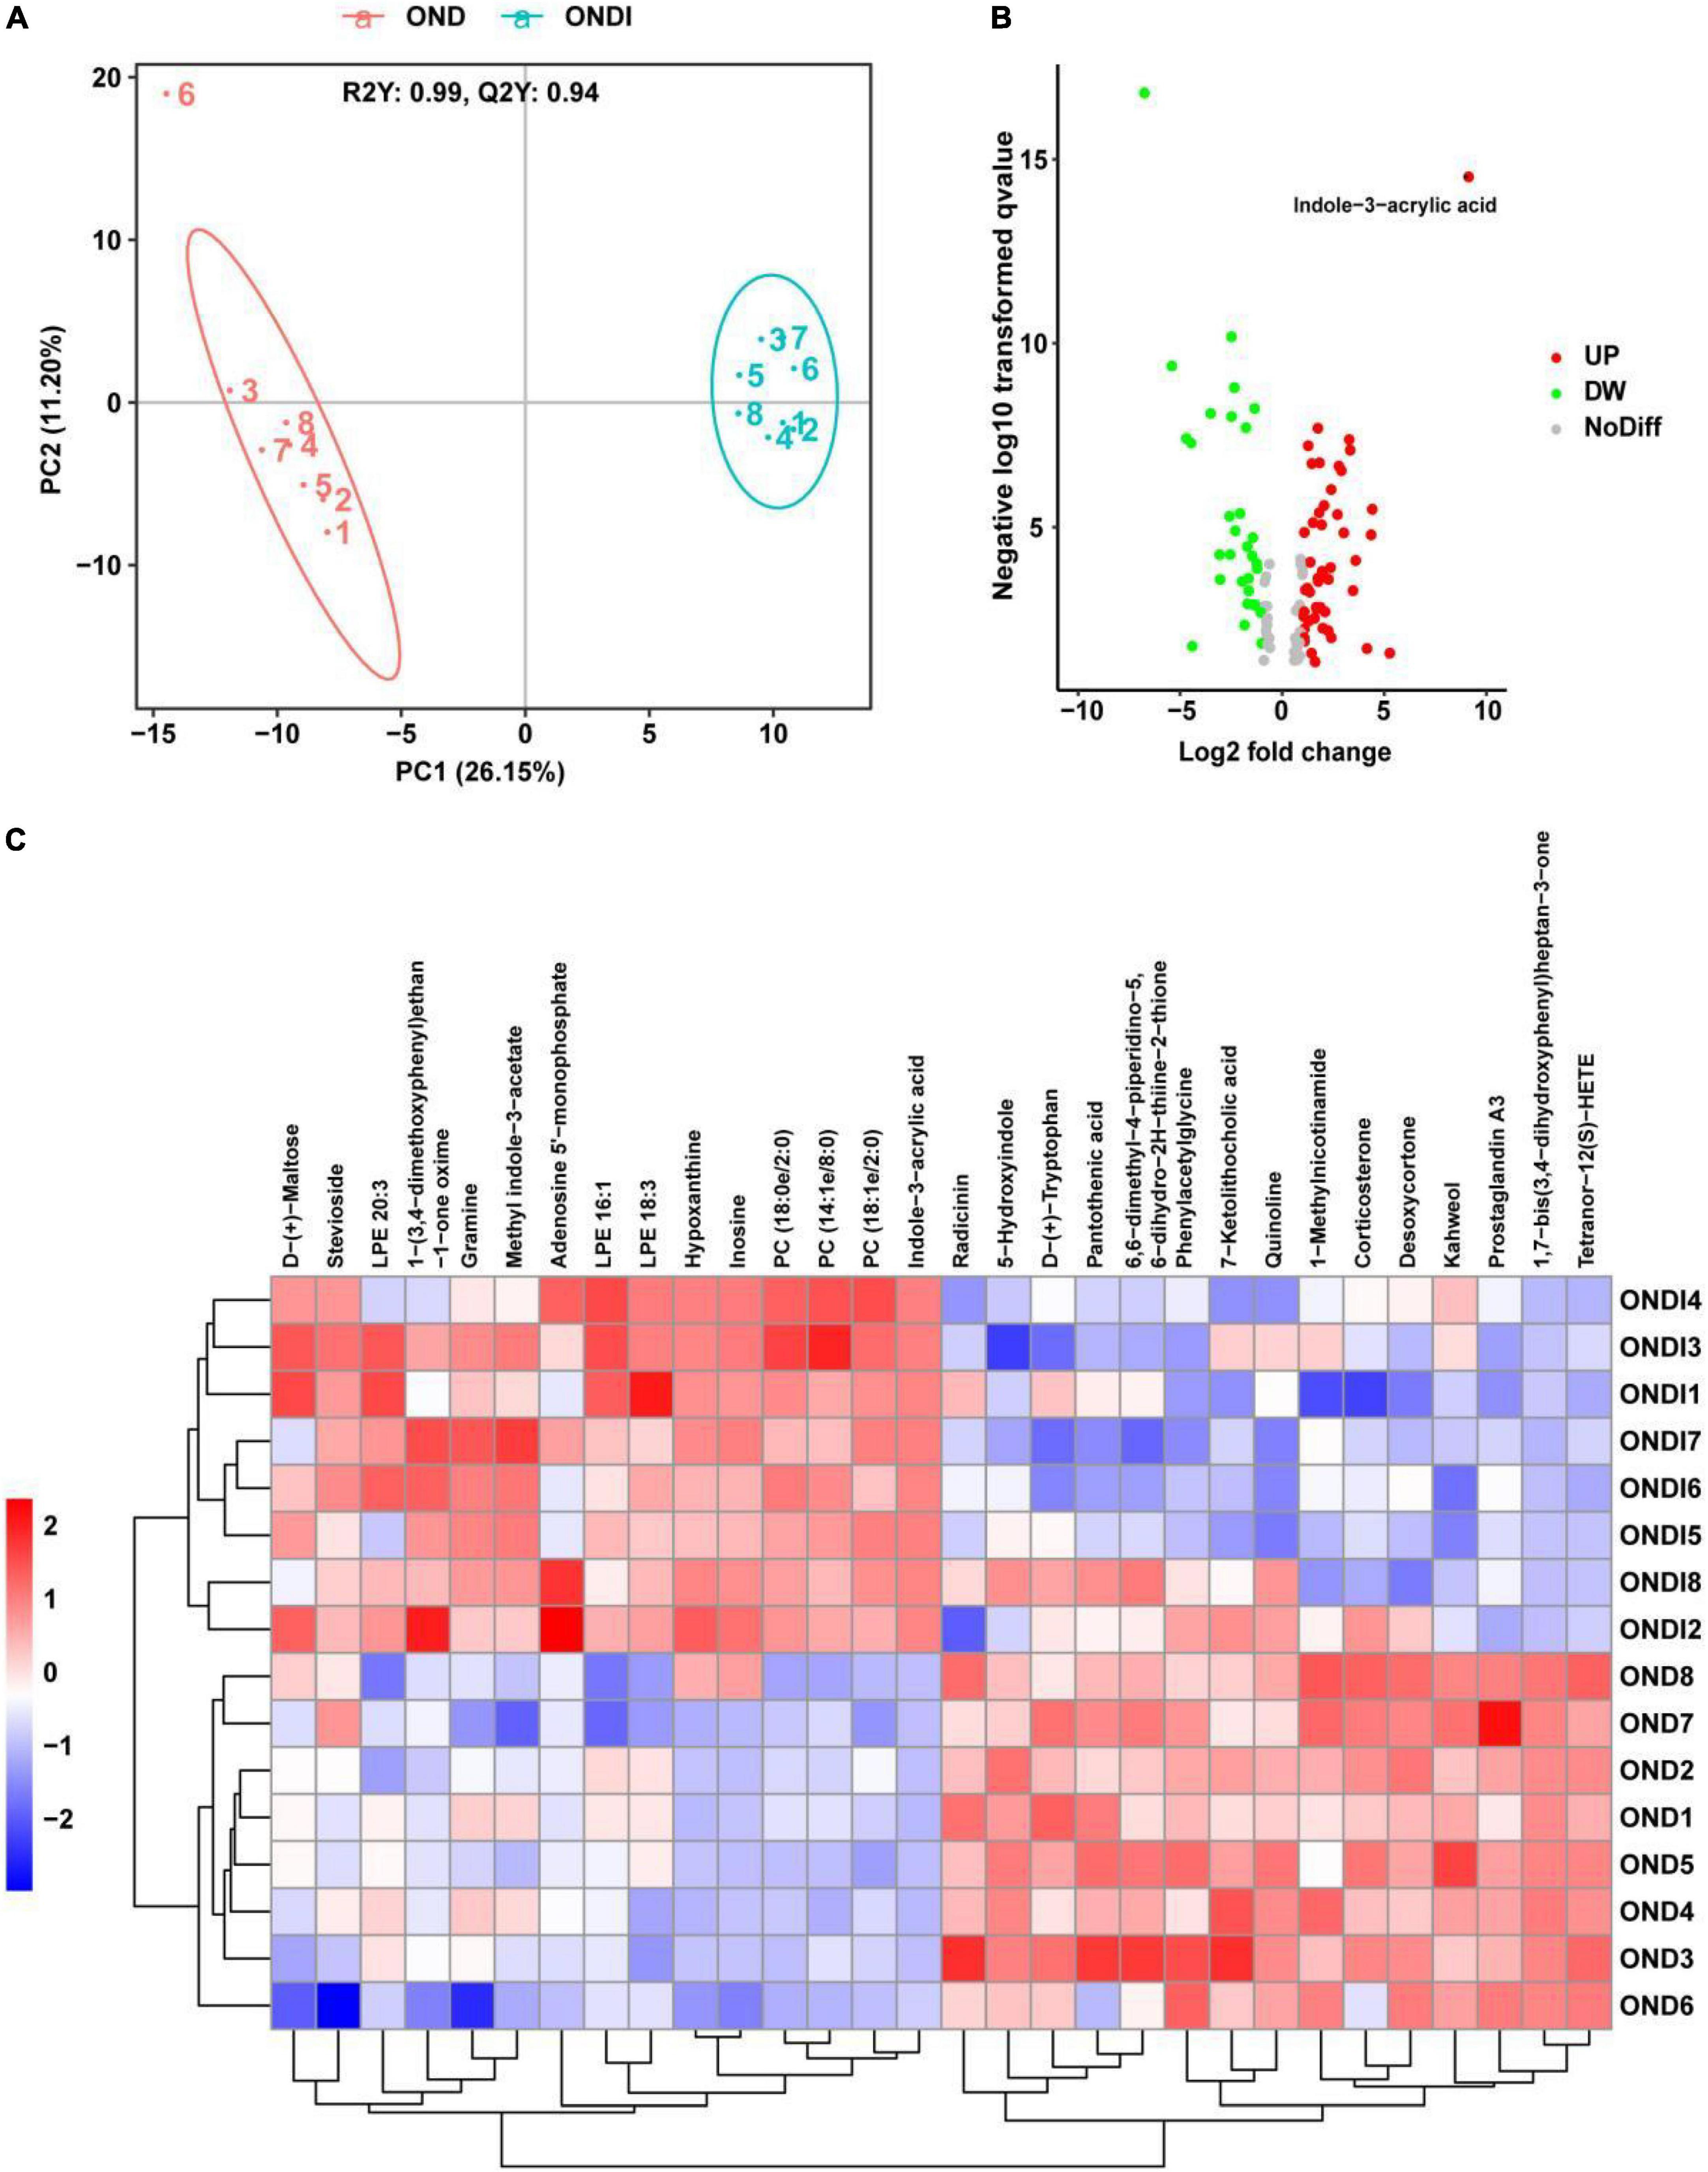
Figure 8. Serum metabolic profiles associated with inulin. (A) PLS-DA score plot showed clustering. (B) The volcano plot showed significant metabolites. (C) The heat map showed the top 30 metabolites clustering.
Correlation analysis and regression analysis
The abundance of Alistipes in the feces of mice on a HFD was significantly reduced, and inulin supplementation after returning to a normal diet significantly increased the abundance of Alistipes. In addition, LEfSe analysis also showed that only the Alistipes appeared to have the most evident response to inulin at the genus level, so we further analyzed the correlation between Alistipes and inulin by Spearman correlation analysis. The abundance of Alistipes was shown to have a strong positive correlation with inulin (r = 0.72, P = 0.002, Figure 9A). Moreover, univariate linear regression analysis of Alistipes relative abundance (y) and inulin intervention (x) showed: y = 0.101x + 0.078 (R2 = 0.525, P = 0.001), indicating that inulin supplementation could significantly increase the relative abundance of Alistipes. Inulin treatment resulted in significant changes in metabolites, suggesting a certain association between metabolites and inulin. We found that the level of indole-3-acrylic acid was shown to have the strongest positive correlation with inulin among all the differential metabolites (r = 0.99, P = 9.2e−13, Figure 9B). Besides, it had a strong positive association with Alistipes (r = 0.72, P = 0.002, Figure 9C) and a strong negative association with body weight (r = −0.72, P = 0.002, Figure 9D). Surprisingly, we found that the level of indole-3-acrylic acid was most significantly increased by more than 500-fold among all differential metabolites after inulin supplementation compared with the NCD group (Figure 9E). Meanwhile, indole-3-acrylic acid with the largest VIP value in PLS-DA had the most obvious response to inulin. The indole-3-acrylic acid belongs to the indoles and is produced by the tryptophan metabolism. In our study, inulin supplementation significantly reduced tryptophan level compared with the OND group (Figure 9F).
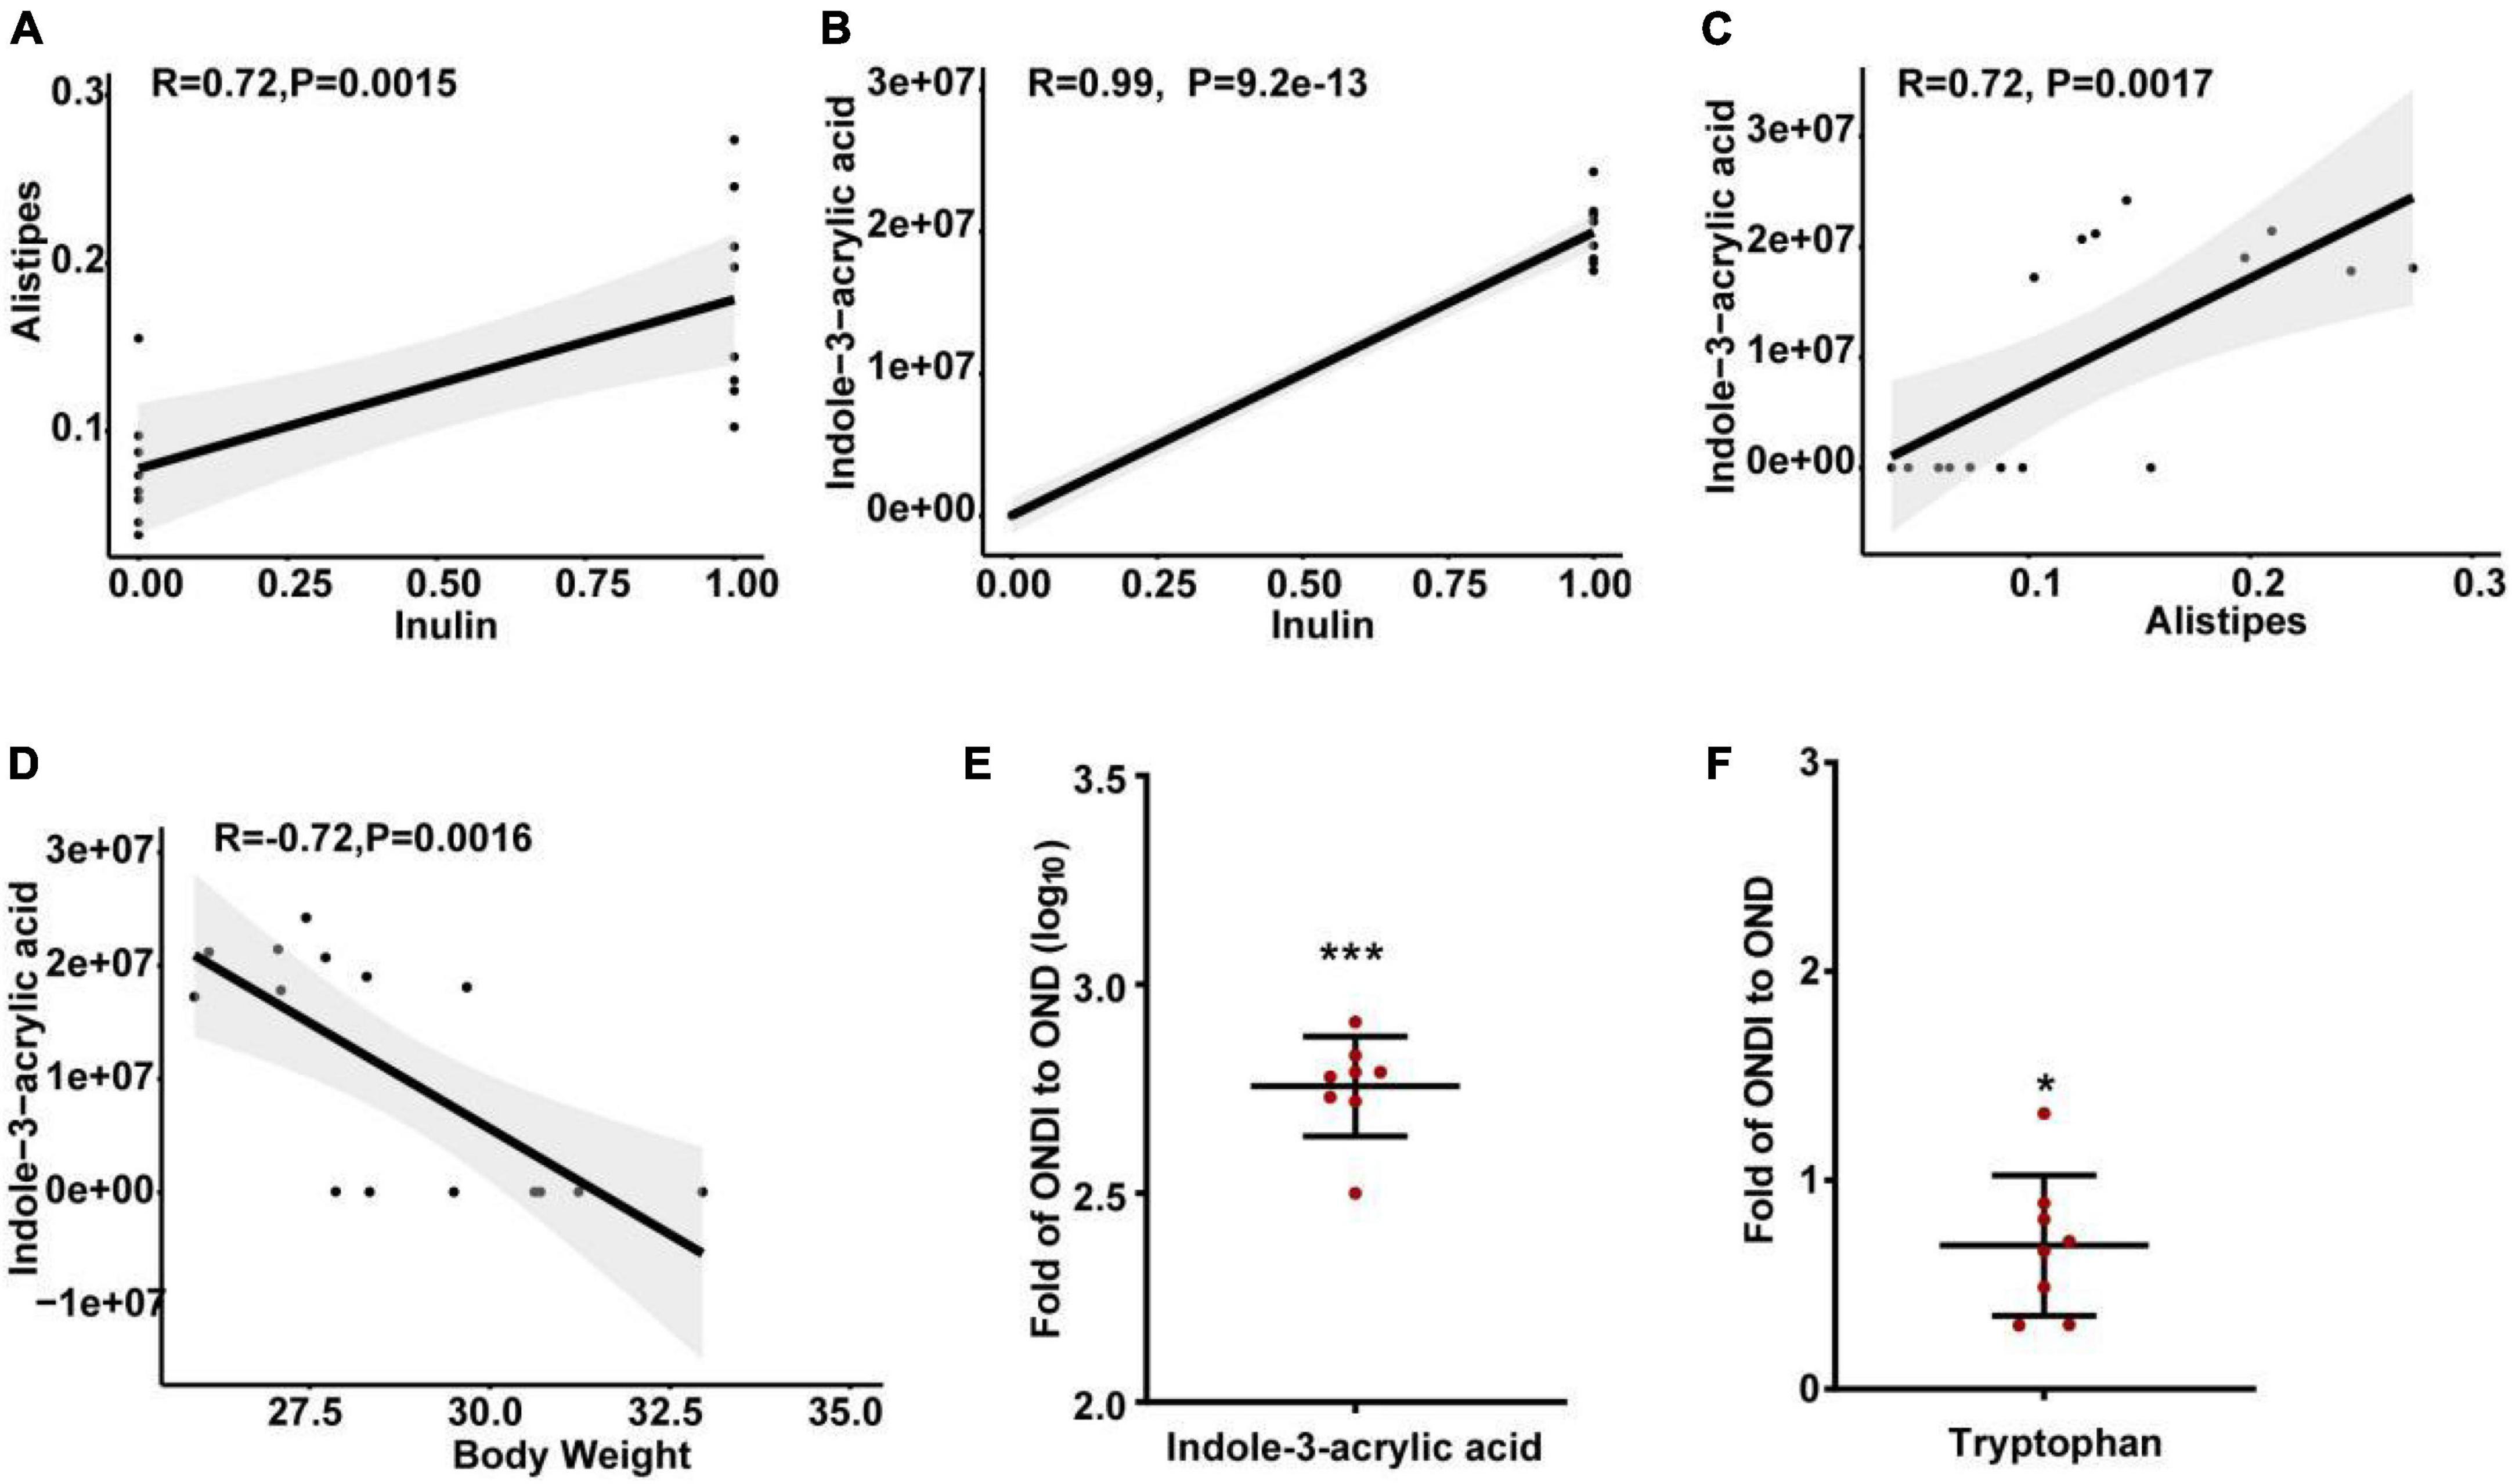
Figure 9. Spearman correlation analysis and changes in key metabolite levels after inulin supplementation. (A) The relationship between Alistipes and inulin; (B) the relationship between indole-3-acrylic acid and inulin; (C) the relationship between indole-3-acrylic acid and Alistipes; (D) the relationship between indole-3-acrylic acid and body weight; (E,F) indole-3-acrylic acid and tryptophan presented as the ratio of the abundance in ONDI mice to those in OND mice. *P < 0.05, ***P < 0.001.
Discussion
Gut microbiota has been considered a key contributing factor in diet-related obesity. In our study, HFD disturbed gut microbiota balance and significantly increased the F/B value. Studies showed that the structure and composition of gut microbiota could be greatly affected by HFD (28), and obese individuals have relatively higher F/B values than normal-weight individuals (29), which is consistent with our findings. Inulin as food for probiotics can improve HFD-induced obesity and related metabolic disorders by modulating gut microbiota (13, 30). When obese mice switched from an HFD to a normal diet for 10 weeks, additional inulin supplementation led to faster weight loss and first return to normal weight compared with the OND group. In addition, the diversity of gut microbiota was reversed after inulin supplementation, the abundance of Alistipes was markedly increased, and the abundance of Ruminococcus and Colidextribacter was significantly decreased compared with the OND group. The Alistipes is a relatively new bacterial genus, mainly isolated from medical clinical samples and highly associated with dysbiosis and disease (31). A systematic review found that Alistipes was a lean-associated genus (32), and the HFD could obviously reduce the abundance of Alistipes (8, 33–36), whose abundance was inversely correlated to adiposity, serum lipids (including low-density lipoprotein, triglyceride, and total cholesterol), and glucose homeostasis parameters (37–39). Notably, the relative abundance of Alistipes in the ONDI group was significantly increased to 17.8%, 2.3 times higher than that of the OND group, and this might be one of the key reasons why inulin promotes rapid weight loss.
The abundance of Ruminococcus in obese individuals was higher than that in lean individuals (10), Ruminococcus bromii and Ruminococcus obeum had a significant correlation with obesity in the Japanese population (40). In our study, the abundance of Ruminococcus in the HFD group was higher than that in the ND group (no statistical difference). In contrast, the abundance of Ruminococcus obviously decreased after inulin treatment compared to the OND group. The Colidextribacter was considered a HFD-dependent taxa, and some functional foods (such as flavonoids from whole grain-oats and partially milled barley) could modulate the perturbation of Colidextribacter in HFD-induced mice (41, 42). Consistent with our findings, mice fed an HFD significantly increased the abundance of Colidextribacter, which was reversed by inulin treatment compared to the OND group. In addition, Alistipes showed a clear negative correlation with Colidextribacter and Ruminococcus, suggesting the significant increase in Alistipes abundance seems to have an inhibitory effect on Colidextribacter and Ruminococcus after inulin supplementation. Furthermore, the LEfSe analysis showed that only Alistipes had a significant biological association with the ONDI group at the genus level. These findings suggest that inulin-accelerated weight loss in obese mice may be associated with the reversal of gut microbiota disturbances, primarily mediated by Alistipes.
On the other hand, inulin supplementation changed the overall serum metabolite profile of obese mice. Inulin is known to mitigate the development of obesity by producing SCFAs, including acetic acid, propionic acid, and butyric acid (12, 14). However, there are still many metabolites that have not been studied. We used non-targeted metabolomics techniques to detect fundamental alterations in the serum metabolite profile after inulin supplementation. According to the screening criteria, a total of 113 differential metabolites were screened. Interestingly, the change in indole-3-acrylic acid level was the most pronounced among all differential metabolites. Its level was significantly increased by more than 500-fold compared with the OND group, and it had the largest VIP value from PLS-DA. Indole-3-acrylic acid is a tryptophan metabolite secreted by gut microbiota (43, 44). A study has shown that tryptophan can be converted to indole pyruvate acid (IPyA) by the aromatic amino acid aminotransferase from Lactobacilli, while IPyA is the critical precursor of indole-3-acrylic acid (44). Indole-3-acrylic acid is closely related to human health. A study has shown that several Peptostreptococcus species could produce the tryptophan metabolite indole-3-acrylic acid, promoting intestinal epithelial barrier function and reducing inflammation. It has a specific therapeutic effect in patients with inflammatory bowel disease (IBD) (43). Metabolites derived from gut microbes (e.g., indole-3-acrylic acid) may attenuate atherosclerosis development in ApoE-deficient rats (45). In addition, the gut microbiota-related metabolite indole-3-acrylic acid was also associated with immune-related diseases (46). There are few studies on the relationship between indole-3-acrylic acid and obesity. In our current study, indole-3-acrylic acid exhibited a strong negative correlation with body weight.
Significant changes in gut microbiota and serum metabolites were observed after 10 weeks of inulin supplementation in obese mice compared to the OND group. Both Alistipes and indole-3-acrylic acid showed a strong positive correlation with inulin. The gut microbiota exerts most of its physiological roles mainly through various metabolites (47–50). A study showed that the gut microbiota tryptophan metabolite indole-3 carboxylic acid could regulate energy expenditure and insulin sensitivity by regulating the expression of miRNA-181 in white fat and thus affect obesity (51). Another study found that alternate-day fasting could change gut microbiota composition in mice, increase the synthesis of acetic acid and lactic acid, and induce browning of white adipose tissue (52). Secondary bile acids, metabolites of gut microbiota, are involved in the regulation of glucose and lipid metabolism, and can also enhance insulin sensitivity and promote fat metabolism, which is closely related to the formation of obesity and diabetes (53, 54). Changes in serum metabolites may be mediated by altered gut microbiota after inulin supplementation. Spearman correlation analysis showed that Alistipes exhibited a strong positive correlation with indole-3-acrylic acid. According to the taxonomic database of the US National Center for Biotechnology Information, the genus Alistipes consists of 13 species, 7 of which can catalyze the production of indole from tryptophan, including Alistipes finegoldii, A. onderdonkii, A. shahii, A. senegalensis, A. timonensis, A. putredinis, and A. inops (31). In our study, the Alistipes were significantly negatively correlated with tryptophan biosynthesis pathway. The level of tryptophan was reduced considerably after inulin supplementation, which may be due to the rapid metabolism of tryptophan by Alistipes to produce a large amount of indole-3-acrylic acid. But further experiments are needed to prove the relationship between Alistipes and indole-3-acrylic and to clarify which species of Alistipes genus produces indole-3-acrylic acid.
Conclusion
In the present study, inulin supplementation reversed the changes in the richness, composition, and diversity of gut microbiota induced by HFD. The abundance of the genus Alistipes and the level of indole-3-acrylic acid were considerably increased in response to inulin supplementation. Both Alistipes and indole-3-acrylic acid were involved in tryptophan metabolism, meanwhile, they were also positively related to inulin supplementation and negatively related to obesity. These findings suggest that inulin accelerates weight loss in obese mice, possibly due partly to increased levels of Alistipes and indole-3-acrylic acid. However, the interrelationship between Alistipes and indole-3-acrylic acid still need further experiments to prove.
Data availability statement
The original contributions presented in this study are publicly available. This data can be found here: http://www.ncbi.nlm.nih.gov/bioproject/877788, accession number: PRJNA877788.
Ethics statement
This animal study was reviewed and approved by the Ethical Committee of Shihezi University (No. A2020-001-01).
Author contributions
ZW and HW: experimental design, data processing, graphical visualization, and manuscript writing and editing. ZW, ZD, YT, ML, KZ, and YZ: project administration, animal experiment and sample collection. All authors contributed to the work presented in this article.
Funding
This work was supported by the program of the Shihezi University (ZZZC202024A and ZZZC201946A).
Conflict of interest
The authors declare that the research was conducted in the absence of any commercial or financial relationships that could be construed as a potential conflict of interest.
Publisher’s note
All claims expressed in this article are solely those of the authors and do not necessarily represent those of their affiliated organizations, or those of the publisher, the editors and the reviewers. Any product that may be evaluated in this article, or claim that may be made by its manufacturer, is not guaranteed or endorsed by the publisher.
Supplementary material
The Supplementary Material for this article can be found online at: https://www.frontiersin.org/articles/10.3389/fnut.2022.980382/full#supplementary-material
Supplementary Figure 1 | The average food consumption in grams of each group per week.
Supplementary Figure 2 | Correlation analysis between characteristic gut microbiota (A–C).
Supplementary Figure 3 | Cladogram generated from LEfSe analysis showing the relationship among taxons (A,B).
Footnotes
References
1. Smith KB, Smith MS. Obesity statistics. Prim Care. (2016) 43:121–35; ix. doi: 10.1016/j.pop.2015.10.001
2. Hill JO. Understanding and addressing the epidemic of obesity: an energy balance perspective. Endocr Rev. (2006) 27:750–61. doi: 10.1210/er.2006-0032
3. Dewulf EM, Cani PD, Neyrinck AM, Possemiers S, Van Holle A, Muccioli GG, et al. Inulin-type fructans with prebiotic properties counteract GPR43 overexpression and PPARgamma-related adipogenesis in the white adipose tissue of high-fat diet-fed mice. J Nutr Biochem. (2011) 22:712–22. doi: 10.1016/j.jnutbio.2010.05.009
4. Moreira Junior RE, de Carvalho LM, Dos Reis DC, Cassali GD, Faria AMC, Maioli TU, et al. Diet-induced obesity leads to alterations in behavior and gut microbiota composition in mice. J Nutr Biochem. (2021) 92:108622. doi: 10.1016/j.jnutbio.2021.108622
5. Hotamisligil GS. Inflammation and metabolic disorders. Nature. (2006) 444:860–7. doi: 10.1038/nature05485
6. Zhao Q, Hou D, Fu Y, Xue Y, Guan X, Shen Q. Adzuki bean alleviates obesity and insulin resistance induced by a high-fat diet and modulates gut microbiota in mice. Nutrients. (2021) 13:3240. doi: 10.3390/nu13093240
7. Kong C, Gao R, Yan X, Huang L, Qin H. Probiotics improve gut microbiota dysbiosis in obese mice fed a high-fat or high-sucrose diet. Nutrition. (2019) 60:175–84. doi: 10.1016/j.nut.2018.10.002
8. Ye J, Zhao Y, Chen X, Zhou H, Yang Y, Zhang X, et al. Pu-erh tea ameliorates obesity and modulates gut microbiota in high fat diet fed mice. Food Res Int. (2021) 144:110360. doi: 10.1016/j.foodres.2021.110360
9. Gao R, Zhu C, Li H, Yin M, Pan C, Huang L, et al. Dysbiosis signatures of gut microbiota along the sequence from healthy, young patients to those with overweight and obesity. Obesity (Silver Spring). (2018) 26:351–61. doi: 10.1002/oby.22088
10. Li J, Chen X, Zhong H, Xie H, Zhang Y, Gu W, et al. Gut microbiome and serum metabolome alterations in obesity and after weight-loss intervention. Nat Med. (2017) 23:859–68. doi: 10.1038/nm.4358
11. Tremaroli V, Backhed F. Functional interactions between the gut microbiota and host metabolism. Nature. (2012) 489:242–9. doi: 10.1038/nature11552
12. van der Beek CM, Canfora EE, Kip AM, Gorissen SHM, Olde Damink SWM, van Eijk HM, et al. The prebiotic inulin improves substrate metabolism and promotes short-chain fatty acid production in overweight to obese men. Metabolism. (2018) 87:25–35. doi: 10.1016/j.metabol.2018.06.009
13. Nicolucci AC, Hume MP, Martinez I, Mayengbam S, Walter J, Reimer RA. Prebiotics reduce body fat and alter intestinal microbiota in children who are overweight or with obesity. Gastroenterology. (2017) 153:711–22. doi: 10.1053/j.gastro.2017.05.055
14. Du H, Zhao A, Wang Q, Yang X, Ren D. Supplementation of inulin with various degree of polymerization ameliorates liver injury and gut microbiota dysbiosis in high fat-fed obese mice. J Agric Food Chem. (2020) 68:779–87. doi: 10.1021/acs.jafc.9b06571
15. Song X, Zhong L, Lyu N, Liu F, Li B, Hao Y, et al. Inulin can alleviate metabolism disorders in ob/ob mice by partially restoring leptin-related pathways mediated by gut microbiota. Genomics Proteomics Bioinformatics. (2019) 17:64–75. doi: 10.1016/j.gpb.2019.03.001
16. Bindels LB, Delzenne NM, Cani PD, Walter J. Towards a more comprehensive concept for prebiotics. Nat Rev Gastroenterol Hepatol. (2015) 12:303–10. doi: 10.1038/nrgastro.2015.47
17. Gibson GR, Hutkins R, Sanders ME, Prescott SL, Reimer RA, Salminen SJ, et al. Expert consensus document: the international scientific association for probiotics and prebiotics (ISAPP) consensus statement on the definition and scope of prebiotics. Nat Rev Gastroenterol Hepatol. (2017) 14:491–502. doi: 10.1038/nrgastro.2017.75
18. Catry E, Bindels LB, Tailleux A, Lestavel S, Neyrinck AM, Goossens JF, et al. Targeting the gut microbiota with inulin-type fructans: preclinical demonstration of a novel approach in the management of endothelial dysfunction. Gut. (2018) 67:271–83. doi: 10.1136/gutjnl-2016-313316
19. Dewulf EM, Cani PD, Claus SP, Fuentes S, Puylaert PG, Neyrinck AM, et al. Insight into the prebiotic concept: lessons from an exploratory, double blind intervention study with inulin-type fructans in obese women. Gut. (2013) 62:1112–21. doi: 10.1136/gutjnl-2012-303304
20. Everard A, Belzer C, Geurts L, Ouwerkerk JP, Druart C, Bindels LB, et al. Cross-talk between Akkermansia muciniphila and intestinal epithelium controls diet-induced obesity. Proc Natl Acad Sci USA. (2013) 110:9066–71. doi: 10.1073/pnas.1219451110
21. Geurts L, Chilloux J, Ottman N, Duparc T, Lichtenstein L, Myridakis A, et al. A purified membrane protein from Akkermansia muciniphila or the pasteurized bacterium improves metabolism in obese and diabetic mice. Nat Med. (2017) 23:107–13. doi: 10.1038/nm.4236
22. Zou J, Chassaing B, Singh V, Pellizzon M, Ricci M, Fythe MD, et al. Fiber-mediated nourishment of gut microbiota protects against diet-induced obesity by restoring IL-22-mediated colonic health. Cell Host Microbe. (2018) 23:41–53.e4. doi: 10.1016/j.chom.2017.11.003
23. Weitkunat K, Stuhlmann C, Postel A, Rumberger S, Fankhanel M, Woting A, et al. Short-chain fatty acids and inulin, but not guar gum, prevent diet-induced obesity and insulin resistance through differential mechanisms in mice. Sci Rep. (2017) 7:6109. doi: 10.1038/s41598-017-06447-x
24. Magoc T, Salzberg SL. FLASH: fast length adjustment of short reads to improve genome assemblies. Bioinformatics. (2011) 27:2957–63. doi: 10.1093/bioinformatics/btr507
25. Bokulich NA, Kaehler BD, Rideout JR, Dillon M, Bolyen E, Knight R, et al. Optimizing taxonomic classification of marker-gene amplicon sequences with QIIME 2’s q2-feature-classifier plugin. Microbiome. (2018) 6:90. doi: 10.1186/s40168-018-0470-z
26. Turnbaugh PJ, Ul-Hasan S, van der Hooft JJJ, Vargas F, Vazquez-Baeza Y, Vogtmann E, et al. Reproducible, interactive, scalable and extensible microbiome data science using QIIME 2. Nat Biotechnol. (2019) 37:852–7. doi: 10.1038/s41587-019-0209-9
27. Dai W, Xie D, Lu M, Li P, Lv H, Yang C, et al. Characterization of white tea metabolome: comparison against green and black tea by a nontargeted metabolomics approach. Food Res Int. (2017) 96:40–5. doi: 10.1016/j.foodres.2017.03.028
28. Moreira Junior RE, de Carvalho LM, Pedersen ASB, Damasceno S, Maioli TU, de Faria AMC, et al. Interaction between high-fat diet and ethanol intake leads to changes on the fecal microbiome. J Nutr Biochem. (2019) 72:108215. doi: 10.1016/j.jnutbio.2019.07.006
29. Ley RE, Turnbaugh PJ, Klein S, Gordon JI. Microbial ecology: human gut microbes associated with obesity. Nature. (2006) 444:1022–3. doi: 10.1038/4441022a
30. Rodriguez J, Hiel S, Neyrinck AM, Le Roy T, Potgens SA, Leyrolle Q, et al. Discovery of the gut microbial signature driving the efficacy of prebiotic intervention in obese patients. Gut. (2020) 69:1975–87. doi: 10.1136/gutjnl-2019-319726
31. Parker BJ, Wearsch PA, Veloo ACM, Rodriguez-Palacios A. The genus Alistipes: gut bacteria with emerging implications to inflammation, cancer, and mental health. Front Immunol. (2020) 11:906. doi: 10.3389/fimmu.2020.00906
32. Guo J, Shao J, Yang Y, Niu X, Liao J, Zhao Q, et al. Gut microbiota in patients with polycystic ovary syndrome: a systematic review. Reprod Sci. (2022) 29:69–83. doi: 10.1007/s43032-020-00430-0
33. Lan Y, Sun Q, Ma Z, Peng J, Zhang M, Wang C, et al. Seabuckthorn polysaccharide ameliorates high-fat diet-induced obesity by gut microbiota-SCFAs-liver axis. Food Funct. (2022) 13:2925–37. doi: 10.1039/d1fo03147c
34. Yin J, Li Y, Han H, Chen S, Gao J, Liu G, et al. Melatonin reprogramming of gut microbiota improves lipid dysmetabolism in high-fat diet-fed mice. J Pineal Res. (2018) 65:e12524. doi: 10.1111/jpi.12524
35. Won SM, Chen S, Lee SY, Lee KE, Park KW, Yoon JH. Lactobacillus sakei ADM14 induces anti-obesity effects and changes in gut microbiome in high-fat diet-induced obese mice. Nutrients. (2020) 12:3703. doi: 10.3390/nu12123703
36. Cai H, Wen Z, Li X, Meng K, Yang P. Lactobacillus plantarum FRT10 alleviated high-fat diet-induced obesity in mice through regulating the PPARalpha signal pathway and gut microbiota. Appl Microbiol Biotechnol. (2020) 104:5959–72. doi: 10.1007/s00253-020-10620-0
37. Garcia-Ribera S, Amat-Bou M, Climent E, Llobet M, Chenoll E, Corripio R, et al. Specific dietary components and gut microbiota composition are associated with obesity in children and adolescents with Prader-Willi syndrome. Nutrients. (2020) 12:1063. doi: 10.3390/nu12041063
38. Yang Z, Zhao X, Liu Y, Wang Y, Sun J, Feng X, et al. Discrepant gut microbiota markers for the classification of obesity-related metabolic abnormalities. Sci Rep. (2019) 9:13424. doi: 10.1038/s41598-019-49462-w
39. Vazquez-Moreno M, Perez-Herrera A, Locia-Morales D, Dizzel S, Meyre D, Stearns JC, et al. Association of gut microbiome with fasting triglycerides, fasting insulin and obesity status in mexican children. Pediatr Obes. (2021) 16:e12748. doi: 10.1111/ijpo.12748
40. Kasai C, Sugimoto K, Moritani I, Tanaka J, Oya Y, Inoue H, et al. Comparison of the gut microbiota composition between obese and non-obese individuals in a Japanese population, as analyzed by terminal restriction fragment length polymorphism and next-generation sequencing. BMC Gastroenterol. (2015) 15:100. doi: 10.1186/s12876-015-0330-2
41. Li S, Wang M, Li C, Meng Q, Meng Y, Ying J, et al. Beneficial effects of partly milled highland barley on the prevention of high-fat diet-induced glycometabolic disorder and the modulation of gut microbiota in mice. Nutrients. (2022) 14:762. doi: 10.3390/nu14040762
42. Yan S, Chen J, Zhu L, Guo T, Qin D, Hu Z, et al. Oryzanol alleviates high fat and cholesterol diet-induced hypercholesterolemia associated with the modulation of the gut microbiota in hamsters. Food Funct. (2022) 13:4486–501. doi: 10.1039/d1fo03464b
43. Kolde R, D’Hennezel E, Annand JW, Heim CE, Krastel P, Schmitt EK, et al. Indoleacrylic acid produced by commensal Peptostreptococcus species suppresses inflammation. Cell Host Microbe. (2017) 22:25–37.e6. doi: 10.1016/j.chom.2017.06.007
44. Gao J, Xu K, Liu H, Liu G, Bai M, Peng C, et al. Impact of the gut microbiota on intestinal immunity mediated by tryptophan metabolism. Front Cell Infect Microbiol. (2018) 8:13. doi: 10.3389/fcimb.2018.00013
45. Chuang HL, Chiu CC, Lo C, Hsu CC, Liu JY, Hung SW, et al. Circulating gut microbiota-related metabolites influence endothelium plaque lesion formation in ApoE knockout rats. PLoS One. (2022) 17:e0264934. doi: 10.1371/journal.pone.0264934
46. Lin J, Sun-Waterhouse D, Cui C. The therapeutic potential of diet .on immune-related diseases: based on the regulation on tryptophan metabolism. Crit Rev Food Sci Nutr. (2021) 12:1–19. doi: 10.1080/10408398.2021.1934813
47. Mollica MP, Mattace Raso G, Cavaliere G, Trinchese G, De Filippo C, Aceto S, et al. Butyrate regulates liver mitochondrial function, efficiency, and dynamics in insulin-resistant obese mice. Diabetes. (2017) 66:1405–18. doi: 10.2337/db16-0924
48. Markowiak-Kopec P, Slizewska K. The effect of probiotics on the production of short-chain fatty acids by human intestinal microbiome. Nutrients. (2020) 12:1107. doi: 10.3390/nu12041107
49. Nicholson JK, Holmes E, Kinross J, Burcelin R, Gibson G, Jia W, et al. Host-gut microbiota metabolic interactions. Science. (2012) 336:1262–7.
50. Costello EK, Lauber CL, Hamady M, Fierer N, Gordon JI, Knight R. Bacterial community variation in human body habitats across space and time. Science. (2009) 326:1694–7. doi: 10.1126/science.1177486
51. Virtue AT, McCright SJ, Wright JM, Jimenez MT, Mowel WK, Kotzin JJ, et al. The gut microbiota regulates white adipose tissue inflammation and obesity via a family of microRNAs. Sci Transl Med. (2019) 11:eaav1892. doi: 10.1126/scitranslmed.aav1892
52. Li G, Xie C, Lu S, Nichols RG, Tian Y, Li L, et al. Intermittent fasting promotes white adipose browning and decreases obesity by shaping the gut microbiota. Cell Metab. (2017) 26:672–685.e4. doi: 10.1016/j.cmet.2017.08.019
53. Schoeler M, Caesar R. Dietary lipids, gut microbiota and lipid metabolism. Rev Endocr Metab Disord. (2019) 20:461–72. doi: 10.1007/s11154-019-09512-0
Keywords: obesity, inulin, gut microbiota, Alistipes, indole-3-acrylic acid
Citation: Wu Z, Du Z, Tian Y, Liu M, Zhu K, Zhao Y and Wang H (2022) Inulin accelerates weight loss in obese mice by regulating gut microbiota and serum metabolites. Front. Nutr. 9:980382. doi: 10.3389/fnut.2022.980382
Received: 28 June 2022; Accepted: 24 August 2022;
Published: 28 September 2022.
Edited by:
Ying Yang, Yunnan University, ChinaReviewed by:
Francesco Suriano, University of Gothenburg, SwedenYadong Zhong, Nanchang University, China
Copyright © 2022 Wu, Du, Tian, Liu, Zhu, Zhao and Wang. This is an open-access article distributed under the terms of the Creative Commons Attribution License (CC BY). The use, distribution or reproduction in other forums is permitted, provided the original author(s) and the copyright owner(s) are credited and that the original publication in this journal is cited, in accordance with accepted academic practice. No use, distribution or reproduction is permitted which does not comply with these terms.
*Correspondence: Haixia Wang, d2FuZ2hhaXhpYXd6YUAxNjMuY29t
†These authors have contributed equally to this work
 Zeang Wu
 Zhenzhu Du2†